stqa practical
DESCRIPTION
software testing and quality assuranceTRANSCRIPT

PRACTICAL 1
Study of a Software Testing tool (CTC++)
INTRODUCTION
Testwell CTC++ is a powerful instrumentation-based code coverage and dynamic analysis tool for C and C++ code. As a code coverage tool, CTC++ shows the coverage all the way to the Modified Condition/Decision Coverage (MC/DC) level as required by DO-178B projects. As a dynamic analysis tool, CTC++ shows the execution counters in the code, i.e. more than plain boolean coverage information. You can also use CTC++ to measure function execution costs (normally time) and to enable function entry/exit tracing at test time.
CTC++ is easy to use. When used in command-line mode (by makefiles or other build scripts), the instrumentation is just a front end phase at the compile/link command. No changes to the source files or build scripts are needed. Test runs are done with the instrumented program version, in the same way as with the original program. Coverage and other execution profiling reports can be obtained easily in straight text, HTML, XML and Excel input form. On some environments, e.g. Microsoft Visual Studio, CTC++ use is possible directly from the compiler IDE.
CTC++'s overhead on the size and execution speed of the instrumented code is very reasonable. CTC++'s reporting is informative and well-organised. The reports give both a top-level view, which show the coverage percentages at various summary levels, and a detailed view, where the executed/not executed information is mapped to the actual source code locations.
Commercially CTC++ is available as follows:
"CTC++ host-only": This is the basic package of the tool, so called "host-only". It is available Windows, Linux, Solaris and HP-UX. The tool utilities are run at the selected host environment. The used C/C++ compiler is one of the supported compilers that generate code for the selected host environment. The tests with the instrumented code are run at the same host environment.
"CTC++ with Host-Target add-on": This contains the basic CTC++ host-only on the selected host environment and Host-Target add-on package (HOTA). HOTA gives certain additional components, which facilitate cross-compiling the instrumented code for a target, running tests at the target, getting the coverage data back to the host, and viewing the coverage reports at the host. The cross-compiler can effectively be "whatever" (except it needs to run at the host where the basic CTC++ runs). The target machine architecture and its operating system (if any) can be effectively "whatever".
"CTC++ with Host-Target add-on and Bitcov add-on": This is like "CTC++ with Host-Target add-on" but contains additionally the Bitcov add-on package (Bitcov). BItcov is a variant of HOTA, and facilitates CTC++ use in targets, which have very limited memory. The Bitcov add-on package is developed by Verifysoft Technology.
Page | 1

Additionally there are separate add-on packages supporting C# and Java code. From CTC++ point of view C# and Java are seen as special dialects of C++, and with certain arrangements CTC++ instrumentation is connected to the C#/Java compilation phase, similarly as when instrumenting and compiling C/C++ code. The C#/Java run-time context is modelled as a special type of target for which the CTC++ support library has been implemented of the HOTA components, i.e. rewritten in C#/Java. The net result is that CTC++ gives of C#/Java code similar coverage and dynamic analysis information as here described for C/C++ code. The C# and Java add-on packages are developed by Verifysoft Technology.
CTC++ is an industry-strength tool, which has been used over 20 years in the IT industry.
CTC++ FACILITIES
Measuring code coverage = > ensure thorough testing, you know when to stop testing, etc.
o Function coverage (instrumentation mode: functions called) o Decision coverage (instrumentation mode: additionally to function coverage,
conditional expressions true and false in program branches, case branches in switch statements, catch exception handlers in C++, control transfers)
o Statement coverage (analyzed from program flow: percent of statements executed in functions/files/overall)
o Multicondition coverage (instrumentation mode: additionally to decision coverage, in program branches have all the possible ways to evaluate a conditional expressions having && and || operators been exercised)
o MC/DC coverage (like multicondition coverage, but it suffices that each elementary condition is shown to independently affect the conditional expression outcome--not so demanding than full multicondition coverage)
o Condition coverage (like multicondition coverage, but it suffices that each elementary condition is shown to have been evaluated to true and false--not so demanding than full multicondition coverage)
Searching execution bottlenecks => no more guessing in algorithm tunings o Function execution timing (instrumentation mode: total, average, maximum
time--if needed, the user may introduce his own time-taking function for measuring whatever is interesting in regard of function resource consumption)
o Execution counters (how many times the CTC++ instrumentation probes have been executed)
Displaying function call trace => helps in analyzing program behavioro You can provide the function, which makes the call tracing (perhaps
displaying on the screen). At instrumentation phase CTC++ is made to call your trace function at the entry/exit of each function under test.
Conveniently presented test results o Hierarchical, color-coded, HTML-browsable coverage reports o Pure textual reports o Coverage data can be converted to Excel input file o XML report
Page | 2

Ease of use o Instrumentation phase as a "front end" to the compilation command => very
simple to use o No changes are needed to the C/C++ source files to be measured o "Ctc-builds" can be done with your existing build makefiles, which normally
can be used as is o automated script-based use from command line
Mature product o Has been in demanding use in the IT industry for over 20 years o Long use experience with the most commonly used C/C++ compilers (VC++,
gcc/g++,...) and with their versions. Many of them have their "extreme corner specialities", but which the tool can handle.
o Also a proven record of working with numerous (~30+) cross-compilers o Full C and C++ support, including the new C++11 additions (lambda functions,
trailing return type, range-based loop, etc.) Usable "in the large"
o Instrumentation overhead very reasonable o You can select what source files to instrument and with what instrumentation
options o Besides full executables, static and dynamically loaded
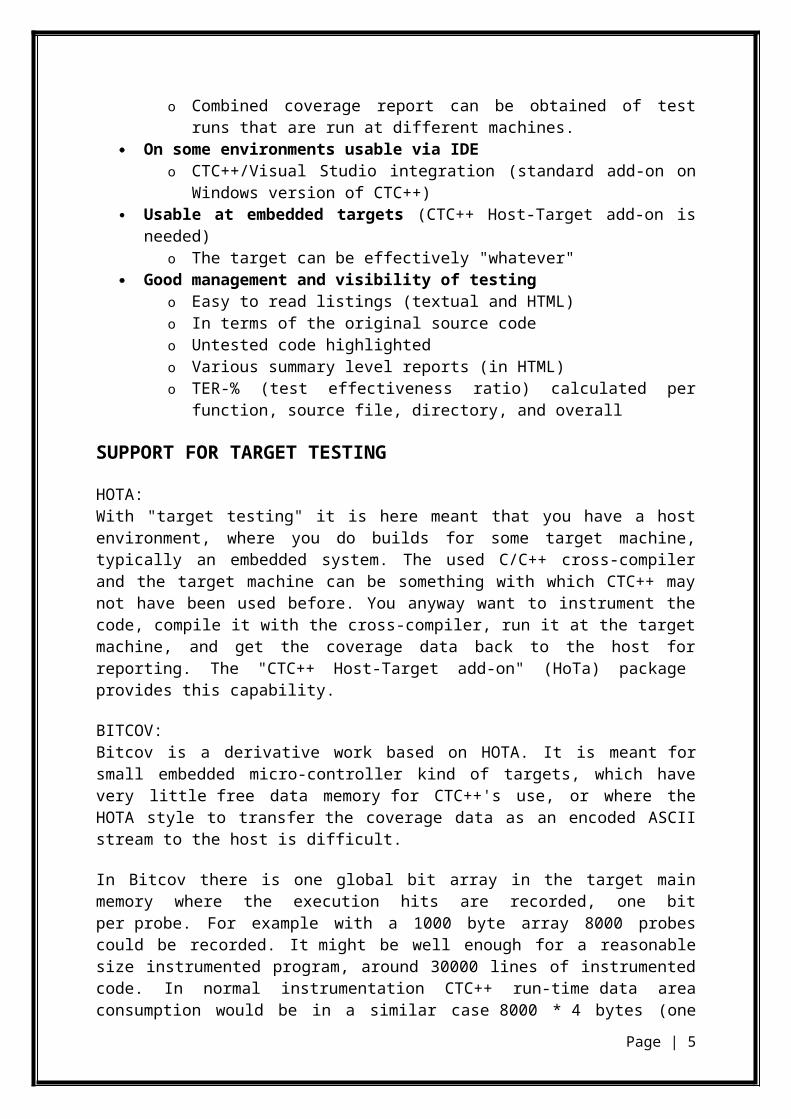
libraries (.lib/.a/.dll/.so) can also be measured o Capturing coverage data of never-ending processes is conveniently supported o Combined coverage report can be obtained of test runs of different programs
and there are powerful means to select the source files that will be reported and in what coverage view they will be reported.
o Combined coverage report can be obtained of test runs that are run at different machines.
On some environments usable via IDE o CTC++/Visual Studio integration (standard add-on on Windows version of
CTC++) Usable at embedded targets (CTC++ Host-Target add-on is needed)
o The target can be effectively "whatever" Good management and visibility of testing
o Easy to read listings (textual and HTML) o In terms of the original source code o Untested code highlighted o Various summary level reports (in HTML) o TER-% (test effectiveness ratio) calculated per function, source file, directory,
and overall
SUPPORT FOR TARGET TESTING
HOTA:With "target testing" it is here meant that you have a host environment, where you do builds for some target machine, typically an embedded system. The used C/C++ cross-
Page | 3

compiler and the target machine can be something with which CTC++ may not have been used before. You anyway want to instrument the code, compile it with the cross-compiler, run it at the target machine, and get the coverage data back to the host for reporting. The "CTC++ Host-Target add-on" (HoTa) package provides this capability.
BITCOV: Bitcov is a derivative work based on HOTA. It is meant for small embedded micro-controller kind of targets, which have very little free data memory for CTC++'s use, or where the HOTA style to transfer the coverage data as an encoded ASCII stream to the host is difficult.
In Bitcov there is one global bit array in the target main memory where the execution hits are recorded, one bit per probe. For example with a 1000 byte array 8000 probes could be recorded. It might be well enough for a reasonable size instrumented program, around 30000 lines of instrumented code. In normal instrumentation CTC++ run-time data area consumption would be in a similar case 8000 * 4 bytes (one counter is normally 4 bytes) = 32000 bytes + something more for CTC++'s internal control data needs. At the target there essentially is no CTC++ run-time layer at all.
After the test run the bit array is captured to the host to a file, either so that the initiative is at the host who pulls the coverage data (e.g. by debugger means) from the target, or so that the initiative is at the target side who pushes the coverage data to the host (as it is possible at the target, e.g. embedded in the instrumented code). At the host the coverage data is converted to a form, which is suitable to the HOTA tool chain for further processing (ctc2dat, ctcpost, ctc2html).
SUMMARY OF BENEFITS
CTC++ is a versatile tool to be used in testing and tuning of all kinds of applications written in C or C++. Testing becomes more efficient
The execution profile listing reveals the parts of code which have not yet been executed. The coverage information helps to design the missing test cases. On the other hand, CTC++ helps to determine when to stop testing (from code coverage point of view), thus preventing the waste of the costly human resources.
Testing becomes a measurable, well-managed activityThe summary listing with TER-% histograms characterizing the reached test coverage gives valuable information for project management purposes at a glance.
Usable for program dynamic analysis and performance tuningWhen CTC++ is used for improving the performance of a program, it can easily show where the bottlenecks of the program are (functions that are executed most often and functions that consume most time). Also production level applications can be monitored when they are used in their real environment. The function call tracing capability can be very useful in analysing the program behaviour.
Use of CTC++ is easy and fastCTC++ is easy to use. No modifications of the user's code is needed. Instrumentation takes place by just adding 'ctc' in front of the compilation/link command. Enforcing the existing makefiles to build instrumented targets instead of the original non-
Page | 4
instrumented ones is very straightforward. This does not need any changes to the makefiles itself [especially this is true in Unixes, where the ctcwrap utility can be used]. Browsing the coverage results in HTML is very easy. The overall picture is shown in color-coded histograms of coverage percentages. Zooming to the detailed level can be be done with only a few mouse clicks and the untested code locations are clearly shown mapped to the original source code.
Independent instrumentation of source fileThe source files of the executable program are instrumented independently of each other, or left as non-instrumented. The source files can be instrumented with such instrumentation modes that are appropriate in the situation at hand. Instrumented source files can be linked to different executables and yet the merged coverage of their executions in different executables can be obtained.
ConfigurabilityCTC++ is easy to configure for specific needs by simply editing the textual configuration file. At the time instrumentation and getting the reports there are powerful means to fine-tune the process to obtain the desired result.
Usable for many purposesCTC++ can be used for many purposes: measuring code coverage at various testing phases (module testing, integration testing, system testing), performance testing, optimization, comparing efficiency of algorithms, locating dead code.
Support for host-target and kernel code testingCTC++ has powerful support for measuring code coverage at embedded targets. The instrumentation overhead is very moderate. The used C/C++ cross-compiler for the target, the target operating system and the target hardware type can be virtually of any brand and type. Applying on kernel code is something unique among coverage tools.
Supports both C and C++With one CTC++ tool you can work both with C and C++ code.
Work motivationThe programmers/testers are likely to design more and better test cases to achieve higher test coverage when they have an easy-to-use tool for measuring it.
Usable with CTA++CTC++ can be used together with Testwell's test harnessing tools CTA++ (C++ Test Aider). Such usage combines the "black box" (behavioral, functional) and "white box" (structural) testing strategies for purposes of systematic module testing and reducing of testing costs.
Usable with other vendors' test execution frameworksCTC++ can be seamlessly used with other vendors' unit test and system (GUI) test execution frameworks.
CTC++ has been compared to US Army Jeep.Simple to use. Works. Can be driven on almost whatever terrain (especially when Host-Target add-on package is used).
OPERATING ENVIRONMENTS
CTC++ is available on several machine / operating system / C/C++ compiler environments.
Page | 5

The resource requirements of your normal C or C++ development environment are sufficient for using the CTC++.
Page | 6

PRACTICAL 2
Study of a Software Quality Assurance tool (XML Schema Validator)
XML Schema
XML Schema is an XML-based alternative to DTD.An XML schema describes the structure of an XML document.The XML Schema language is also referred to as XML Schema Definition (XSD).The purpose of an XML Schema is to define the legal building blocks of an XML document, just like a DTD.
An XML Schema:
defines elements that can appear in a document defines attributes that can appear in a document defines which elements are child elements defines the order of child elements defines the number of child elements defines whether an element is empty or can include text defines data types for elements and attributes defines default and fixed values for elements and attributes
XML Schema Validator
The XML schema validation service lets you validate XML documents such as XHTML against the appropriate schemas. It performs a more accurate validation than the W3C validator.
XML schemas can be validated in various ways. Many types of XML schema validators are available. Mainly two of them are covered here.
(A) First schema validator service does not perform generic XML Schema validation. While it can verify the well-formedness of any XML document, validation is only available with the built-in schemas. This validator does not download any DTD or schema files, but relies on its own ones. You can validate XML documents by URL, by file upload or by direct input. Furthermore, you can validate fragments of XML documents. You can easily validate the page that is currently displayed in your browser with this bookmarklet.
Requirements
This validator checks for namespace-well-formedness and namespace-validity, so e.g. <span id='foo:bar'> throws an error.
Supported content types are application/xhtml+xml, application/xml and text/html. This validator does not accept text/xml due to its silly treatment of character encoding. It does not accept application/x-httpd-php either, so if you receive a message such as The response code was '406 Not Acceptable', please fix your server.
Page | 7

Known problems
Line breaks in end-tags might cause problems. While the validation is accurate, you might see improper source code lines in error messages.
There are some inconsistencies in the XHTML 1.0 specification. For instance, it is unclear whether the form element is allowed to carry a name attribute.
XML 1.1 is not supported. (XHTML 1.1 is supported, of course.)
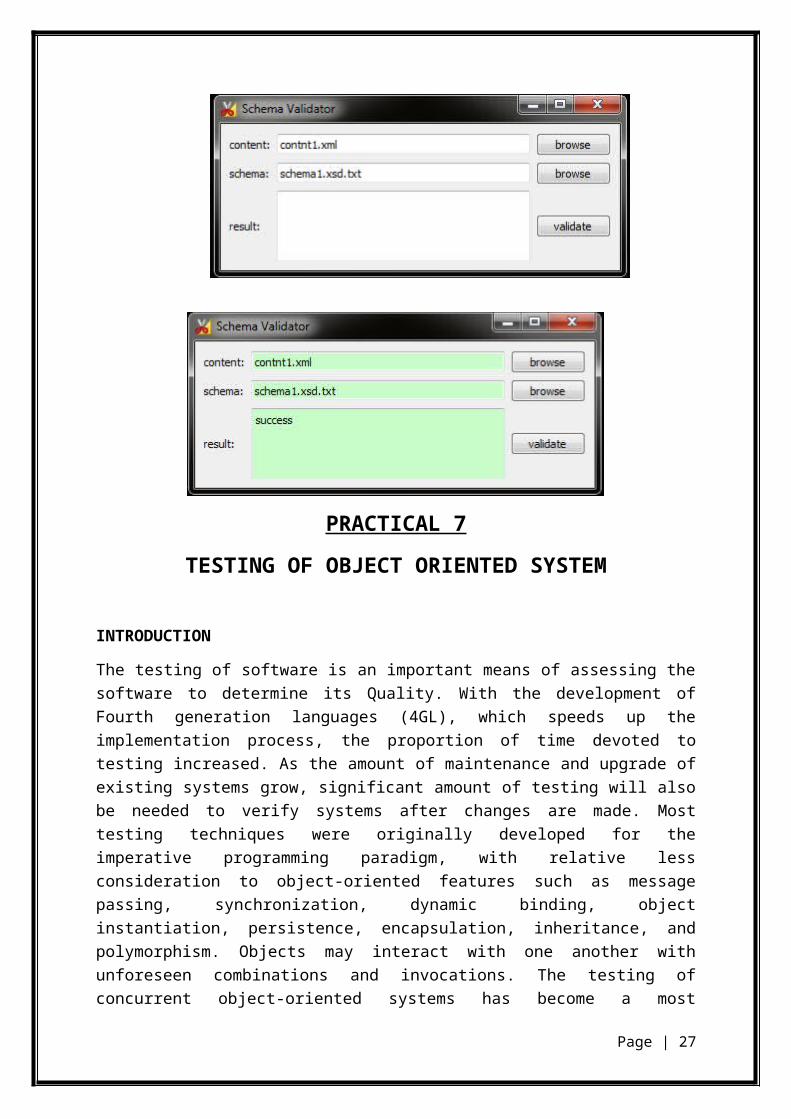
(B) Next schema validator is a software tool that takes as input two files, one is the content file i.e., the xml file and other is the schema file that is .xsd file of that xml. If both the files are matched, it gives the output as success; else the output is an error.
Schema Validator is a small, easy to use, handy application, designed to help you validate XML files against XML Schema files with just a few clicks.Basically all that you have to do is select the content, the schema, and press the Validate button. This app will take care of the rest.So, if you work a lot with XML files and need to validate thoseagainst XML schemas then try this tool and check if its options are enough to satisfy your needs.This will take a single schema plus an instance document and list any errors found whilst validating the document against the schema.An attempt will be made to fetch any referenced schema from the Internet if the supplied schema is not sufficient for validation.
Page | 8
PRACTICAL 3
WAP to implement White Box Testing
TESTING OF PRIME NUMBER PROGRAM
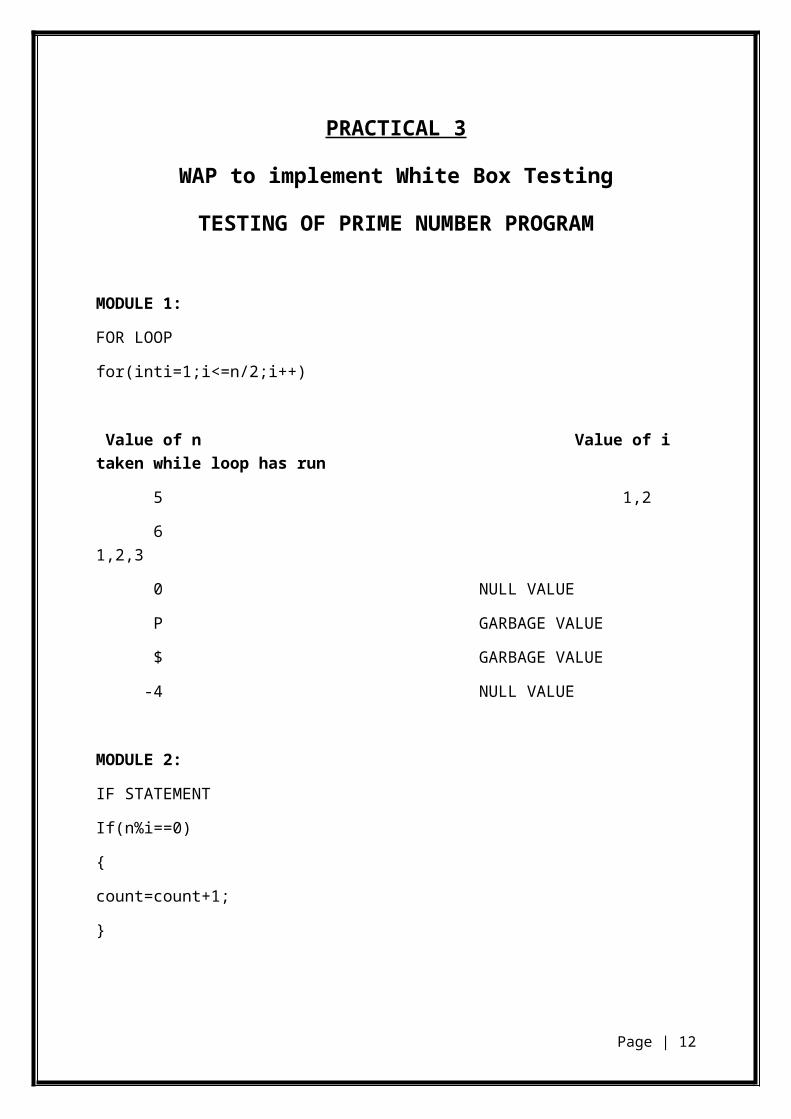
MODULE 1:
FOR LOOP
for(inti=1;i<=n/2;i++)
Value of n Value of i taken while loop has run
5 1,2
6 1,2,3
0 NULL VALUE
P GARBAGE VALUE
$ GARBAGE VALUE
-4 NULL VALUE
MODULE 2:
IF STATEMENT
If(n%i==0)
{
count=count+1;
}
Value of i Value of n Value of Count
1 5 1
2 7 0
1 w 1
Page | 9

2 & 1
1 0 1
2 -4 1
2 -9 0
MOUDULE 3
IF STATEMENT
if(count==1)
{
cout<<”It is a prime no.”;
}
else
{
cout<<”It is not a prime no.”;
}
Value of Count Output
1 It is a prime no
5 It is not a prime no
P It is not a prime no
% It is not a prime no
0 It is not a prime no
-77 It is not a prime no
Page | 10

PRACTICAL 4
WAP to implement Black Box Testing
Code to test:
/* A C program to output the factorial of a number. It inputs a single integer (n) and gives
an integer(factorial) as its output. */
1. #include<stdio.h>
2. int main() {3. intn,i;4. unsignedlongint factorial=1;5. printf("\n Enter the number for factorial");6. scanf("%d",&n);7. if(n<0)
{8. printf("Invalid value!");9. return1;
}10. else
{11. for(i=n;i>0;i--)
{12. factorial*=i;
}}
13. printf("\nFactorial: %d",factorial);14. return0;
}
Black box testing is a software testing techniques in which functionality of the software under test (SUT) is tested without looking at the internal code structure, implementation details and knowledge of internal paths of the software. This type of testing is based entirely on the software requirements and specifications. In Black Box Testing we just focus on inputs and output of the software system without bothering about internal knowledge of the software program.
Input (n) Expected Output Actual Output Correct?
Page | 11
0 1 1 Yes
1 1 1 Yes
-1 Error Error Yes
-32767 Invalid Invalid Yes
32768 327678! 0 No
32767 327677! 0 No
20 2.432902x10¹⁸ -2102132736 No
15 1.307674x10¹² 2004310016 No
12 4.790016x10⁸ 479001600 Yes
13 6.227021x10⁹ 1932053504 No
Conclusion:
The program gives correct output for typical input i.e. for general inputs expected for the program. However, for high inputs the program does not give the correct output. The program seems to display correct output for numbers less than 13 only (including negative inputs).
Page | 12

PRACTICAL 5
Use of a Software Testing Tool (CTC++)
There are basically three steps in the use of CTC++ (command-line mode of use):
You use the CTC++ Pre-processor (ctc) utility for instrumenting and compiling the C or C++ source files of interest and for linking the instrumented program with the CTC++ run-time library. At this phase ctc maintains a symbol file, MON.sym by default, where it remembers the names of the instrumented files and what they contained. If you build your program by a makefile, you just prepend the make command by ctcwrapctc-options , and all the emitted compile and link commands that the make emits will be done "in ctc control".
You execute the test runs with the instrumented program as you see necessary. When the instrumented code portions are executed, CTC++ collects the coverage and function timing history in memory. Normally at the end of the program, and automatically by CTC++, the collected counters are written to a data file, MON.dat by default. If there was previous counters in the data file, they are summed up.
You use the CTC++ Postprocessor (ctcpost) utility for putting one or more symbol files and data files together and produce the human readable textual reports. One of them, the Execution Profile Listing, can be further processed with ctc2html utility for getting an easy-to-view hierarchical and color-coded HTML representation of the coverage information. You can obtain the coverage information also in XML and Excel form.
Building the Instrumented Program
Use of ctc is connected to the command by which you compile and link your programs. Adding 'ctc' and possible 'ctc-options' in front of the original compilation command is all that is needed for instrumenting and compiling the source file. If the command also links, ctc automatically adds the CTC++ run-time library to the linkage. The ctc on-line help is:
Usage:ctc [ctc-options] comp/link-command comp/link-options-and-files
[ctc-options]: [-i {f|d|m|te|ti}...] [-n symbolfile] [-v] [-V] [-k] [-h] [@optionsfile]... [-c conf-file[;conf-file]...]... [-C conf-param{=value|+value}]... [-2comp] [-no-comp] [-no-templates] [-no-warnings]
On Windows with these actual source files with Visual C++ compiler in command-line mode we could give command:
ctc -imte cl -Feprime.exe calc.cio.cprime.c
Page | 13

which instruments these three C files with multi-condition and (exclusive) timing instrumentation modes, compiles the instrumented code with the 'cl' compiler, and links the instrumented target 'prime.exe' with 'cl' (the CTC++ run-time library is automatically added to the linkage). The same could have been obtained also with the following sequence of commands:
ctc -imte cl -c calc.cctc -imte cl -c io.cctc -imte cl -c prime.cctc link -out:prime.exe calc.obj io.obj prime.obj
The first three commands instrument their argument source file. ctc also invokes the compiler on the instrumented version of the source file resulting an object file to the same place as the original compilation would have generated it. No changes to the source file is needed by the user and it remains intact.
In the last command ctc just repeats the linking command and adds CTC++ run-time library to it. The result is an instrumented executable in the same place as the original linking would have generated it.
Normally real programs are not built by explicitly issuing compile and link commands. Instead they are built by a makefile, for example as follows
nmake -f Makefile
which uses its own ruling to emit the elementary compile and link commands. In this case the Makefile can be modified to emit the compile and link commands prefixed with ctc, for example
nmake -f Makefile "CC=ctc -imte cl" "LNK=ctc link"
Or a simpler way is to use ctcwrap command to make the "build" to be a "ctc-build", as follows:
ctcwrap -imtenmake -f Makefile
The ctcwrap command executes its argument command (here 'nmake') in a special context. In it all compile and link commands are changed to behave "ctc-wise" with the given instrumentation options (here with '-imte'), i.e. they are run as if they would have'ctc -imte' in front of them. The net effect is that the building is "with CTC++". The makefiles do not need modifications for the sake of using with CTC++. There are means to specify to CTC++ which files only will be instrumented of all the files that the makefile compiles.
Running the Tests with the Instrumented Program
Page | 14

You run the tests with the instrumented program. Due to instrumentation it is somewhat bigger and slower than originally. How much? It depends on what kind program control structures you have in your code, what instrumentation mode you have selected, what compiler optimization has been used, and have you instrumented all code files of your program. Increase to program size is normally a concern only in some embedded target cases, which have limited memory. When the largest multi-condition instrumentation mode is used, a size increase of 50-70% could result on the instrumented code portions. But note that normally the programs have also non-instrumented portions like system libraries that are linked to it. Lower instrumentation gives lower overhead. In the Windows example Cube.exe case, which contains many system libraries and where the CTC++ run-time library is in a separate DLL the actual program size grew only with 6%. CTC++'s impact to the execution speed has been found to be very modest.
When the program logic executes the code in the instrumented files, the inserted instrumentation probes collect execution history in main memory. When the program ends (or at some explicit user-determined places), the execution counters are automatically written to a data file on disk. If the instrumented program is a never-ending process, there are simple means to add to the instrumented executable an auxiliary thread, which periodically writes the coverage data to the disk. Multiple executions accumulate the counters in the file as long as the instrumented file is the same as before.
To continue the example, the instrumented executable could be run as follows:
primeEnter a number (0 for stop program): 22 IS a prime.
Enter a number (0 for stop program): 55 IS a prime.
Enter a number (0 for stop program): 2020 IS NOT a prime.
Enter a number (0 for stop program): 0
The program was used and it behaved just like the original program. At the program end the CTC++ run-time system, which has been linked to program, wrote the collected execution counters data to a data file, here to MON.dat.
Getting the Results of the Test Runs
Finally you use the ctcpost and ctc2html utilities to get the results for the analysis, i.e. the various types of listings showing the information you initially asked for. ctcpost is used first. Its on-line help is:
Page | 15

Usage:ctcpost [general-options] [symbolfile]... [datafile]... [-ff|-fd|-fc|-fmcdc] [-w report-width] {{-p|-u|-t|-x} reportfile}...ctcpost [general-options] datafile... -a target-datafilectcpost [general-options] symbolfile... -a target-symbolfilectcpost [general-options] {-l|-L} {symbolfile|datafile}...
[general-options]: [-h] [-V] [@optionsfile]... [-c conf-file[;conf-file]...]... [-C conf-param{=value|+value}]... [-f source-file[;source-file]...]... [-nf source-file[;source-file]...]...
and Execution Profile Listing could be obtained as follows:
ctcpostMON.sym MON.dat -p profile.txt
With ctcpost you can get the following textual reports:
Execution Profile Listing shows the missing coverage as well as how many times each code location has been visited. This is the primary CTC++ report, normally worked onwards to HTML form. The report can be also generated with somewhat reduced coverage information compared how the code was instrumented.
Untested Code Listing is similar to execution profile listing but shows only the places where test coverage is inadequate. The HTML form report shows also the untested information, at summary levels (TER%) and individual code locations.
Execution Time Listing shows the cumulative and average execution times of functions.
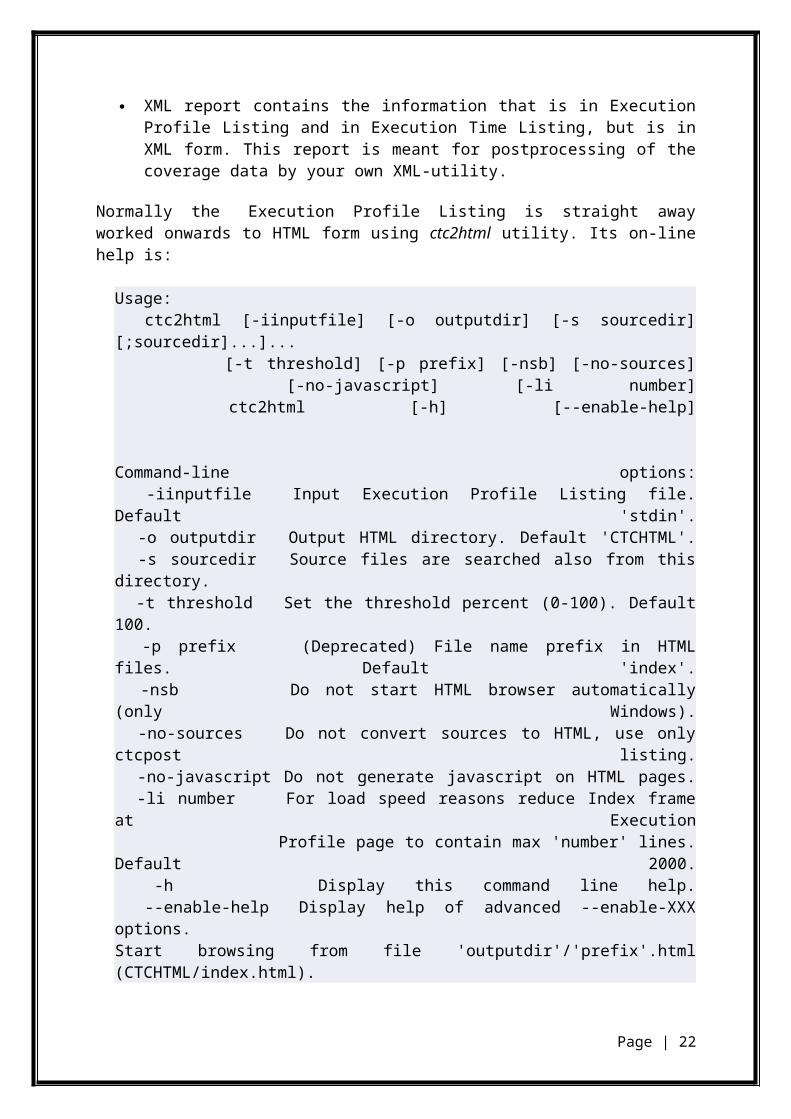
XML report contains the information that is in Execution Profile Listing and in Execution Time Listing, but is in XML form. This report is meant for postprocessing of the coverage data by your own XML-utility.
Normally the Execution Profile Listing is straight away worked onwards to HTML form using ctc2html utility. Its on-line help is:
Usage: ctc2html [-iinputfile] [-o outputdir] [-s sourcedir][;sourcedir]...]... [-t threshold] [-p prefix] [-nsb] [-no-sources] [-no-javascript] [-li number] ctc2html [-h] [--enable-help]
Command-line options: -iinputfile Input Execution Profile Listing file. Default 'stdin'. -o outputdir Output HTML directory. Default 'CTCHTML'. -s sourcedir Source files are searched also from this directory. -t threshold Set the threshold percent (0-100). Default 100.
Page | 16

-p prefix (Deprecated) File name prefix in HTML files. Default 'index'. -nsb Do not start HTML browser automatically (only Windows). -no-sources Do not convert sources to HTML, use only ctcpost listing. -no-javascript Do not generate javascript on HTML pages. -li number For load speed reasons reduce Index frame at Execution Profile page to contain max 'number' lines. Default 2000. -h Display this command line help. --enable-help Display help of advanced --enable-XXX options.Start browsing from file 'outputdir'/'prefix'.html (CTCHTML/index.html).
An example:
ctc2html -i profile.txt -t 85 -nsbstart CTCHTML\index.html
ctc2html converts the Execution Profile Listing information to hierarchical, easily navigable, color-coded HTML representation. Also the actual source files are incorporated to the HTML. The generated HTML files can be viewed with normal web browsers.
The HTML representation is called "CTC++ Coverage Report". It is hierarchical and has four levels:
Directory Summary: General header information (from what data generated, when generated, etc.), directory TERs shown in histograms and numerically, coverage-% not meeting the suggested threshold percent (-t option) are shown in red color. TER over all directories.
Files Summary: Zoom-in to the files in the directories. Similar TERs and color-coding are shown but at file levels.
Functions Summary: Zoom-in to the methods and functions in the files. Similar TERs and color-coding are shown but at function levels.
Untested Code: Compact listing of untested code locations with links to the actual source file to the pertinent line.
Execution Profile: Zoom-in to the detailed view where the execution counters are shown with the source code. Lines that are not fully exercised with respect to the selected coverage criteria are highlighted in red.
Page | 17

PRACTICAL 6
Use of a Software Quality Assurance Tool (XML Schema Validator)
(A) XML Schema Validator service does not perform generic XML Schema validation. While it can verify the well-formedness of any XML document, validation is only available with the built-in schemas. This validator does not download any DTD or schema files, but relies on its own ones.
You can validate XML documents by URL, by file upload or by direct input. Furthermore, you can validate fragments of XML documents. You can easily validate the page that is currently displayed in your browser with this bookmarklet.
Page | 18

Additional checks
Most document types are subject to constraints that cannot be expressed with XML Schema. This validator tries to check these as well, which makes its results much more applicable to real-world applications:
Generalo Strict XML Schema validationo Thorough check of language tags according to BCP 47
XHTML 1.0 and 1.1o Check of element prohibitionso Check of the HTML compatibility guidelines
XHTML elements with an empty content model must use <foo />, not <foo></foo>. (However, a missing space before the trailing / is not detected.)
XHTML elements with an non-empty content model must not use <foo />, but <foo></foo>.
Both xml:lang and lang attributes must be specified with the same value.
Avoid XML processing instructions. Avoid comments inside style and script elements. Avoid line breaks and multiple white space characters within attribute
values.
Page | 19

(B) Schema Validator is a small, easy to use, handy application, designed to help you validate XML files against XML Schema files with just a few clicks.
Basically all that you have to do is select the content, the schema, and press the Validate button. This app will take care of the rest.So, if you work a lot with XML files and need to validate thoseagainst XML schemas then try this tool and check if its options are enough to satisfy your needs.
This will take a single schema plus an instance document and list any errors found whilst validating the document against the schema.
An attempt will be made to fetch any referenced schema from the Internet if the supplied schema is not sufficient for validation
Page | 20

PRACTICAL 7
TESTING OF OBJECT ORIENTED SYSTEM
INTRODUCTION
The testing of software is an important means of assessing the software to determine its Quality. With the development of Fourth generation languages (4GL), which speeds up the implementation process, the proportion of time devoted to testing increased. As the amount of maintenance and upgrade of existing systems grow, significant amount of testing will also be needed to verify systems after changes are made. Most testing techniques were originally developed for the imperative programming paradigm, with relative less consideration to object-oriented features such as message passing, synchronization, dynamic binding, object instantiation, persistence, encapsulation, inheritance, and polymorphism. Objects may interact with one another with unforeseen combinations and invocations. The testing of concurrent object-oriented systems has become a most challenging task. Object-orientation has rapidly become accepted as the preferred paradigm for large scale system design. The reasons for this are well known and understood. First, classes provide an excellent structuring mechanism. They allow a system to be divided into well-defined units, which may then be implemented separately. Second, classes support information hiding. Third, object-orientation encourages and supports software reuse. This may be achieved either through the simple reuse of a class in a library, or via inheritance, whereby a new class may be created as an extension of an existing one .These might cause some types of faults that are difficult to detect using traditional testing techniques. To overcome these deficiencies, it is necessary to adopt an object-oriented testing technique that takes these features into account.
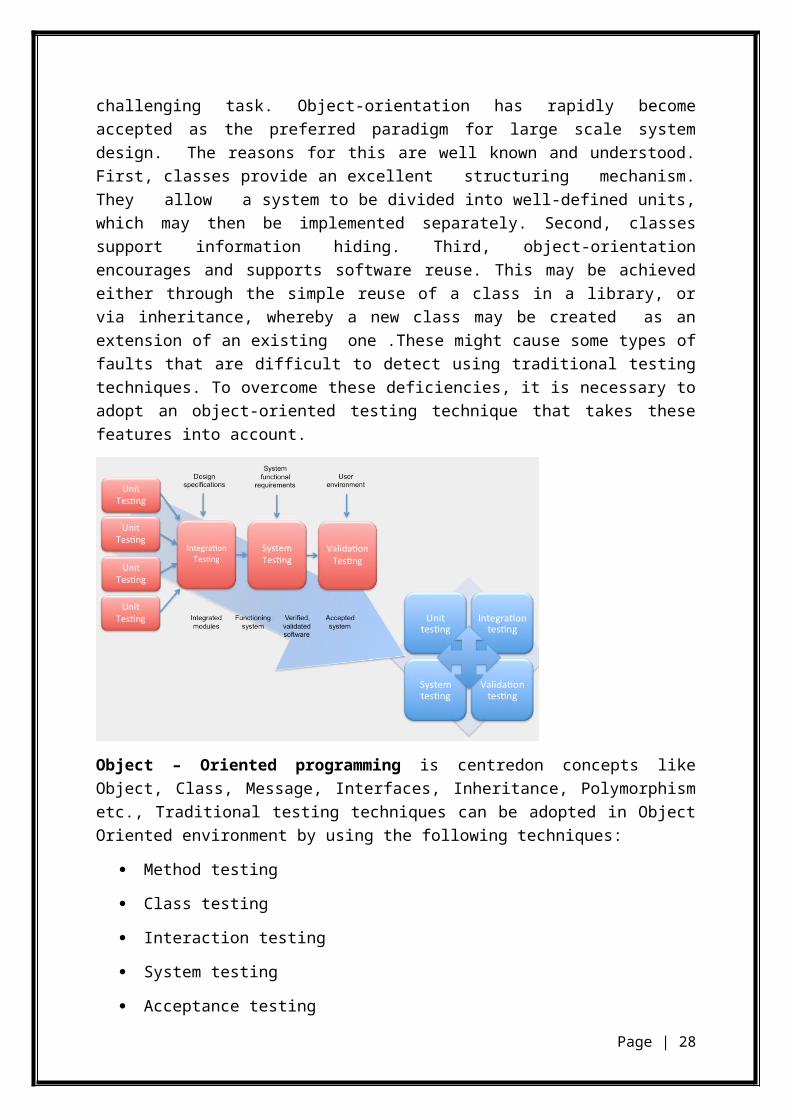
Object – Oriented programming is centredon concepts like Object, Class, Message, Interfaces, Inheritance, Polymorphism etc., Traditional testing techniques can be adopted in Object Oriented environment by using the following techniques:
Page | 21
Method testing
Class testing
Interaction testing
System testing
Acceptance testing
Method Testing: Each individual method of the OO software has to be tested by the programmer. This testing ensures Statement Coverage to ensure that all statements have been traversed atleast once, Decision Coverage to ensure all conditional executions and Path Coverage to ensure the execution the true and false part of the loop.
Class Testing: Class testing is performed on the smallest testable unit in the encapsulated class. Each operation as part of a class hierarchy has to be tested because its class hierarchy defines its context of use. New methods, inherited methods and redefined methods within the class have to be tested. This testing is performed using the following approaches:
Test each method (and constructor) within a class
Test the state behavior (attributes) of the class between methods
Class testing is different from conventional testing in that Conventional testing focuses on input-process-output, whereas class testing focuses on each method.
Test cases should be designed so that they are explicitly associated with the class and/or method to be tested. The purpose of the test should be clearly stated. Each test case should contain:
A list of messages and operations that will be exercised as a consequence of the test
A list of exceptions that may occur as the object is tested
A list of external conditions for setup (i.e., changes in the environment external to the software that must exist in order to properly conduct the test)
Supplementary information that will aid in understanding or implementing the test
Since object oriented software is rich in encapsulation, Inheritance and Polymorphism the following challenges are faced while performing class testing.
It is difficult to obtain a snapshot of a class without building extra methods that display the classes’ state.
Page | 22

Each new context of use (subclass) requires re-testing because a method may be implemented differently (polymorphism). Other unaltered methods within the subclass may use the redefined method and need to be tested.
Basis path, condition, data flow and loop tests can all apply to individual methods, but can’t test interactions between methods
Integration Testing: Object Orientation does not have a hierarchical control structure so conventional top-down and bottom up integration tests have little meaning. Integration testing can be applied in three different incremental strategies:
Thread-based testing, which integrates classes required to respond to one input or event.
Use-based testing, which integrates classes required by one use case.
Cluster testing, which integrates classes required to demonstrate one collaboration.
Integration testing is performed using the following methods:
For each client class, use the list of class methods to generate a series of random test sequences. Methods will send messages to other server classes.
For each message that is generated, determine the collaborating class and the corresponding method in the server object.
For each method in the server object (that has been invoked by messages sent from the client object), determine the messages that it transmits.
For each of the messages, determine the next level of methods that are invoked and add these into the test sequence.
System Testing: All rules and methods of traditional systems testing are also applicable to object-oriented systems. Various types of System Testing include:
Recovery testing: how well and quickly does the system recover from faults
Security testing: verify that protection mechanisms built into the system will protect from unauthorized access (hackers, disgruntled employees, fraudsters)
Stress testing: place abnormal load on the system
Performance testing: investigate the run-time performance within the context of an integrated system
Page | 23

Regression Testing: Regression testing is performed similar to traditional systems to make sure previous functionality still works after new functionality is added. Changing a class that has been tested implies that the unit tests should be rerun. Depending on what has changed, the test scenarios may have to be altered to support this test. In addition, the integration test should be redone for that suite of classes.
Test Case Design For OO Software
Test case design methods for OO software are still evolving. However, an overall approach to OO test case design has been defined by Berard:
1. Each test case should be uniquely identified and explicitly associated with the class to be tested.
The OO testing integration strategy focuses on groups of classes that collaborate or communicate in some manner.
2. The purpose of the test should be stated.
3. A list of testing steps should be developed for each test and should contain:
a. A list of specified states for the object that is to be tested.
b. A list of messages and operations that will be exercised as a consequence of the test.
c. A list of exceptions that may occur as the object is tested.
d. A list of external conditions (i.e., changes in the environment external to the software that must exist in order to properly conduct the test).
e. Supplementary information that will aid in understanding or implementing the test.
Unlike conventional test case design, which is driven by an input-process-output view of software or the algorithmic detail of individual modules, object-oriented testing focuses on designing appropriate sequences of operations to exercise the states of a class.
The Test Case Design Implications of OO Concepts
As we have already seen, the OO class is the target for test case design. Because attributes and operations are encapsulated, testing operations outside of the class is generally unproductive. Although encapsulation is an essential design concept for
OO, it can create a minor obstacle when testing. As Binder [BIN94a] notes, “Testing requires reporting on the concrete and abstract state of an object.” Yet, encapsulation can make this information somewhat difficult to obtain. Unless built-in operations are provided to report the values for class attributes, a snapshot of the state of an object may be difficult to acquire.
Page | 24

Inheritance also leads to additional challenges for the test case designer. We have already noted that each new context of usage requires retesting, even though reuse has been achieved. In addition, multiple inheritance3 complicates testing further by increasing the number of contexts for which testing is required. If subclasses instantiated from a superclass are used within the same problem domain, it is likely that the set of test cases derived for the superclass can be used when testing the subclass.
However, if the subclass is used in an entirely different context, the superclass test cases will have little applicability and a new set of tests must be designed.
Program
#include<iostream.h>
class big{
public:
floatx,y;
big(float a, float b){
x = a; y = b;
}
void decide(){
if(x>y){
cout<<"Greater no is "<<x;
}
else{
cout<<"Greater no is "<<y;
}
}
}
int main()
{
floata,b;
cout<<"Enter two nos. to compare:";
cin>>a>>b;
Page | 25

big b1(a,b); b1.decide();
return 0;
}
Test cases:
X Y Expected Output Observed Output
2 3 3 3
3 2 3 3
1 3 3 3
0 0 0 0
a 1 Error 7.673862e-12
1.1 2.2 2.2 2.2
-1 1 1 1
-1 -2 -1 0
-32769 -32770 -32769 -3.402823e+38
Output
Page | 26
Page | 27
PRACTICAL 8
TESTING OF WEB BASED SYSTEM
INTRODUCTION
Web testing is the name given to software testing that focuses on web applications. Complete testing of a web-based system before going live can help address issues before the system is revealed to the public. Issues such as the security of the web application, the basic functionality of the site, its accessibility to handicapped users and fully able users, as well as readiness for expected traffic and number of users and the ability to survive a massive spike in user traffic, both of which are related to load testing.
A web application performance tool (WAPT) is used to test web applications and webrelated interfaces. These tools are used for performance, load and stress testing of web applications, web sites, servers and other web interfaces. WAPT tends to simulate virtual users which will repeat either recorded URLs or specified URL and allows the users to specify number of times or iterations that the virtual users will have to repeat the recorded URLs. By doing so, the tool is useful to check for bottleneck and performance leakage in the website or web application being tested.
A WAPT faces various challenges during testing and should be able to conduct tests for:
Browser compatibility
Operating System compatibility
Windows application compatibility where required
WAPT allows a user to specify how virtual users are involved in the testing environment.ie either increasing users or constant users or periodic users load. Increasing user load, step by step is called RAMP where virtual users are increased from 0 to hundreds. Constant user load maintains specified user load at all time. Periodic user load tends to increase and decrease the user load from time to time.
Web security testing
Web security testing tells us whether Web based applications requirements are met when they are subjected to malicious input data.
Web Application Security Testing Plug-in Collection for Firefox.
Open Source web testing tools
Apache JMeter: Java program for load testing and performance measurement.
Page | 28

Curl-loader: C-written powerful tool for load testing in different scenarios.
Selenium: Suite of tools for automating web browsers. Available in many languages.
Watir: Web Automation Testing in Ruby for automating web browsers.
Windows-based web testing tools
CSE HTML Validator - Test HTML (including HTML5), XHTML, CSS (including CSS3), accessibility; software from AI Internet Solutions LLC.
HP LoadRunner - Automated performance and load testing software from HP.
HP QuickTest Professional - Automated functional and regression testing software from HP.
IBM Rational Functional Tester
NeoLoad - Load and performance testing tool from Neotys.
Ranorex - Automated cross-browser functional testing software from Ranorex.
Silk Performer - Performance testing tool from Borland.
SilkTest - Automation tool for testing the functionality of enterprise applications.
TestComplete - Automated testing tool, developed by SmartBear Software.
Testing Anywhere - Automation testing tool for all types of testing from Automation Anywhere.
Test Studio - Software testing tool for functional web testing from Telerik.
TOSCA Testsuite - Software tool for the automated execution of functional and regression software testing.
Cloud-based testing tools
Blitz: Load and performance testing of websites, mobile, web apps and REST APIs.
Testize: Simple сross-device/cross-browser web testing and analysis service for site owners to identify issues impacting site
TESTING OF CCET WEBSITE USING SELENIUM TESTING TOOL
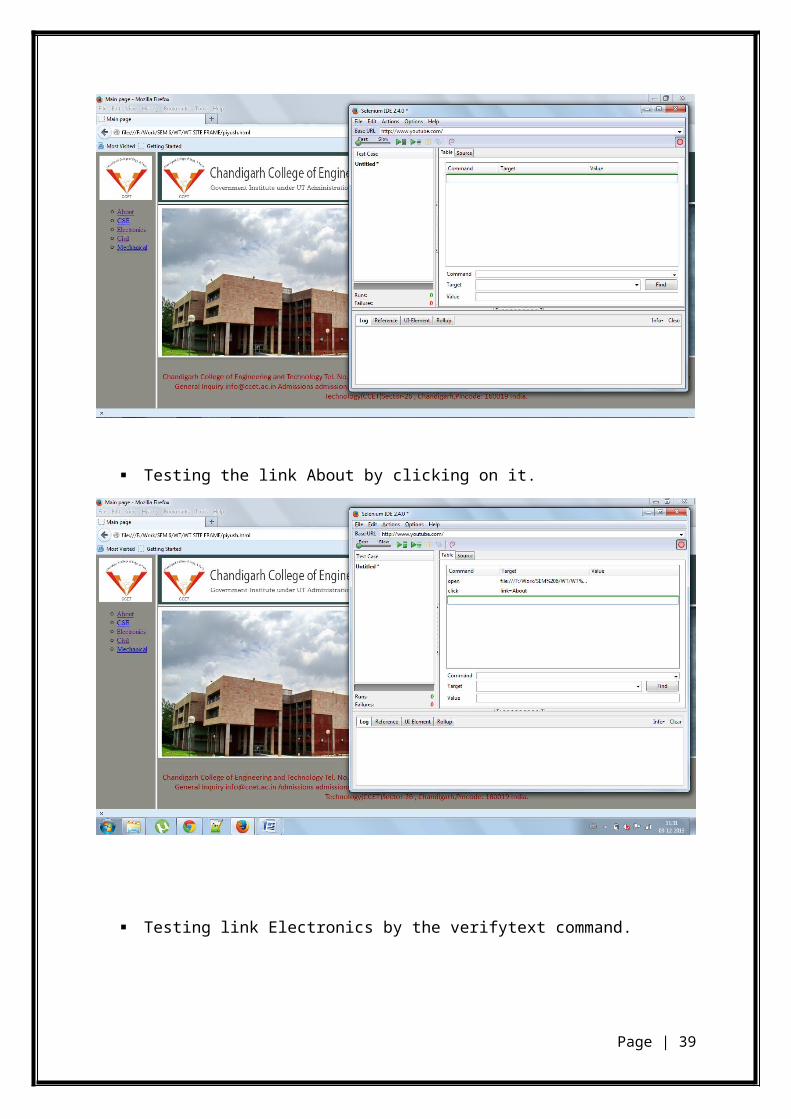
The view of Selenium IDE interface in Mozilla Firefox.
Page | 29

Testing the link About by clicking on it.
Testing link Electronics by the verifytext command.
Page | 30

Testing link Civil using verifyElement command.
Test results after running the Selenium IDE for the entire test suit.
Page | 31

Page | 32

PRACTICAL 9
DESIGN AND IMPLEMENTATION OF A TESTING AND ASSURANCE TOOL
TESTING TOOL: Lexical Analyser
INTRODUCTION:
A simple way to build lexical analyzer is to construct a diagram that illustrates the structure of the tokens of the source language, and then to hand-translate the diagram into a program for finding tokens. Efficient lexical analysers can be produced in this manner.
Role of a Lexical Analyser in testing
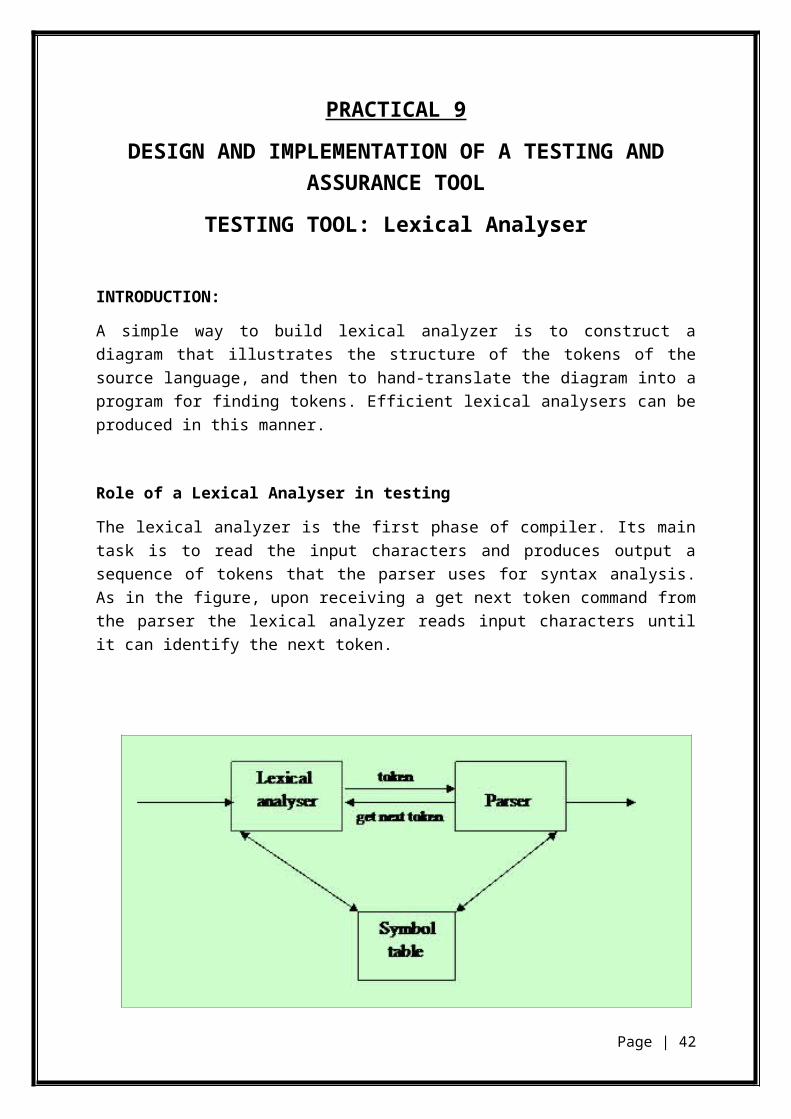
The lexical analyzer is the first phase of compiler. Its main task is to read the input characters and produces output a sequence of tokens that the parser uses for syntax analysis. As in the figure, upon receiving a get next token command from the parser the lexical analyzer reads input characters until it can identify the next token.
Fig . Interaction of lexical analyzer with parser.
Since the lexical analyzer is the part of the compiler that reads the source text, it may also perform certain secondary tasks at the user interface. One such task is stripping out from
Page | 33

the source program comments and white space in the form of blank, tab, and new line character. Another is correlating error messages from the compiler with the source program
Issues in Lexical Analysis
There are several reasons for separating the analysis phase of compiling into lexical analysis and parsing.
1) Simpler design is the most important consideration. The separation of lexical analysis from syntax analysis often allows us to simplify one or the other of these phases.
2) Compiler efficiency is improved.
3) Compiler portability is enhanced.
Tokens, Patterns and Lexemes
There is a set of strings in the input for which the same token is produced as output. This set of strings is described by a rule called a pattern associated with the token. The pattern is set to match each string in the set. A lexeme is a sequence of characters in the source program that is matched by the pattern for the token. For example in the Pascal’s statement const pi = 3.1416; the substring pi is a lexeme for the token identifier.
In most programming languages, the following constructs are treated as tokens: keywords, operators, identifiers, constants, literal strings, and punctuation symbols such as parentheses, commas, and semicolons.
DESIGN OF LEXICAL ANALYZER
#include<conio.h>
#include<string.h>
#include<ctype.h>
#include<stdio.h>
classLex_Ana{
public:
int i,j,k,ti,oprfl,delfl,keyfl,Litfl,cLitfl,ptfl,tfl,mxIdeni,Liti,mxIdenj,mxOpri,
mxOprj,mxDeli,Erri;
intuqIdi,uqOpi,uqDei,defOpi,defKeyi,cLiti;
char mStr[50],mxIden[20][20],mxOpr[20][20],mxDel[20],tmpStr[50];
Page | 34

char defOprStr[20][20],defOpr[15],defDel[15],defKey[20][20];
char uqOpr[20][20],uqIden[20][20],uqIdfl[20],uqOpfl[20],uqDefl[20],uqDel[20];
char Opr[20][20],invalTok[20][20],Con[20][20],Iden[20][20],Key[20][20],
inTok[20],Lit[20][20],Err[20][20],cLit[20][20];
intOpri,invToki,Coni,Ideni,Keyi,Deli,inToki;
Lex_Ana(char *str){
strcpy(mStr,str);
defKeyi=13;
strcpy(defKey[0],"int");
strcpy(defKey[1],"float");
strcpy(defKey[2],"double");
strcpy(defKey[3],"for");
strcpy(defKey[4],"if");
strcpy(defKey[5],"else");
strcpy(defKey[6],"while");
strcpy(defKey[7],"do");
strcpy(defKey[8],"return");
strcpy(defKey[9],"char");
strcpy(defKey[10],"break");
strcpy(defKey[11],"goto");
strcpy(defKey[12],"void");
defOpi=18;
strcpy(defOprStr[0],"+");
strcpy(defOprStr[1],"-");
strcpy(defOprStr[2],"*");
strcpy(defOprStr[3],"/");
strcpy(defOprStr[4],"%");
strcpy(defOprStr[5],"=");
strcpy(defOprStr[6],"<");
Page | 35
strcpy(defOprStr[7],">");
strcpy(defOprStr[8],"<=");
strcpy(defOprStr[9],">=");
strcpy(defOprStr[10],"==");
strcpy(defOprStr[11],"=+");
strcpy(defOprStr[12],"=-");
strcpy(defOprStr[13],"=*");
strcpy(defOprStr[14],"=/");
strcpy(defOprStr[15],"=%");
strcpy(defOprStr[16],"++");
strcpy(defOprStr[17],"--");
strcpy(defOpr,"+-/*%=<>");
strcpy(defDel,";,:{}[]()");
}
intIsMxIden(char ch){
return((IsIden(ch)||IsFloat(ch))?1:0);
}
intIsIden(char ch){
return((isalpha(ch)||ch=='_')?1:0);
}
intIsFloat(char ch){
return((isdigit(ch)||ch=='.')?1:0);
}
intIsOpr(char ch){
oprfl=0;
for(ti=0;ti<strlen(defOpr)&&!oprfl;ti++){
if(ch==defOpr[ti]){
oprfl=1;
}
Page | 36

}
returnoprfl;
}
intIsDel(char ch){
delfl=0;
for(ti=0;ti<strlen(defDel)&&!delfl;ti++){
if(ch==defDel[ti]){
delfl=1;
}
}
returndelfl;
}
intIsKey(char *str){
keyfl=0;
for(ti=0;ti<defKeyi&&!keyfl;ti++){
if(!strcmp(defKey[ti],str)){
keyfl=1;
}
}
returnkeyfl;
}
voidFind_Lex(){
i=0;
cLiti=0;
Liti=0;
Erri=0;
mxIdeni=0;
mxIdenj=0;
mxOpri=0;
Page | 37

mxOprj=0;
mxDeli=0;
inToki=0;
while(mStr[i]!='\0'){
if(IsMxIden(mStr[i])){
while(IsMxIden(mStr[i])){
mxIden[mxIdeni][mxIdenj++]=mStr[i++];
if(!IsMxIden(mStr[i])){
mxIden[mxIdeni++][mxIdenj]='\0';
mxIdenj=0;
}
}
}
else if(mStr[i]=='"'){
Litfl=1;
k=0;
tmpStr[k++]=mStr[i];
for(j=i+1;j<strlen(mStr)&&Litfl;j++){
tmpStr[k++]=mStr[j];
if(mStr[j]=='"'){
tmpStr[k]='\0';
strcpy(Lit[Liti++],tmpStr);
Litfl=0;
i=j+1;
}
}
if(Litfl){
strcpy(Err[Erri++],"Invalid Use of \"");
i++;
Page | 38
}
}
else if(mStr[i]=='\''){
cLitfl=0;
k=0;
tmpStr[k++]=mStr[i];
for(j=i+1;j<strlen(mStr)&&!cLitfl;j++){
tmpStr[k++]=mStr[j];
if(mStr[j]=='\''){
tmpStr[k]='\0';
if(strlen(tmpStr)!=3){
strcpy(Err[Erri++],"Invalid Use of \'");
cLitfl=1;
i++;
}
else{
strcpy(cLit[cLiti++],tmpStr);
cLitfl=1;
i=j+1;
}
}
}
if(!cLitfl){
strcpy(Err[Erri++],"Invalid Use of \'");
cLitfl=1;
i++;
}
}
else if(IsOpr(mStr[i])){
Page | 39

while(IsOpr(mStr[i])){
mxOpr[mxOpri][mxOprj++]=mStr[i++];
if(!IsOpr(mStr[i])){
mxOpr[mxOpri++][mxOprj]='\0';
mxOprj=0;
}
}
}
else if(IsDel(mStr[i])){
while(IsDel(mStr[i])){
mxDel[mxDeli++]=mStr[i++];
}
mxDel[mxDeli]='\0';
}
else if(mStr[i]!=' '){
inTok[inToki++]=mStr[i++];
inTok[inToki]='\0';
}
else{
i++;
}
}
}
voidRem_Dup(){
uqIdi=0;
uqDei=0;
uqOpi=0;
for(i=0;i<20;i++){
uqOpfl[i]=0;
Page | 40

uqIdfl[i]=0;
uqDefl[i]=0;
}
for(i=1;i<mxIdeni+1;i++){
if(uqIdfl[i-1]==0){
strcpy(uqIden[uqIdi++],mxIden[i-1]);
for(j=i;j<mxIdeni;j++){
if(!strcmp(mxIden[j],mxIden[i-1])){
uqIdfl[j]=1;
}
}
}
}
for(i=1;i<mxOpri+1;i++){
if(uqOpfl[i-1]==0){
strcpy(uqOpr[uqOpi++],mxOpr[i-1]);
for(j=i;j<mxOpri;j++){
if(!strcmp(mxOpr[j],mxOpr[i-1])){
uqOpfl[j]=1;
}
}
}
}
for(i=1;i<mxDeli+1;i++){
if(uqDefl[i-1]==0){
uqDel[uqDei++]=mxDel[i-1];
uqDel[uqDei]='\0';
for(j=i;j<mxDeli;j++){
if(mxDel[j]==mxDel[i-1]){
Page | 41
uqDefl[j]=1;
}
}
}
}
}
voidSep_Val(){
Opri=0;
invToki=0;
Ideni=0;
Coni=0;
Keyi=0;
for(i=0;i<uqIdi;i++){
if(IsIden(uqIden[i][0])){
if(IsKey(uqIden[i])){
strcpy(Key[Keyi++],uqIden[i]);
}
else{
ptfl=1;
for(j=0;j<strlen(uqIden[i])&&ptfl;j++){
if(uqIden[i][j]=='.'){
strcpy(invalTok[invToki++],uqIden[i]);
ptfl=0;
}
}
if(ptfl){
strcpy(Iden[Ideni++],uqIden[i]);
}
}
Page | 42

}
else{
tfl=1;
ptfl=0;
for(j=0;j<strlen(uqIden[i])&&tfl;j++){
if(IsIden(uqIden[i][j])){
strcpy(invalTok[invToki++],uqIden[i]);
tfl=0;
}
else if(uqIden[i][j]=='.'){
if(ptfl){
strcpy(invalTok[invToki++],uqIden[i]);
tfl=0;
}
if(!ptfl){
ptfl=1;
}
}
}
if(tfl){
strcpy(Con[Coni++],uqIden[i]);
}
}
}
for(i=0;i<uqOpi;i++){
tfl=1;
for(j=0;j<defOpi&&tfl;j++){
if(!strcmp(uqOpr[i],defOprStr[j])){
strcpy(Opr[Opri++],uqOpr[i]);
Page | 43

tfl=0;
}
}
if(tfl){
strcpy(invalTok[invToki++],uqOpr[i]);
}
}
}
void Display(){
printf("\n\n\t: Lexical Analysis Report :\n\n\n\t%c Input String: %s\n\n\n",272,mStr);
printf("\t%c Total Identifiers: %d\n\n",272,Ideni);
for(i=0;i<Ideni;i++){
printf("\t\t");
puts(Iden[i]);
}
printf("\n\t%c Total Constants: %d\n\n",272,Coni);
for(i=0;i<Coni;i++){
printf("\t\t");
puts(Con[i]);
}
printf("\n\t%c Total Literals: %d\n\n",272,Liti+cLiti);
for(i=0;i<Liti;i++){
printf("\t\t");
puts(Lit[i]);
}
for(i=0;i<cLiti;i++){
printf("\t\t");
puts(cLit[i]);
}
Page | 44

printf("\n\t%c Total Keywords: %d\n\n",272,Keyi);
for(i=0;i<Keyi;i++){
printf("\t\t");
puts(Key[i]);
}
printf("\n\t%c Total Operators: %d\n\n",272,Opri);
for(i=0;i<Opri;i++){
printf("\t\t");
puts(Opr[i]);
}
printf("\n\t%c Total Delimeters: %d\n\n",272,uqDei);
if(uqDei){
printf("\t\t");
puts(uqDel);
}
printf("\n\t%c Total Invalid Tokens: %d\n\n",272,invToki+inToki);
for(i=0;i<invToki;i++){
printf("\t\t");
puts(invalTok[i]);
}
if(inToki){
for(i=0;i<strlen(inTok);i++){
printf("\t\t");
printf("%c\n",inTok[i]);
}
}
printf("\n\t%c Invalid Used Tokens: %d\n\n",272,Erri);
for(i=0;i<Erri;i++){
printf("\t\t");
Page | 45

puts(Err[i]);
}
}
};
void main()
{
charmstr[50];
printf("\n\n\tEnter String: ");
gets(mstr);
Lex_Anaoblex(mstr);
oblex.Find_Lex(); oblex.Rem_Dup();
oblex.Sep_Val();oblex.Display();
}
OUTPUT:
Page | 46