stormwater phase ii requirements: improving … phase ii requirements: improving stormwater quality...
TRANSCRIPT
1
Stormwater Phase II Requirements: Improving
Stormwater Quality Over the Long-Term
Stormwater Phase II Requirements: Improving
Stormwater Quality Over the Long-Term
WebcastNovember 16, 2005
Nikos SingelisU.S. EPA
1
2
Today’s DiscussionToday’s Discussion• What’s an NPDES Permit and how does it
work?• Why is stormwater a problem?• What is the NPDES stormwater program all
about and how can I get involved?• Permanent Stormwater Controls (Post-
Construction)• Smart Growth and Low Impact Development
2

3
“Storm Water” or “Stormwater?”
Is it one word or two?
3

4
Part IPart I
What’s a National Pollutant Discharge Elimination System (NPDES) Permit
and how does it work?
4

5
NPDES Statutory FrameworkNPDES Statutory Framework
All “point” sources“Discharging
Pollutants”into “Waters of the
U.S.”
Must obtain anNPDES permitfrom an authorized State or EPA
5
6
NPDES Permits NPDES Permits • Illegal for point source (pipe, ditch, channel,
tunnel, vessel, rolling stock, or other manmade conveyance) to discharge pollutants to surface waters without a permit
• Permit is a license granting permission to discharge– Not a right: permit is revocable “for cause” (e.g.,
non-compliance)
6
7
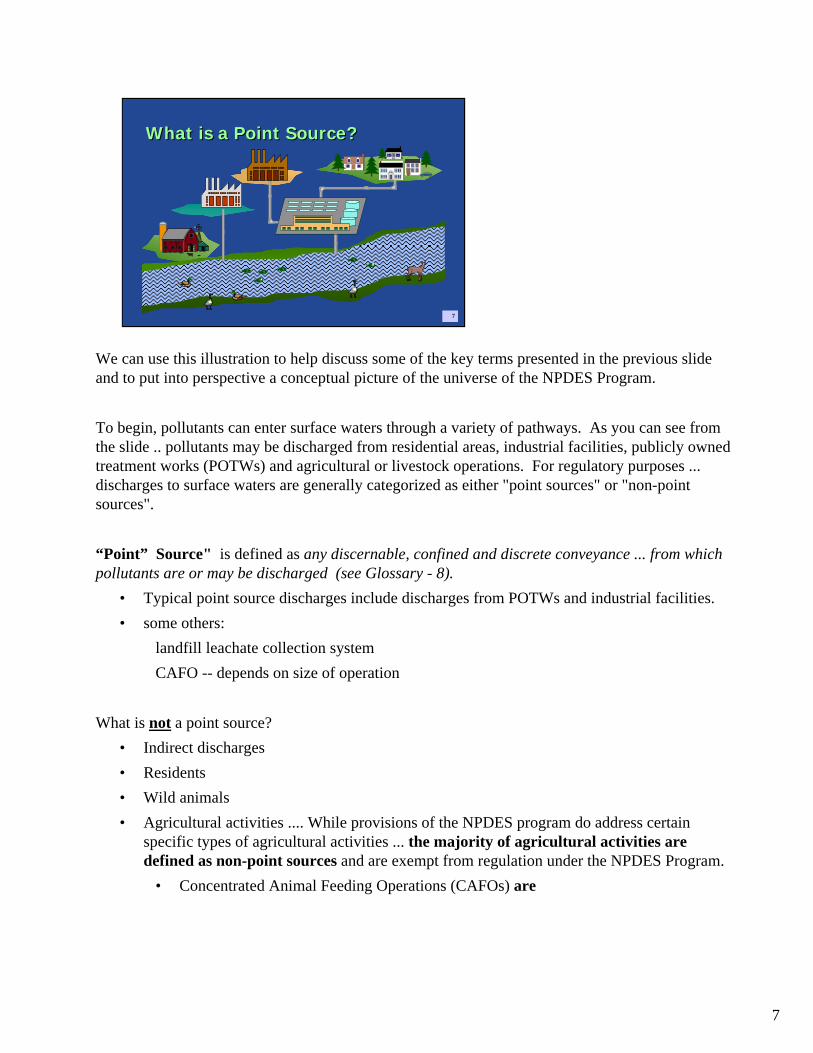
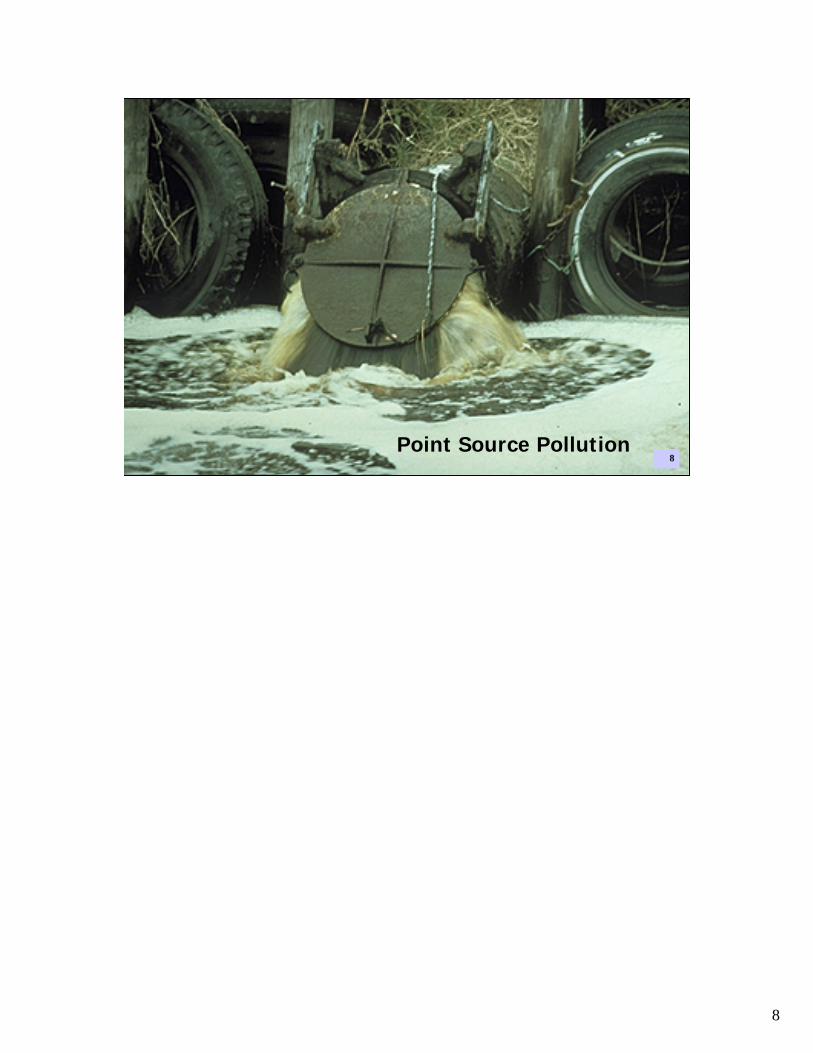
We can use this illustration to help discuss some of the key terms presented in the previous slide and to put into perspective a conceptual picture of the universe of the NPDES Program.
To begin, pollutants can enter surface waters through a variety of pathways. As you can see from the slide .. pollutants may be discharged from residential areas, industrial facilities, publicly owned treatment works (POTWs) and agricultural or livestock operations. For regulatory purposes ... discharges to surface waters are generally categorized as either "point sources" or "non-point sources".
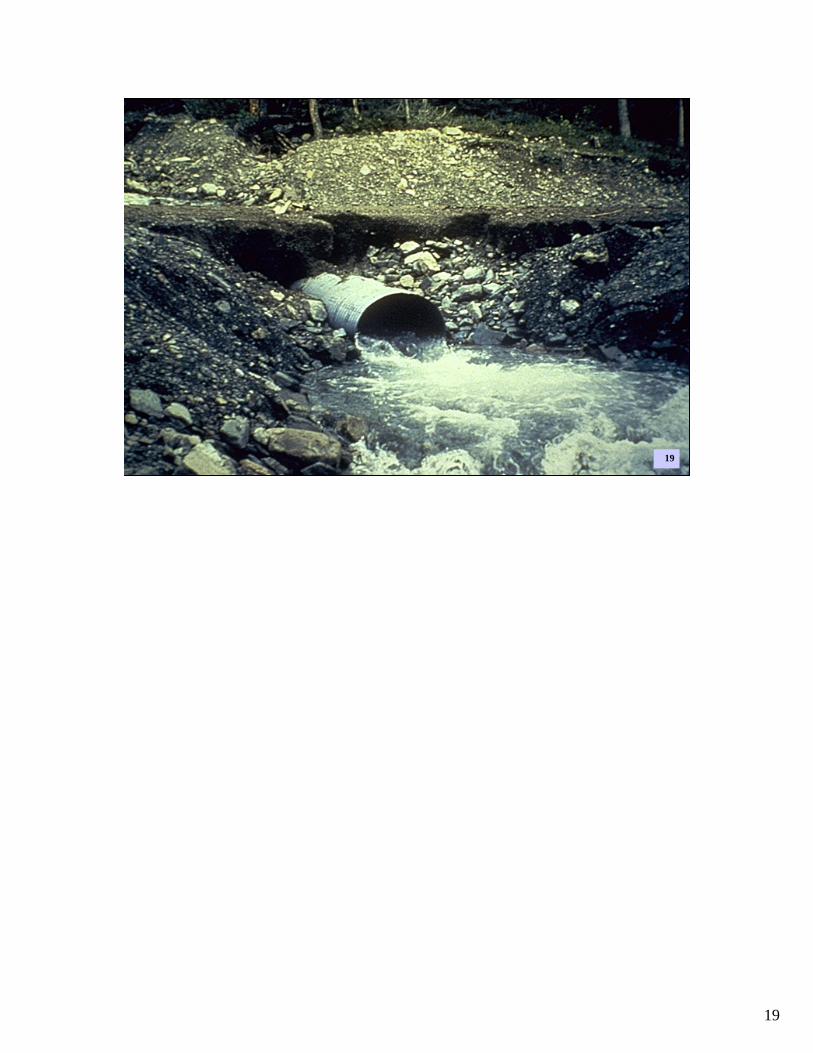
“Point” Source" is defined as any discernable, confined and discrete conveyance ... from whichpollutants are or may be discharged (see Glossary - 8).
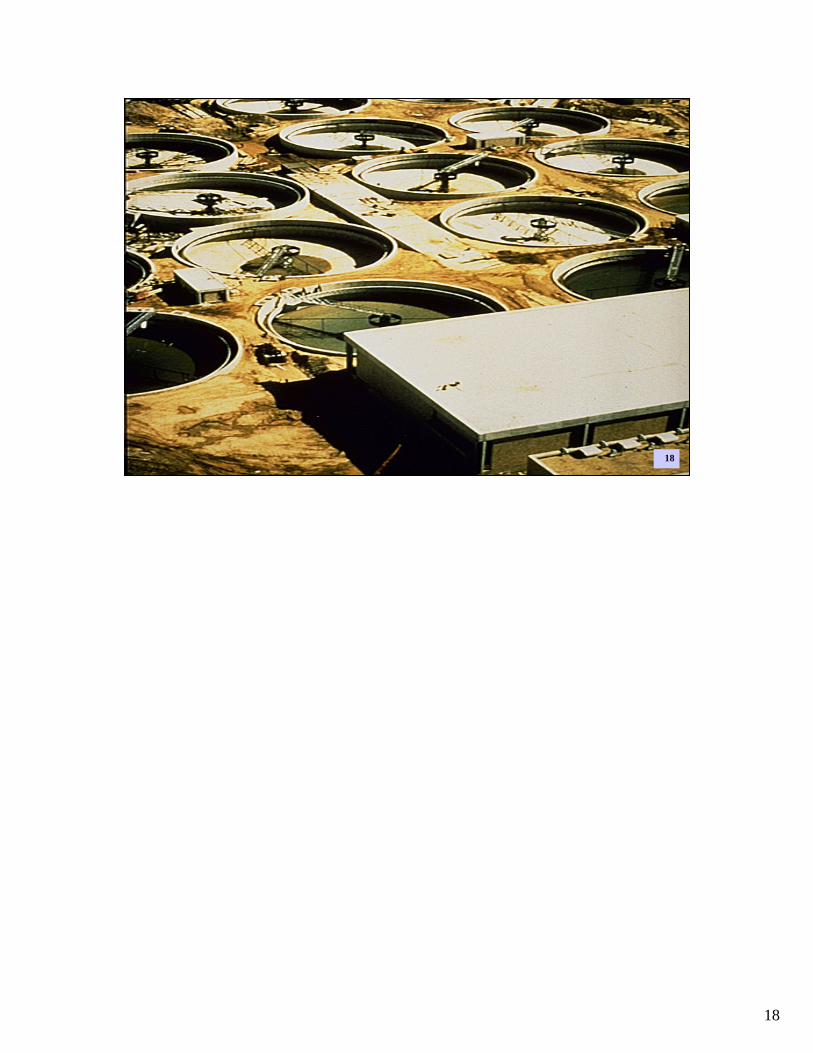
• Typical point source discharges include discharges from POTWs and industrial facilities.• some others:
landfill leachate collection systemCAFO -- depends on size of operation
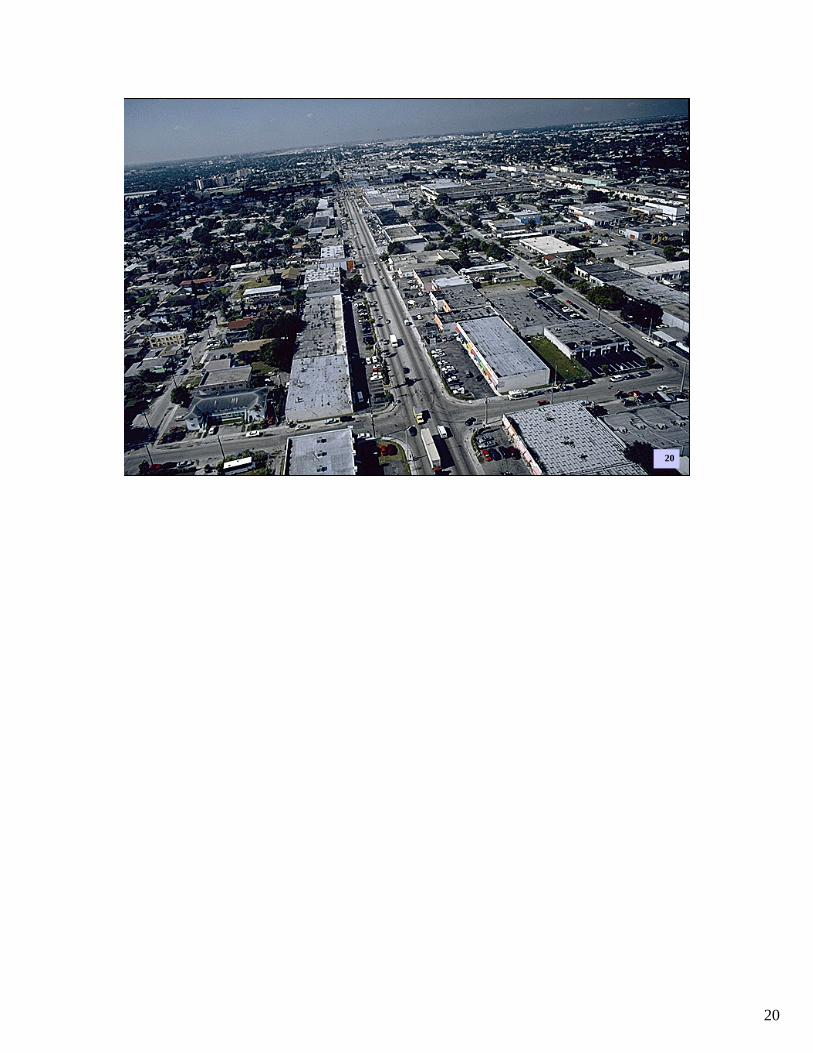
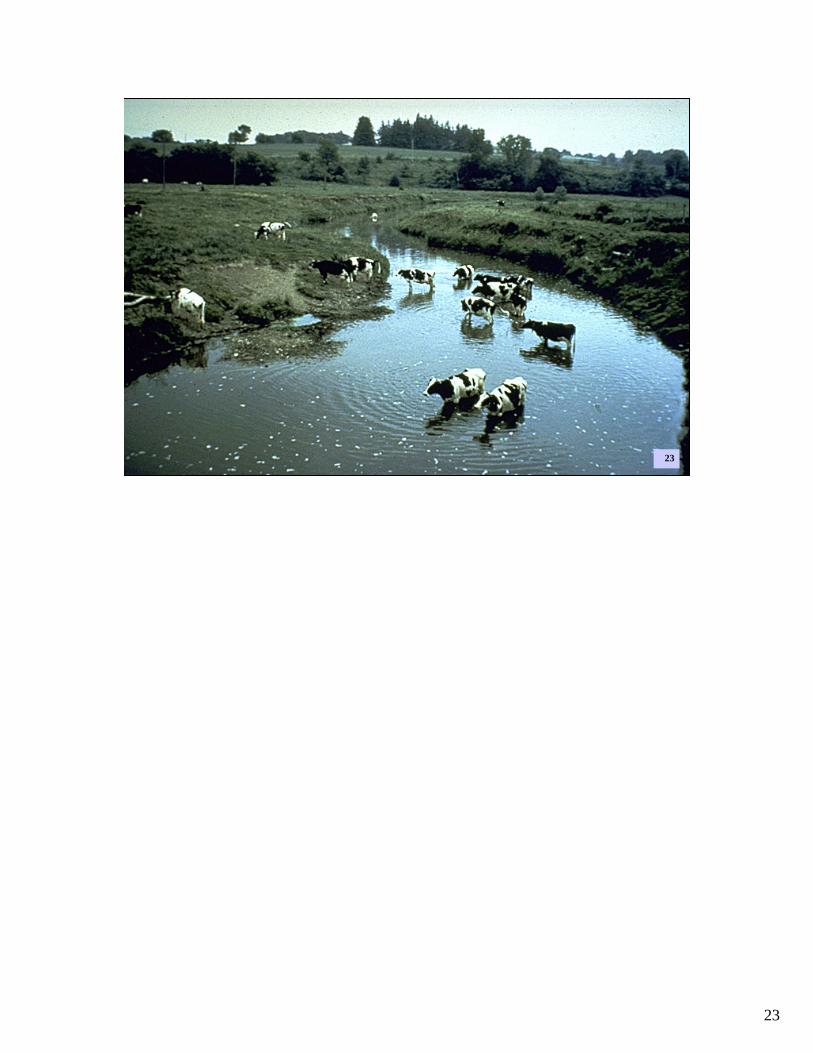
What is not a point source?• Indirect discharges• Residents• Wild animals• Agricultural activities .... While provisions of the NPDES program do address certain
specific types of agricultural activities ... the majority of agricultural activities are defined as non-point sources and are exempt from regulation under the NPDES Program.
• Concentrated Animal Feeding Operations (CAFOs) are
What is a Point Source?What is a Point Source?
7
8
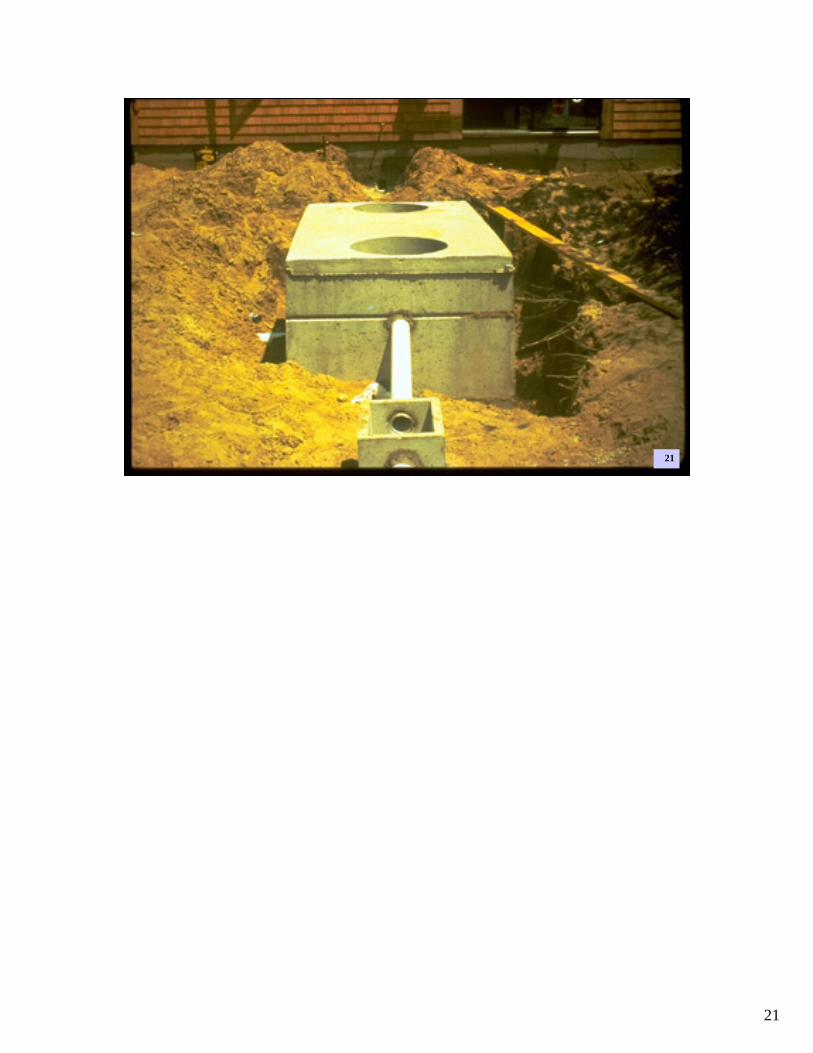
Point Source Pollution8
9
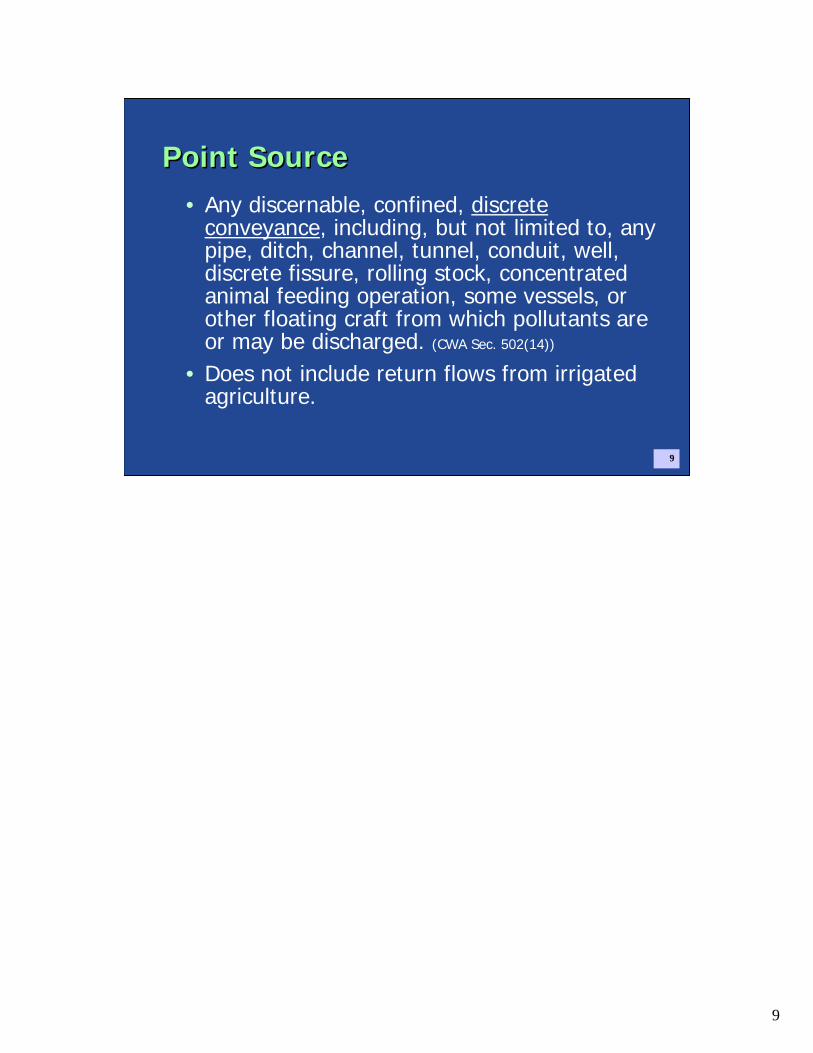
Point SourcePoint Source• Any discernable, confined, discrete
conveyance, including, but not limited to, any pipe, ditch, channel, tunnel, conduit, well, discrete fissure, rolling stock, concentratedanimal feeding operation, some vessels, or other floating craft from which pollutants are or may be discharged. (CWA Sec. 502(14))
• Does not include return flows from irrigated agriculture.
9
10
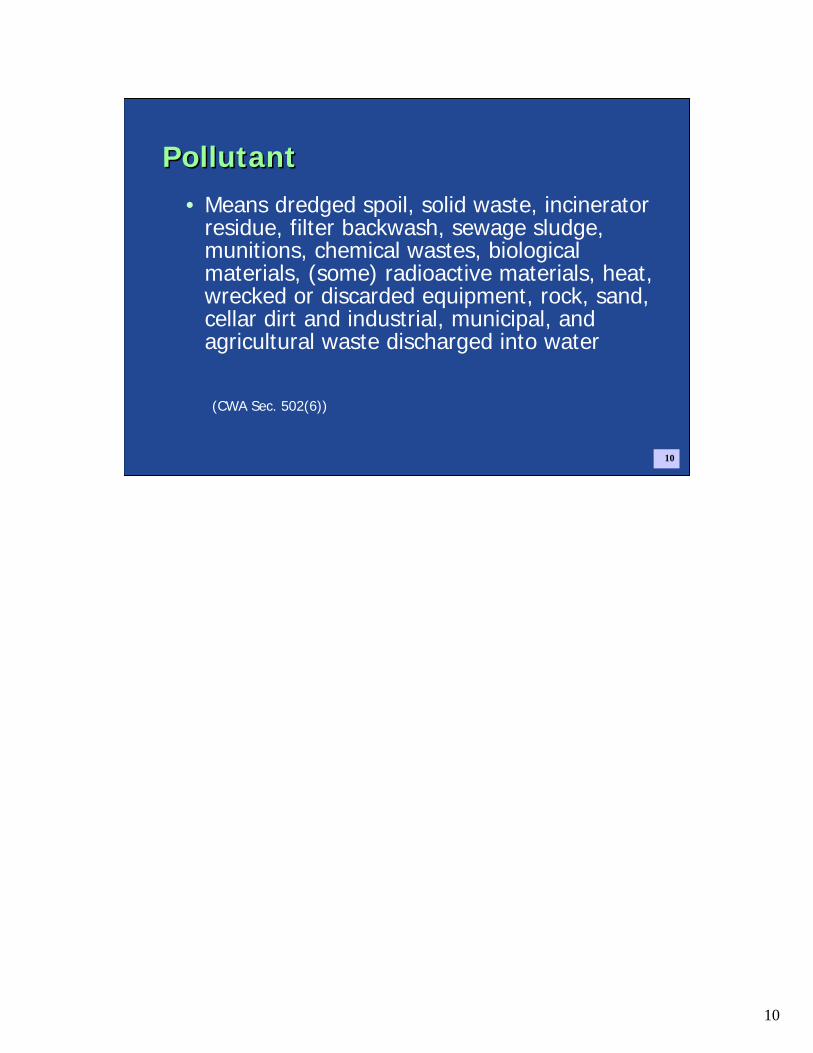
PollutantPollutant• Means dredged spoil, solid waste, incinerator
residue, filter backwash, sewage sludge, munitions, chemical wastes, biological materials, (some) radioactive materials, heat, wrecked or discarded equipment, rock, sand, cellar dirt and industrial, municipal, and agricultural waste discharged into water
(CWA Sec. 502(6))
10

11
1992 2001/20021972
600 K
500 K
400 K
300 K
200 K
100 K
IndividualNPDES Permits60,000
Stormwater Phase I+300,000
CAFOs+15,500
Stormwater Phase II+200,000
Growth of the NPDES Program(Number of facilities or sources)Growth of the NPDES Program(Number of facilities or sources)
11
12
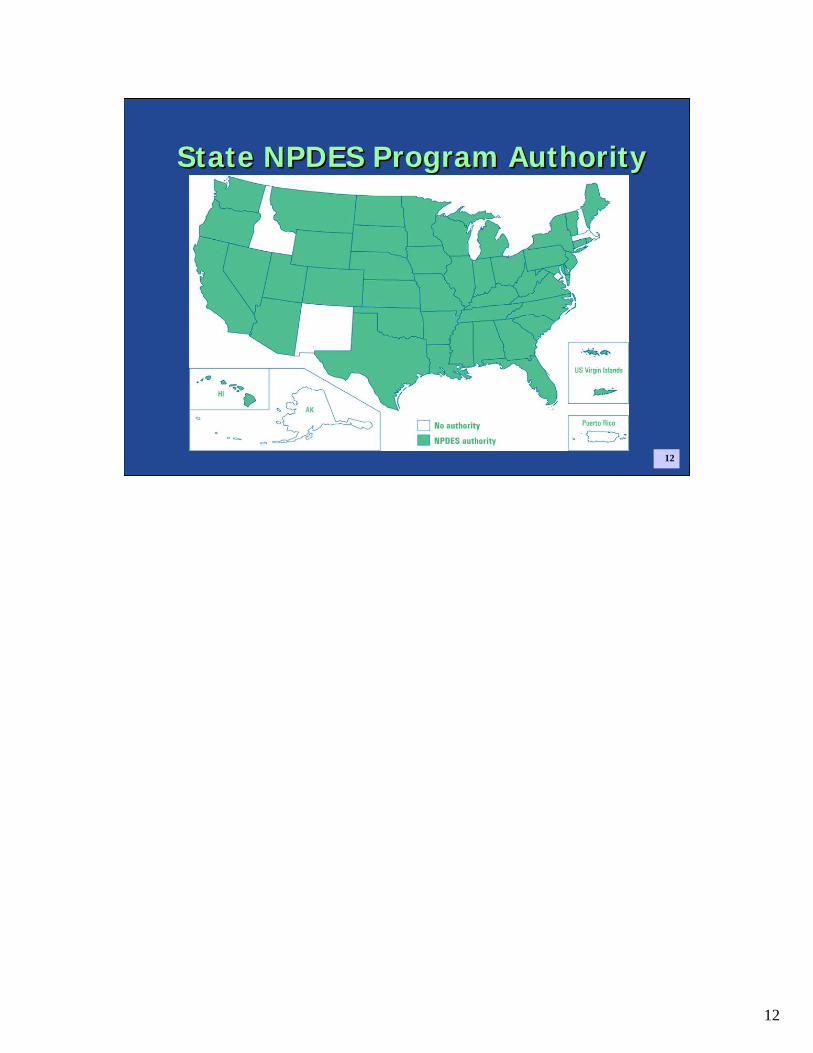
State NPDES Program AuthorityState NPDES Program Authority
12
13
NPDES Permits NPDES Permits • Permit term: 5 years• Issued by authorized states, tribes, or EPA • Public review and comment on draft permits• Administrative and judicial appeal processes
13
14
Permit Review/CommentPermit Review/Comment• Public notice/30-day comment period (minimum)• Public hearing (if sufficient interest/controversy)
– Comment period extended 30 days
• EPA review of certain state-issued permits– “Major” municipal and industrial– General permits– Subject to widespread public interest
14
15
NPDES: Enforcement NPDES: Enforcement • Penalties:
– Fines for violations (exceed limits, fail to report) up to $32,500 per day
– Imprisonment for criminal violations (repeated, willful violations)
– Supplemental environmental projects (SEP) -money goes to restoration projects, not to U.S. Treasury
• Citizen suits: directed against dischargers– Must provide 60-day notice to EPA, state, and tribe
to give them a chance to take action
15
16
NPDES Permit ProgramNPDES Permit Program• Two categories of NPDES permits
– Individual– General
• Issued by states, territories, tribes, or EPA (permit term 5 years)
• Public review and comment on draft permits
16
17
It’s time to play….
“Point Source or Nonpoint Source”
It’s time to play….
“Point Source or Nonpoint Source”
17
18
18
19
19
20
20
21
21
22
22
23
23
24
24

25
25

26
26

27
Questions??Questions??
27

28
Part IIPart II
Why is Stormwater a Problem?
28
29
Why is Stormwater a Problem?Why is Stormwater a Problem?
• Impervious surfaces and disturbed land contribute to changes in quality and quantity
• Pollutants include sediments, nutrients, bacteria, chemicals, metals, etc.
• Problems include scouring, temperature changes, siltation, fish kills, shellfish bans, etc.
29
30
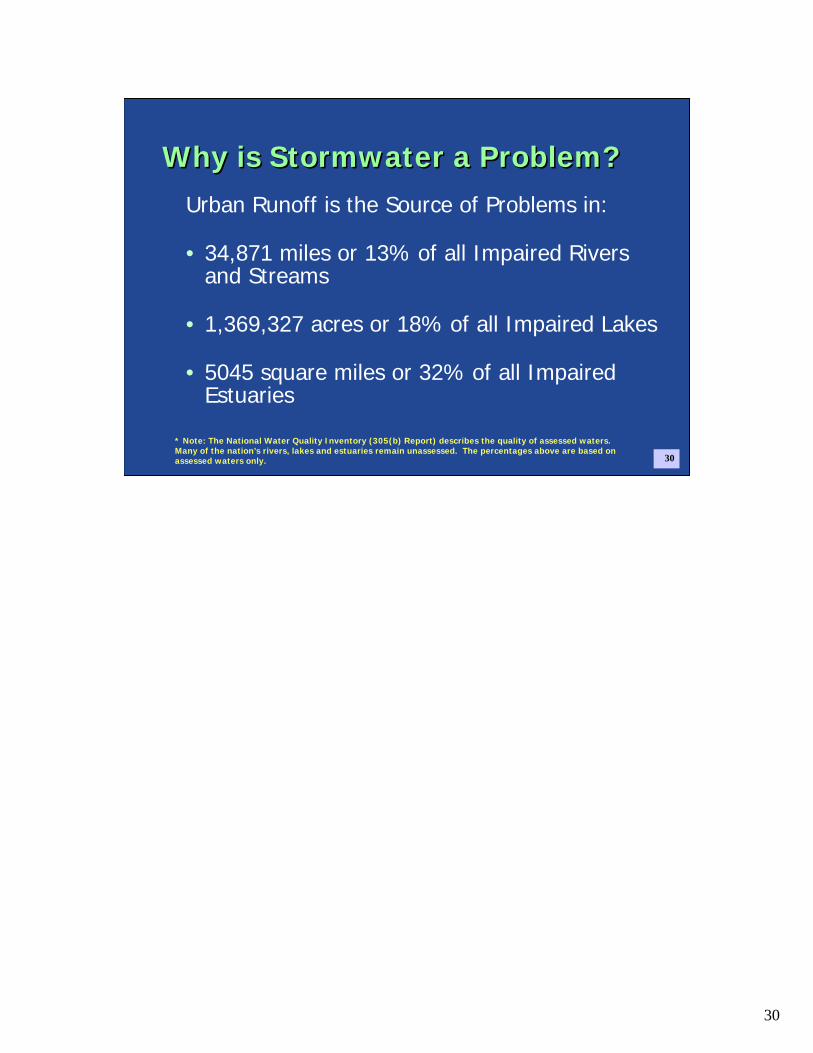
Why is Stormwater a Problem?Why is Stormwater a Problem?Urban Runoff is the Source of Problems in:
• 34,871 miles or 13% of all Impaired Rivers and Streams
• 1,369,327 acres or 18% of all Impaired Lakes
• 5045 square miles or 32% of all Impaired Estuaries
30
* Note: The National Water Quality Inventory (305(b) Report) describes the quality of assessed waters. Many of the nation’s rivers, lakes and estuaries remain unassessed. The percentages above are based on assessed waters only.
31
Common Pollutants in Urban StormwaterCommon Pollutants in Urban Stormwater
• Sediment• Nutrients• Oxygen-Demanding
Substances• Pathogens• Trash
• Road Salts• Oil and Grease• Heavy Metals• Heat• PAHs
31
32
Effects of Development on Stormwater RunoffEffects of Development on Stormwater RunoffIncreases:• Impervious surface area• Stormwater volume• Stormwater velocity• Deposition of pollutants
Decreases:• Stormwater quality• Ground water recharge• Baseflow • Natural drainage
systems including riparian vegetative cover
32
33
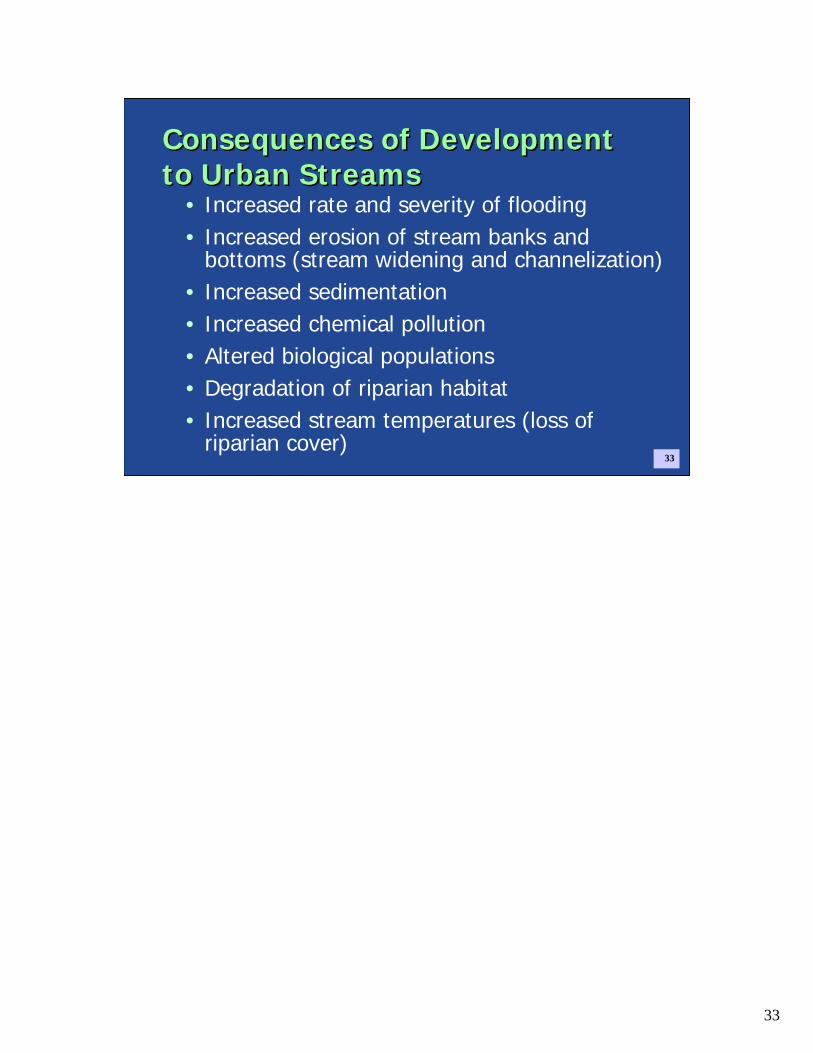
Consequences of Development to Urban StreamsConsequences of Development to Urban Streams
• Increased rate and severity of flooding• Increased erosion of stream banks and
bottoms (stream widening and channelization)• Increased sedimentation• Increased chemical pollution• Altered biological populations• Degradation of riparian habitat• Increased stream temperatures (loss of
riparian cover)33

34
Runoff Pollution
34
Lots of existing water quality problems and other environmental degradation attributable to the nonpoint sources realm. NURP, etc.
35
35
36
36
37
37

38
38
39
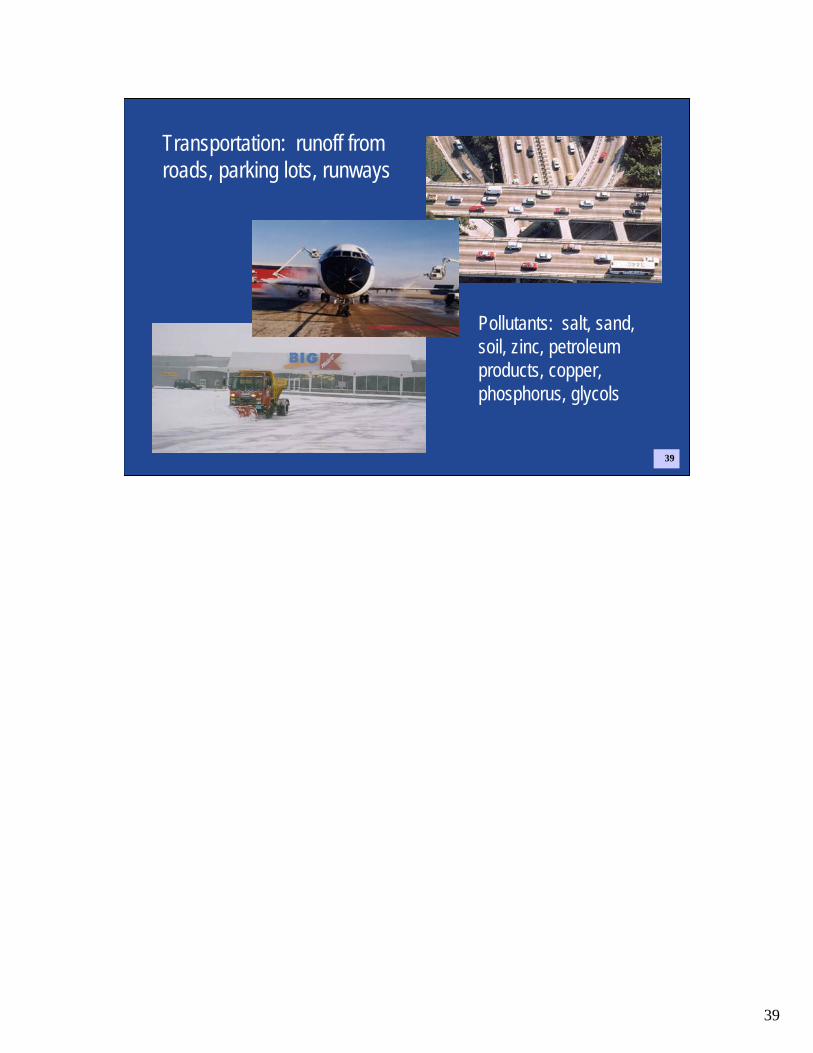
Transportation: runoff from roads, parking lots, runways
Pollutants: salt, sand, soil, zinc, petroleum products, copper, phosphorus, glycols
39
40
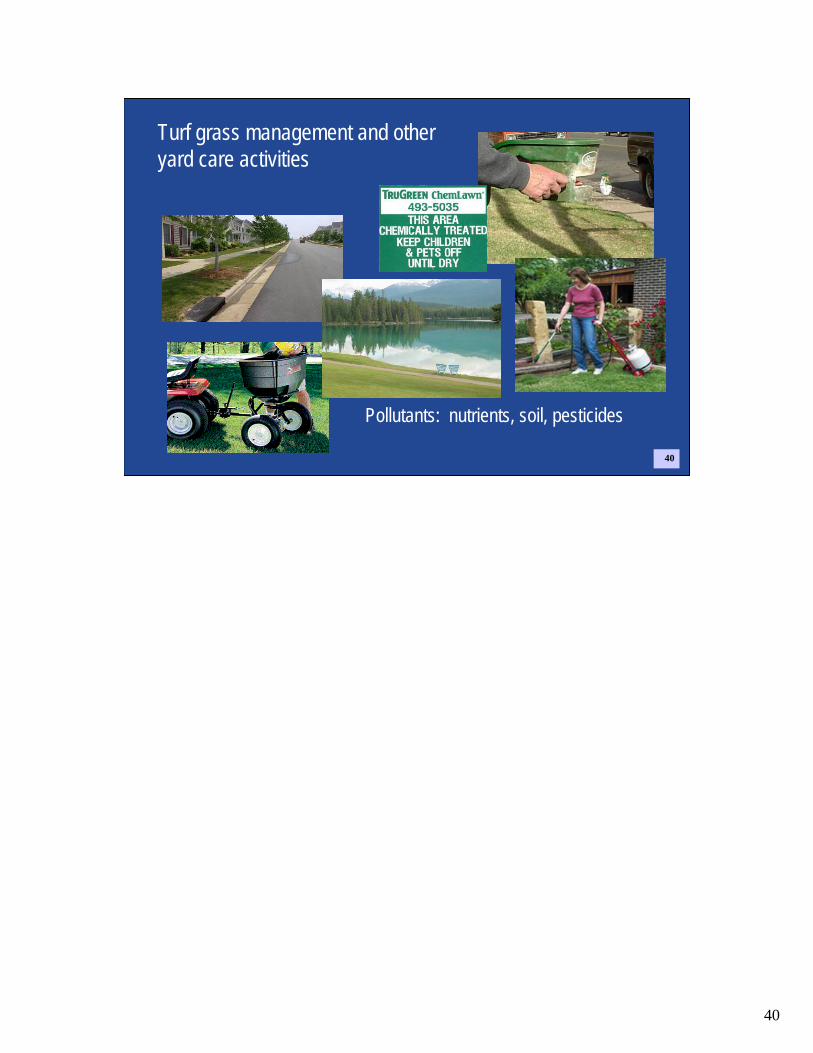
Turf grass management and other yard care activities
Pollutants: nutrients, soil, pesticides
40

41
41
42
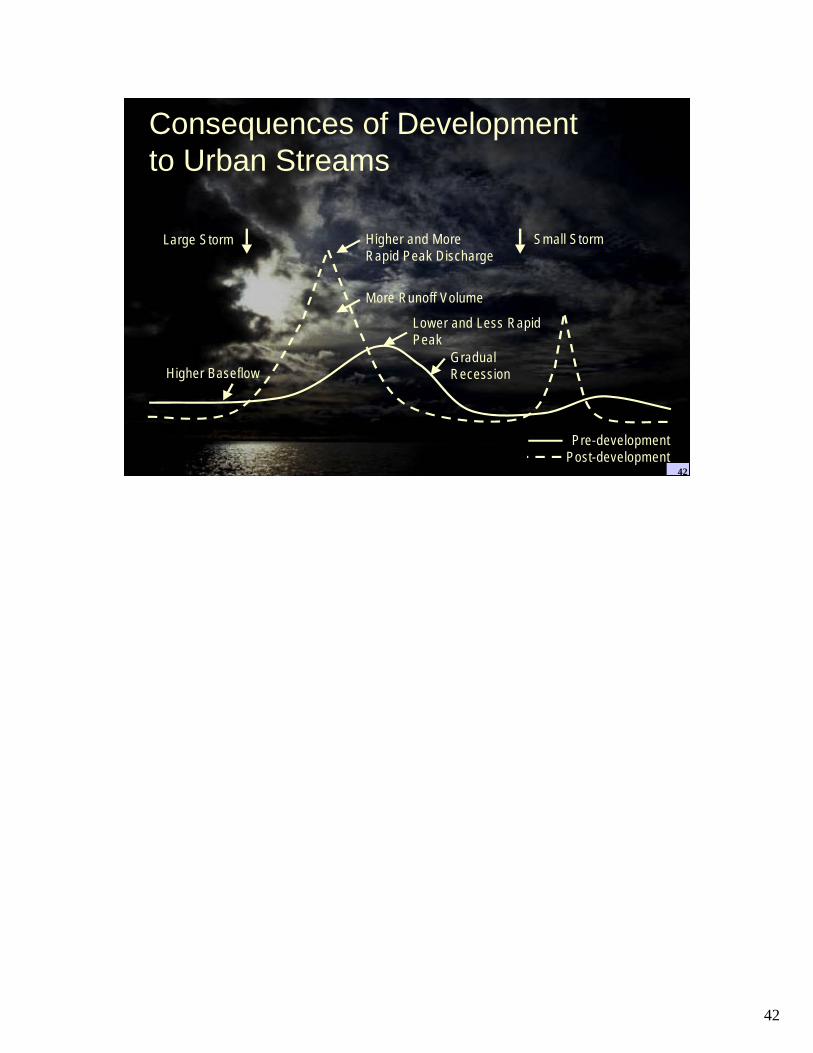
Large Storm Small Storm
Higher Baseflow
Higher and More Rapid Peak Discharge
More Runoff Volume
Lower and Less Rapid Peak
GradualRecession
Pre-developmentPost-development
Large Storm Small Storm
Higher Baseflow
Higher and More Rapid Peak Discharge
More Runoff Volume
Lower and Less Rapid Peak
GradualRecession
Pre-developmentPost-development
Consequences of Development to Urban Streams
42
43
43
44
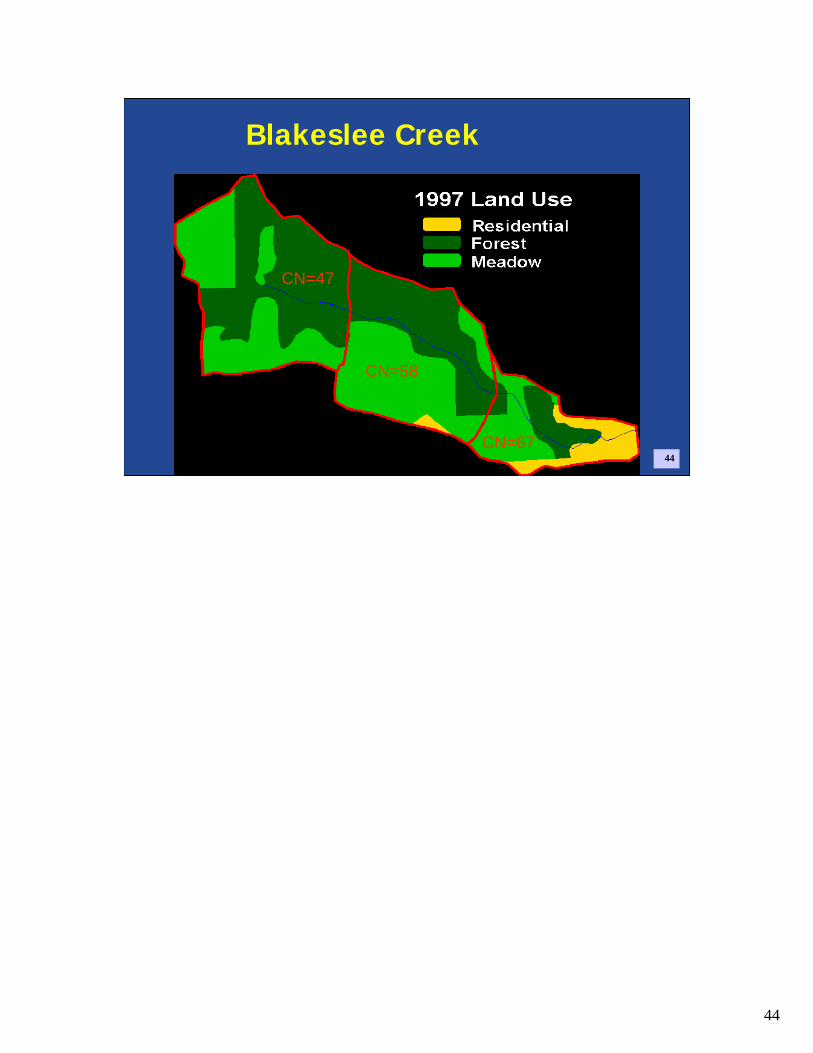
CN=47
CN=58
CN=67
Blakeslee Creek
44
45
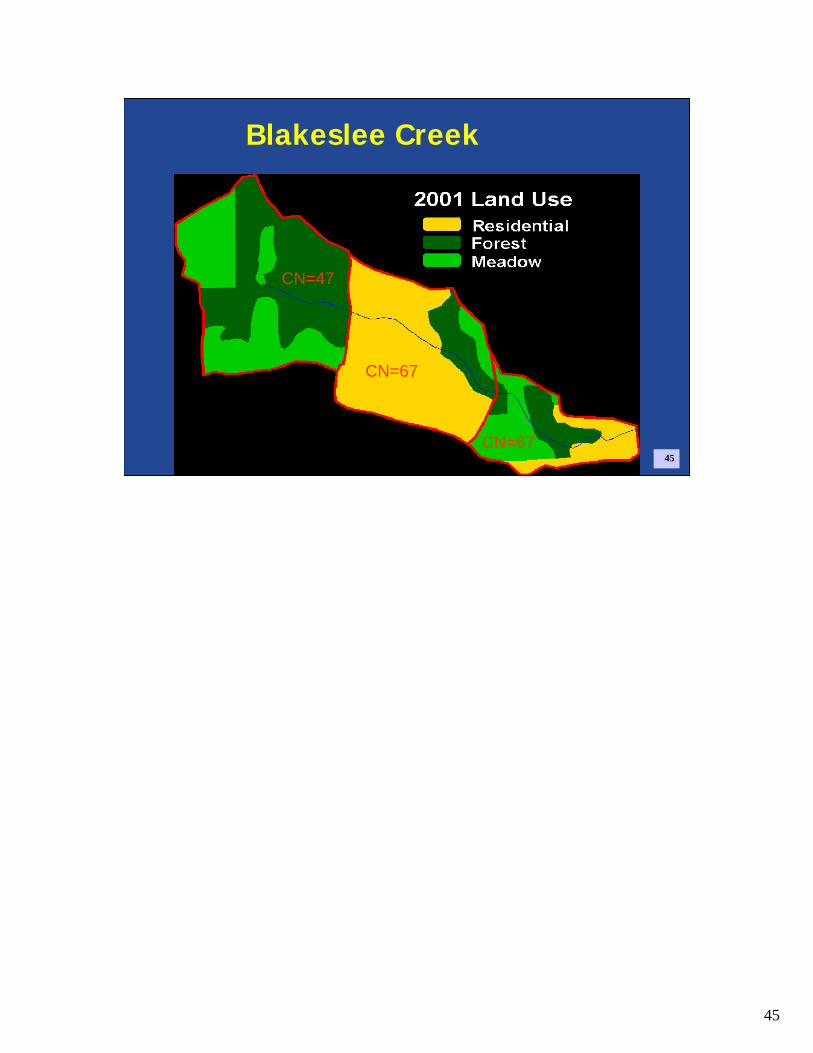
CN=47
CN=67
CN=67
Blakeslee Creek
45
46
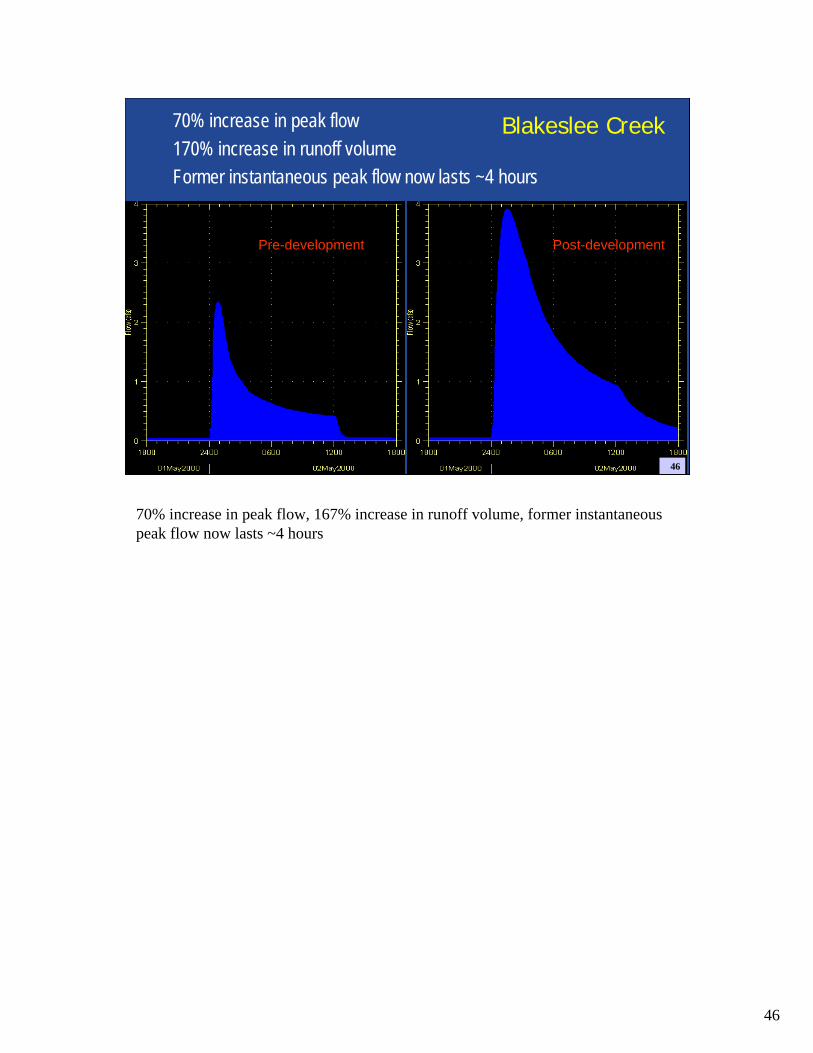
Pre-development Post-development
70% increase in peak flow170% increase in runoff volumeFormer instantaneous peak flow now lasts ~4 hours
Blakeslee Creek
46
70% increase in peak flow, 167% increase in runoff volume, former instantaneous peak flow now lasts ~4 hours
47
47
48
In watersheds with less than 5% impervious cover, streams are typically stable and pristine, maintaining good pool and riffle structure, a large wetted perimeter during low flow, and a good riparian canopy coverage.
48
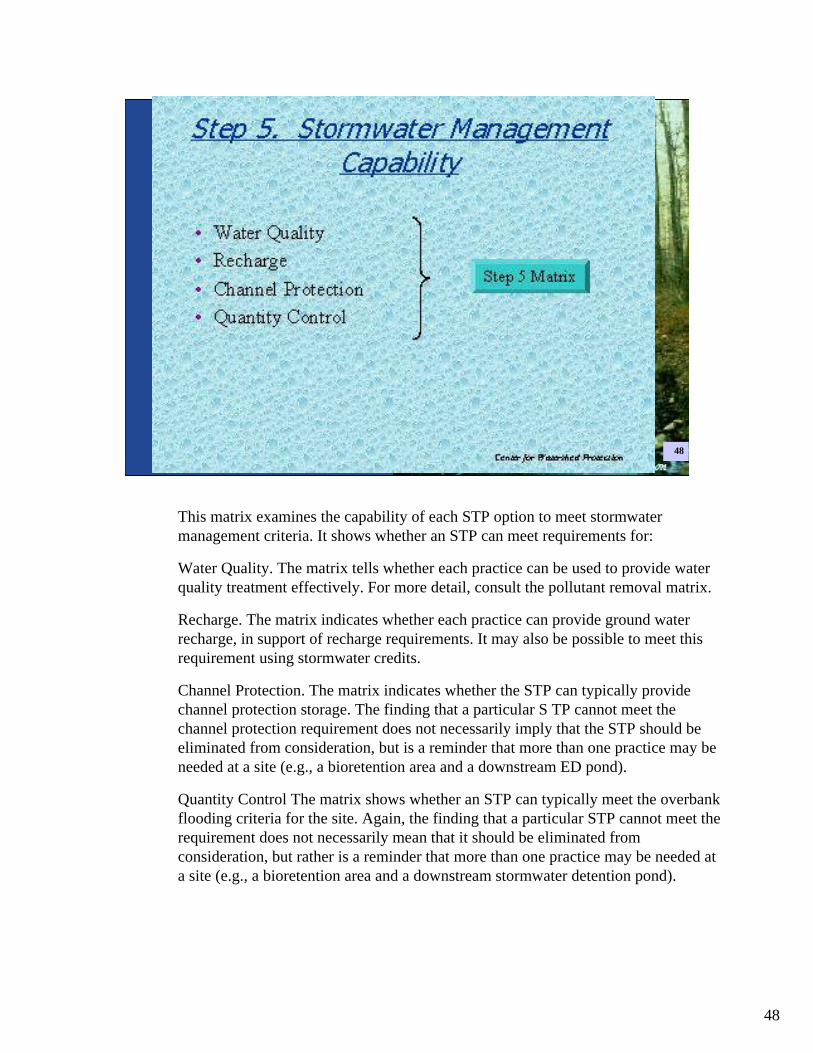
This matrix examines the capability of each STP option to meet stormwater management criteria. It shows whether an STP can meet requirements for:
Water Quality. The matrix tells whether each practice can be used to provide water quality treatment effectively. For more detail, consult the pollutant removal matrix.
Recharge. The matrix indicates whether each practice can provide ground water recharge, in support of recharge requirements. It may also be possible to meet this requirement using stormwater credits.
Channel Protection. The matrix indicates whether the STP can typically provide channel protection storage. The finding that a particular S TP cannot meet the channel protection requirement does not necessarily imply that the STP should be eliminated from consideration, but is a reminder that more than one practice may be needed at a site (e.g., a bioretention area and a downstream ED pond).
Quantity Control The matrix shows whether an STP can typically meet the overbank flooding criteria for the site. Again, the finding that a particular STP cannot meet the requirement does not necessarily mean that it should be eliminated from consideration, but rather is a reminder that more than one practice may be needed at a site (e.g., a bioretention area and a downstream stormwater detention pond).
49
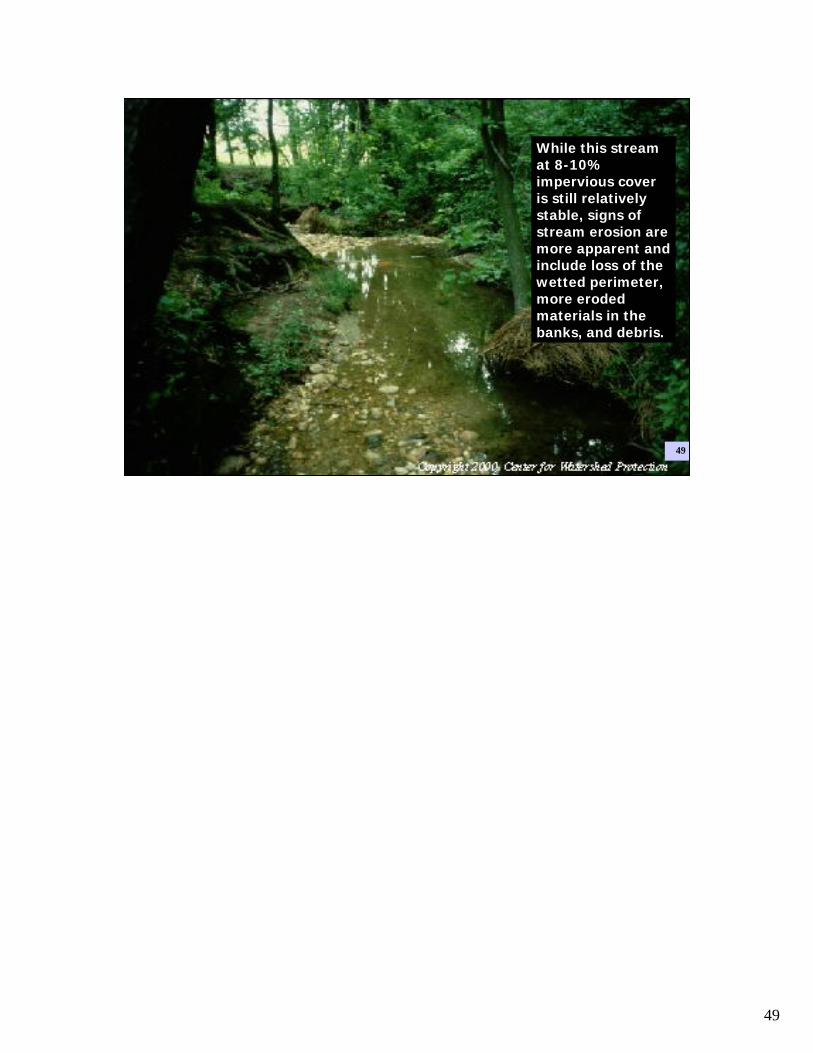
While this stream at 8-10% impervious cover is still relatively stable, signs of stream erosion are more apparent and include loss of the wetted perimeter, more eroded materials in the banks, and debris.
49
50
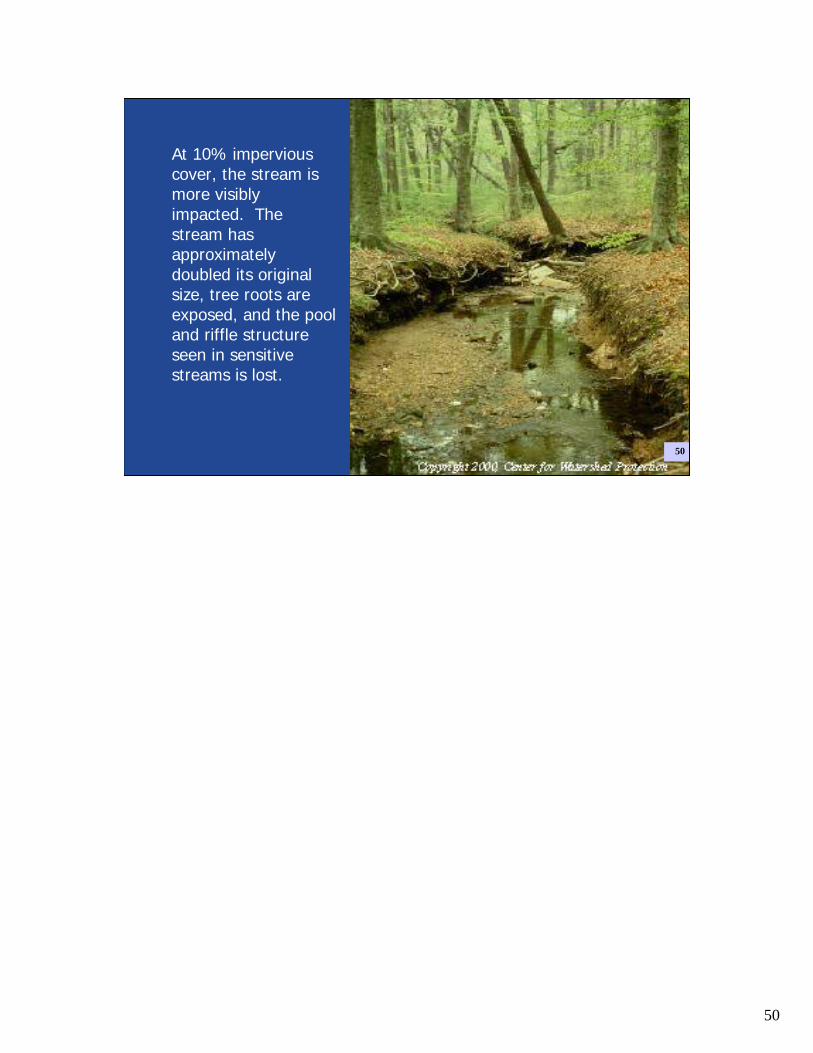
At 10% impervious cover, the stream is more visibly impacted. The stream has approximately doubled its original size, tree roots are exposed, and the pool and riffle structure seen in sensitive streams is lost.
50

51
Active erosion becomes much more evident at 20% impervious cover with decreased substrate quality due to more material “flushing” through the system.
51
52
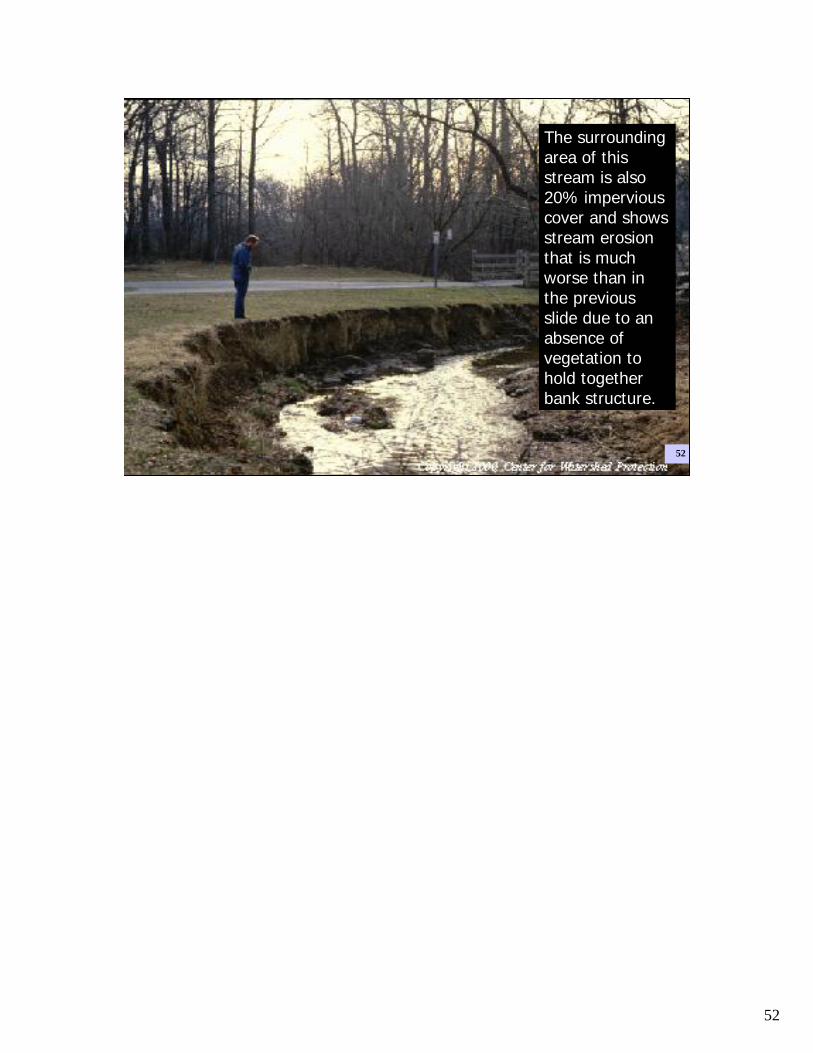
The surrounding area of this stream is also 20% impervious cover and shows stream erosion that is much worse than in the previous slide due to an absence of vegetation to hold together bank structure.
52
53
Questions??Questions??
53
54
Part IIIPart III
What is the NPDES stormwater program all about and how can I get
involved?
54
55
Regulatory History Regulatory History • Before 1987 stormwater considered a non-
point source and not regulated
• Water Quality Act of 1987 brought some stormwater into the NPDES program– Permits required for municipalities over 100,000– Permits required for industrial activities– EPA must consider who else to permit “to protect
water quality”
55
56
The “Phases”The “Phases”
• Phase I – 1990– Medium and large municipalities (over 100,000)– Construction sites (over 5 acres)– Industrial activity (10 categories)
• Phase II – 1999– Smaller municipalities in “urbanized areas”– Construction sites (1-5 acres)– “No exposure” expanded
56
57
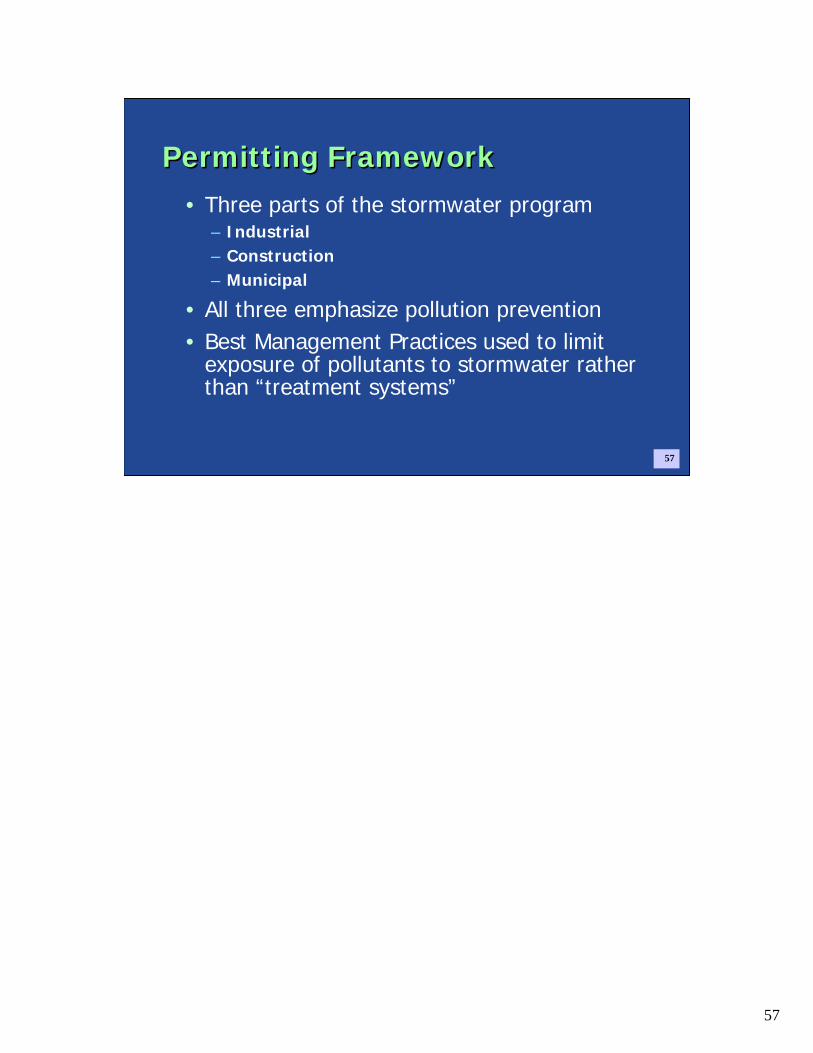
Permitting FrameworkPermitting Framework• Three parts of the stormwater program
– Industrial– Construction– Municipal
• All three emphasize pollution prevention• Best Management Practices used to limit
exposure of pollutants to stormwater rather than “treatment systems”
57

58
Municipal StormwaterMunicipal Stormwater• Stormwater discharges from municipal storm
sewer systems in urban areas meeting appropriate population and population density criteria to qualify as an ‘urbanizing area’ as determined by the U.S. Census Bureau.
58
592
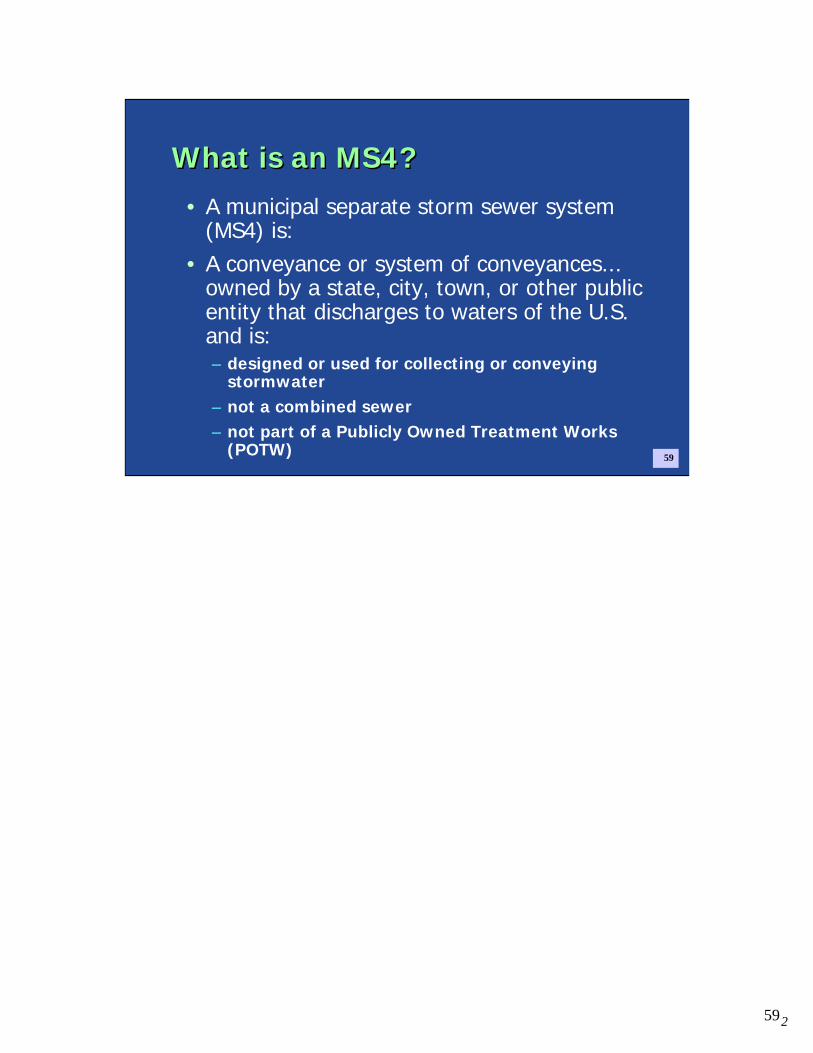
What is an MS4?What is an MS4?• A municipal separate storm sewer system
(MS4) is:• A conveyance or system of conveyances...
owned by a state, city, town, or other public entity that discharges to waters of the U.S. and is:– designed or used for collecting or conveying
stormwater– not a combined sewer– not part of a Publicly Owned Treatment Works
(POTW) 59
60
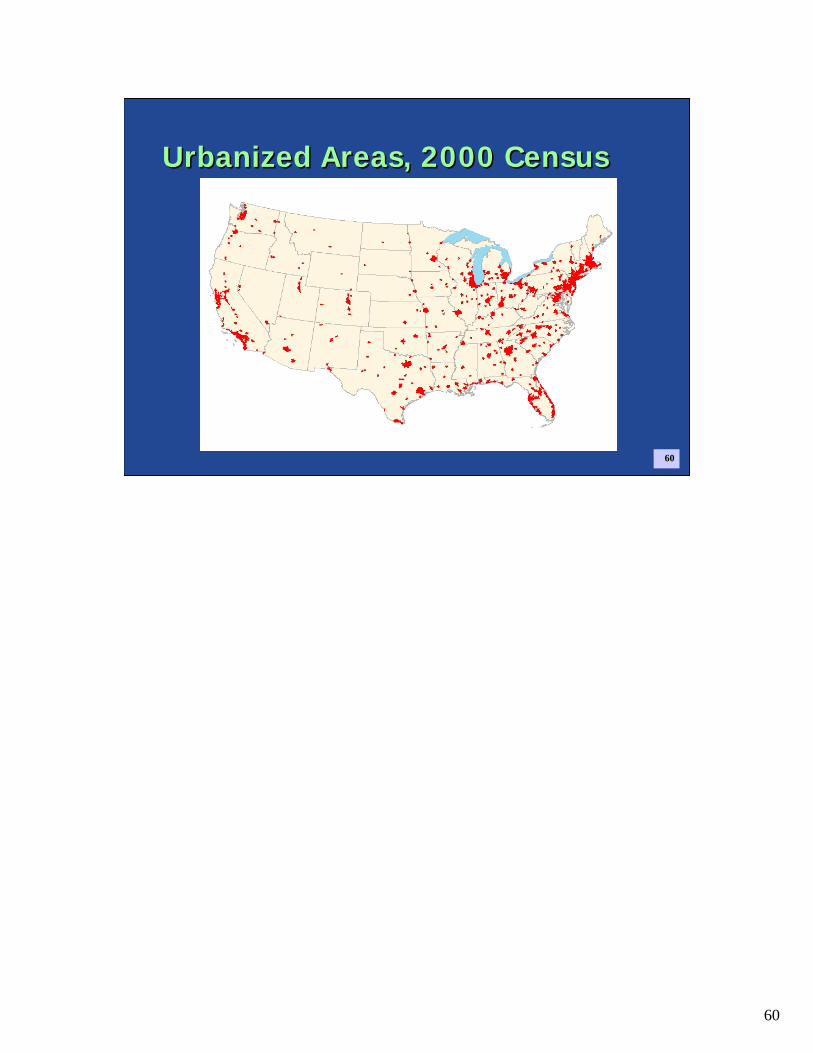
Urbanized Areas, 2000 CensusUrbanized Areas, 2000 Census
60
61
61
62
Phase I CoveragePhase I Coverage• Covers municipalities with populations over
100,000
• Many MS4s in places less than 100,000 have been designated by the permitting authority
• Approximately 235 permits covering 1,000 MS4s have been issued
62

63
Phase II CoveragePhase II Coverage• Covers approximately 5000 smaller
municipalities and governmental entities in “urbanized areas”
• Urbanized areas are determined by the Census Bureau
• Permitting authorities can also designate additional small MS4s that are outside of urbanized areas 63

64
Operators of MS4 SystemsOperators of MS4 Systems• Cities• Towns• Counties• Townships• Boroughs• Road Commissions• Drain Commissions• Drainage Districts
• Public School Systems• Public Colleges and
Universities• State or Federal Prisons • State or Federal
Hospitals• Military Installations• State or National Parks• DOTs
64
65
Six Minimum MeasuresSix Minimum Measures• Public Education and Outreach• Public Involvement/Participation• Illicit Discharge Detection and Elimination• Construction Site Runoff Control• Post-Construction Stormwater Management in
New and Redevelopment• Pollution Prevention/Good Housekeeping for
Municipal Operations
65

66
Long Island Sound Study
City of San Diego
Southwest Michigan Water Partners
Public Education
66
67
How Can Watershed Groups Help?How Can Watershed Groups Help?
• Public Education– Unlimited opportunities!– Watershed awareness– Understanding of particularly important
problems– Changing citizen behaviors via “social
marketing”
67
68
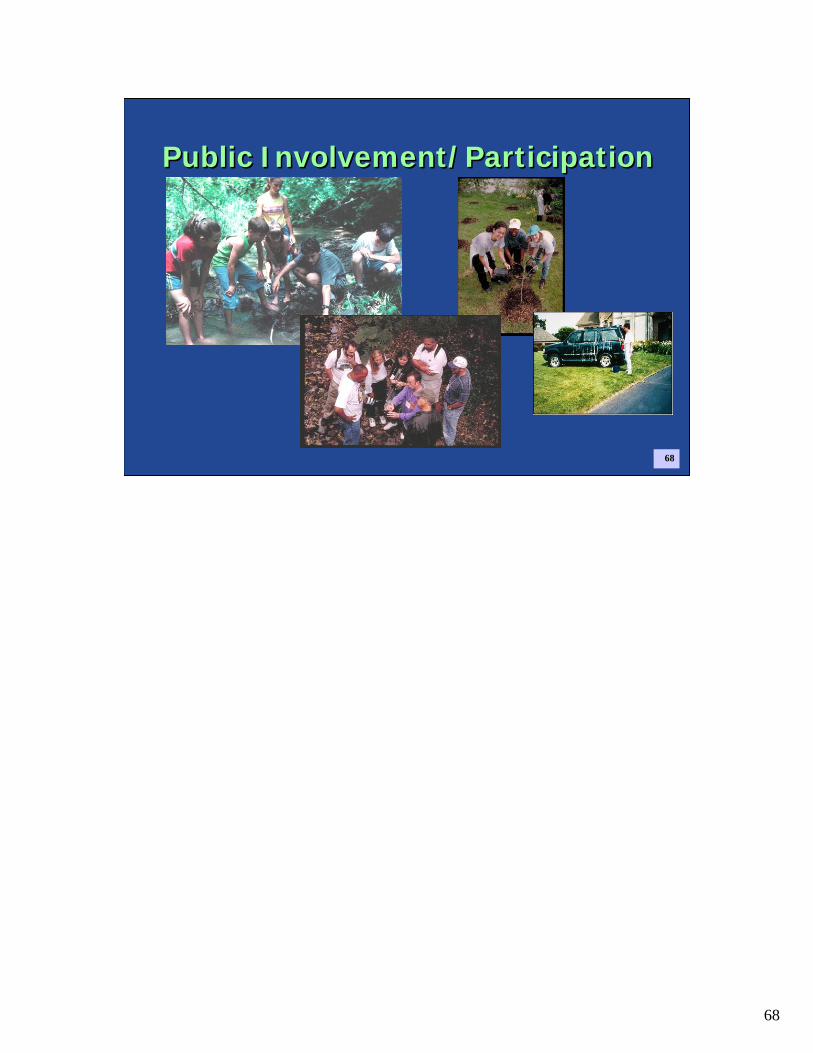
Public Involvement/ParticipationPublic Involvement/Participation
68

69
How Can Watershed Groups Help?How Can Watershed Groups Help?
• Public Participation– Foster the creation of and participate in
stormwater/watershed citizen advisory groups
– Watershed planning– Volunteer monitoring– Implementation of any of the other
minimum measures
69
70
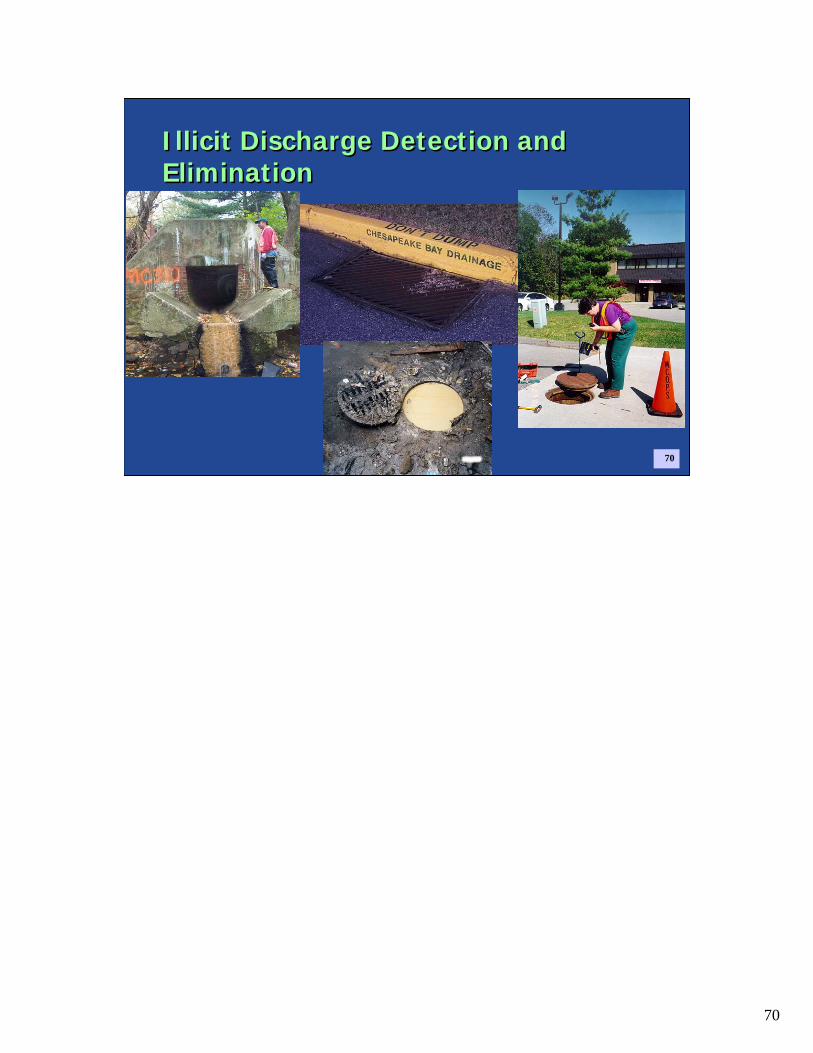
Illicit Discharge Detection and EliminationIllicit Discharge Detection and Elimination
70
71
How Can Watershed Groups Help?How Can Watershed Groups Help?
• Illicit Discharge Detection and Elimination– Increase citizen awareness– Publicize “hotline”– Staff hotline– Walk streams and survey outfalls– Educate business with potential for illicit
discharges
71
72
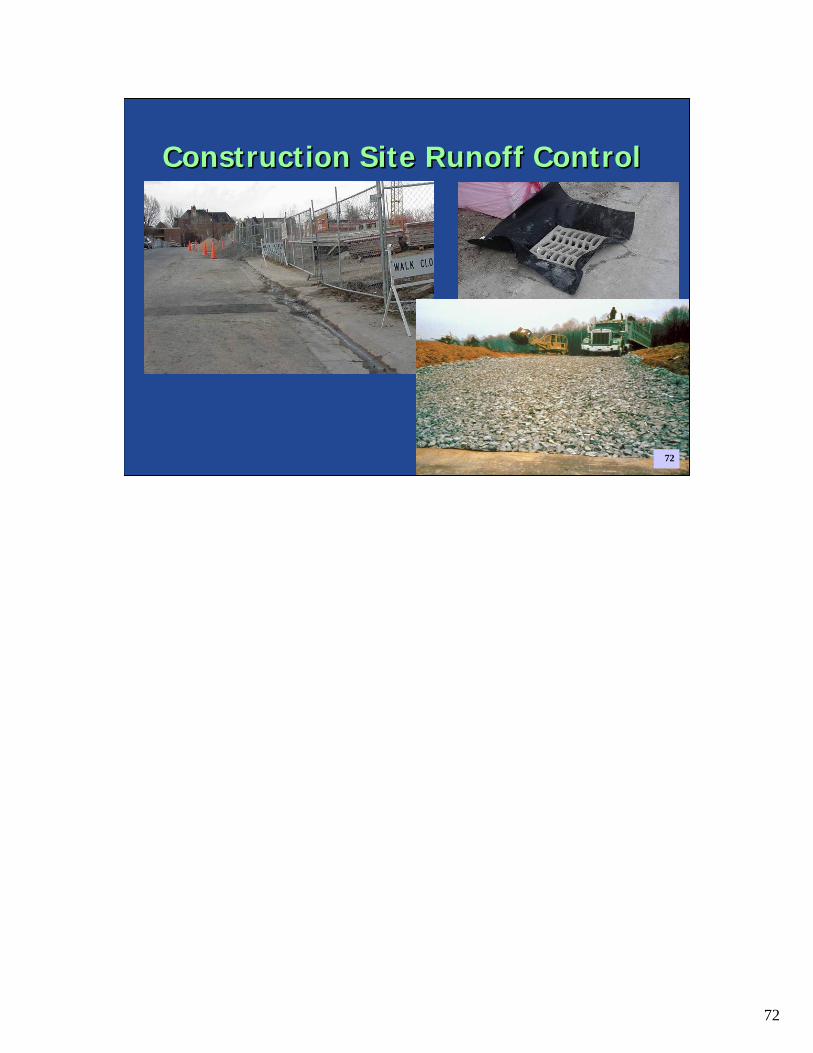
Construction Site Runoff ControlConstruction Site Runoff Control
72
73
How Can Watershed Groups Help?How Can Watershed Groups Help?
• Managing Construction Sites– Drive-by assessments of construction sites
and report results to municipality– Education of contractors and subcontractors
on sediment and erosion controls– Educate other citizens and groups on
recognizing common construction site problems
73
74
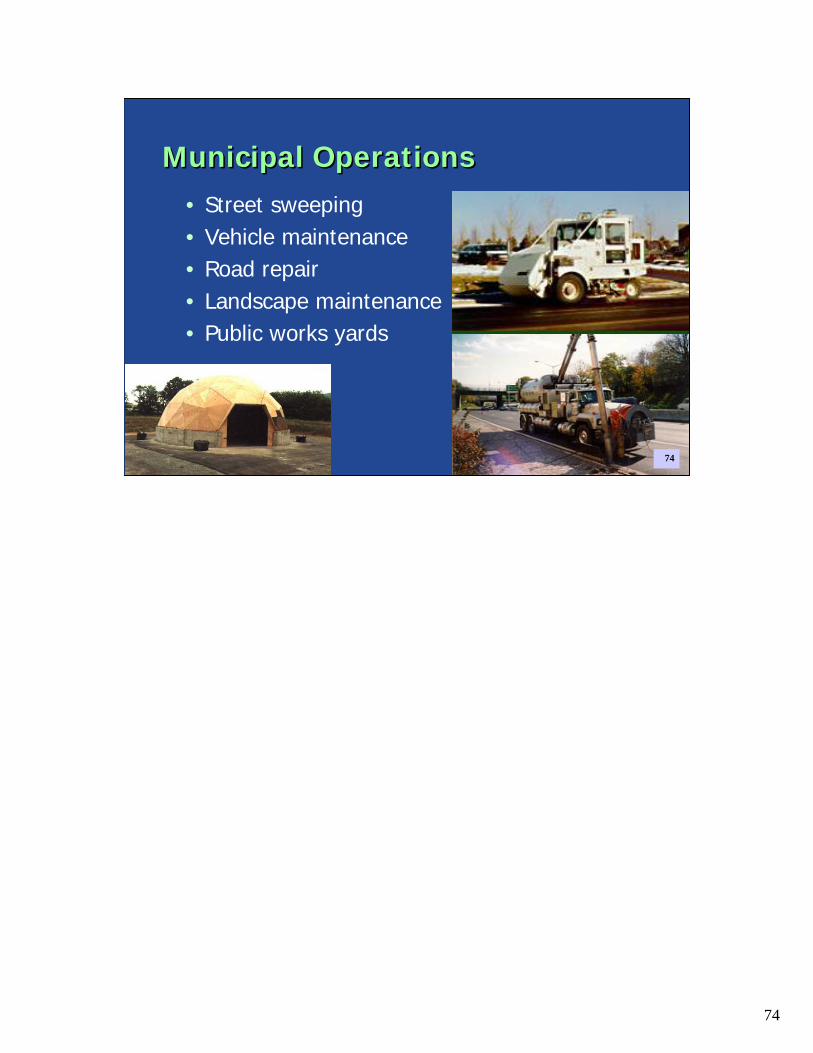
Municipal OperationsMunicipal Operations• Street sweeping• Vehicle maintenance• Road repair• Landscape maintenance• Public works yards
74
75
How Can Watershed Groups Help?How Can Watershed Groups Help?
• Municipal Operations– Press municipal managers to properly train
public works employees on good housekeeping/pollution prevention practices
– Help raise awareness among other municipal employees (police, fire, building inspectors) to “see” stormwater problems
– Report problems when identified– Report any catch basins and other facilities
needing maintenance
75
76
76
Questions??Questions??
77
Part IVPart IV
Permanent or Post-Construction Runoff Controls
Smart Growth and Low Impact Development
77

78
Post-Construction Stormwater ManagementPost-Construction Stormwater Management
78
79
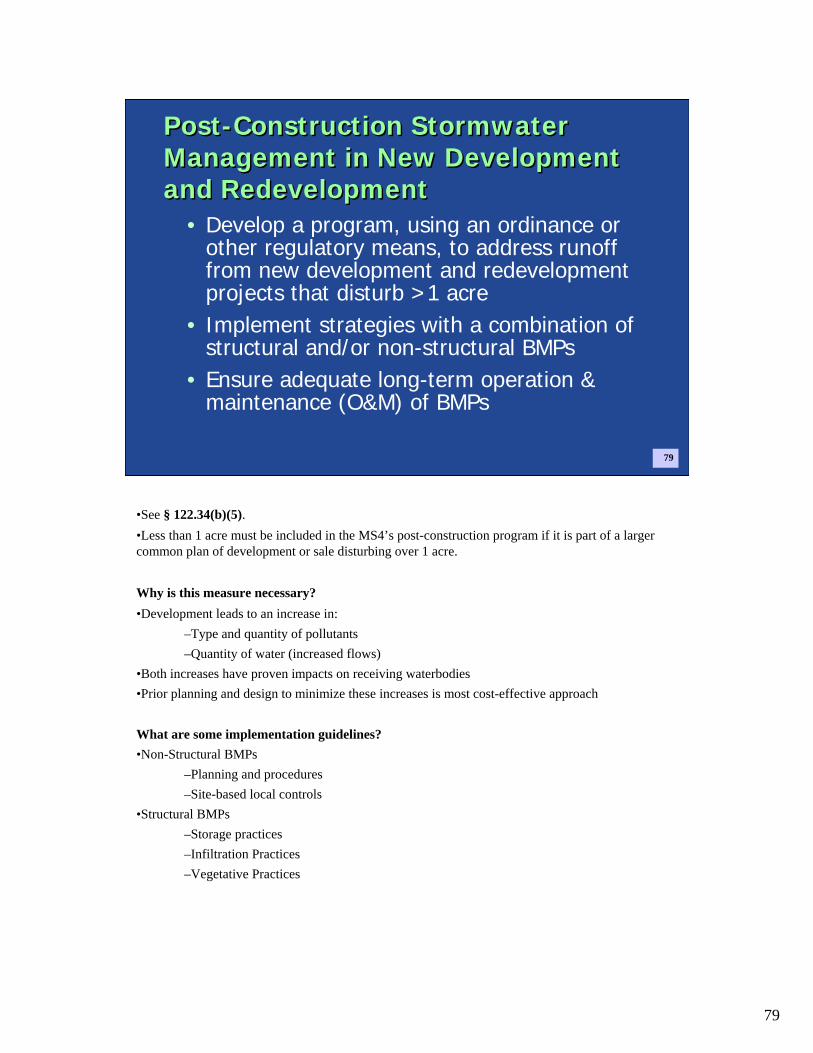
Post-Construction Stormwater Management in New Development and Redevelopment
Post-Construction Stormwater Management in New Development and Redevelopment
• Develop a program, using an ordinance or other regulatory means, to address runoff from new development and redevelopment projects that disturb >1 acre
• Implement strategies with a combination of structural and/or non-structural BMPs
• Ensure adequate long-term operation & maintenance (O&M) of BMPs
79
•See § 122.34(b)(5).•Less than 1 acre must be included in the MS4’s post-construction program if it is part of a larger common plan of development or sale disturbing over 1 acre.
Why is this measure necessary?•Development leads to an increase in:
–Type and quantity of pollutants–Quantity of water (increased flows)
•Both increases have proven impacts on receiving waterbodies•Prior planning and design to minimize these increases is most cost-effective approach
What are some implementation guidelines?•Non-Structural BMPs
–Planning and procedures–Site-based local controls
•Structural BMPs–Storage practices–Infiltration Practices–Vegetative Practices
80
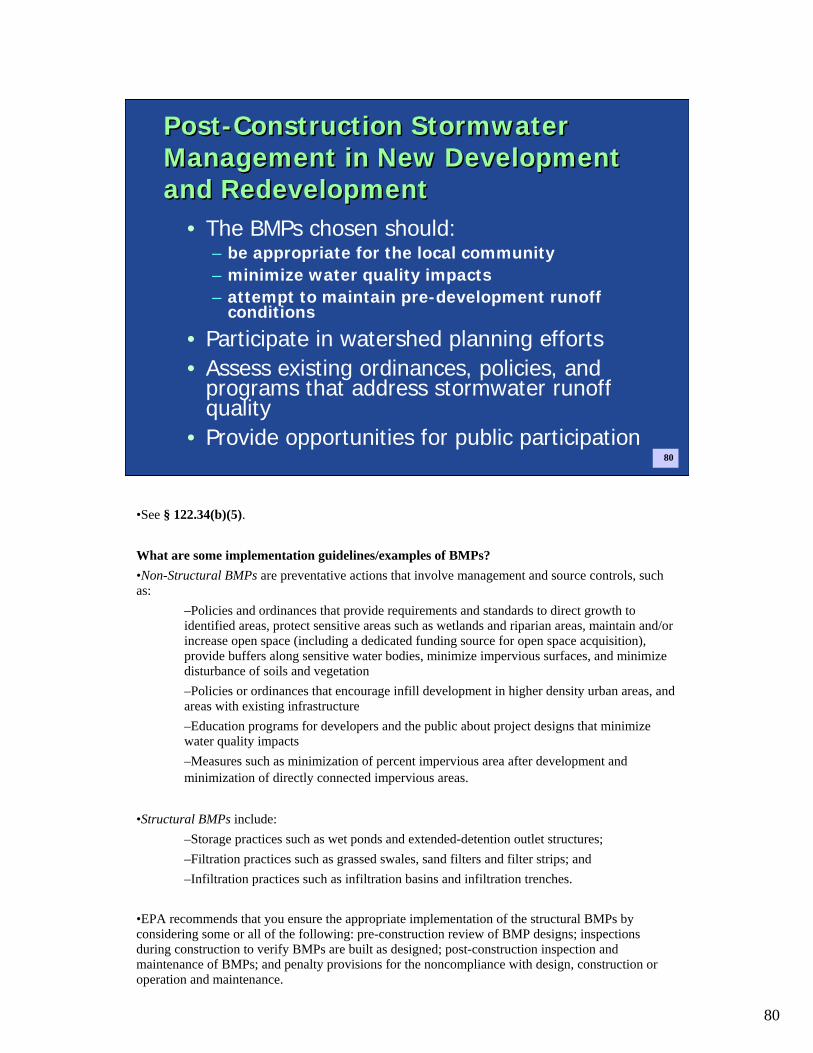
Post-Construction Stormwater Management in New Development and Redevelopment
Post-Construction Stormwater Management in New Development and Redevelopment
• The BMPs chosen should:– be appropriate for the local community– minimize water quality impacts– attempt to maintain pre-development runoff
conditions
• Participate in watershed planning efforts• Assess existing ordinances, policies, and
programs that address stormwater runoff quality
• Provide opportunities for public participation80
•See § 122.34(b)(5).
What are some implementation guidelines/examples of BMPs?•Non-Structural BMPs are preventative actions that involve management and source controls, such as:
–Policies and ordinances that provide requirements and standards to direct growth to identified areas, protect sensitive areas such as wetlands and riparian areas, maintain and/or increase open space (including a dedicated funding source for open space acquisition), provide buffers along sensitive water bodies, minimize impervious surfaces, and minimize disturbance of soils and vegetation–Policies or ordinances that encourage infill development in higher density urban areas, and areas with existing infrastructure–Education programs for developers and the public about project designs that minimize water quality impacts–Measures such as minimization of percent impervious area after development and minimization of directly connected impervious areas.
•Structural BMPs include: –Storage practices such as wet ponds and extended-detention outlet structures; –Filtration practices such as grassed swales, sand filters and filter strips; and –Infiltration practices such as infiltration basins and infiltration trenches.
•EPA recommends that you ensure the appropriate implementation of the structural BMPs by considering some or all of the following: pre-construction review of BMP designs; inspections during construction to verify BMPs are built as designed; post-construction inspection and maintenance of BMPs; and penalty provisions for the noncompliance with design, construction or operation and maintenance.
81
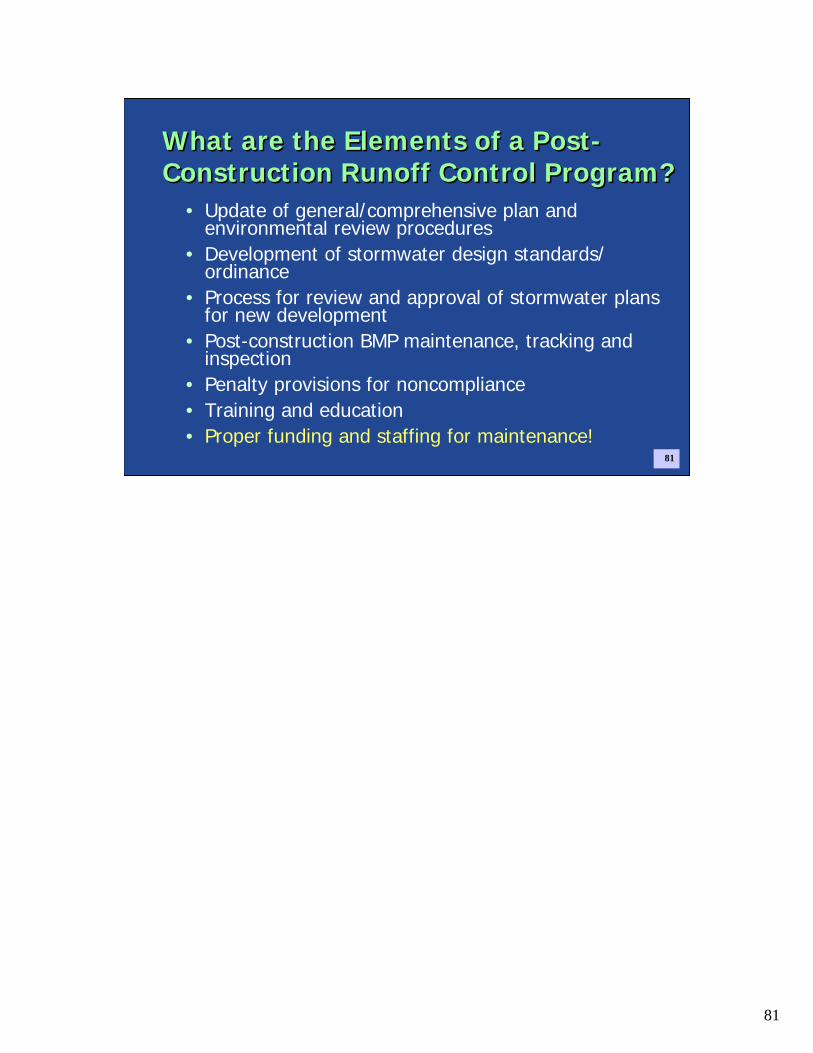
What are the Elements of a Post-Construction Runoff Control Program?What are the Elements of a Post-Construction Runoff Control Program?
• Update of general/comprehensive plan and environmental review procedures
• Development of stormwater design standards/ ordinance
• Process for review and approval of stormwater plans for new development
• Post-construction BMP maintenance, tracking and inspection
• Penalty provisions for noncompliance• Training and education• Proper funding and staffing for maintenance!
81
82
Stormwater and Smart GrowthStormwater and Smart Growth
82

83
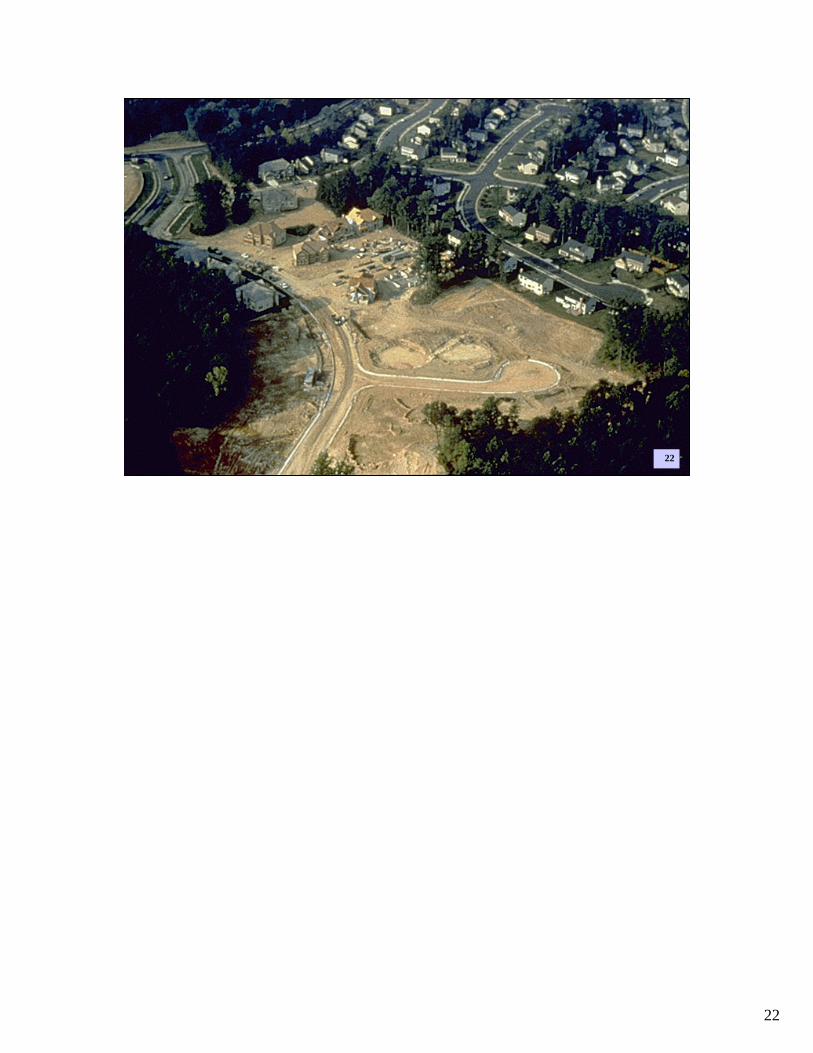
Trends in DevelopmentTrends in DevelopmentCurrent development trends
are characterized by low-density housing, farmland conversion, and dependence on cars, which:
• Consumes land at a faster rate• Transforms farmland• Separates houses from stores,
businesses, and other land uses• Increases time spent in cars
83
84
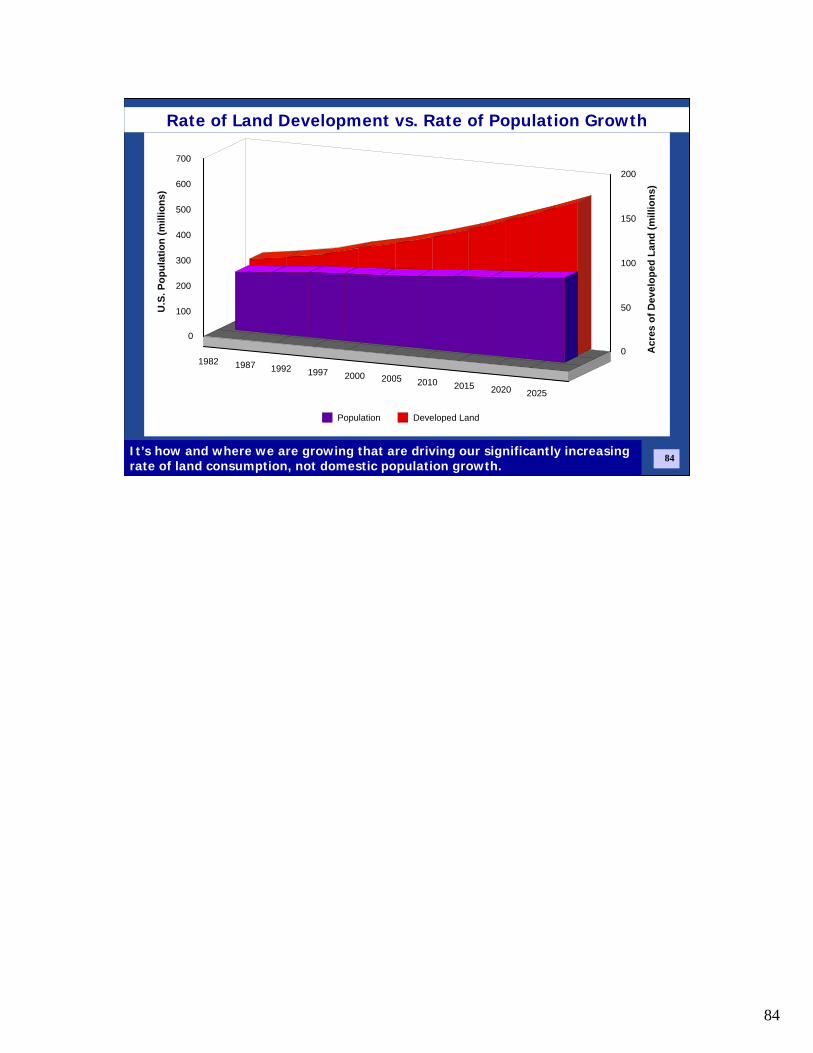
Rate of land development vs. population growth
1982 1987 1992 1997 2000 2005 2010 2015 2020 2025
0
100
200
300
400
500
600
700U
.S. P
opul
atio
n (m
illio
ns)
0
50
100
150
200
Acr
es o
f Dev
elop
ed L
and
(mill
ions
)
Population Developed Land
Rate of Land Development vs. Rate of Population Growth
It’s how and where we are growing that are driving our significantly increasing rate of land consumption, not domestic population growth.
84

85
OR
Low Density Higher Density
Which is Better for Water Quality on a Watershed Basis?Which is Better for Water Quality on a Watershed Basis?
85
86
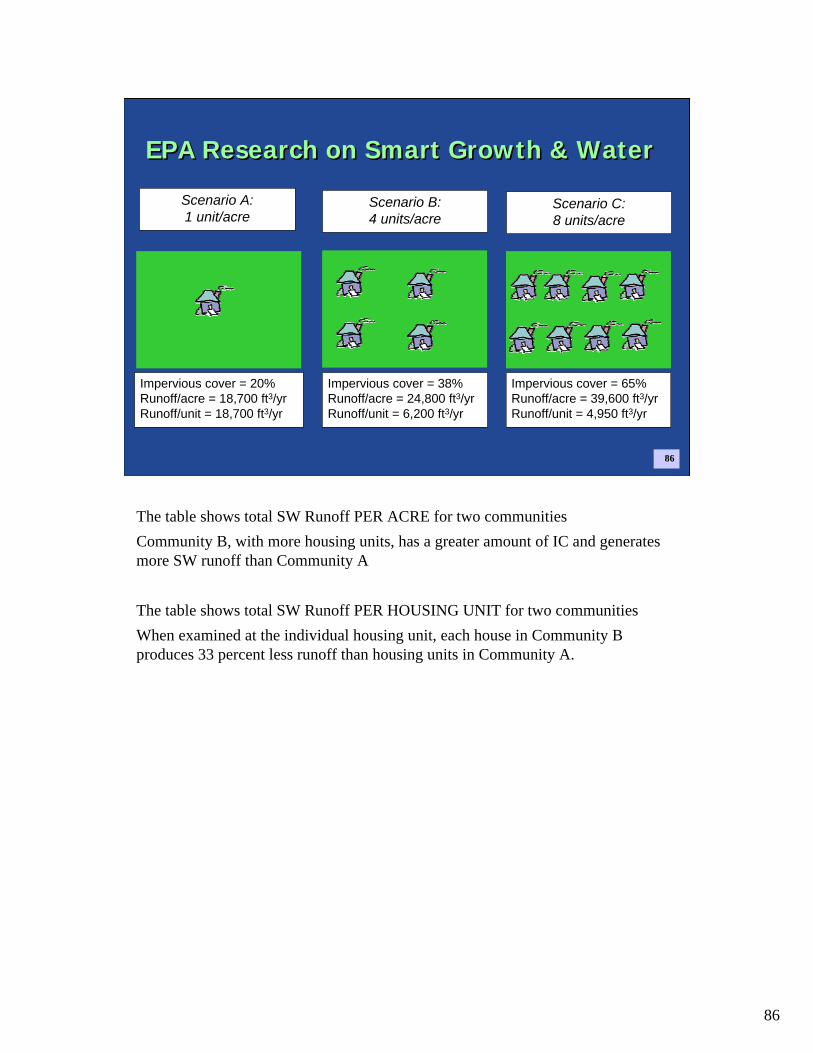
EPA Research on Smart Growth & WaterEPA Research on Smart Growth & Water
Scenario A: 1 unit/acre
Scenario B:4 units/acre
Scenario C:8 units/acre
Impervious cover = 20%Runoff/acre = 18,700 ft3/yrRunoff/unit = 18,700 ft3/yr
Impervious cover = 38%Runoff/acre = 24,800 ft3/yrRunoff/unit = 6,200 ft3/yr
Impervious cover = 65%Runoff/acre = 39,600 ft3/yrRunoff/unit = 4,950 ft3/yr
86
The table shows total SW Runoff PER ACRE for two communitiesCommunity B, with more housing units, has a greater amount of IC and generates more SW runoff than Community A
The table shows total SW Runoff PER HOUSING UNIT for two communitiesWhen examined at the individual housing unit, each house in Community B produces 33 percent less runoff than housing units in Community A.
87
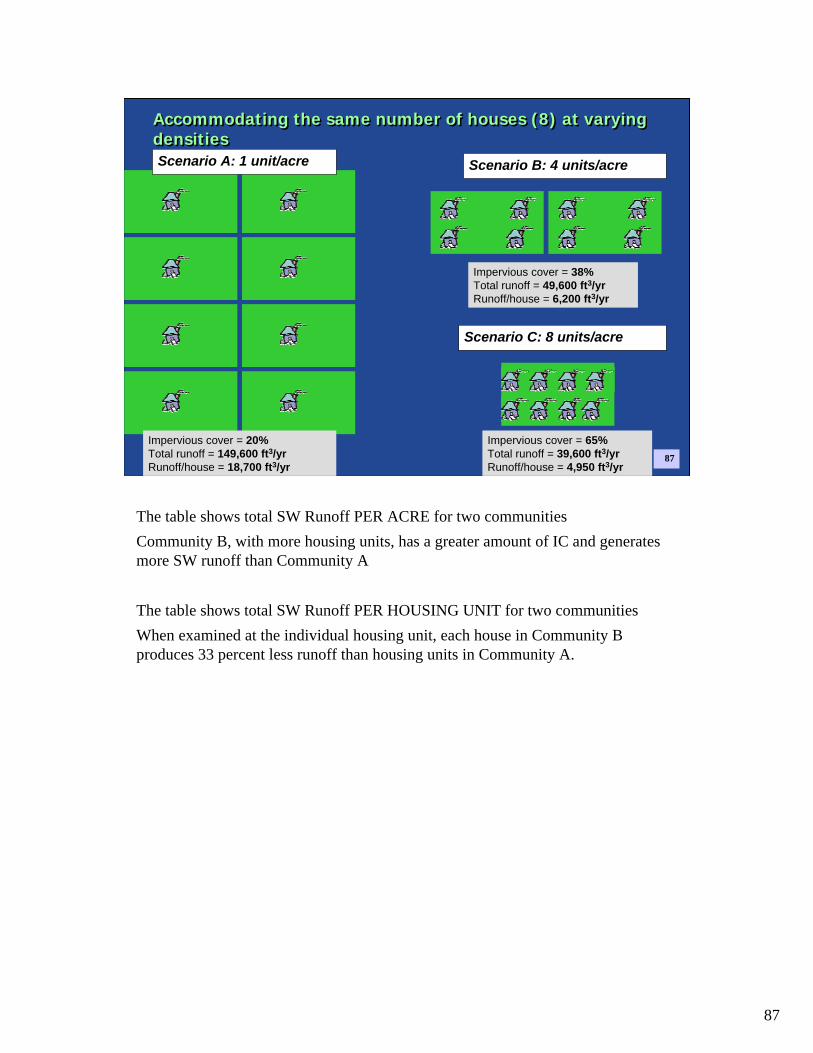
Scenario B: 4 units/acre
Impervious cover = 20%Total runoff = 149,600 ft3/yrRunoff/house = 18,700 ft3/yr
Impervious cover = 65%Total runoff = 39,600 ft3/yrRunoff/house = 4,950 ft3/yr
Scenario A: 1 unit/acre
Scenario C: 8 units/acre
Impervious cover = 38%Total runoff = 49,600 ft3/yrRunoff/house = 6,200 ft3/yr
Accommodating the same number of houses (8) at varying densitiesAccommodating the same number of houses (8) at varying densities
87
The table shows total SW Runoff PER ACRE for two communitiesCommunity B, with more housing units, has a greater amount of IC and generates more SW runoff than Community A
The table shows total SW Runoff PER HOUSING UNIT for two communitiesWhen examined at the individual housing unit, each house in Community B produces 33 percent less runoff than housing units in Community A.
88
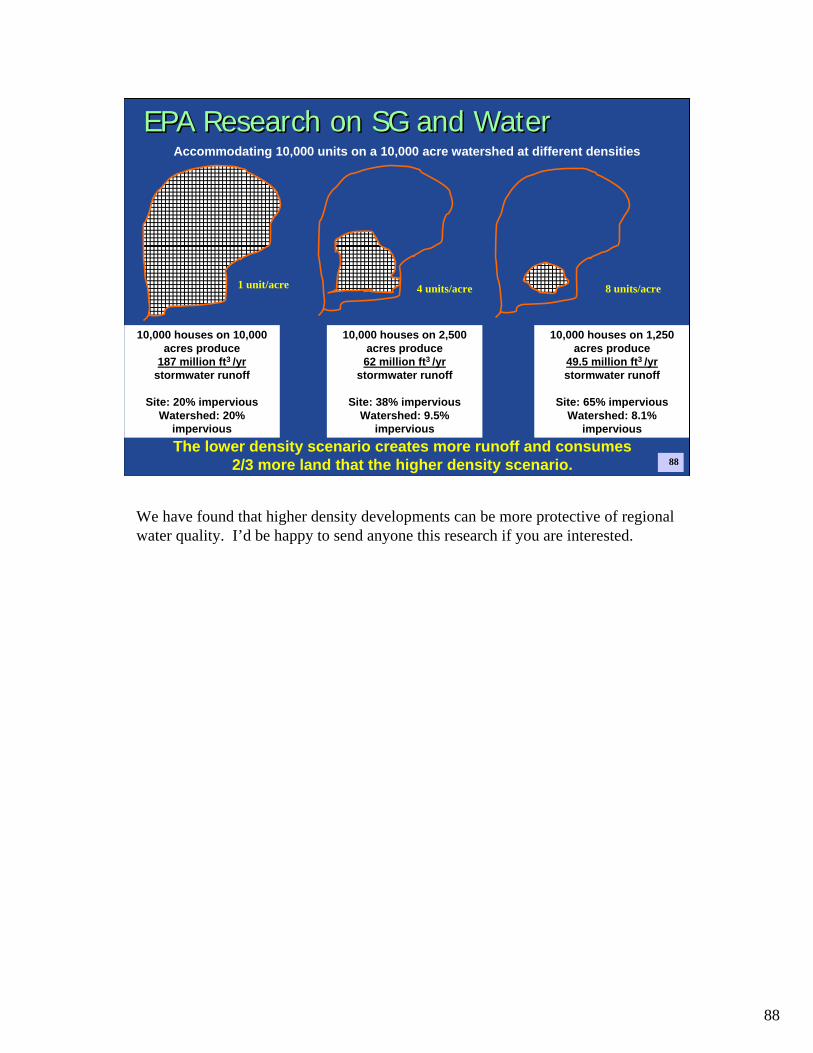
EPA Research on SG and WaterEPA Research on SG and WaterAccommodating 10,000 units on a 10,000 acre watershed at different densities
10,000 houses on 10,000 acres produce
187 million ft3 /yrstormwater runoff
Site: 20% impervious Watershed: 20%
impervious
10,000 houses on 2,500 acres produce62 million ft3 /yr
stormwater runoff
Site: 38% impervious Watershed: 9.5%
impervious
10,000 houses on 1,250 acres produce
49.5 million ft3 /yrstormwater runoff
Site: 65% impervious Watershed: 8.1%
imperviousThe lower density scenario creates more runoff and consumes
2/3 more land that the higher density scenario.
1 unit/acre 4 units/acre 8 units/acre
88
We have found that higher density developments can be more protective of regional water quality. I’d be happy to send anyone this research if you are interested.
89
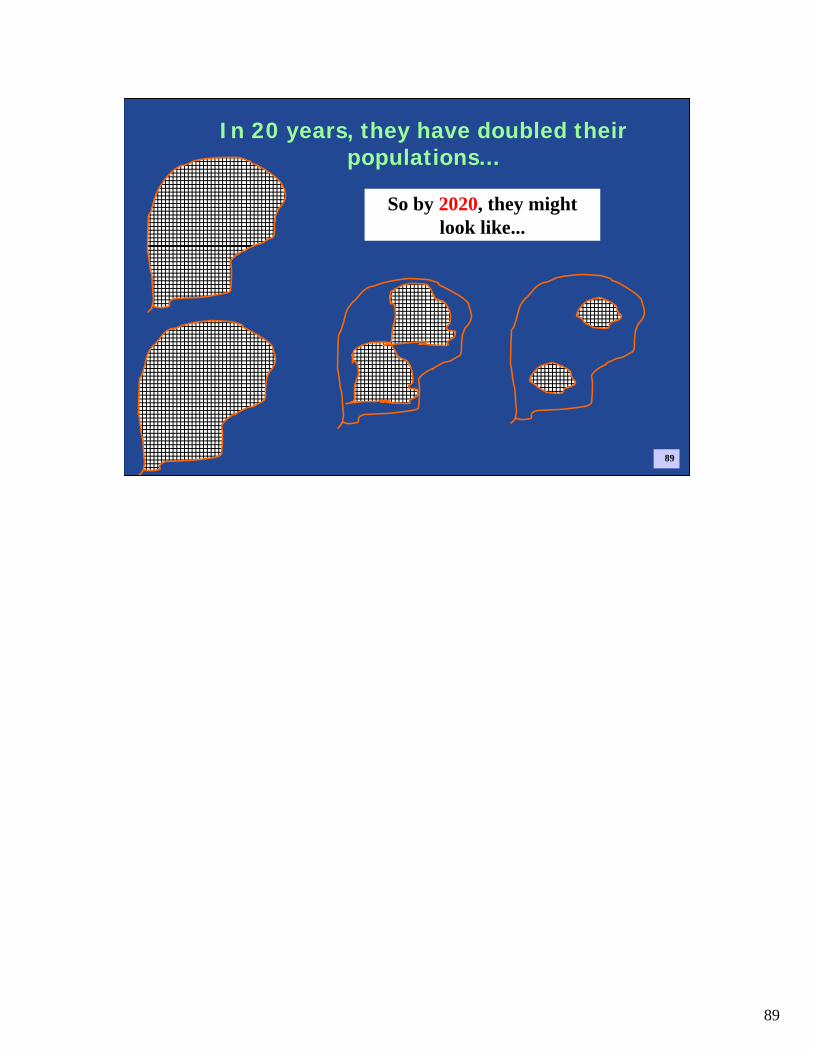
In 20 years, they have doubled their populations...
So by 2020, they might look like...
89

90
In another 20 years, they have doubled their populations, again...
So by 2040, they might look like...
4 watersheds totally built out
2 watersheds partially built out 1 watershed
partially built out
90
91
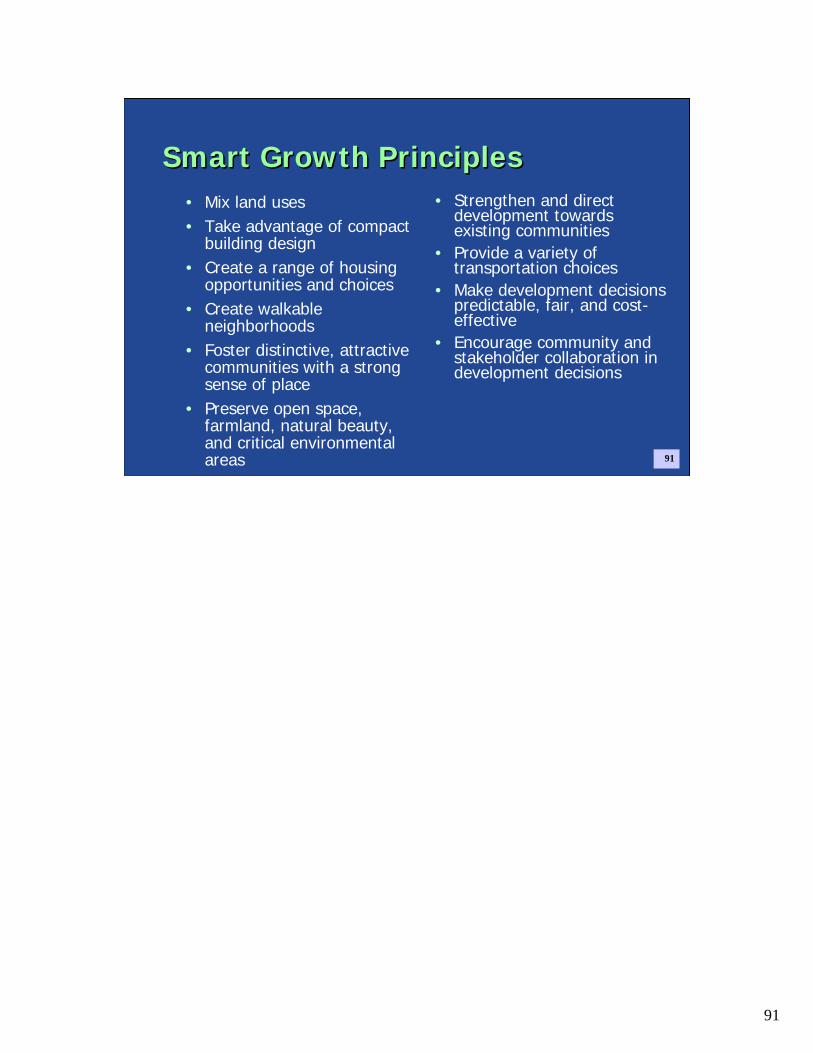
Smart Growth Principles Smart Growth Principles • Mix land uses• Take advantage of compact
building design• Create a range of housing
opportunities and choices• Create walkable
neighborhoods • Foster distinctive, attractive
communities with a strong sense of place
• Preserve open space, farmland, natural beauty, and critical environmental areas
• Strengthen and direct development towards existing communities
• Provide a variety of transportation choices
• Make development decisions predictable, fair, and cost-effective
• Encourage community and stakeholder collaboration in development decisions
91

92
Water Quality & Smart GrowthWater Quality & Smart Growth• Density and
imperviousness are not equivalent
• Lawns do not equal undisturbed land, such as forests or meadows
• Low-density developments have more impervious infrastructure
• Growth is coming to the region—limiting density on a site doesn’t eliminate that growth
92
I know I was invited to speak about the social and economic benefits of smart growth strategies, I did want to take a few minutes to discuss EPA’s perspective on smart growth and water quality– because this is a watershed conference. Some local governments think that higher density developments are worse for water quality because of the increase in IC. So our office set out to see if that was true. These are the critical assumptions we used for that research. I know I was invited to speak about the social and economic benefits of smart growth strategies, I did want to take a few minutes to discuss EPA’s perspective on smart growth and water quality.
93
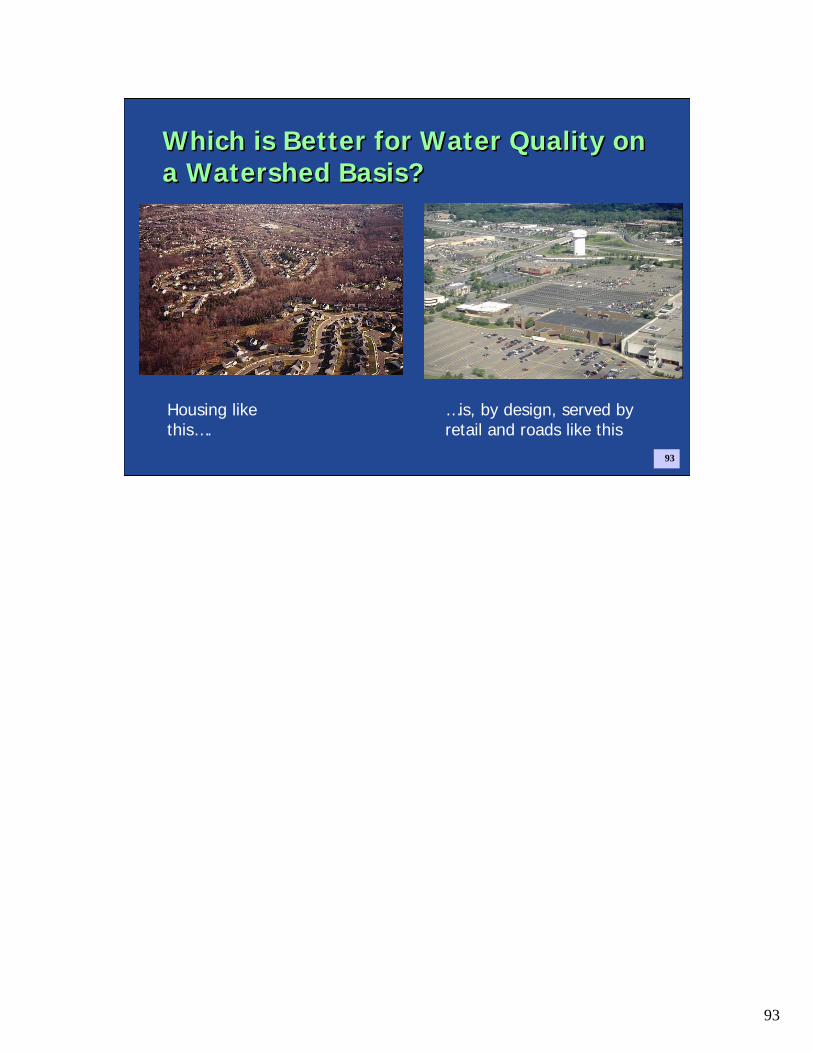
Which is Better for Water Quality on a Watershed Basis?Which is Better for Water Quality on a Watershed Basis?
Housing like this….
…is, by design, served by retail and roads like this
93
94
Low Impact DevelopmentLow Impact Development
94
95
95
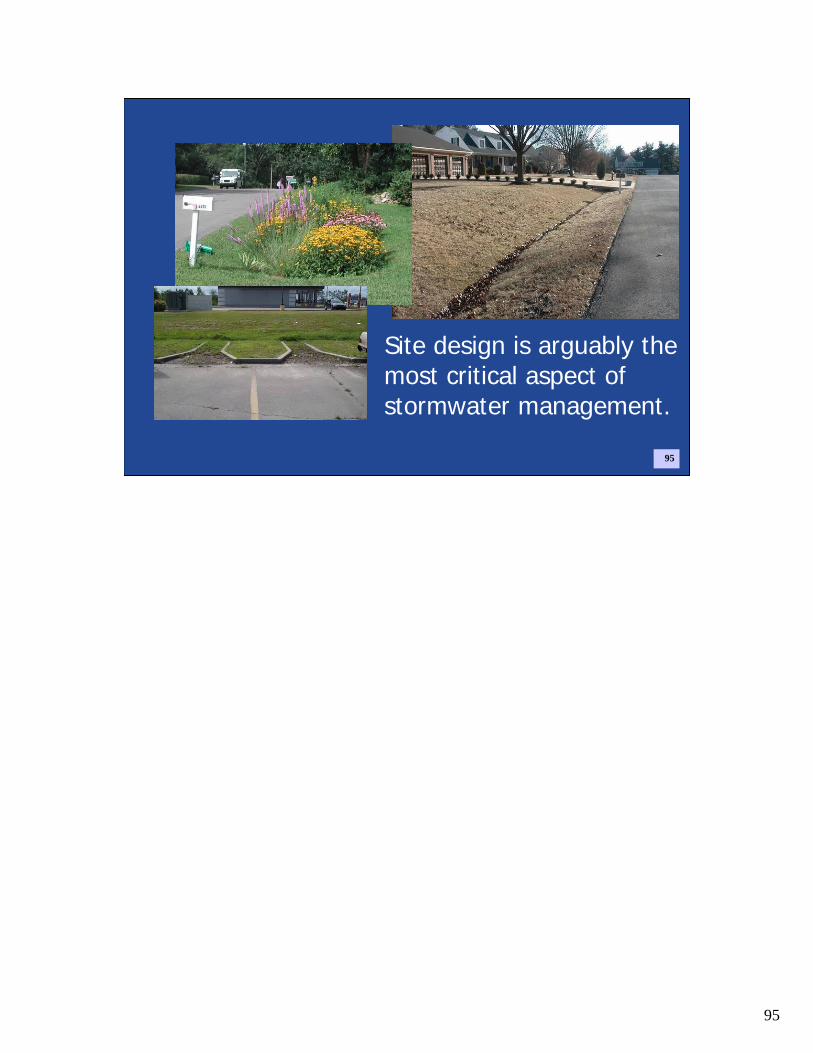
Site design is arguably the most critical aspect of stormwater management.
96
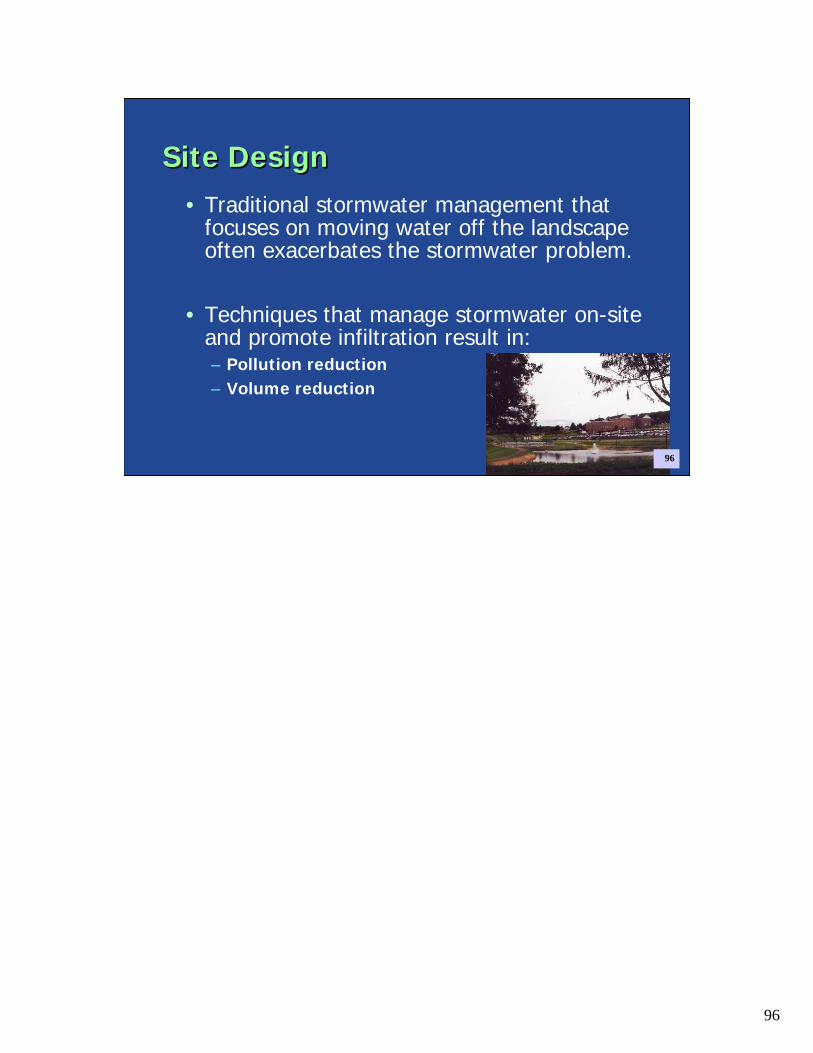
Site DesignSite Design• Traditional stormwater management that
focuses on moving water off the landscape often exacerbates the stormwater problem.
• Techniques that manage stormwater on-site and promote infiltration result in:– Pollution reduction– Volume reduction
96

97
Basic Premise of Low Impact DevelopmentBasic Premise of Low Impact Development
• Design site to minimize pollutant loadings and runoff volumes and velocities
• Use distributed small scale treatment systems• Maximize infiltration/ground water recharge• Reduce infrastructure costs• Protect ecosystem functions and values
97
98
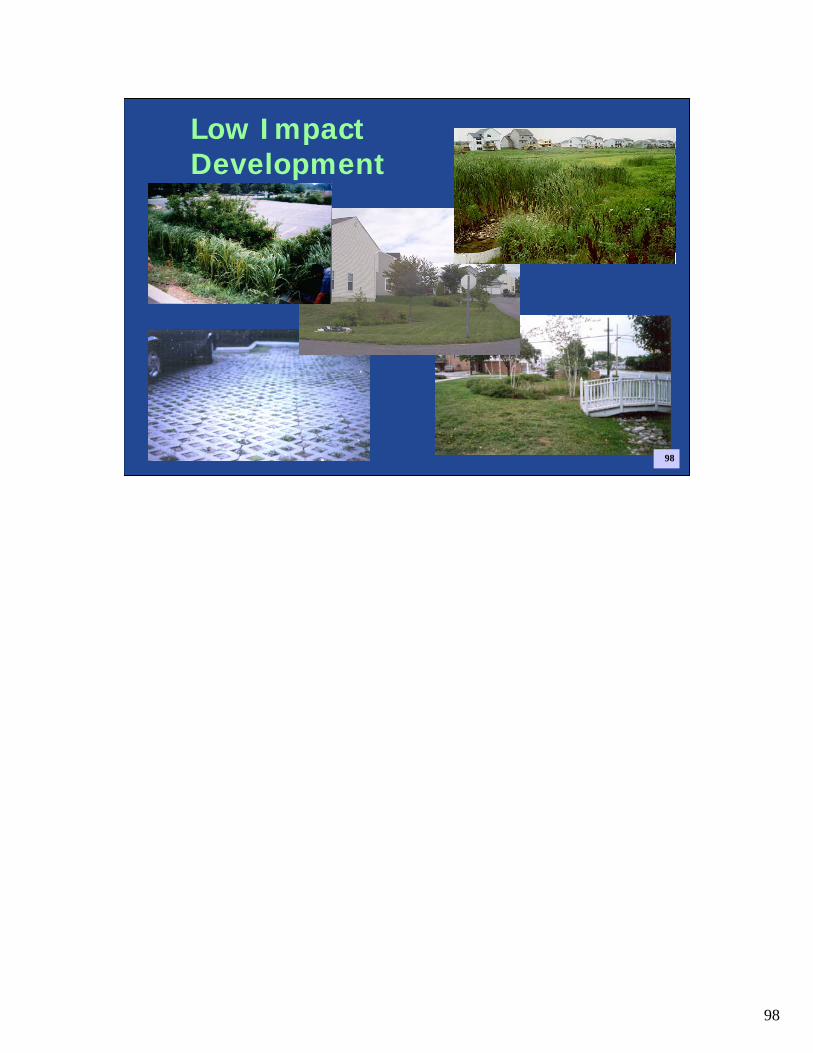
Low Impact Development
98
99
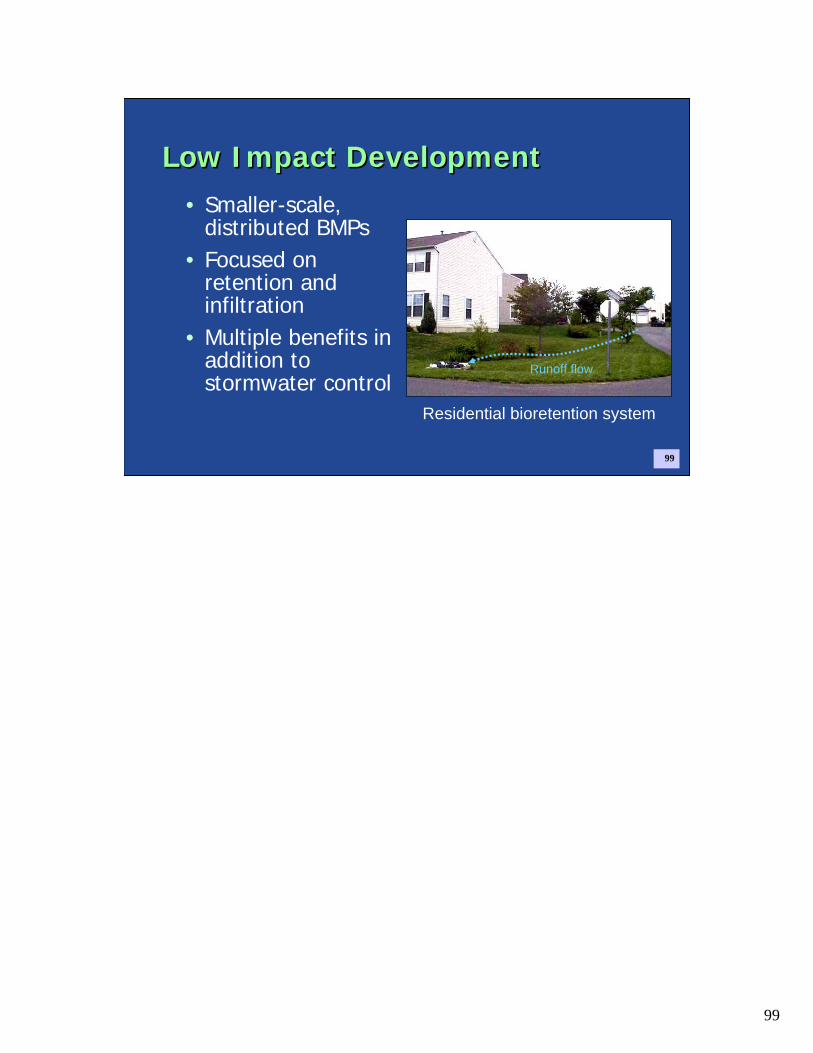
Low Impact DevelopmentLow Impact Development• Smaller-scale,
distributed BMPs• Focused on
retention and infiltration
• Multiple benefits in addition to stormwater control
Runoff flow
Residential bioretention system
99

100
Minimize Development ImpactsMinimize Development Impacts• Reduce storm pipes, curbs and gutters • Reduce building footprints• Preserve sensitive soils• Reduce road widths• Minimize grading• Limit lot disturbance • Reduce impervious surfaces
100
LID design requires the planner and designer to carefully evaluate the physical and ecological characteristics of the siteand consider how to minimize development impacts. The goal is to work with the site characteristics to maintain hydrologic functions and processes rather than attempt to mitigate impacts. For example, avoiding the disturbance and grading of vegetated areas can significantly reduce the need for stormwater controls and will help to recharge ground water. Reducing impervious surfaces by reducing road widths, clustering buildings and using permeable surfaces for parking reduces surface runoff and improves infiltration.
101
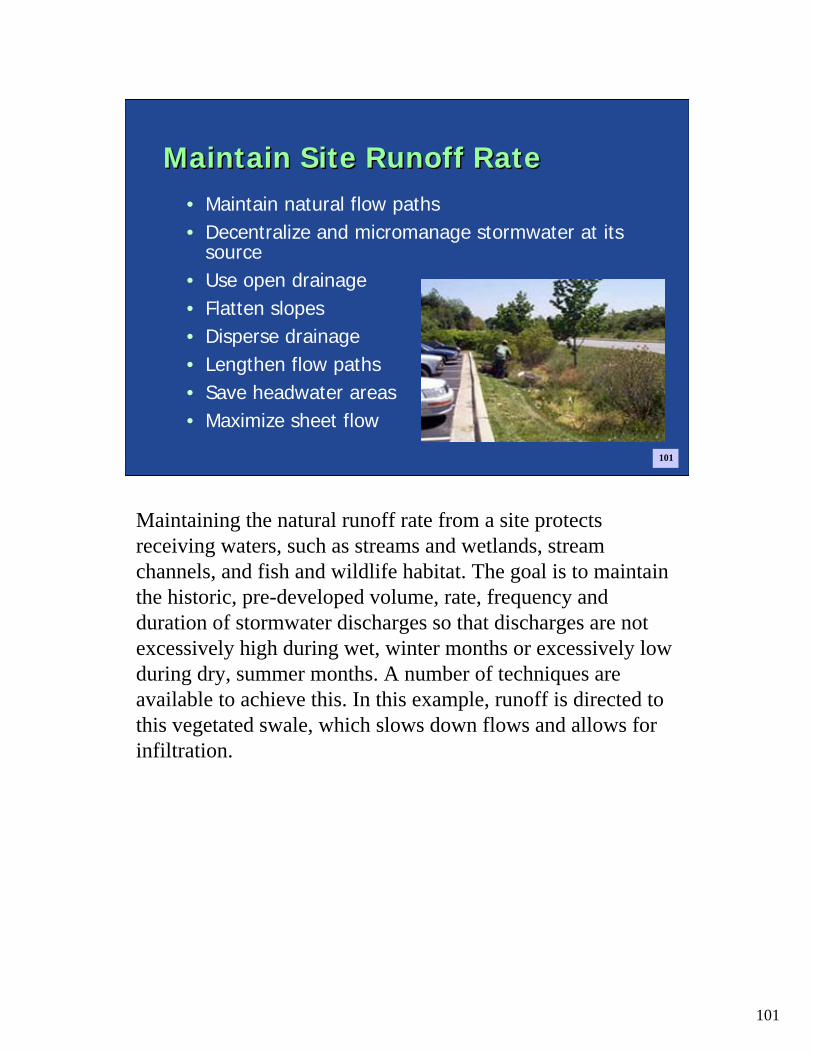
Maintain Site Runoff RateMaintain Site Runoff Rate• Maintain natural flow paths• Decentralize and micromanage stormwater at its
source• Use open drainage• Flatten slopes • Disperse drainage • Lengthen flow paths • Save headwater areas• Maximize sheet flow
101
Maintaining the natural runoff rate from a site protects receiving waters, such as streams and wetlands, stream channels, and fish and wildlife habitat. The goal is to maintainthe historic, pre-developed volume, rate, frequency and duration of stormwater discharges so that discharges are not excessively high during wet, winter months or excessively low during dry, summer months. A number of techniques are available to achieve this. In this example, runoff is directed to this vegetated swale, which slows down flows and allows for infiltration.
102
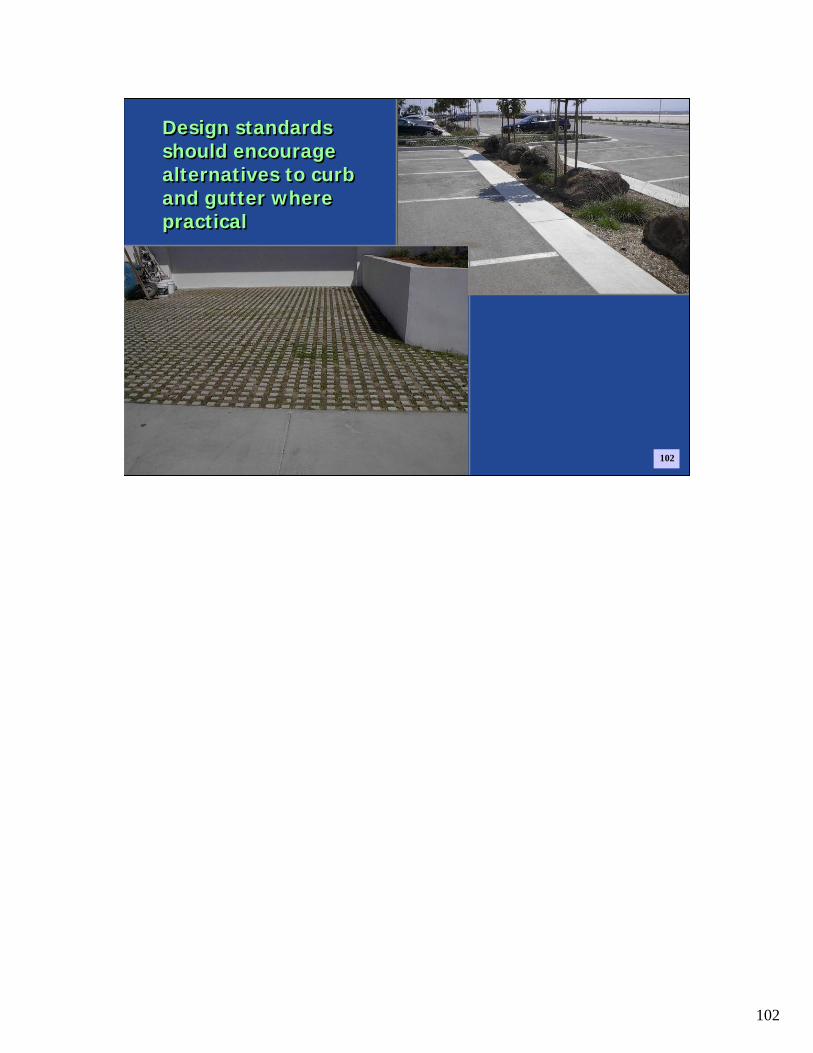
Design standards should encourage alternatives to curb and gutter where practical
Design standards should encourage alternatives to curb and gutter where practical
102
103
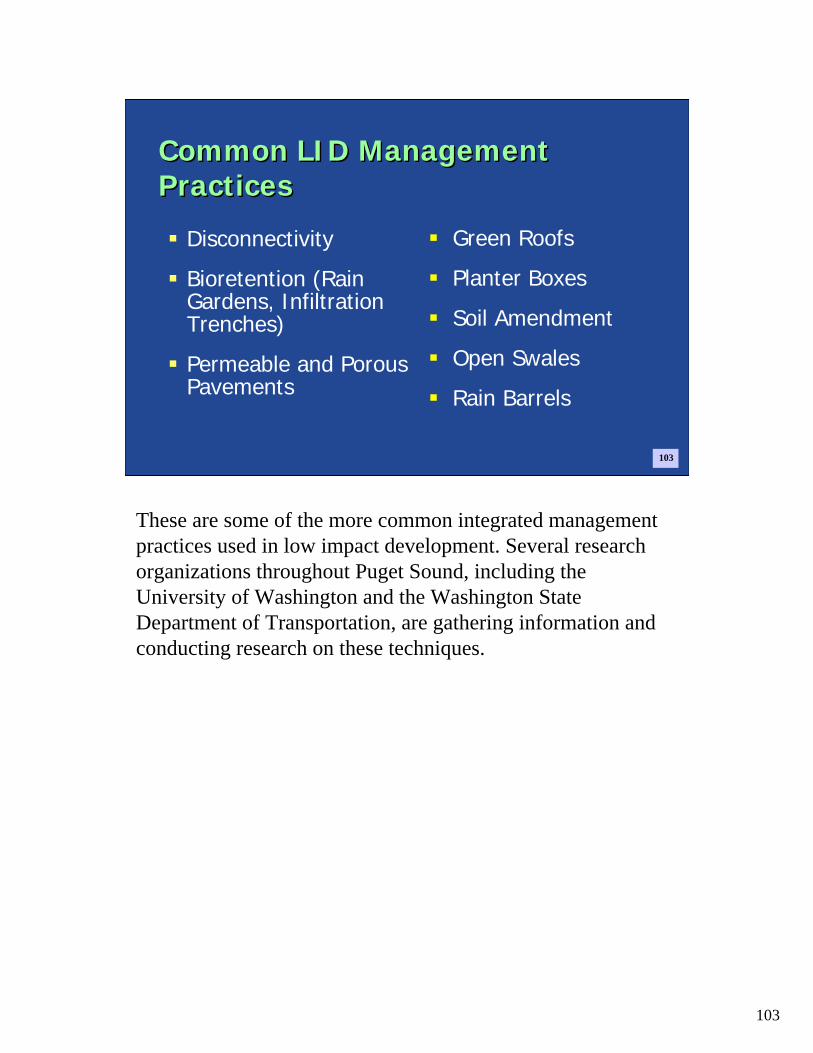
Common LID Management PracticesCommon LID Management Practices
Disconnectivity
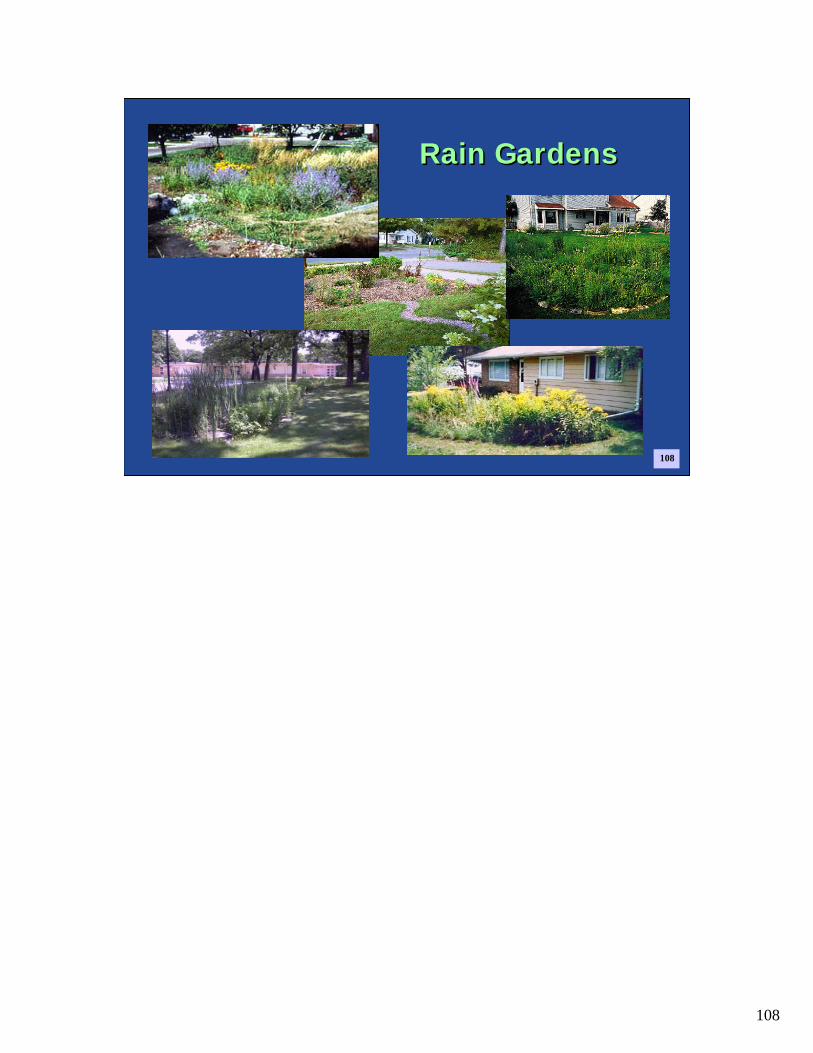
Bioretention (Rain Gardens, Infiltration Trenches)
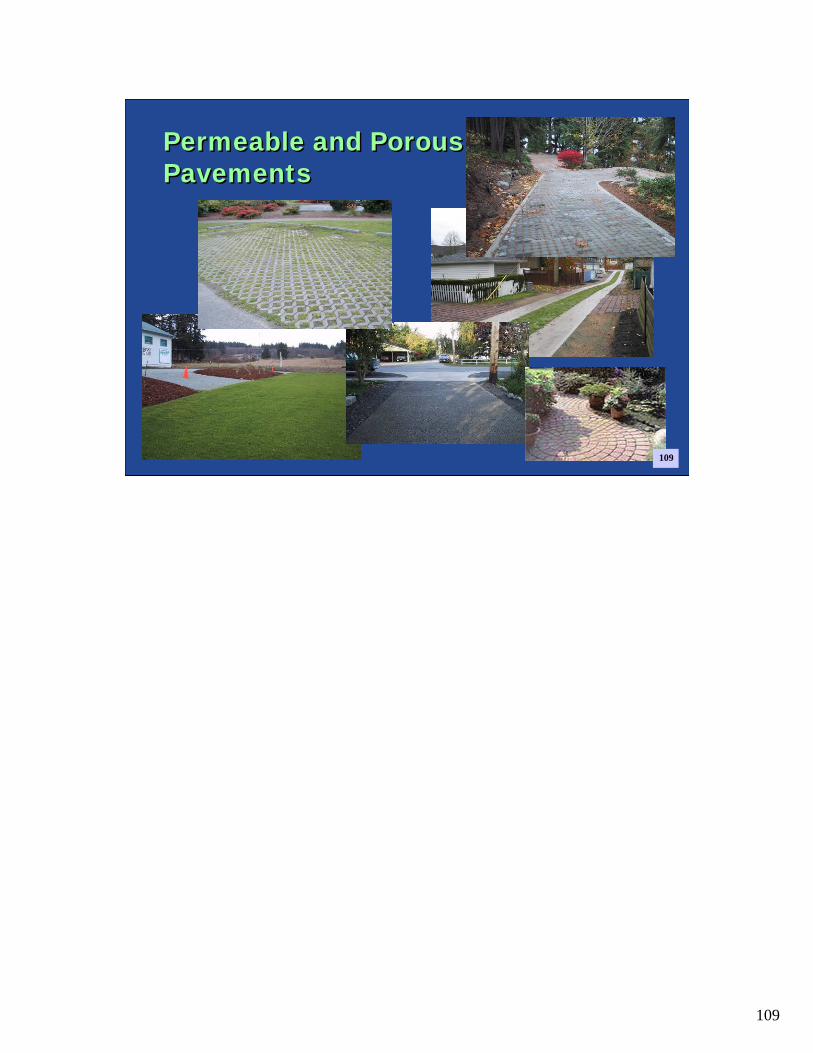
Permeable and Porous Pavements
Green Roofs
Planter Boxes
Soil Amendment
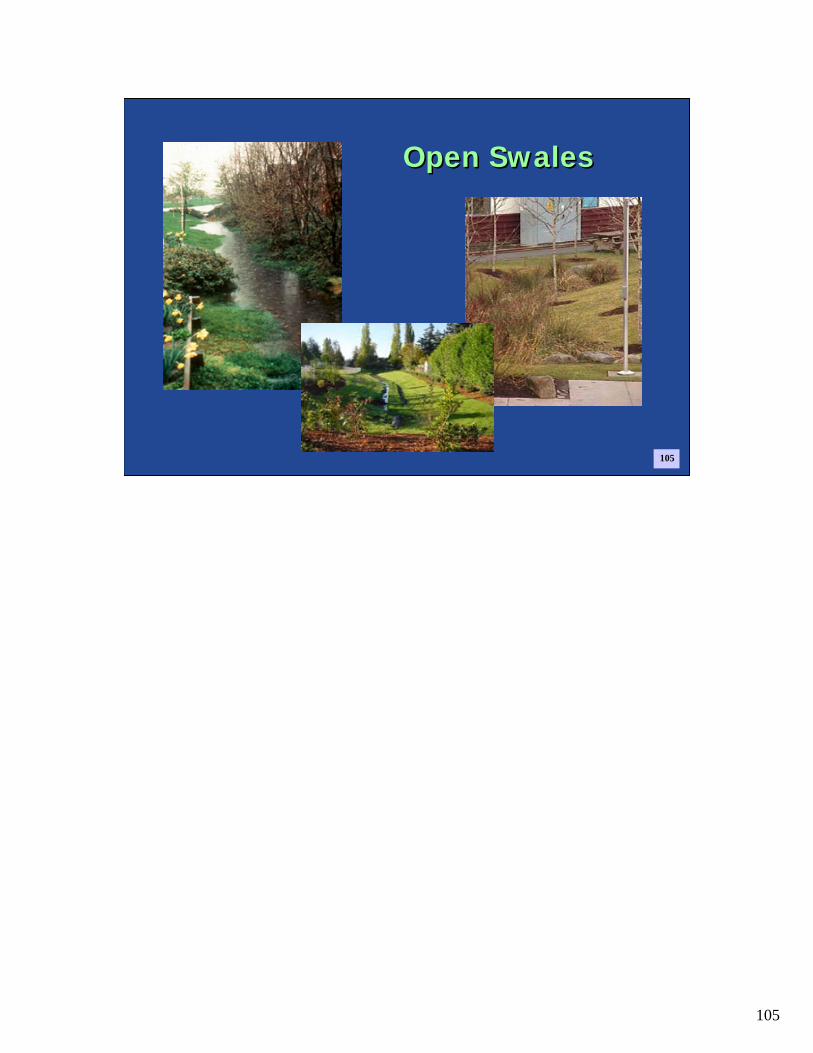
Open Swales
Rain Barrels
103
These are some of the more common integrated management practices used in low impact development. Several research organizations throughout Puget Sound, including the University of Washington and the Washington State Department of Transportation, are gathering information and conducting research on these techniques.
104
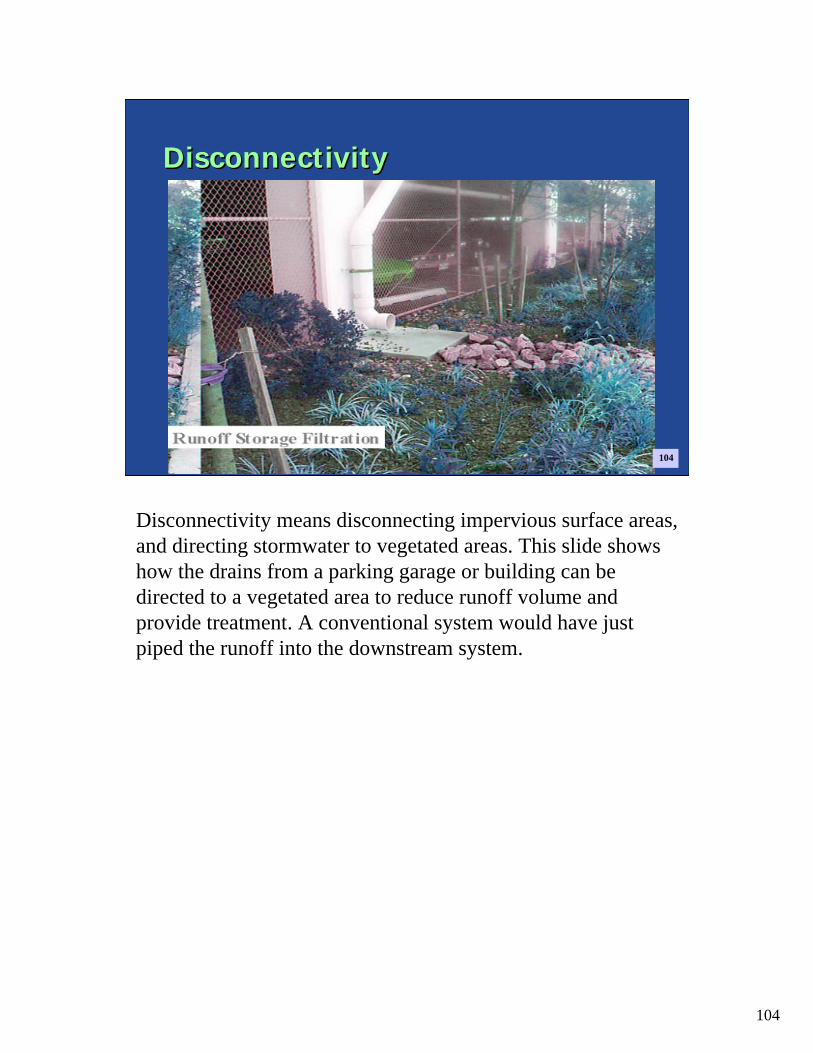
DisconnectivityDisconnectivity
104
Disconnectivity means disconnecting impervious surface areas, and directing stormwater to vegetated areas. This slide shows how the drains from a parking garage or building can be directed to a vegetated area to reduce runoff volume and provide treatment. A conventional system would have just piped the runoff into the downstream system.
105
Open SwalesOpen Swales
105

106
BioretentionBioretention
106
107
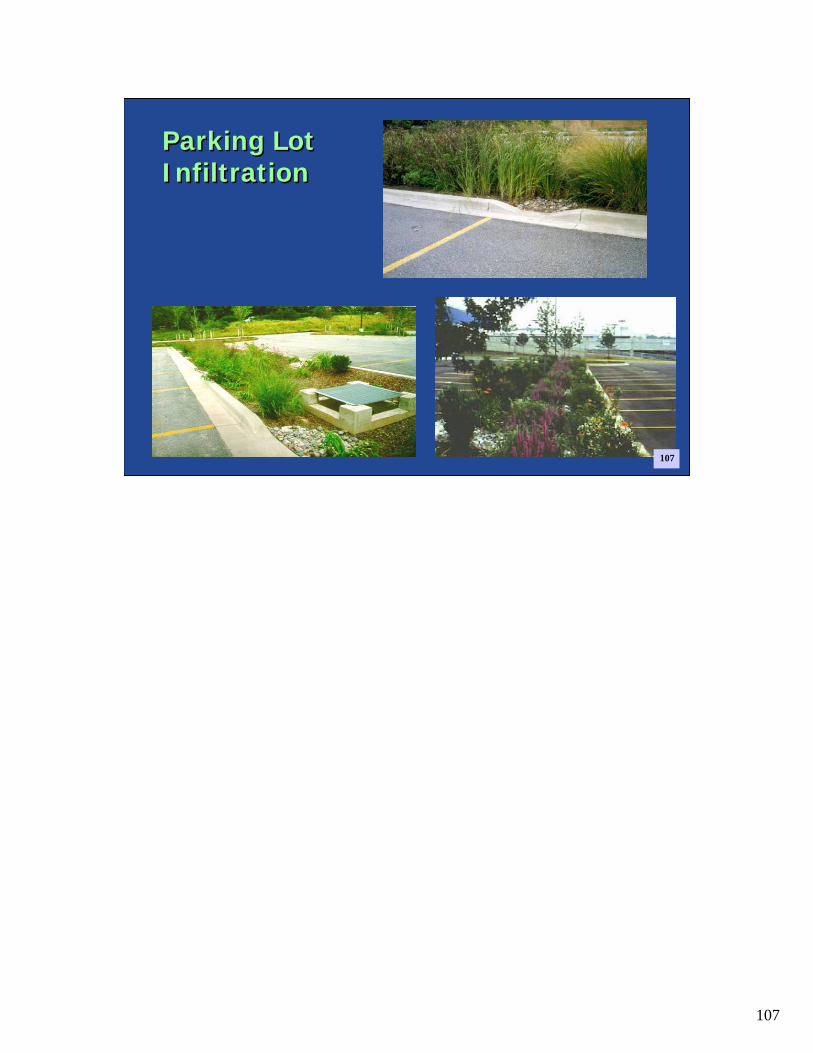
Parking LotInfiltrationParking LotInfiltration
107
108
Rain GardensRain Gardens
108
109
Permeable and Porous PavementsPermeable and Porous Pavements
109

110
Green RoofsGreen Roofs
110
111
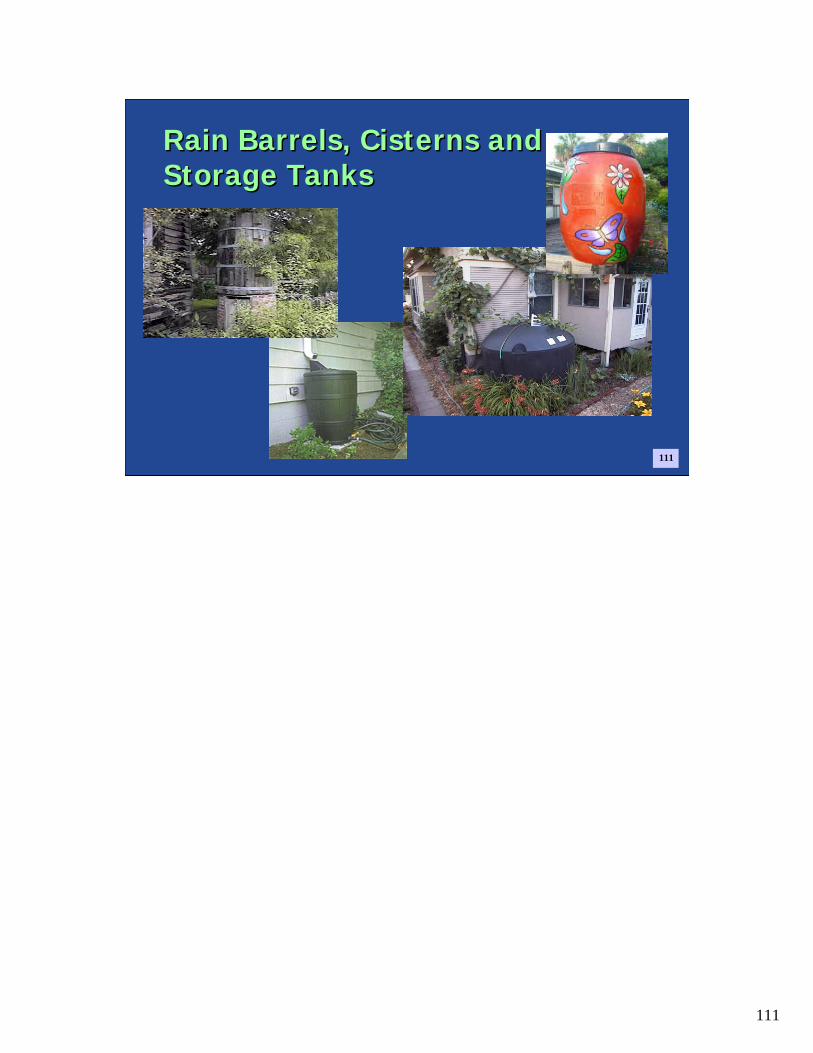
Rain Barrels, Cisterns and Storage TanksRain Barrels, Cisterns and Storage Tanks
111
112
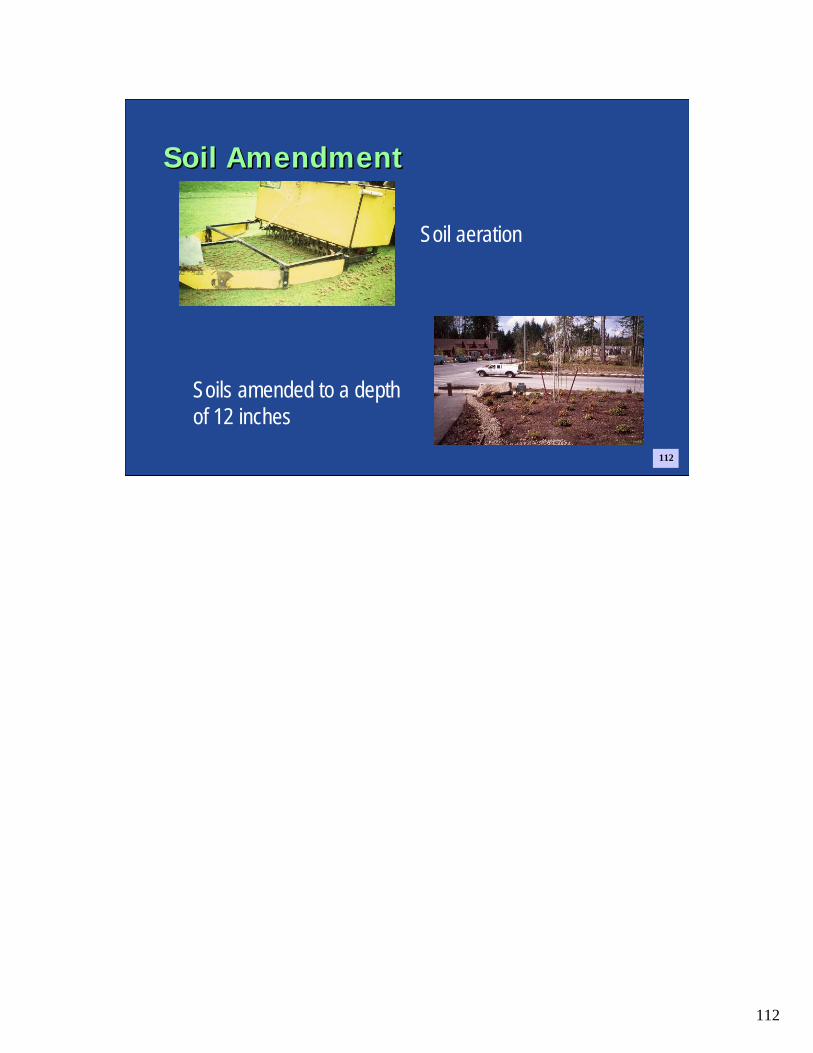
Soil AmendmentSoil Amendment
Soils amended to a depth of 12 inches
Soil aeration
112

113
Planter BoxesPlanter Boxes
113

114
114
Good Drainage Functional Landscape Design
Low ImpactConventional
Conventional
114
LID designs move away from a “collect, convey and discharge” strategy to one that creates a hydrologically functional landscape. Narrower streets, open road sections and landscape practices that store and filter runoff are all typicalpractices.
115
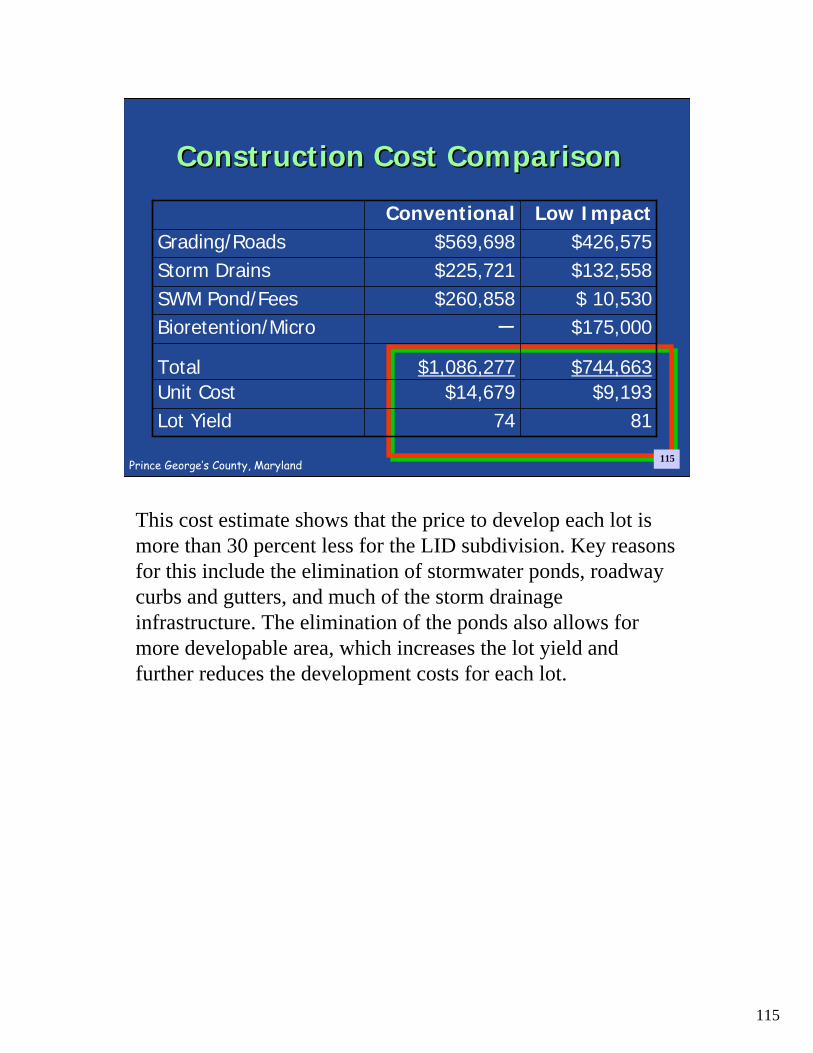
Construction Cost ComparisonConstruction Cost Comparison
8174Lot Yield$9,193$14,679Unit Cost
$744,663$1,086,277Total
$175,000—Bioretention/Micro$ 10,530$260,858SWM Pond/Fees$132,558$225,721Storm Drains$426,575$569,698Grading/Roads
Low ImpactConventional
Prince George’s County, Maryland 115
This cost estimate shows that the price to develop each lot is more than 30 percent less for the LID subdivision. Key reasons for this include the elimination of stormwater ponds, roadway curbs and gutters, and much of the storm drainage infrastructure. The elimination of the ponds also allows for more developable area, which increases the lot yield and further reduces the development costs for each lot.
116
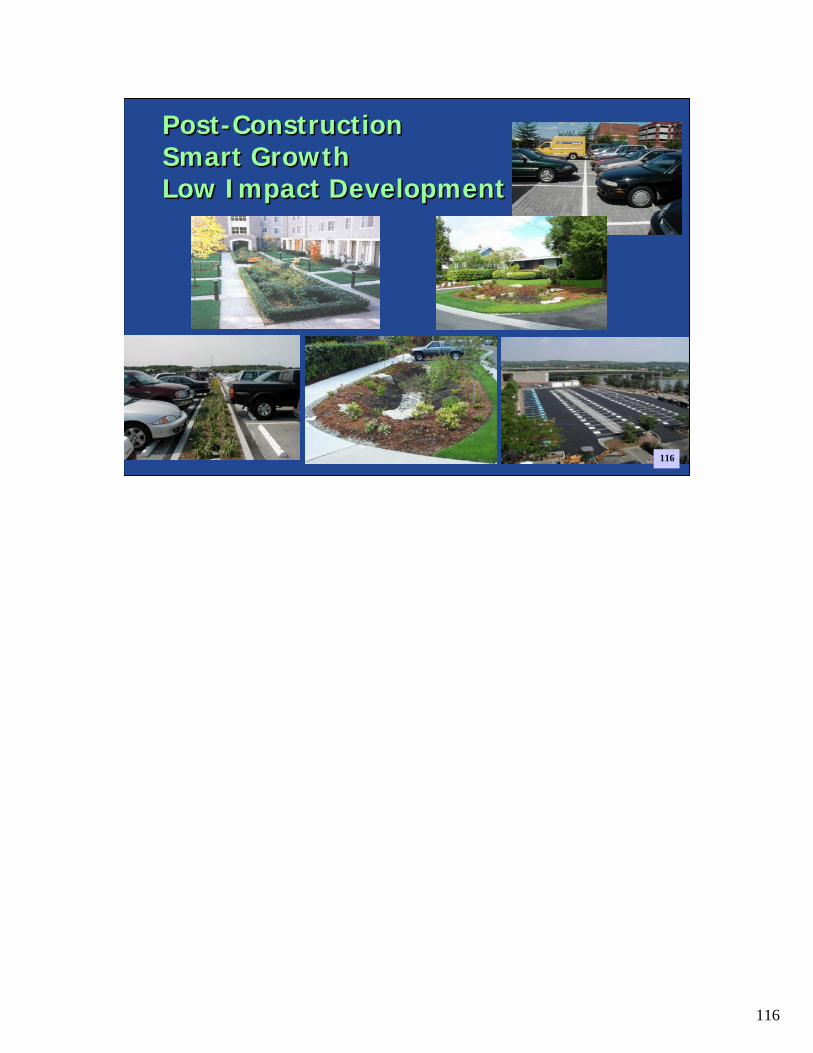
Post-ConstructionSmart GrowthLow Impact Development
Post-ConstructionSmart GrowthLow Impact Development
116

117
How Can Watershed Groups Help?How Can Watershed Groups Help?
• Post-Construction Runoff Control– Facilitate high quality watershed planning– Ensure that smart growth and low impact
development ideas are incorporated into master plans, ordinances, design manuals, etc.
– Educate decision makers and developers– Sponsor voluntary projects, such as rain gardens,
disconnecting downspouts, using pervious pavement, and rain barrels
117

118
Smart Growth and Low Impact Development ResourcesSmart Growth and Low Impact Development Resources
See “Links to Additional Resources” associated with this Webcast:
www.clu-in.org/conf/tio/owswphase2/resource.cfm
118

119
Questions??Questions??
119