stormwater monitoring two ecoroofs in portland, …
TRANSCRIPT

Greening Rooftops for Sustainable Communities: Chicago 2003 www.greenroofs.ca
STORMWATER MONITORING TWO ECOROOFS IN PORTLAND, OREGON, USA
Doug Hutchinson, Peter Abrams, Ryan Retzlaff, Tom Liptan
City of Portland, Bureau of Environmental Services
Abstract Ecoroofs, long used in Europe to reduce stormwater runoff from rooftops, are beginning to be installed in North America. When the City of Portland, Bureau of Environmental Services (BES) began considering ecoroofs for stormwater management, no applicable performance data could be located. To generate region-specific data, BES initiated a monitoring project of an apartment building vegetated with two different ecoroofs. After over two years of water quality monitoring and over a year of flow monitoring, some impressive performance has been measured. Precipitation retention has been calculated at 69% for the 4-5 inch ecoroof substrate section and nearly all of the rainfall is absorbed during dry period storm events. Stormwater detention and peak intensity attenuation has also been impressive even when the roof was saturated during winter months. Some water quality benefits have proven more difficult to quantify but important water quality lessons have been learned. In situations where a receiving water system may be sensitive to certain pollutants, substrate composition will be an important consideration in the ecoroof design. Our work to date has proven that ecoroofs can be an effective urban stormwater management tool. The next major endeavor will be to apply this information to system modeling efforts to determine hydrologic and hydraulic infrastructure and stream benefits that may be achieved. This information is also expected to assist bureau managers, planners, engineers and elected officials with policy decisions, such as zoning density bonuses, infrastructure designs, drainage fee discounts, and code compliance. Introduction The City of Portland, Bureau of Environmental Services (BES) manages Portland’s sewers and stormwater infrastructure, and is responsible for watershed planning to improve and protect human health and the natural environment. Portland’s rapid development and plentiful rainfall have moved stormwater management to the forefront of BES’s priorities. Greenroofs have been used for stormwater management over the past several decades in Europe. In the mid-1990s, BES became interested in investigating the potential of using greenroofs or ‘ecoroofs’ for stormwater management in general, and specifically to reduce storm flows to our aging and overburdened sewer infrastructure. (Terminology note - Portland decided to use the term ‘ecoroof’ to describe an extensive, self-sustaining green roof, due to their multiple ecological attributes.) Since there was no monitoring data from North American ecoroof projects and it was unclear if these roofs would perform well in our wet and mild climate, BES decided to pursue building and monitoring an ecoroof demonstration project to evaluate its effectiveness. After monitoring a small-scale ecoroof project on a residential site, which yielded promising results, we decided to fund a full-scale test on a larger building. This paper discusses findings from this project, Hamilton Apartments Building.

Greening Rooftops for Sustainable Communities: Chicago 2003 www.greenroofs.ca
Figure 1. Schematic ecoroof cross section
Ecoroof Overview An ecoroof is a living vegetated ecosystem of lightweight soil and self-sustaining vegetation. It is biologically ‘alive’ and as such provides a protective cover on the building by using the natural elements of sun, wind, and rain to sustain itself. Ecoroofs require little maintenance and provide an aesthetic alternative, with many economic and ecological attributes not found in a conventional roof. Figure 1. shows the main ecoroof components including a waterproof membrane or material that prevents water from entering the building; drainage material such as geotextile webbing that allows water to flow to the drains when the substrate is saturated; and soil or substrate (growing medium) as light as 6 pounds per square foot (psf). The City of Portland chose to use the term ‘ecoroof’ to describe its “green” roof program for several reasons. First, the western United States including most of Oregon and Washington has dry hot summers and may not receive precipitation for many months. Native plants although more self-sustaining often do not remain “green.” A “not green” or brown roof does not imply that the vegetation has died, thus the prefix eco (for ecosystem) was chosen as being more descriptive of what the ecoroofs are intended to achieve. Another reason was the many references to the economic value, especially the longer life, thus eco also refers to the economic benefits. Portland Overview and Weather Portland is a city of about 500,000 residents and covers an area of 135 square miles. It is located at the northern end of the Willamette Valley in northwest Oregon. In its predevelopment state, it was covered with some of the largest coniferous trees in the world. Today, like most other cities, it has removed almost all of the natural forests to provide habitat for people. This human habitat takes shape in two primary building blocks, rooftops and pavement. Although rooftops constitute only one type of surfacing, they represent about 40% of all impervious surfaces in the City. At full build-out based on current zoning, rooftops are likely to cover more than 25 square miles of the city. Portland is characterized by a mild climate, with moderate but near-continuous winter rainfall, dry summers, and occasional low-elevation snowfall. The Portland climate provides ideal growing conditions for a multitude of plants. However, prolonged summer dry periods, typical for the region, presents one of the greatest challenges to plant survivability. The dry period typically begins in mid-June and lasts through the end of September. Average annual rainfall in Portland, Oregon is 37 inches, with average rainfall in July and August at 0.7 and 0.8 inches, respectively. Table 1 shows rainfall for a 5-year period beginning 1997. Note that for the past 5 years, the average July and August combined rainfall has only
Figure 1. Ecoroof Cross Section
Greening Rooftops for Sustainable Communities: Chicago 2003 www.greenroofs.ca
been 0.8 inches. For the same time period in 2002, total rainfall was 0.28 inches, and September plus October totaled only 1.4 inches. Although rain does occur in summer, it is not unusual to have 30-60 consecutive days of no precipitation. Total rainfall over the course of 123 consecutive days was 1.68 inches from July-October, 2002. Normal summer temperature highs range from 70’s to 90’s F and can reach 100 F for short periods. Normal winter temperature lows often are in the 20’s F, but average in the mid 30’s F.
Season 1997-98 1998-99 1999-00 2000-01 2001-02 Average
Wet (Oct.-May) 41.1 47.93 32.24 18.91 32.22 34.48
Dry (June-Sep.) 2.93 3.8 3.32 3.01 2.74 3.16
July & August only (0.40) (1.55) (0.45) (1.34) (0.28) (0.80)
Total 44.03 51.73 35.55 21.91 34.96 37.64
Table 1. Rainfall (inches) for Portland Oregon (Source BES HYDRA-SYSTEM)
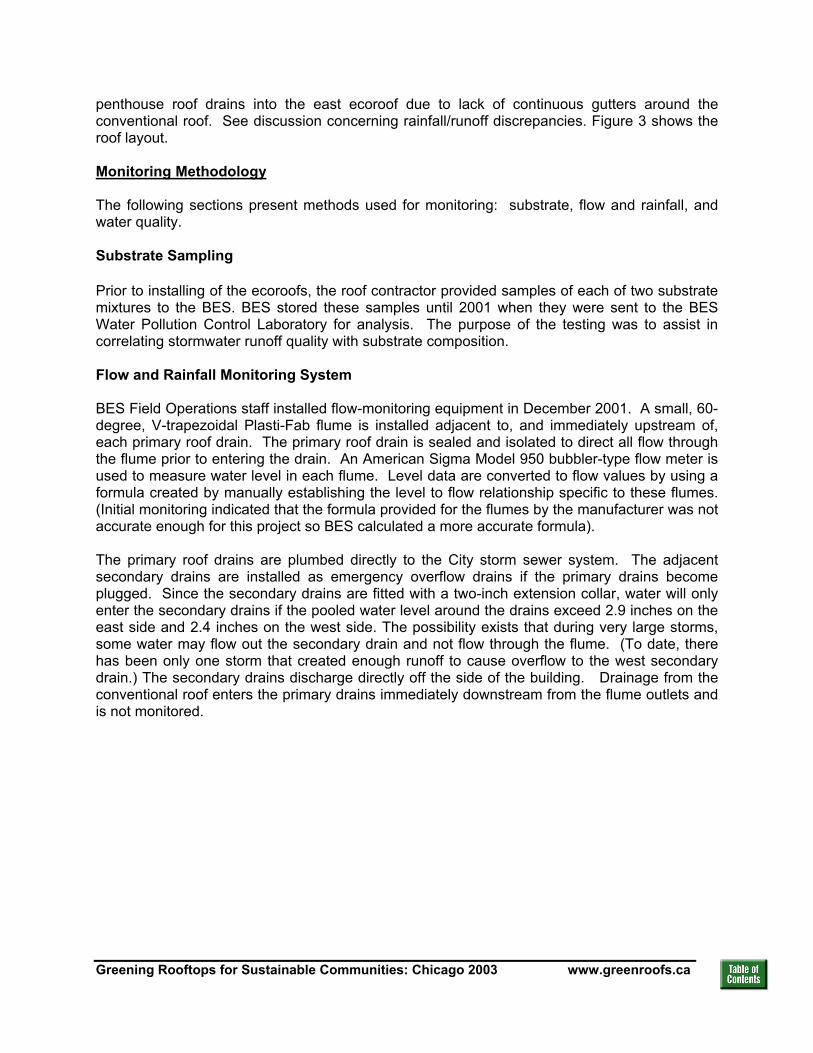
Hamilton Ecoroof Project As stated above, BES wanted to establish a full-scale ecoroof project on a large building to test its effectiveness. The Housing Authority of Portland, in cooperation with BES, built the Hamilton Apartment’s ecoroofs in the autumn of 1999 as a demonstration and testing facility. BES is monitoring this ecoroof to determine characteristics of planting methods; viability of substrate and vegetation; and effluent water quality and stormwater retention characteristics of two different ecoroof substrate mixtures and thickness. Ecoroof Descriptions The Hamilton Apartments is a ten-story, 8,700 square foot (sf) building. The ecoroof was installed in September 1999. For research purposes, the ecoroof was divided into two sides – east and west. The east side consists of 2520 sf of vegetated cover with initial substrate depth of 3 inches (now 2 inches). The east substrate is composed of 15% digested fiber, 25% encapsulated Styrofoam (EPS), 15% perlite, 15%
Figure 2. Hamilton East Ecoroof May 2002

Greening Rooftops for Sustainable Communities: Chicago 2003 www.greenroofs.ca
Figure 3. Hamilton Ecoroof Plan View
course peat moss and 15% compost. Saturated weight of the east substrate is 10 pounds per square foot (psf) for the original 3-inch depth. The west side consists of 2620 sf of vegetated cover with initial substrate depth of 5 inches (now 4-4.5 inches). The west substrate consists of 20% digested fiber, 10% compost, 22% course perlite and 28% sandy loam. Saturated weight of the west substrate is 25 psf for the original 5-inch depth. As of 2003, approximately one inch of substrate was lost on both sides due to wind erosion. An automatic irrigation system with spray heads on 12-inch risers was installed to water during dry periods. The irrigation system was installed to assure plant establishment, the long-term goal is to eliminate the need for irrigation. For example during the summer of 2001, about 6 and 4 inches of water was applied to the east and west sides, respectively; and in 2002 about 3 and 2 inches, respectively). Over 75 species of plants were installed in an identical arrangement on each ecoroof. Plant species included a wide variety of succulents such as sedum, delosperma and sempervivum, numerous grasses and other herbaceous species. These two identical vegetative arrangements have evolved into different plant communities. Many of the original plants died and numerous grasses have colonized the ecoroofs, but each side remains distinctly different. As precipitation falls onto the building it flows laterally towards a set of primary and secondary roof drains located near the center of each of the two roof sections. The east drains have a total drainage catchment of 3,811 sf. This east catchment area consists of 2,520 sf of vegetated ecoroof (66%) and 1,291 sf of various impervious surfaces (34% impervious). The west drains have a total drainage catchment of 3,655 sf This catchment area consists of 2620 sf of vegetated ecoroof (72%) and 1,035 sf of various impervious surfaces (28% impervious) For both sides, the various impervious surfaces include vents, parapet walls, gravel on roof membrane, and terrace pavers installed over a 1.5-inch sand base to help absorb moisture. There is a conventional roof on a 1,239 sf penthouse containing building heating and cooling equipment. In December 2001 all downspouts from the penthouse were plumbed directly to the primary roof drains so that conventional roof runoff would not combine with the vegetated areas. However, it is suspected that during high intensity storm events a 342 sf section of the
Terrace pavers
West drain East drainPenthouse
conventional roof
Greening Rooftops for Sustainable Communities: Chicago 2003 www.greenroofs.ca
penthouse roof drains into the east ecoroof due to lack of continuous gutters around the conventional roof. See discussion concerning rainfall/runoff discrepancies. Figure 3 shows the roof layout. Monitoring Methodology The following sections present methods used for monitoring: substrate, flow and rainfall, and water quality. Substrate Sampling Prior to installing of the ecoroofs, the roof contractor provided samples of each of two substrate mixtures to the BES. BES stored these samples until 2001 when they were sent to the BES Water Pollution Control Laboratory for analysis. The purpose of the testing was to assist in correlating stormwater runoff quality with substrate composition. Flow and Rainfall Monitoring System BES Field Operations staff installed flow-monitoring equipment in December 2001. A small, 60-degree, V-trapezoidal Plasti-Fab flume is installed adjacent to, and immediately upstream of, each primary roof drain. The primary roof drain is sealed and isolated to direct all flow through the flume prior to entering the drain. An American Sigma Model 950 bubbler-type flow meter is used to measure water level in each flume. Level data are converted to flow values by using a formula created by manually establishing the level to flow relationship specific to these flumes. (Initial monitoring indicated that the formula provided for the flumes by the manufacturer was not accurate enough for this project so BES calculated a more accurate formula). The primary roof drains are plumbed directly to the City storm sewer system. The adjacent secondary drains are installed as emergency overflow drains if the primary drains become plugged. Since the secondary drains are fitted with a two-inch extension collar, water will only enter the secondary drains if the pooled water level around the drains exceed 2.9 inches on the east side and 2.4 inches on the west side. The possibility exists that during very large storms, some water may flow out the secondary drain and not flow through the flume. (To date, there has been only one storm that created enough runoff to cause overflow to the west secondary drain.) The secondary drains discharge directly off the side of the building. Drainage from the conventional roof enters the primary drains immediately downstream from the flume outlets and is not monitored.

Greening Rooftops for Sustainable Communities: Chicago 2003 www.greenroofs.ca
Figure 4. Flow monitoring station photographs. The left shows the flume and flow monitor and the right shows a close-up of the flume during a storm event. A Hydrological Services tipping bucket rain gauge is installed atop the conventional roof in the center of the building to ensure that accurate rain data are collected for the site. Rain data are collected and relayed via radio telemetry to a networked computer (HYDRA-system). Rain data are converted to a rain run-on flow rate for each side by multiplying rainfall by the catchment area.
Figure 5. Rain gauge and antenna in upper right. Water Quality Monitoring Sampling Procedures BES Field Operations collect stormwater runoff grab samples by placing a decontaminated stainless steel beaker or the analysts-specific sample containers directly under the flow
Greening Rooftops for Sustainable Communities: Chicago 2003 www.greenroofs.ca
discharging from the flumes. The minimum storm criteria for water quality analysis for this project was 0.25 inches of rain in 24 hours to ensure adequate runoff volumes. Grab samples are collected during the middle to latter part of storm events. As of April 2003 eight storms have been monitored for water quality (data is only available from seven events). Analytical Parameters Samples are analyzed in the field for dissolved oxygen, pH, specific conductance, and temperature using portable field meters. Samples are submitted to the BES Water Pollution Control Laboratory for analysis of ammonia-nitrogen, biochemical oxygen demand, chemical oxygen demand, color, total and dissolved metals (arsenic, cadmium, copper, lead, silver, and zinc), Escherichia coli, orthophosphate-phosphorus, total phosphorus, and total suspended and dissolved solids. Vegetation and other Monitoring On a regular basis, visual observations and photo-documentation of various conditions and activities of the ecoroof and entire rooftop area are made. Vegetation, substrate, wildlife and human activities are tracked to allow BES an opportunity to understand what affects stormwater management performance. Other issues, such as energy and air quality will be considered for monitoring in the future, either on this project or perhaps other ecoroofs under construction at this time. Monitoring Results Substrate Composition Table 2 shows the substrate chemical composition for the parameters listed. The ratio column indicates the relationship between the east and west substrate. For all parameters, except total arsenic, the west substrate has much higher concentrations. The west extractable arsenic is 9 times higher than the east substrate. It should be noted that these results are from samples collected at the time the ecoroof was installed in 1999. Future substrate chemical analysis may be conducted in 2005 to determine if any measurable changes have occurred. In most cases, concentrations are higher for the west substrate compared to the east substrate . In situations where a receiving water system may be sensitive to certain pollutants of concern, substrate composition will be an important consideration in the ecoroof design. See water quality discussion below.

Greening Rooftops for Sustainable Communities: Chicago 2003 www.greenroofs.ca
Parameter Extractant Method Unit East West RatioTotal Arsenic EPA 200.9 mg/kg 4.54 2.19 0.5Total Copper EPA 200.7 mg/kg 17.5 30.3 1.7Total Lead EPA 200.9 mg/kg 5.57 64.9 11.7Total Zinc EPA 200.7 mg/kg 48.2 146.1 3.0Extractable Arsenic DTPA EPA 200.9 mg/kg 0.01 0.09 9.0Extractable Copper DTPA EPA 200.7 mg/kg 1.25 6.08 4.9Extractable Lead DTPA EPA 200.9 mg/kg 0.26 2.43 9.3Extractable Zinc DTPA EPA 200.7 mg/kg 4.9 64.8 13.2Extractable Nitrate 1 N KCL SM 4500-NO3 mg/kg 253.6 798.3 3.1Extractable Ammonia 1 N KCL SM 4500-NH4 mg/kg 2.7 28.6 10.6Total Kjeldahl Nitrogen EPA 351.4 mg/kg 1897 12802 6.7Total Phosphorus EPA 365.4 mg/kg 958 2508 2.6Extractable Ortho-phosphate Phosphorus 0.5 N NaHCO3 SM 4500 PE mg/kg 100 325 3.3
Table 2. Hamilton Ecoroof Substrate Composition Flow and Rainfall Rainfall Retention (precipitation that ultimately evapotranspirates) The flow attenuation characteristic of each ecoroof was evaluated by comparing rain run-on to runoff to calculate retention. In general, both ecoroofs retained varying amounts of stormwater relative to seasonal influences as shown by Figure 6. However, more runoff than run-on was measured during certain months for the east side. After eliminating potential equipment malfunctions, this discrepancy is attributed to unmeasured run-on flow that comes from a 342 sf section of the conventional roof on the penthouse. We believe this is caused by high intensity storms where the flows bypass the penthouse’s non-continuous gutter system and cascades onto the east ecoroof. Due to this discrepancy, only the west rain and flow data will be evaluated here.
Hamilton Ecoroof Stormwater Retention
-10%
0%
10%
20%
30%
40%
50%
60%
70%
80%
90%
100%
Jan-02
Feb-02
Mar-02
Apr-02
May-02
Jun-02
Jul-0
2
Aug-02
Sep-02
Oct-02
Nov-02
Dec-02
Jan-03
Feb-03
Mar-03
Apr-03
% R
eten
tion
East % Retention* West % Retention
* East Retention inexact - see text
Figure 6. Hamilton Stormwater Retention East vs. West Ecoroofs

Greening Rooftops for Sustainable Communities: Chicago 2003 www.greenroofs.ca
West ecoroof retention is shown in Figure 7 for the 15-month monitoring period. Rainfall retention has been calculated using the difference between the rain run-on and runoff volumes. The retention for the west ecoroof during this period is an impressive is 69%, which appears to be increasing with time. This apparent increase in retention can be observed by comparing the retention for Jan-March 2002 with Jan – March 2003.
Figure 7 Hamilton West Ecoroof Retention by Month Comparison of Weather data for winters of 2002 and 2003 The west ecoroof had significantly different retention rates for the months of January, February and March of 2002 and 2003. It is likely there are several factors contributing to the difference in retention from one year to the next. Some factors may include rainfall distribution and intensity patterns, air temperature, vegetation/substrate ecosystem maturity, and perhaps human influences. The January to March 2002 rainfall retention for the west ecoroof was 20%, and for the same period of 2003 the retention was 59%. The two periods have similar total rainfall amounts of 14.3 and 13.13 inches for 2002 and 2003, respectively. However, the rainfall patterns for the two years are different. 2003 has a greater variability of rainfall and 2002 has more even rainfall distribution. This can be seen in Fig. 8. Note the long dry periods between storms in 2003 and the relatively even rainfall for the same period in 2002. The long dry periods may account for greater evapotranspiration and increased water holding capacity in the ecoroof. 2002 does have some long dry periods as well near the end of February and March. Interestingly, 2002 has 40 dry days and 2003 has only 39 for the three-month period. The daily average temperatures for the three months in 2002 and 2003 are plotted in Figure 9. It’s difficult to see any pattern in the data, until a linear best-fit line is added. This clearly shows
Hamilton West Ecoroof Stormwater Retention by Month
0
1
2
3
4
5
6
7
8
Jan-02
Feb-02
Mar-02
Apr-02
May-02
Jun-02
Jul-0
2
Aug-02
Sep-02
Oct-02
Nov-02*
Dec-02
**
Jan-03
Feb-03
Mar-03
Apr-03**
*
Rai
nfal
l (in
.)
0%
10%
20%
30%
40%
50%
60%
70%
80%
90%
100%
% R
eten
tion
Monthly Rainfall (in.) Monthly % Stormwater Retention
* Rain/Flow data missing from November 27 - 30, 2002** Rain/Flow data missing from Decmber 1-15, 2002*** Includes up to April 14, 2003

Greening Rooftops for Sustainable Communities: Chicago 2003 www.greenroofs.ca
the average daily temperature in 2003 was higher than in 2002 for the same period. The average daily difference was 2.4 degrees Fahrenheit. The effect of this temperature difference and the potential evapotranspiration may account for the higher 2003 retention rates. The last, and potentially most significant, factor that contributed to the increased retention between 2002 and 2003 is the vegetation maturity.
January February March 2002 and 2003 Daily Rain Totals
0
50
100
150
200
250
12/20 12/30 1/9 1/19 1/29 2/8 2/18 2/28 3/10 3/20 3/30 4/9
Days
Rai
n (h
undr
eths
of I
nche
s)
2003 2002
Figure 8. Daily Rainfall for January, February and March – Years 2002 and 2003

Greening Rooftops for Sustainable Communities: Chicago 2003 www.greenroofs.ca
Average Daily TemperatureJanuary, February and March of 2002 and 2003
0
10
20
30
40
50
60
70
0 10 20 30 40 50 60 70 80 90 100Days
Tem
pera
ture
(deg
F)
2003 ave 2002 ave Linear (2003 ave) Linear (2002 ave)
Figure 9. Daily Air Temperatures for January, February and March – Years 2002 and 2003 Storm Peak Intensity Attenuation (reduces runoff rates) The following four figures show retention relative to specific storm events of varying intensities and times of year. Peak rainfall intensities for the storms shown on Figures 10-13 range from 0.041 to 0.193 cfs for rain run-on, whereas corresponding peak runoff flows range from 0.008 to 0.012 cfs . Even when the substrate is saturated, the ecoroof system attenuates the intense run-on peaks of even the largest winter storms. Notice how the runoff flows seem to stay relatively flat when the peaks occur. Figure 10 shows a very intense winter downpour, where the peak runoff is 1/16th the peak run-on. For a similar event Figure 11 shows that a very intense peak is almost totally attenuated by the ecoroof. Figure 12 shows a large storm, about equivalent to a 2-year/ 24-hour event typical of Portland in that it does not necessarily have an intense peak. Figure 13 shows a somewhat common winter storm after a series of preceding days with rainfall. Peak intensities for the Feb 2002 and Sept 2002 storms are much more intense.

Greening Rooftops for Sustainable Communities: Chicago 2003 www.greenroofs.ca
Hamilton West Ecoroof Rain and FlowWinter Storm Event ~10-yr: February 23, 2002
0.00
0.04
0.08
0.12
0.16
0.20
0:00
2:00
4:00
6:00
8:00
10:00
12:00
14:00
Flow
(cfs
)
Rain Run-on Runoff
Event Rainfall = 0.99 inches/5 hours.24-hr Antecedant Rainfall = 0.0 inches
Event Rain Run-on = 301.5 cfEvent Runoff = 174.6 cf
Figure 10. High Intensity, Short Duration Winter Storm.
Figure 11. High Intensity, Short Duration Summer Storm
Hamilton West Ecoroof Rain and FlowTypical Summer Storm Event: September 29, 2002
0.00
0.04
0.08
0.12
0.16
0.20
15:45
15:50
15:55
16:00
16:05
16:10
16:15
16:20
16:25
16:30
16:35
16:40
16:45
16:50
16:55
17:00
17:05
17:10
17:15
17:20
17:25
Flow
(cfs
)
Rain Run-on Runoff
Event Rainfall = 0.29 inches/40 minutes24-hr Antecedant Rainfall = 0.14 inches
Event Rain Run-on = 88.3 cfEvent Runoff = 3.9 cf

Greening Rooftops for Sustainable Communities: Chicago 2003 www.greenroofs.ca
Figure 12. Low Intensity, High Volume Winter Storm
Figure 13. Low intensity, Low Volume Winter Storm
Hamilton West Ecoroof Rain and FlowWinter Storm Event ~2-yr: January 31, 2003
0.00
0.02
0.04
0.06
0.08
1:30
3:35
5:40
7:45
9:50
11:55
14:00
16:05
18:10
20:15
Flow
(cfs
)
Rain Run-on Runoff
Event Rainfall = 2.07 inches/17 hours24-hr Antecedant Rainfall = 0.5 inches
Event Rain Run-on = 615.2 cfEvent Runoff = 365.7 cf
Hamilton West Ecoroof Rain and FlowTypical Winter Storm Event: February 17, 2003
0.00
0.01
0.02
0.03
0.04
0.05
10:00
10:40
11:20
12:00
12:40
13:20
14:00
14:40
15:20
16:00
16:40
17:20
18:00
18:40
19:20
20:00
20:40
21:20
22:00
Flow
(cfs
)
Rain Run-on Runoff
Event Rainfall = 0.77 inches/8 hours24-hr Antecedant Rainfall = 0.63 inches
Rain Run-on = 231.4 cfRunoff = 145.8 cf

Greening Rooftops for Sustainable Communities: Chicago 2003 www.greenroofs.ca
Stormwater Detention (slows the flow of runoff) Another characteristic of the ecoroof performance is runoff detention. Aside from the fact that rainfall is retained in the ecoroof, its runoff rate is diminished compared to what conventional roof runoff would be. Due to the relative small size of these ecoroofs the time of concentration is almost instantaneous and thus a conventional roof would have almost immediate runoff. For a simple comparison, one could use the rain run-on line shown on any of the above Figures 10-13 as the conventional roof runoff rate. The runoff line then shows how significant the detention is for a vegetated roof as compared to a conventional roof. However, the runoff from an ecoroof may continue for many hours past the last recorded rain. The conventional roof runoff would stop within minutes of the last rainfall. Water Quality The city’s initial primary interest in ecoroofs was related to flow attenuation. At the time the project started, there was no known information on water quality characteristics of ecoroof runoff. Water quality sampling was conducted to determine what effect the ecoroof substrate has on water quality. To date, eight storm events have been sampled with data available for the first seven (analyses currently underway on the last event). Figures 14-16 display data for three of the many parameters analyzed along with rainfall associated with each sampling event. Since runoff samples from a conventional roof were not collected, comparative conclusions cannot be drawn from this data. Figures 14 and 15 show constituents such as total phosphorous (TP) and ortho-phosphorous at concentrations above Oregon receiving water standards. Note the difference between east and west ecoroof flow concentrations and the substrate chemical composition shown in Table 2. In Oregon, phosphorous concentrations are considered of most concern during the dryer months May-October. It appeared that over time phosphorus levels might be coming down, until the last 3 events as shown in Figures 14 and 15. However it appears from the data that warmer months such as April and May have the lowest concentrations. BES may attempt to gather additional warm weather data from these ecoroofs or may move to monitoring other ecoroof installations.

Greening Rooftops for Sustainable Communities: Chicago 2003 www.greenroofs.ca
Hamilton Ecoroof RunoffTotal Phosphorus Concentrations
0
0.1
0.2
0.3
0.4
0.5
0.6
0.7
0.8
2/2/2
001
3/25
/2001
4/23
/2001
5/14
/2001
2/7/2
002
3/11
/2002
12/30
/2002
Rai
nfal
l (in
.)
0
0.2
0.4
0.6
0.8
1
1.2
Tota
l Pho
spho
rus
(mg/
L)
Event Rainfall (in.) East West
Figure 14. Total phosphorus concentrations in runoff from both the east and west ecoroofs. Another important characteristic is the ecoroof affect on loadings. As shown above, many storm events, especially the warm season storms, significantly reduce flow volumes, thus reducing loadings. And in many cases the flow is zero with zero concentrations, particularly during the drier times of year.
Hamilton Ecoroof RunoffOrtho-phosphate Phosphorus Concentrations
0
0.1
0.2
0.3
0.4
0.5
0.6
0.7
0.8
2/2/2
001
3/25
/2001
4/23
/2001
5/14
/2001
2/7/2
002
3/11
/2002
12/30
/2002
Rai
nfal
l (in
.)
0
0.2
0.4
0.6
0.8
1
1.2O
-PO
4 Ph
osph
orus
(mg/
L)
Event Rainfall (in.) East West
Figure 15. Orthophosphate concentrations in runoff from both the east and west ecoroofs.

Greening Rooftops for Sustainable Communities: Chicago 2003 www.greenroofs.ca
Figure 16 shows dissolved copper concentrations which, based on water hardness, are usually below in-stream standards. However, 3 of the 14 samples were above the criteria, two in the warmer months and one in winter 2002. Numerous factors will be considered to determine the cause of these issues. But again, attention to substrate ingredients and materials to be used on the ecoroof can affect these parameters. For example, the roofing industry uses an abundance of galvanized metals, copper and lead. A potential source for copper on the Hamilton building could be the treated lumber the landscape contractor used for edging material. Background levels in the west ecoroof may be high due to the natural topsoil mixed with the substrate. However, as pointed out above, the copper loadings would be much reduced because the warm weather flows are almost zero. One option that should be evaluated in reducing pollution from all roofs is the types of roofing materials that are allowed. Several projects in Southern California (Crystal Cove, Newport Beach for example) have restrictions on copper and zinc containing materials being used for roofs, gutters, and downspouts. Another issue related to ecoroof runoff quality is the contribution of certain constituents from the terrace area and building maintenance activities. Numerous rooftop activities can occur with lots of food, drinks, fireworks, dogs, wildlife, and many other pollutant sources. An important lesson to date is that these sources should be addressed in monitoring studies and education efforts.
Hamilton Ecoroof RunoffDissolved Copper Concentrations
0
0.1
0.2
0.3
0.4
0.5
0.6
0.7
0.8
2/2/2
001
3/25
/2001
4/23
/2001
5/14
/2001
2/7/2
002
3/11
/2002
12/30
/2002
Rai
nfal
l (in
.)
0
2
4
6
8
10
12
14
Dis
solv
ed C
oppe
r (ug
/L)
Event Rainfall (in.) East West
Figure 16. Dissolved copper concentrations measured in runoff from both the east and west ecoroofs. Most samples (11 of 14) were below acute water quality criteria of 0.9 ug/l at a hardness of 50 mg/l.
Greening Rooftops for Sustainable Communities: Chicago 2003 www.greenroofs.ca
Summary Precipitation that lands on an ecoroof acts in the following ways.
1. Portions of it are intercepted by vegetation and then evaporate; 2. Portions are absorbed in the substrate; 3. Portions in the substrate are taken into the vegetation and then transpire; 4. Some water evaporates from the substrate; and 5. Excess amounts flow through the substrate and become runoff.
These characteristics are highly affected by seasonal conditions. Interception, evaporation, and transpiration act to prevent runoff. This portion of the rain never turns into runoff. One of the primary objectives of the monitoring program has been to assess the effectiveness of ecoroofs in reducing the volume of runoff. After two years of trials, BES has amassed data that is beginning to show that ecoroofs, such as the Hamilton project, provide significant stormwater management benefits. Our data reveals that a 25-psf ecoroof, measuring 4-5 inches thick, can absorb approximately 69% of rainfall falling onto it. We have also seen 100% retention for most warm weather storms. Detention rates are much higher than traditional roofs for a range of storms from small to at least the 2-year event measured. These results are for an ecoroof with only 72% vegetative coverage. These monitoring results will be used by BES to model infrastructure benefits, such as reducing impacts to the aging portions of the sewer systems, prevent basement flooding, and reduce erosive flows to streams and creeks. In addition, it appears that water quality could be significantly improved via loadings (volume) reduction as well as pollutant removal/avoidance. Additional monitoring data on ecoroof water quality will be conducted to assess the benefits of concentration reductions, and the loading reductions from reducing runoff amounts. There is a need to be strategic about the selection of soils/growing media to use on ecoroofs as some soils may contain higher levels of pollutants. In addition other roof materials, such as treated woods need to be avoided. Developers in Portland are gaining confidence in the value of ecoroofs, as more and more builders gain experience with ecoroof design and construction. The City allows developers to meet or partially meet their stormwater treatment requirements with an ecoroof. In dense urban situations, this has become more and more attractive to developers. In addition, the City allows larger buildings as an incentive. In the future, there will be a potential reduction in stormwater fees via a reduced fee for those sites with ecoroofs. One of the primary reasons that developers are embracing the program is the City’s technical and permitting assistance provided by the Bureau of Environmental Services. As with any stormwater management measure, good design and maintenance are keys to their success. It is expected that, due to virtual elimination of sun energy on roof surfaces and resulting degradation of roof materials, ecoroofs will likely be found to last much longer than many traditional roof materials. As with any roof, good construction techniques are important. The City is undertaking economic analyses of life cycle costs, and research on the multiple benefits of ecoroofs, to further demonstrate their value and effectiveness to developers and the community at large.

Greening Rooftops for Sustainable Communities: Chicago 2003 www.greenroofs.ca
References Strecker, E. and Liptan T., Ecoroofs (Greenroofs) – A More Sustainable Infrastructure: National Conference on Urban Stormwater: Enhancing Programs at the Local Level. February, 2003. Fischer, P. and Jauch, M., Dranwasser in Trinkwasserqualitat?; Dach Grun, Fachmagazin fur Bauwerksbegrunung, Dezember 2002. City of Portland, Bureau of Environmental Services Hydra–Data System, 1997-2003.