storage performance management overview · presentation is intended to be, or should be construed...
TRANSCRIPT
Storage Performance Management Overview
Brett Allison, IntelliMagic, Inc.
Author: Brett Allison, IntelliMagic, Inc.
Storage Performance Management © 2012 Storage Networking Industry Association. All Rights Reserved.
SNIA Legal Notice
The material contained in this tutorial is copyrighted by the SNIA unless otherwise noted. Member companies and individual members may use this material in presentations and literature under the following conditions:
Any slide or slides used must be reproduced in their entirety without modification The SNIA must be acknowledged as the source of any material used in the body of any document containing material from these presentations.
This presentation is a project of the SNIA Education Committee. Neither the author nor the presenter is an attorney and nothing in this presentation is intended to be, or should be construed as legal advice or an opinion of counsel. If you need legal advice or a legal opinion please contact your attorney. The information presented herein represents the author's personal opinion and current understanding of the relevant issues involved. The author, the presenter, and the SNIA do not assume any responsibility or liability for damages arising out of any reliance on or use of this information.
NO WARRANTIES, EXPRESS OR IMPLIED. USE AT YOUR OWN RISK.
2 2
Storage Performance Management © 2012 Storage Networking Industry Association. All Rights Reserved. 3
Abstract
Storage Performance Management (SPM), Storage Architecture and SMI-S
This session will appeal to Storage Managers, Performance and Capacity Managers, and those that are seeking a fundamental understanding of storage performance management. This session includes an overview of the processes, technology and skills required to implement SPM, as well as an overview of disk storage system architecture, and the SMI-S specification as it relates to block level performance. The focus is on block level storage systems.
3
Storage Performance Management © 2012 Storage Networking Industry Association. All Rights Reserved.
Storage Performance Management (SPM)
4

Storage Performance Management © 2012 Storage Networking Industry Association. All Rights Reserved.
How Large is Storage Expenditure?
Where will you be in 2012? Reduce storage costs by implementing SPM
5
-
5.00
10.00
15.00
20.00
25.00
30.00
35.00
40.00
2010 2011 2012 2013 2014 2015
IT Storage Spend Forecast (Billion)
Source: [1]

Storage Performance Management © 2012 Storage Networking Industry Association. All Rights Reserved.
What is Storage Performance Management (SPM)?
Processes to ensure that applications receive the required service levels from storage systems, while storage assets are efficiently used. This means ensuring that the storage hardware
resources are used efficiently with neither unnecessary hardware components nor components reaching critical utilization levels! It is not the same as Storage Resource Management (SRM) as SRM is about space management.
6

Storage Performance Management © 2012 Storage Networking Industry Association. All Rights Reserved.
Benefits of SPM
Three Cases for Reducing Storage costs Risk reduction: Loss of business by performance outage that could have been avoided Right Sizing: Picking the exact right storage options results in more value for less money Storage optimization: hardware savings
How about being able to delay a 40 million USD investment for 9 months?
7

Storage Performance Management © 2012 Storage Networking Industry Association. All Rights Reserved.
Risks
8
Over configured: Efficiency issues
Sweet spot: Right performance Right Cost
size (and cost) of storage configuration
Cost Performance
Utilization levels
Under configured: Performance issues
Lower
Higher
Risk is not removed: Hot spots will still occur from time due to imbalance
The cost difference between these two is often 30% or more
of all storage.
Storage Performance Management © 2012 Storage Networking Industry Association. All Rights Reserved.
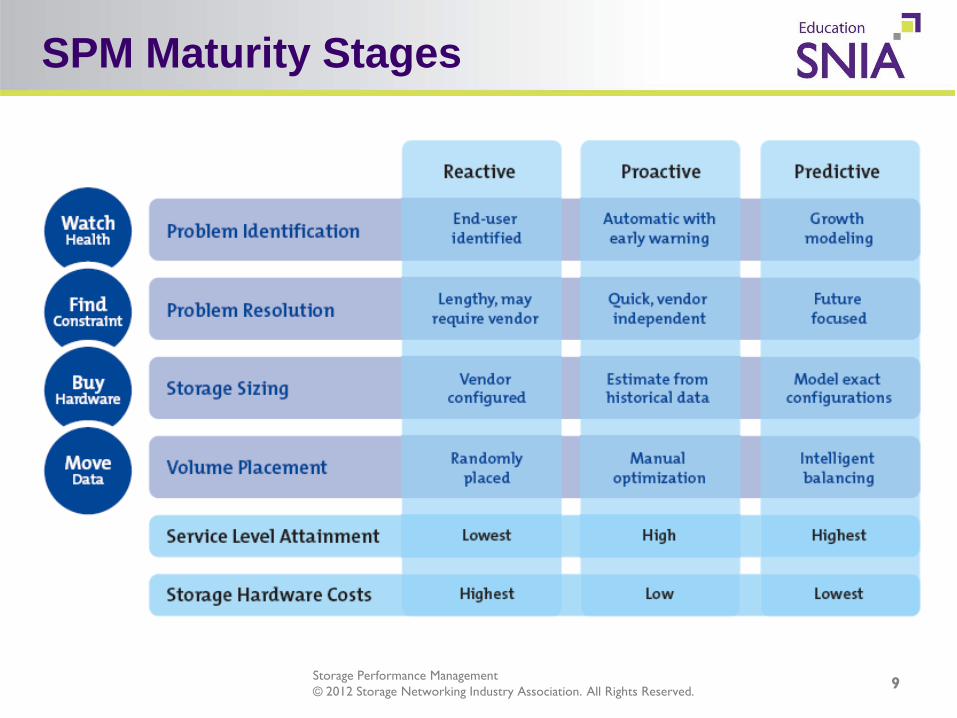
SPM Maturity Stages
9
Storage Performance Management © 2012 Storage Networking Industry Association. All Rights Reserved.
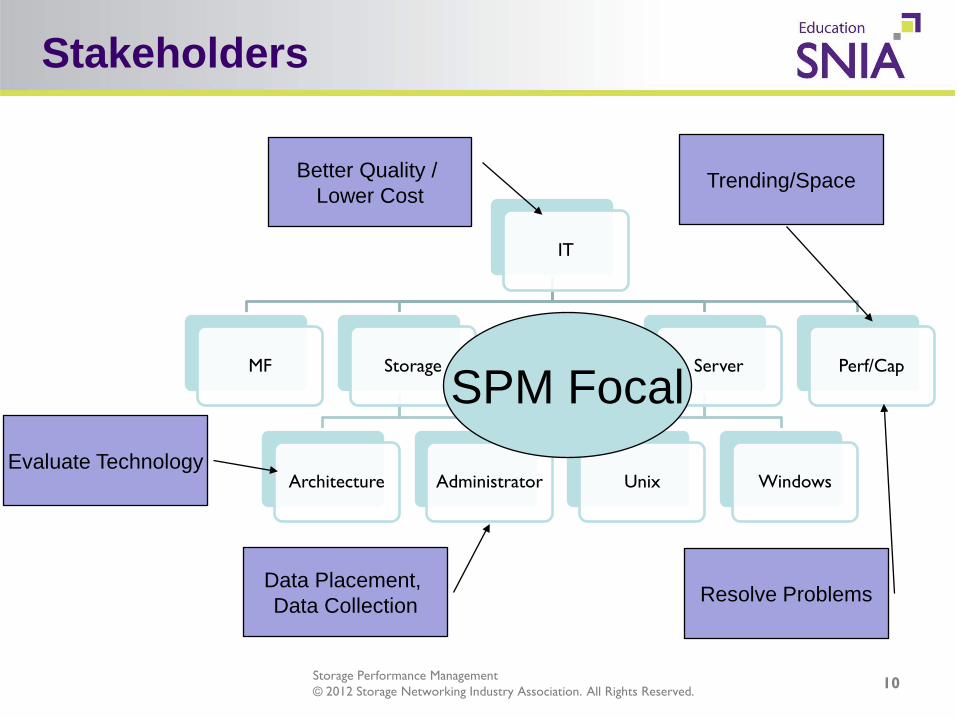
Stakeholders
IT
MF Storage
Architecture Administrator
Server
Unix Windows
Perf/Cap
Better Quality / Lower Cost
Trending/Space
Evaluate Technology
Data Placement, Data Collection Resolve Problems
SPM Focal
10
Storage Performance Management © 2012 Storage Networking Industry Association. All Rights Reserved.
Trends Affecting Storage Performance
11

Storage Performance Management © 2012 Storage Networking Industry Association. All Rights Reserved.
HDD Capacity Growth Annually
0.00
0.01
0.10
1.00
10.00
100.00
1,000.00
10,000.00
1956
1958
1960
1962
1964
1966
1968
1970
1972
1974
1976
1978
1980
1982
1984
1986
1988
1990
1992
1994
1996
1998
2000
2002
2004
2006
2008
2010
2012
2014
Year
Size i
n GB
Drive
Capacity Doubles
every two years
RAMAC
2 3 1 4
3 3 50
3 3 80
3 390
Mod
ern
Dis
ks
HDD Capacity Growth Over Time
12
Storage Performance Management © 2012 Storage Networking Industry Association. All Rights Reserved.
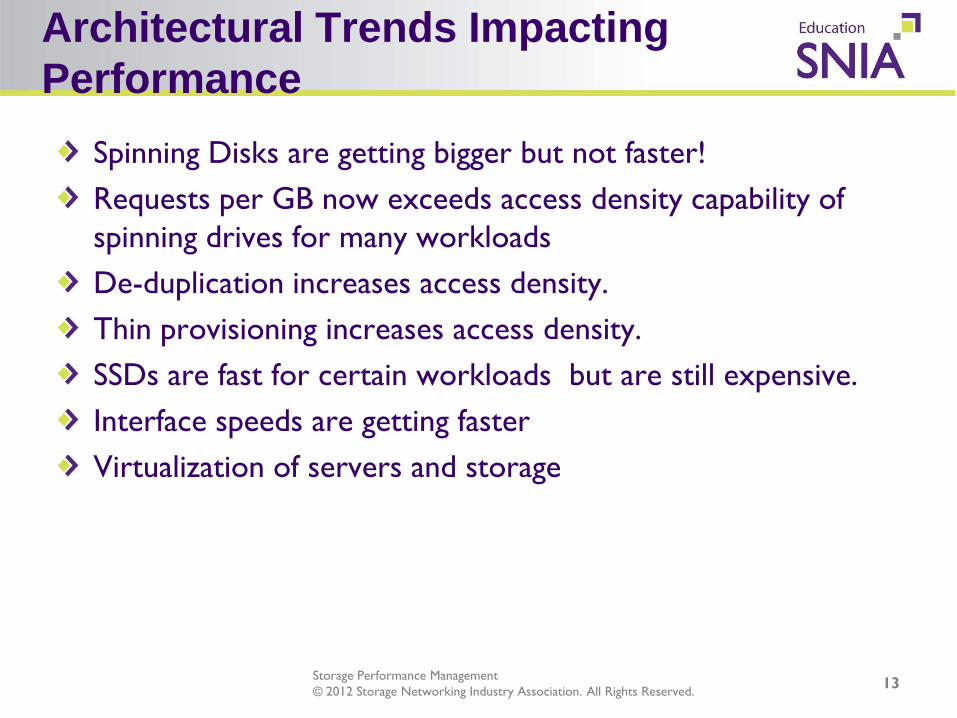
Architectural Trends Impacting Performance
Spinning Disks are getting bigger but not faster! Requests per GB now exceeds access density capability of spinning drives for many workloads De-duplication increases access density. Thin provisioning increases access density. SSDs are fast for certain workloads but are still expensive. Interface speeds are getting faster Virtualization of servers and storage
13

Storage Performance Management © 2012 Storage Networking Industry Association. All Rights Reserved.
Other Trends
Commoditization of hardware Block level virtualization Blurring of line between file and block level storage Many different kinds of “load balancing” solutions Server virtualization Move to clouds Big Data and scalability issues Encryption requirements Drive capacity increasing faster than error correction rates.
14

Storage Performance Management © 2012 Storage Networking Industry Association. All Rights Reserved.
Disk Technology
15

Storage Performance Management © 2012 Storage Networking Industry Association. All Rights Reserved.
Service Time
Protocol time Very small < 0.5 ms
Average seek, assuming fully used HDD
Range 3.6 – 10 ms depending on technology
Latency Range 2 – 5 ms
Data transfer for 512 bytes
Very small Total service time for read
From 0.2 to 15 ms
Drive Type Protocol Seek Latency Total
SATA 1? 9 4.1 14
10k RPM Fibre 0.3? 4.7 3 8
15k RPM Fibre 0.2? 3.6 2 5.8
SSD 0.2? 0 0 0.2
16

Storage Performance Management © 2012 Storage Networking Industry Association. All Rights Reserved.
Example: Thin Provisioning Capacity
Thick Provisioning
300 GB drives
Thin Provisioning 600 GB Drives
Total User Space made available 100 TB 100 TB
Used space on LUNs 30% 30%
Allocated on back-end storage 100 TB (all user space) 40 TB (30% of 100 TB
+ safety margin)
RAID Groups required 50 (2TB = 1 RAID Group @ 300 GB)
10 (4 TB = 1 RAID Group @ 600 GB)
Thick requires 5x the capacity!
What about the performance?
17

Storage Performance Management © 2012 Storage Networking Industry Association. All Rights Reserved.
Thin Provisioning - Performance
Thick Provisioning 300 GB drives
Thin Provisioning 600 GB Drives
Total User I/O ops per second per 100 TB 25,000 25,000
Available Drives 50 RAID Groups
400 drives 10 RAID Groups
80 drives
I/Os per drive per second
25,000 / 400 = 62.5 ops/sec/drive
25,000 / 80 = 312.5 ops/sec/drive
Performance Good Will not work..
Access Density for Thin = 5x
Thick
Will Thin work for your
workload?
18

Storage Performance Management © 2012 Storage Networking Industry Association. All Rights Reserved.
Extent Level Automated Tiering
Is the analysis period looking
at the right time frame?
What happens to dynamic workloads?
19

Storage Performance Management © 2012 Storage Networking Industry Association. All Rights Reserved.
RAID
20
Storage Performance Management © 2012 Storage Networking Industry Association. All Rights Reserved.
RAID Considerations
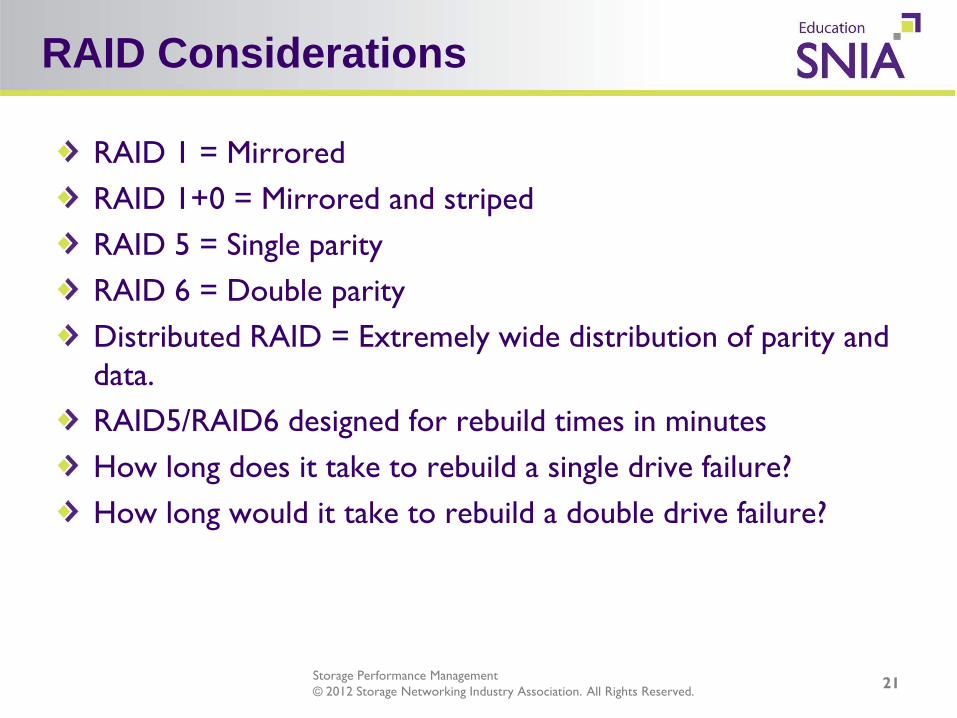
RAID 1 = Mirrored RAID 1+0 = Mirrored and striped RAID 5 = Single parity RAID 6 = Double parity Distributed RAID = Extremely wide distribution of parity and data. RAID5/RAID6 designed for rebuild times in minutes How long does it take to rebuild a single drive failure? How long would it take to rebuild a double drive failure?
21
Storage Performance Management © 2012 Storage Networking Industry Association. All Rights Reserved.
RAID Rebuild Samples
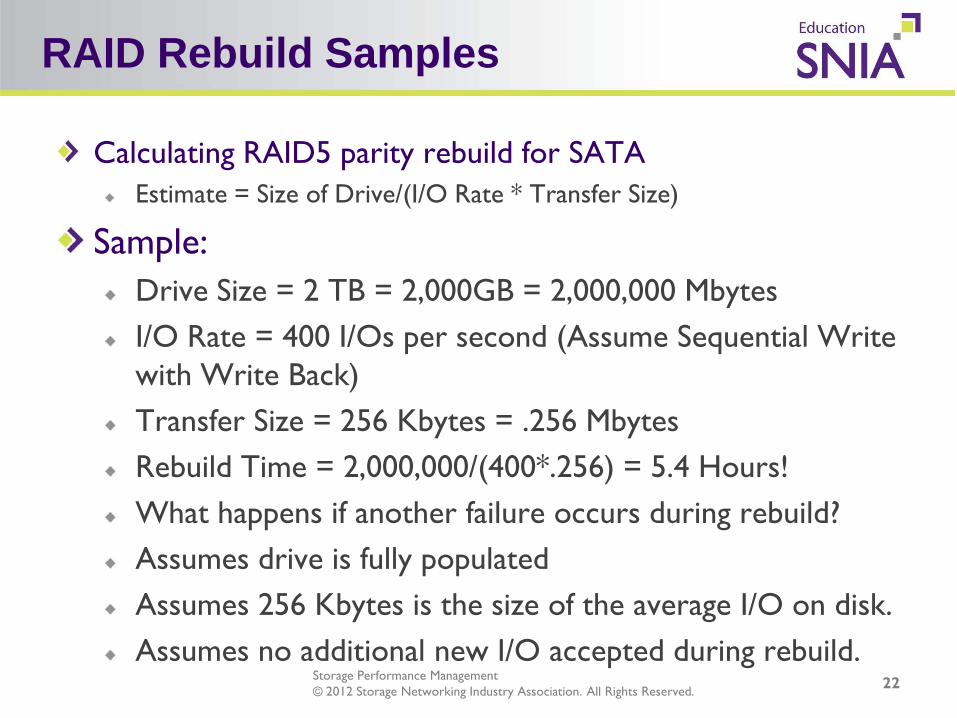
Calculating RAID5 parity rebuild for SATA Estimate = Size of Drive/(I/O Rate * Transfer Size)
Sample: Drive Size = 2 TB = 2,000GB = 2,000,000 Mbytes I/O Rate = 400 I/Os per second (Assume Sequential Write with Write Back) Transfer Size = 256 Kbytes = .256 Mbytes Rebuild Time = 2,000,000/(400*.256) = 5.4 Hours! What happens if another failure occurs during rebuild? Assumes drive is fully populated Assumes 256 Kbytes is the size of the average I/O on disk. Assumes no additional new I/O accepted during rebuild.
22
Storage Performance Management © 2012 Storage Networking Industry Association. All Rights Reserved.
Storage System Architectures
23

Storage Performance Management © 2012 Storage Networking Industry Association. All Rights Reserved.
Disk Storage System (DSS) Architecture
All vendors agree: Frontend ports (host) and Backend ports Physical (disks) and Cache and Volumes are required
24
Cache
Front-end Adapter
Front-end Adapter
Back-end Adapter/Ports
Back-end Adapter/Ports
Disks
Extent Pool Volume
Storage Performance Management © 2012 Storage Networking Industry Association. All Rights Reserved.
Processors and Cache
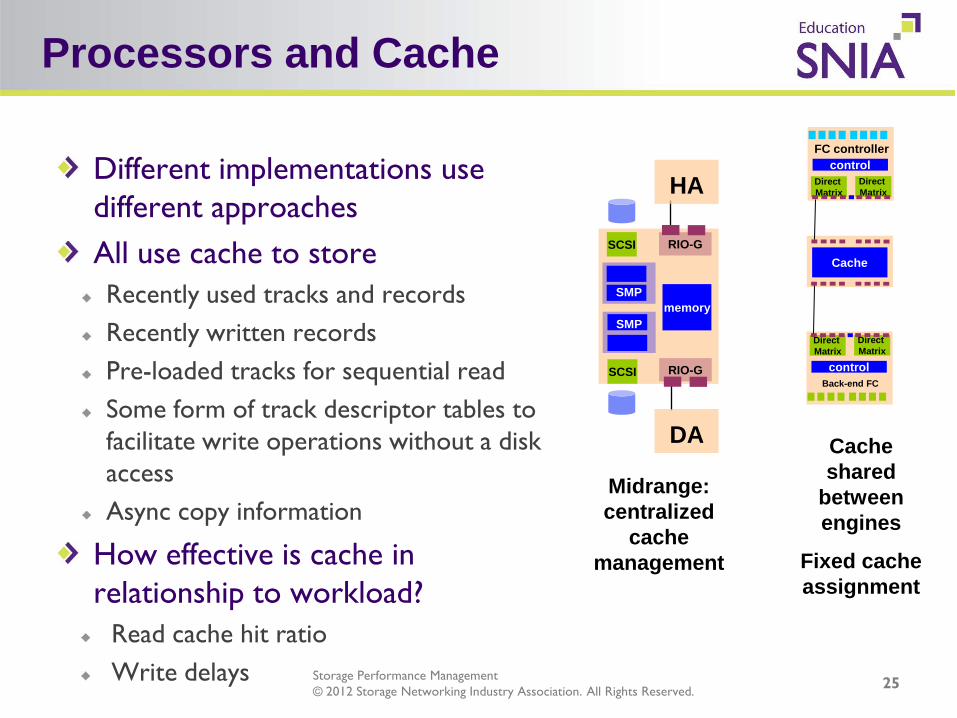
Different implementations use different approaches All use cache to store Recently used tracks and records Recently written records Pre-loaded tracks for sequential read Some form of track descriptor tables to facilitate write operations without a disk access Async copy information
How effective is cache in relationship to workload?
Read cache hit ratio Write delays 25
memory
SCSI
SCSI RIO-G
RIO-G
SMP
SMP
Midrange: centralized
cache management
Direct Matrix
Direct Matrix
control FC controller
Direct Matrix
Direct Matrix
control Back-end FC
Cache
Cache shared
between engines
Fixed cache assignment
HA
DA

Storage Performance Management © 2012 Storage Networking Industry Association. All Rights Reserved.
Front-end Adapter
We want to know how utilized the Front end adapters are.
Utilization = I/O Rate * Service Time But we don’t always have Service Time! Vendor specific clues – Write delays, Queue Length, Slot Collisons Cache hits
Front-end Ports may include: I/Os and Kbytes/sec Response time We usually have the throughput capacity, but it can be overstated. Estimate Bandwidth Utilization; (Kbytes/sec)/.8 * Rated Capacity
Host Adapter (generic)
Processor
Fibre Channel Protocol Engine
Fibre Channel Protocol Engine
Data Mover
Buffer
26

Storage Performance Management © 2012 Storage Networking Industry Association. All Rights Reserved.
Device Adapters
Connect HDDs to internal disk system resources Manage RAID operations, sometimes using cache memory for RAID computations Configured in pairs to provide redundancy if one adapter fails HDD interfaces include various generations of SCSI, SSA, FC-AL, SATA and SSD FC-AL switched back-end are gradually being replaced by SAS back-ends We want to know how utilized the backend disk adapter is? Not all vendors provide backend adapter statistics:
Utilization = I/O Rate * Service Time But we don’t always have Service Time! We have throughput capacity and we have throughput Estimate bandwidth utilization = KBytesTransferred/Capacity*.8
27
DA
Processor
Fibre Channel Protocol Engine
Data Mover RAID ASIC
Buffer
Fibre Channel Protocol Engine

Storage Performance Management © 2012 Storage Networking Industry Association. All Rights Reserved.
Disk Drive
Spinning drives limited on IOPS, operations in milliseconds
Mechanically constrained
SSD drives operations in microseconds
Interface and capacity constrained
Measurements may include: Queue depth, service time Read/Write IOPS Read/Write throughput Utilization
28
Storage Performance Management © 2012 Storage Networking Industry Association. All Rights Reserved.
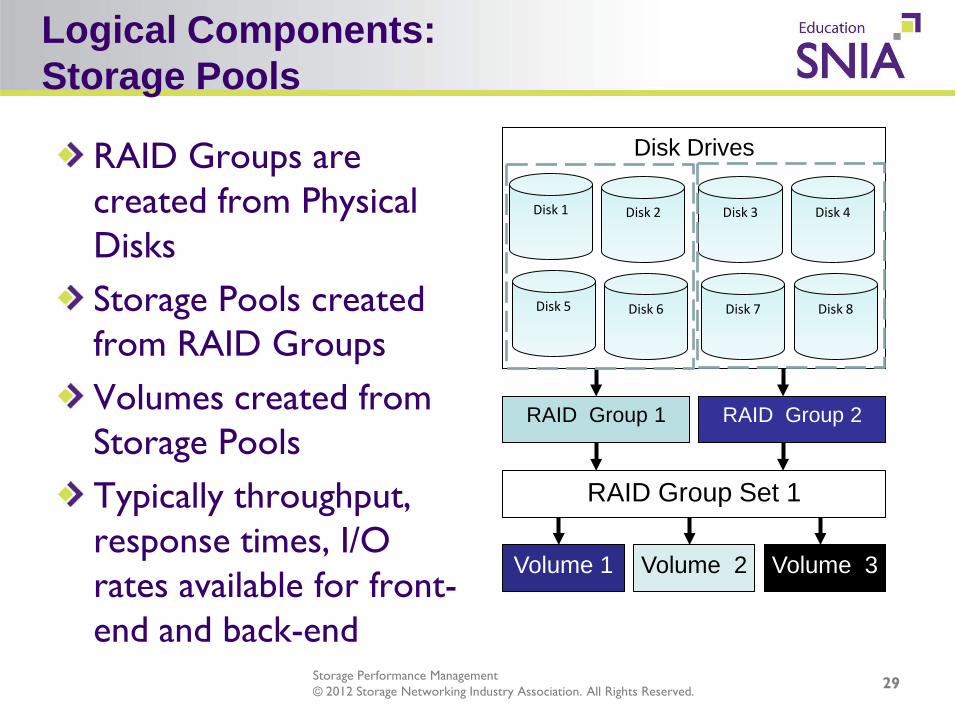
Logical Components: Storage Pools
RAID Groups are created from Physical Disks Storage Pools created from RAID Groups Volumes created from Storage Pools Typically throughput, response times, I/O rates available for front-end and back-end
29
RAID Group 1
Disk Drives
Disk 1 Disk 2 Disk 3 Disk 4
Disk 5 Disk 6 Disk 7 Disk 8
RAID Group Set 1
Volume 1
RAID Group 2
Volume 2 Volume 3

Storage Performance Management © 2012 Storage Networking Industry Association. All Rights Reserved.
Logical Volumes
30
Metavolume 1
Volume 1
Disk Drives
Disk 1 Disk 2 Disk 3 Disk 4
RAID 5
Parity 123 Parity 456
Parity 789 Parity abc
Parity def
Data 1 Data 2 Data 3 Data 4 Data 5 Data 6 Data 7 Data 8 Data 9 Data a Data b Data c
Data d Data e Data e
Volume 5
Disk Drives
Disk 5 Disk 6 Disk 7 Disk 8
RAID 5
Parity 123 Parity 456
Parity 789 Parity abc
Parity def
Data 1 Data 2 Data 3 Data 5 Data 6
Data 7 Data 8 Data 9 Data b Data c Data d Data e Data e
Data 4
Data a
Volume 1
Volume 2
Storage Performance Management © 2012 Storage Networking Industry Association. All Rights Reserved.
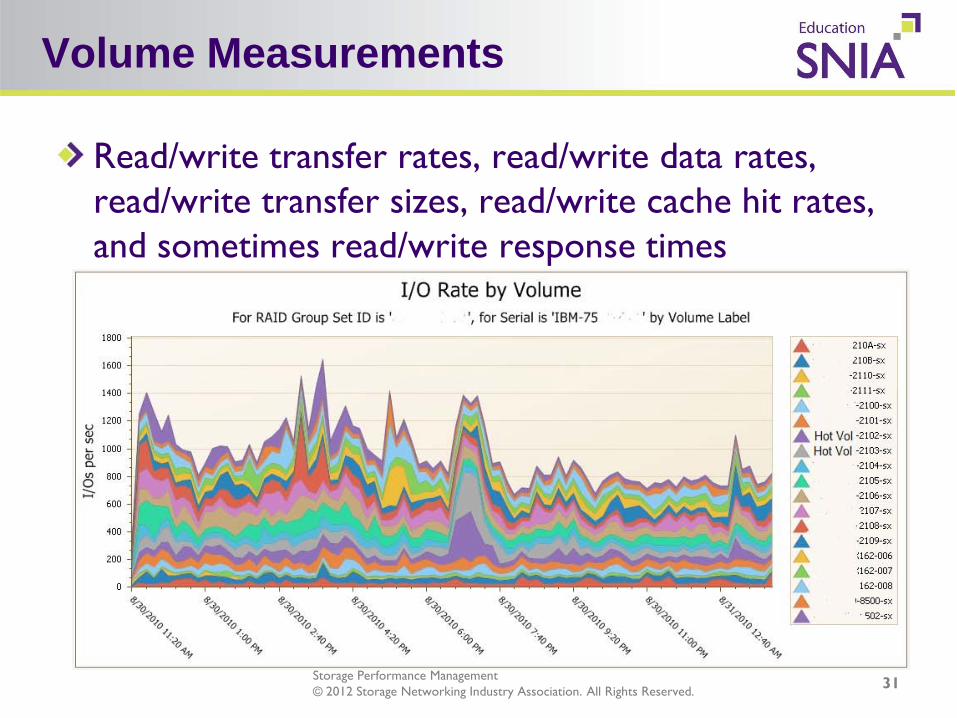
Volume Measurements
Read/write transfer rates, read/write data rates, read/write transfer sizes, read/write cache hit rates, and sometimes read/write response times
31
Storage Performance Management © 2012 Storage Networking Industry Association. All Rights Reserved.
Data Collection
32

Storage Performance Management © 2012 Storage Networking Industry Association. All Rights Reserved.
SPM Technology: Vendor Specific Versus Vendor Neutral
Feature Vendor Specific SMI-S (Vendor Neutral)
Communication between tool and storage device
Vendor proprietary fast protocol Standard XML based communication for all exchanges
Support for platform specific metrics
No distinction between standard and platform specific metrics
Requires minimum number of fields, but supports vendor extensions for extra fields and components
Compatibility with other hardware
Specific to one hardware platform Any hardware supporting SMI-S
Third party access Few documented interfaces, different interfaces for each platform
Open specification to any tool vendor
Provisioning Support Designed for specific hardware Difficult to support with SMI-S due to hardware specific implementations
33

Storage Performance Management © 2012 Storage Networking Industry Association. All Rights Reserved.
SMI-S
SMI-S is a vendor independent protocol to manage storage subsystems via a HTTP/HTTPS based protocol. Common standard across all vendors Provide both topology and performance information Standard scope includes storage, switches, and servers Performance measurement is commonly supported
http://www.snia.org/tech_activities/standards/curr_standards/smi
34
Storage Performance Management © 2012 Storage Networking Industry Association. All Rights Reserved.
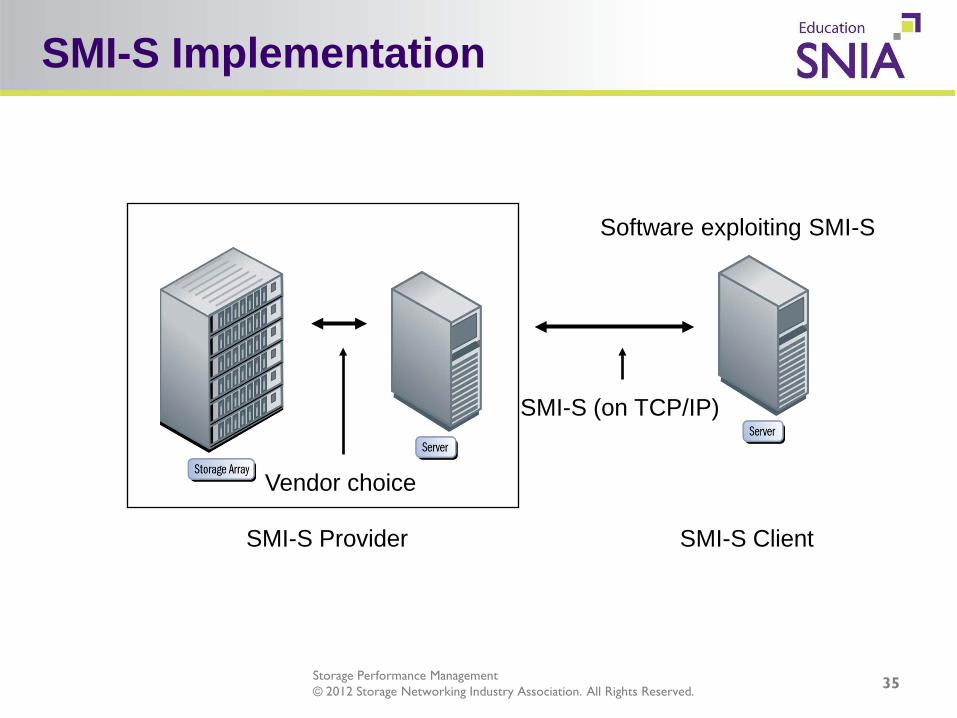
SMI-S Implementation
35
Software exploiting SMI-S
SMI-S (on TCP/IP)
Vendor choice
SMI-S Provider SMI-S Client
Storage Performance Management © 2012 Storage Networking Industry Association. All Rights Reserved.
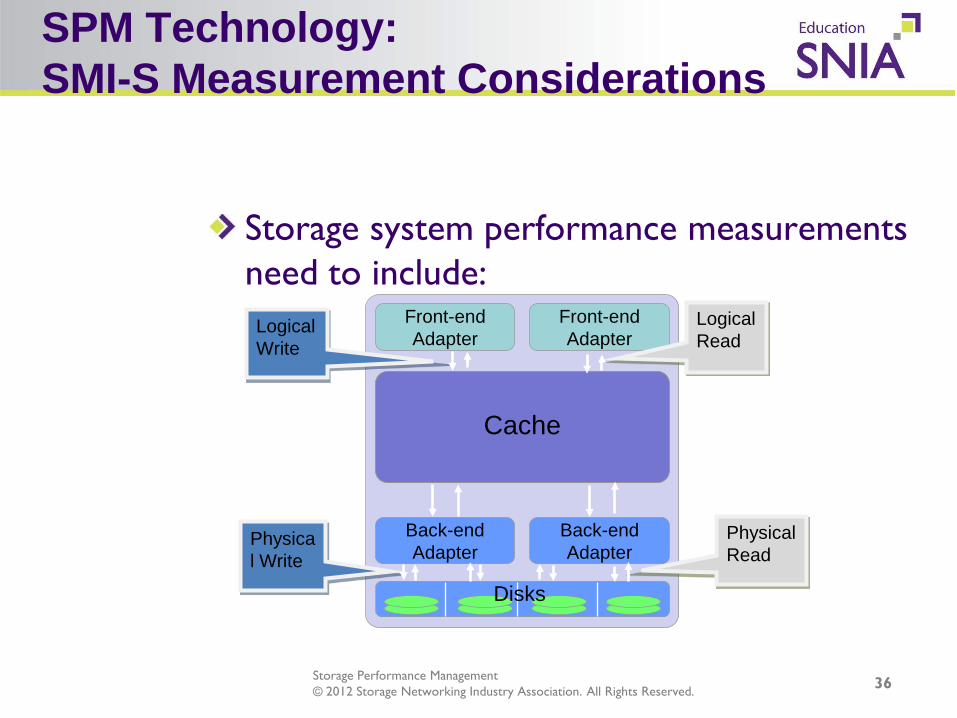
SPM Technology: SMI-S Measurement Considerations
Storage system performance measurements need to include:
Cache
Front-end Adapter
Front-end Adapter
Back-end Adapter
Back-end Adapter
Disks
Logical Write
Logical Read
Physical Write
Physical Read
36
Storage Performance Management © 2012 Storage Networking Industry Association. All Rights Reserved.
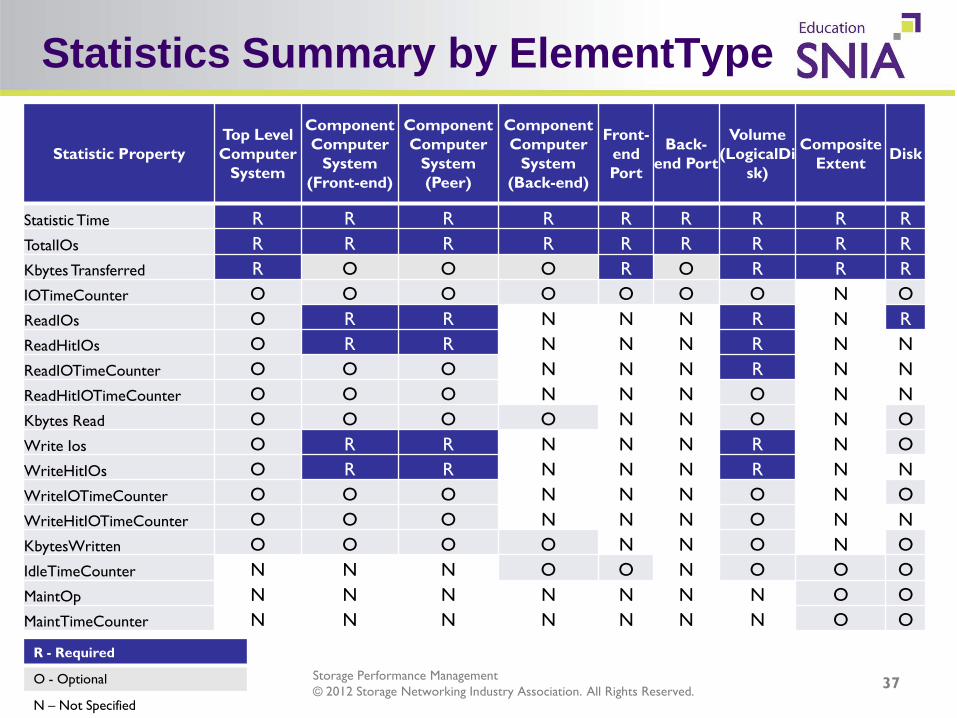
Statistics Summary by ElementType
Statistic Property Top Level Computer
System
Component Computer
System (Front-end)
Component Computer
System (Peer)
Component Computer
System (Back-end)
Front-end Port
Back-end Port
Volume (LogicalDi
sk)
Composite Extent Disk
Statistic Time R R R R R R R R R TotalIOs R R R R R R R R R Kbytes Transferred R O O O R O R R R IOTimeCounter O O O O O O O N O ReadIOs O R R N N N R N R ReadHitIOs O R R N N N R N N ReadIOTimeCounter O O O N N N R N N ReadHitIOTimeCounter O O O N N N O N N Kbytes Read O O O O N N O N O Write Ios O R R N N N R N O WriteHitIOs O R R N N N R N N WriteIOTimeCounter O O O N N N O N O WriteHitIOTimeCounter O O O N N N O N N KbytesWritten O O O O N N O N O IdleTimeCounter N N N O O N O O O MaintOp N N N N N N N O O MaintTimeCounter N N N N N N N O O
37
R - Required
O - Optional
N – Not Specified

Storage Performance Management © 2012 Storage Networking Industry Association. All Rights Reserved.
Relationships – A simple example
Configuration data is necessary to provide the relationships between the elements:
Which LUNs are defined on which extent pool Which physical drives make up an array group Which port (types) are connected to each (host adapter)
38
Disks
Extent/ Raid Group
Volume
Front End

Storage Performance Management © 2012 Storage Networking Industry Association. All Rights Reserved.
Summary
The goal of storage performance management (SPM) is to reduce storage costs while maintaining performance SLAs. SPM consists of:
Processes Measurement Skills
SMI-S provides a solid foundation for obtaining the necessary measurements to implement SPM
39

Storage Performance Management © 2012 Storage Networking Industry Association. All Rights Reserved.
Q&A / Feedback
Please send any questions or comments on this presentation to SNIA: [email protected]
40 40
Many thanks to the following individuals for their contributions to this tutorial.
- Brett Allison Gilbert Houtekamer

Storage Performance Management © 2012 Storage Networking Industry Association. All Rights Reserved.
References
41
[1] “User Spending on Enterprise Storage Systems Reached $31 Billion in 2010”
http://storagenewsletter.com/news/marketreport/user-idc--enterprise-storage-systems-2010

Storage Performance Management © 2012 Storage Networking Industry Association. All Rights Reserved.
Bridging the Visibility Gap
An effective Storage Performance Management (SPM) solution must:
Provide visibility inside the storage system where 70% of the bottlenecks occur, and Automatically correlate your workload metrics with the specific hardware component capabilities.
42