stockland 1h20 results · driving a 64% increase in page views for gifts logistic assets website...
TRANSCRIPT

1H20 Results19 February 2020
BARINGA, QLD
For
per
sona
l use
onl
y

Gro
up
u
pd
ate
Fin
an
cia
l resu
lts an
d
cap
ital m
an
ag
em
en
tC
om
merc
ial
Pro
perty
Co
mm
un
ities
Su
mm
ary
an
d o
utlo
ok
Figures are rounded to nearest million, unless otherwise stated.
Percentages are calculated based on the figures rounded to one decimal place.
Percentage changes are calculated on the prior corresponding period unless otherwise stated.
Mark SteinertManaging Director & CEO
Group update
Tiernan O’RourkeCFO
Financial results and capital management
Andrew WhitsonGroup Executive & CEO, Communities
Communities
Louise MasonGroup Executive & CEO, Commercial Property
Commercial Property
Mark SteinertManaging Director & CEO
Summary and outlook
Agenda
1H20 Results Presentation2
For
per
sona
l use
onl
y

Gro
up
u
pd
ate
Fin
an
cia
l resu
lts an
d
cap
ital m
an
ag
em
en
tC
om
merc
ial
Pro
perty
Co
mm
un
ities
Su
mm
ary
an
d o
utlo
ok
Group updateMark Steinert
WILLAWONG DISTRIBUTION CENTRE, QLD1H20 Results Presentation3
For
per
sona
l use
onl
y

Gro
up
u
pd
ate
Fin
an
cia
l resu
lts an
d
cap
ital m
an
ag
em
en
tC
om
merc
ial
Pro
perty
Co
mm
un
ities
Su
mm
ary
an
d o
utlo
ok
Result on track for full year guidanceFFO reflects second half skew in Communities6 months to 31 December 2019
1. Funds from operations (FFO) and Adjusted Funds From Operations (AFFO) are determined with reference to the PCA guidelines.
2. Compared to 30 June 2019 NTA per security of $4.04.
1H20 Results Presentation
Statutory profit
$504m+68.1%
Net tangible assets (NTA) per security
$4.12+2.0%2
FFO per security1
16.1 cents(4.2)%
AFFO per security1
14.2 cents(2.7)%
Distribution per security (DPS)
13.5 cents
$384m(5.6)%
Funds from operations1 (FFO)
84%Distribution payout ratio
4
Adjusted FFO (AFFO)1
$338m(4.2)%
Commercial Property
$199mNet valuation uplift
For
per
sona
l use
onl
y

Gro
up
u
pd
ate
Fin
an
cia
l resu
lts an
d
cap
ital m
an
ag
em
en
tC
om
merc
ial
Pro
perty
Co
mm
un
ities
Su
mm
ary
an
d o
utlo
ok
Strong momentum delivering key strategic priorities6 months to 31 December 2019
1H20 Results Presentation5
Priority Achievements
Increase Workplace and
Logistics weighting
Acquisition
• Portfolio weighting increased to 26% (from 23%)
• Acquired remaining 50% interest in Stockland Piccadilly, Sydney (NSW) for $347m
• Entered into contracts to acquire $121m North Sydney (NSW) office development, site amalgamation1
• Purchased two Brisbane (QLD) logistics developments in prime industrial zone on an initial yield of 6%
Development • Doubled development pipeline to $4.3bn2
Improve the quality
of our portfolio
Logistics
• Stage 1 DA approved at M_Park Business Campus (NSW) $500m2 development
• Optus renewed 84,194 sqm lease at Optus Campus, Macquarie Park (NSW) for 12 years
• Completed $57m developments, IRRs >8%3, FFO yields >6.5%
• Divested non core assets for $114m4
Retail• 3.3% growth in comparable MAT reflecting remixing and non discretionary focus
• Completed the settlement of $220m4 non core retail divestments
Accelerate Communities
growth opportunities
Residential Communities• Competitive advantage drives increased residential market share from 15% (at 30 June 2019) to 16%5
• Executed early cycle restocking with acquisition of 1,500 lots at Donnybrook (VIC)
Retirement Living• DAs for land lease communities at Aura (QLD) and North Shore (QLD) lodged
• Progressing business improvement plan with 12% increase in established sales in 1H20 compared to 1H19
Broaden sources
of capitalGroup
• Joint venture at Kemps Creek, Western Sydney (NSW) with Fife Group, $1.1bn6 end value
• 50/50 strategic capital partnership at Aura, a $5bn6 masterplanned community in QLD, with Capital Property Group
(CPG) investing at around 30% premium to book value
• Debt facility with Clean Energy Finance Corporation (CEFC) for $75m
1. Acquisition of 118 Walker Street completed on 8 November 2019, acquisition of 122 Walker Street expected to complete in July 2020.
2. Stockland share of expected incremental development spend, excluding land cost and subject to planning approval.
3. Estimated 10 year IRR on completion.
4. Transactions previously announced in FY19 results disclosures.
5. National Land Survey, June 2019, Research4 – annual market share 1H20 (Greater Sydney, Melbourne, Perth and South East QLD).
6. Estimated end value, represents 100% interest.
For
per
sona
l use
onl
y

Gro
up
u
pd
ate
Fin
an
cia
l resu
lts an
d
cap
ital m
an
ag
em
en
tC
om
merc
ial
Pro
perty
Co
mm
un
ities
Su
mm
ary
an
d o
utlo
ok
Sustainability leadership
Driving operational excellence
1. RepTrak March 2019 Report.
Capability
People and leadership
Remuneration review
External review underway of our remuneration
structure to align reward with our refreshed
strategic priorities
Building culture and capabilities
Strengthening Stockland, an integrated
program of culture change, focused on
leadership, structure, capability, processes and
systems will underpin our strategic delivery
Board charter and key policies
Focus on governance and compliance with key
workstreams on whistleblowing, sustainability,
climate change and modern slavery
ShopAl Campaign
Christmas digital shopping guide chatbot
driving a 64% increase in page views for gifts
Logistic assets website
Interactive floor plans for tenants
Stockland Loyalty
Driving residential sales with Refer-a-Friend
and Buy Again
Customer innovation
2nd globally
In the Dow Jones Sustainability Index
10 years rated in global top five
Global Sector Leader
For Listed, Diversified – Office/Retail
in the Global Real Estate Sustainability Benchmark
Climate A-List
Fourth year on CDP Climate A-List
Only Australian company consistently recognised
AAA ESG rating
MSCI ESG Rating
1H20 Results Presentation6
Our brand ranked in the top 30
Companies in Australia with Reputation Score
outranking all our peers in the property
industry1
Live chat for Residential sales
~4,000 enquiries, $16m in sales to date
Rolled out nationally in September 2019
For
per
sona
l use
onl
y
Gro
up
u
pd
ate
Fin
an
cia
l resu
lts an
d
cap
ital m
an
ag
em
en
tC
om
merc
ial
Pro
perty
Co
mm
un
ities
Su
mm
ary
an
d o
utlo
ok
Financial results and capital managementTiernan O’Rourke
Artist Impression M_PARK, NSW
For
per
sona
l use
onl
y

Gro
up
u
pd
ate
Fin
an
cia
l resu
lts an
d
cap
ital m
an
ag
em
en
tC
om
merc
ial
Pro
perty
Co
mm
un
ities
Su
mm
ary
an
d o
utlo
ok
Capital positionAt 31 December 2019
1. Based on S&P methodology.
2. Assuming no material change in market conditions.
1H20 Results Presentation8
Fixed / hedge ratio as at period end
70%
Weighted average debt maturity
5.4 yearsExpected weighted average cost of debt
4.0%
Gearing within target range
20-30%
Interest cover1
5.0:1
Weighted average cost of debt
4.4% 26.1%
Gearing
FY20 outlook2
Investment grade credit ratings
A-/Stable S&P
Moody’sA3/Stable26.7% at 30 June 2019
For
per
sona
l use
onl
y

Gro
up
u
pd
ate
Fin
an
cia
l resu
lts an
d
cap
ital m
an
ag
em
en
tC
om
merc
ial
Pro
perty
Co
mm
un
ities
Su
mm
ary
an
d o
utlo
ok
Strong operating cash flows
1H20 Results Presentation9
Key areas of capital employed
• Strong operating cashflows covering distributions and funding growth
• Operating cash flows increased due to strong residential revenue and
lower residential development expenditure
• 61% of land acquired on capital efficient terms
• Commercial Property expenditure primarily relates to acquisitions and
developments undertaken
Funding and liquidity
• Retail divestments of $220m2, with up to a further $500m non core
retail divestmentsover time in a disciplined way
• Target further disposal of non core Retirement Living villages
• 26.1% gearing is within target range of 20-30% (26.7% at 30 June 2019)
$m
$m 1H20 1H19
Operating cash flow before land acquisitions 569 186
Includes residential cash flows as follows
Sales and other revenue 789 660
Current year stage costs (106) (122)
Future stage infrastructure costs (228) (380)
SG&A and other costs (90) (93)
Total 365 65
140 140
373 373
1035
509386
245 245
569
(336)
662
53
(579)
(123)
(141)
-
200
400
600
800
1,000
1,200
30-Jun-19opening cash
balance
Operatingcashflow
before landacquisitions
Distributions Sale ofinvestments
Net proceedsfrom
borrowings
CP and RLacquisitions
anddevelopment
Landacquisitions
Other 31-Dec-19closing cash
balance
Fin
an
cia
l resu
lts an
d
cap
ital m
an
ag
em
en
t
1. Includes residential and logistics projects.
2. Completed the settlement of transactions previously announced in FY19 results disclosures.
1
For
per
sona
l use
onl
y

Gro
up
u
pd
ate
Fin
an
cia
l resu
lts an
d
cap
ital m
an
ag
em
en
tC
om
merc
ial
Pro
perty
Co
mm
un
ities
Su
mm
ary
an
d o
utlo
ok
Funds from operations
.
1H20 Results Presentation10
$m 1H20 1H19 Change Comparable growth
Logistics 81 81 0.7% 3.9%
Workplace 26 24 7.1% 6.1%
Retail Town Centres 209 218 (4.2)% 0.7%
Trading profit - - -
Commercial Property net overheads (8) (9) (19.4)%
Commercial Property 308 314 (1.7)% 2.0%
Residential Communities 134 142 (6.0)%
Retirement Living 17 20 (13.8)%
Unallocated corporate overheads (27) (32) (15.5)%
Net interest expense (48) (37) 29.5%
Total 384 407 (5.6)%
FFO per security 16.1 cents 16.8 cents (4.2)%
• Non core divestments reduced retail and logistics FFO
• Communities reflects 2H20 skew to high margin Sydney projects, timing of Merrylands Court and The Grove1 and non core village disposals
• Reduced unallocated corporate overheads by 15.5% in 1H20 to $27m and ongoing commitment to reducing our cost base
1. Merrylands Court settled on 9 January 2020. The second of the three tranches at The Grove is expected to settle in 4Q20.
For
per
sona
l use
onl
y

Gro
up
u
pd
ate
Fin
an
cia
l resu
lts an
d
cap
ital m
an
ag
em
en
tC
om
merc
ial
Pro
perty
Co
mm
un
ities
Su
mm
ary
an
d o
utlo
ok
Statutory profit to FFO and AFFO reconciliation
1. Includes Stockland’s share of revaluation gains relating to commercial properties held through joint venture entities.
(1H20: $45m gain; 1H19: $15m gain) and fair value unwinding of ground leases recognised under AASB 16 (1H20: $1m;
1H19: nil).
2. Restructuring cost to improve operational efficiencies and position the business for sustainable growth in the future.
3. The Group has accumulated tax losses of $1.7bn and as a result does not have any near term income tax expense that will be
settled in cash.
4. Includes $2m (1H19: $2m) Retirement Living maintenance capital expenditure.
5. Excludes developments.
1H20 Results Presentation11
$m 1H20 1H19 Change
PCA Reference Statutory profit 504 300 68.1%
Adjusted for:
D1/D4 Amortisation of lease incentives and lease fees 43 39
D5 Straight-line rent (1) (2)
A3/A4 Net change in fair value of Commercial investment property1 (198) (22)
A3/A4 Net unrealised change in fair value of Retirement Living investment properties and obligation 33 27
F2 Unrealised DMF revenue (16) (17)
C2 Net loss/(gain) on financial instruments (6) 40
F2 Net loss/(gain) on other financial assets 1 -
A1/A2 Net loss/(gain) on sale of other non-current assets (11) 10
A6 Net reversal of impairment of inventories - -
B1 Impairment of Retirement Living goodwill 21 10
F2 Restructuring cost2 2 4
E Tax expense/benefit – (non-cash)3 12 18
G Funds from operations (FFO) 384 407 (5.6)%
G2 Maintenance capital expenditure4 (13) (17)
G3 Incentives and leasing costs for the accounting period5 (33) (38)
Adjusted funds from operations (AFFO) 338 352 (4.2)%
AFFO per security 14.2 cents 14.6 cents (2.7)%
The table below shows the reconciliation of statutory profit to FFO with reference to the definitions outlined in the Property
Council of Australia (PCA) white paper “Voluntary best practice guidelines for disclosing FFO and AFFO”
For
per
sona
l use
onl
y
Gro
up
u
pd
ate
Fin
an
cia
l resu
lts an
d
cap
ital m
an
ag
em
en
tC
om
merc
ial
Pro
perty
Co
mm
un
ities
Su
mm
ary
an
d o
utlo
ok
Commercial PropertyLouise Mason
KEYWEST, VIC
For
per
sona
l use
onl
y

Gro
up
u
pd
ate
Fin
an
cia
l resu
lts an
d
cap
ital m
an
ag
em
en
tC
om
merc
ial
Pro
perty
Co
mm
un
ities
Su
mm
ary
an
d o
utlo
ok
Delivering on our strategy
Implementing plan to improve portfolio quality and returns
1H20 Results Presentation13
1. Stockland share of expected incremental development spend, excluding land cost and subject to planning approval.
2. Acquisition of 118 Walker Street completed on 8 November 2019, acquisition of 122 Walker Street expected to complete in July 2020.
3. Exchanged and/or settled from 1 July 2019 to 19 February 2020.
Execute Logistics pipeline
• Completed approximately 45,000 sqm of developments in
the half year including KeyWest (VIC) Distribution Centre
and Yatala (QLD) Stage 1
• Leveraged relationship with high quality retailers to deliver
100% occupancy for the speculatively developed KeyWest
Distribution Centre
• Progressing capital partnerships at Kemps Creek (NSW)
and Melbourne Business Park (VIC)
• M_Park Business Campus (NSW) Stage 1 DA approved
• Development pipeline of over $2.1bn1 including DA
approval for major business park projects M_Park and
refurbishment of Optus Campus, Macquarie Park (NSW)
Grow Workplace
• Secured 100% ownership of Stockland Piccadilly, Sydney
(NSW) in the heart of the CBD, funded through disposal of
50% interest in 135 King Street, Sydney (NSW)
• Strategic acquisition of 118 and 122 Walker Street2
buildings adjacent to our existing asset, creating an
amalgamated landholding of almost 2,300 sqm within the
prime North Sydney CBD (NSW)
• Walker Street acquisitions create potential of up to 60,000
sqm prime office space in close proximity to future Victoria
Cross Metro Station
• Transactions have created development pipeline of over
$2.2bn1 to support future growth
• Growing in-house asset and development management
capability
Strengthen Retail Town Centres
• Improving online resilience through continued remix
from fashion and jewellery to food, services and
experiences
• Strategic program of placemaking with clear deliverables,
projects underway across portfolio of assets
• Improved convenience through enhanced car-parking
and last mile initiatives
• Completed $505m non core retail divestments since
December 2018 with $220m settled in 1H20
• Divested3 $86m of retail centres on behalf of SDRT1, a
Stockland managed fund, 2.7% above 30 June 2019 book
value
• Continuing to assess a further $500m non core
divestments over time in a disciplined way
Co
mm
erc
ial
Pro
perty
Co
mm
un
ities
Su
mm
ary
an
d o
utlo
okF
or p
erso
nal u
se o
nly

Gro
up
u
pd
ate
Fin
an
cia
l resu
lts an
d
cap
ital m
an
ag
em
en
tC
om
merc
ial
Pro
perty
Co
mm
un
ities
Su
mm
ary
an
d o
utlo
ok
Solid operating performance
1H20 Results Presentation14
1. Excludes Unlisted Property Fund assets (19.9% ownership), WIP and sundry properties.
2. Weighted average lease expiry.
3. Weighted average capitalisation rate.
Key metrics Asset value1 FFO
FFO comparable
change Occupancy WALE2 WACR3
Logistics $2,771m $81m 3.9% 98.3% 5.4 yrs 5.7%
Workplace $1,032m $26m 6.1% 94.1% 3.6 yrs 5.9%
Retail Town Centres $6,628m $209m 0.7% 99.4% 6.0 yrs 5.9%
Total $10,431m $316m 2.0% 5.9%
Commercial Property
2.0%FFO comparable growth in 1H20
Strong
occupancy throughout portfolio with a
sustainable WALE2
$10.4bntotal asset value
Co
mm
erc
ial
Pro
perty
For
per
sona
l use
onl
y

Gro
up
u
pd
ate
Fin
an
cia
l resu
lts an
d
cap
ital m
an
ag
em
en
tC
om
merc
ial
Pro
perty
Co
mm
un
ities
Su
mm
ary
an
d o
utlo
ok
Logistics $2,771m2
Solid valuation results
1. By value.
2. Book value at 31 December 2019.
1H20 Results Presentation15
Commercial Property
Retail $6,628m2Workplace $1,032m2
• Retail valuations and cap rates broadly stable,
reflecting prior period rebasing of rents
• Net devaluation driven by Glendale (NSW) and
Cairns (QLD) mainly due to additional capital
expenditure allowance
Net valuation uplift of $199m in 1H20 with 49%1 of assets independently revalued in the last six months
• Uplift driven by development activity, leasing
success and cap rate compression
• Significant uplift at Optus Campus, Macquarie
Park (NSW) following successful lease extension
• Uplift reflects cap rate compression in Sydney assets
• Portfolio WACR impacted by Durack Centre (WA)
5.7% WACR
50bps
5.9% WACR
10bps
5.9% WACR
$(31)m -0.5%$11m +1.0%$219m +7.9% valuation uplift valuation uplift valuation decline
Co
mm
erc
ial
Pro
perty
For
per
sona
l use
onl
y

Gro
up
u
pd
ate
Fin
an
cia
l resu
lts an
d
cap
ital m
an
ag
em
en
tC
om
merc
ial
Pro
perty
Co
mm
un
ities
Su
mm
ary
an
d o
utlo
ok
Gro
up
u
pd
ate
Fin
an
cia
l resu
lts an
d
cap
ital m
an
ag
em
en
tC
om
merc
ial
Pro
perty
Co
mm
un
ities
Su
mm
ary
an
d o
utlo
ok
Logistics
1H20 Results Presentation16
• Portfolio value more than doubled since 31 December 2013
through asset creation
• One of the largest logistics portfolios among listed A-REITs
• 98%1 of assets located on the eastern seaboard
• Valuations improving as quality of portfolio grows
$1.3bn $2.8bn2
31-DEC-13 31-DEC-19
NSW 70%
VIC 19%
QLD 9%
WA, 2%
Portfolio growth and geographic exposure
Growing portfolio delivers strong returns
29assets
$2.8bn2
portfolio value
19% portfolio weighting increased
by 8% from 31-Dec-13
1. By value.
2. Excludes WIP and sundry properties.
3. Estimated end value, represents 100% interest.
4. Stockland share of expected incremental development spend, excluding land cost and subject to planning approval.
Co
mm
erc
ial
Pro
perty
$2.1bn4
development pipeline
Transacted with Fife Group:
• Consolidated a 71Ha land holding3, 50/50 joint venture at Kemps
Creek (NSW), representing a $1.1bn3 end value development
opportunity, proximate to Western Sydney Aerotropolis region
• Purchased Carole Park (QLD) and Richlands (QLD) assets with
development opportunity in Brisbane’s prime industrial zone on an
initial yield of 6%
For
per
sona
l use
onl
y

Gro
up
u
pd
ate
Fin
an
cia
l resu
lts an
d
cap
ital m
an
ag
em
en
tC
om
merc
ial
Pro
perty
Co
mm
un
ities
Su
mm
ary
an
d o
utlo
ok
Performance demonstrates quality of portfolioLogistics
1. Estimated 10 year IRR on completion.
2. Fully leased year 1 yield.
3. Excludes WIP and sundry properties.
4. Estimated end value, represents 100% interest.
5. At 31 December 2019.
6. By income.
1H20 Results Presentation17
Key metrics 1H20 1H19
FFO $81m $81m
Asset value3,5 $2,771m $2,469m
Leased area 300,835 sqm 321,100 sqm
Leases under HOA4,5 107,887 sqm 149,300 sqm
Average rental growth on new leases and renewals 11.5% 1.1%
Portfolio occupancy5,6 98.3% 98.0%
Portfolio WALE5,6 5.4 yrs 5.2 yrs
• Strong comparable FFO growth of 3.9%
• Leasing demand remains strong with 300,835 sqm leased
• Completed $57m developments Stage 1 Yatala (QLD) and KeyWest (VIC):
˗ Approximately 45,000 sqm GLA fully leased
˗ IRRs between 8-10%1, FFO yields >6.5%2
• 86% portfolio retention over 180,094 sqm at 14% weighted average base
rent growth
• Lease extension at Optus Campus, Macquarie Park (NSW) for 12 years,
84,194 sqm NLA resulting in $52m net valuation uplift (Stockland share)
• Melbourne Business Park partnership with Mt Atkinson Holdings:
˗ 260 Ha site with potential $2bn end value4
˗ Extensive main road frontage, located in transport corridor
˗ Largest industrial project for Melbourne’s growing west
˗ $190m Stage 1 subdivision planning approval granted in 2Q20
For
per
sona
l use
onl
y
Gro
up
u
pd
ate
Fin
an
cia
l resu
lts an
d
cap
ital m
an
ag
em
en
tC
om
merc
ial
Pro
perty
Co
mm
un
ities
Su
mm
ary
an
d o
utlo
ok
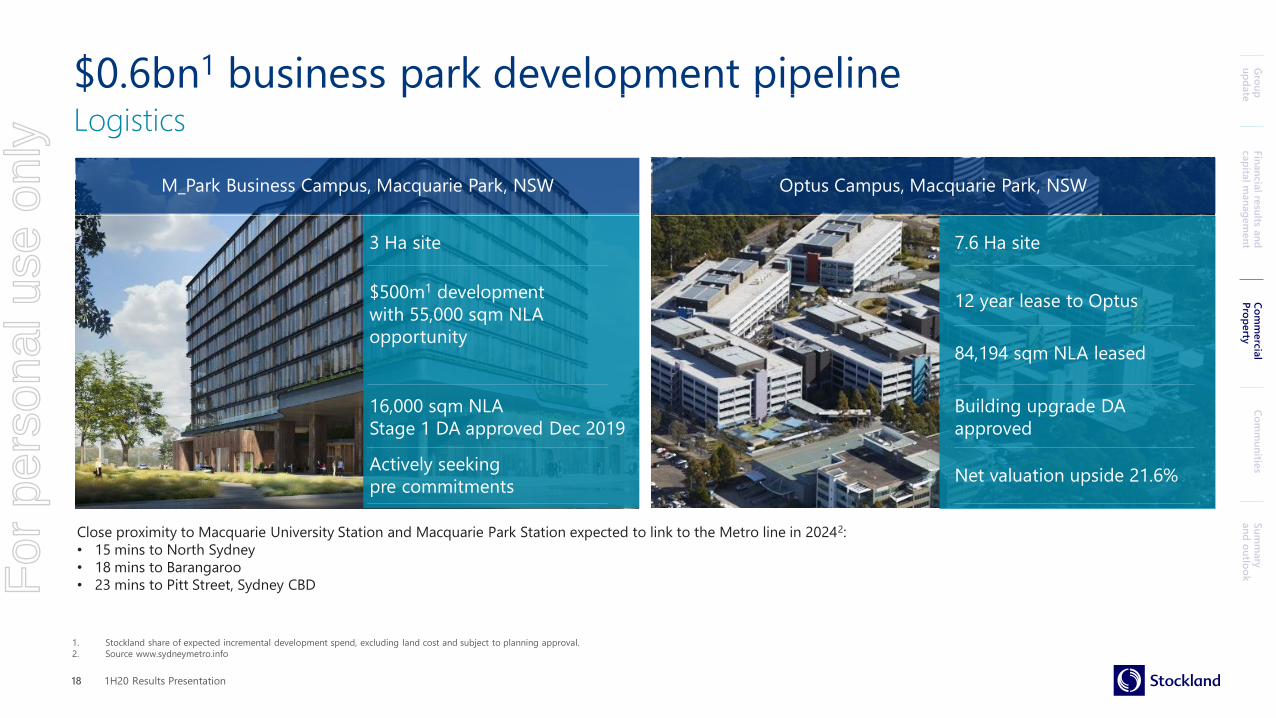
$0.6bn1 business park development pipelineLogistics
1H20 Results Presentation18
1. Stockland share of expected incremental development spend, excluding land cost and subject to planning approval.
2. Source www.sydneymetro.info
Close proximity to Macquarie University Station and Macquarie Park Station expected to link to the Metro line in 20242:
• 15 mins to North Sydney
• 18 mins to Barangaroo
• 23 mins to Pitt Street, Sydney CBD
M_Park Business Campus, Macquarie Park, NSW
$500m1 development
with 55,000 sqm NLA
opportunity
16,000 sqm NLA
Stage 1 DA approved Dec 2019
3 Ha site
Actively seeking
pre commitments
Optus Campus, Macquarie Park, NSW
12 year lease to Optus
Building upgrade DA
approved
Net valuation upside 21.6%
7.6 Ha site
84,194 sqm NLA leased
For
per
sona
l use
onl
y

Gro
up
u
pd
ate
Fin
an
cia
l resu
lts an
d
cap
ital m
an
ag
em
en
tC
om
merc
ial
Pro
perty
Co
mm
un
ities
Su
mm
ary
an
d o
utlo
ok
Strong leasing and rental growthWorkplace
1. Settled in November 2019.
2. Acquisition of 118 Walker Street completed on 8 November 2019, acquisition of 122 Walker Street expected to complete in July 2020.
3. Excludes WIP and sundry properties.
4. Stockland share of expected incremental development spend, excluding land cost and subject to planning approval.
5. At 31 December 2019.
6. By income.
1H20 Results Presentation19
Key metrics 1H20 1H19
FFO $26m $24m
Asset value $1,032m $786m
Leases executed 6,447 sqm 10,300 sqm
Leases under HOA5 3,662 sqm 22,700 sqm
Average rental growth on new leases and renewals 15.8% 18.7%
Portfolio occupancy5,6 94.1% 95.5%
Portfolio WALE5,6 3.6 yrs 3.8 yrs
• Strong comparable FFO growth of 6.1%
• Rental growth on new leases and renewals of 15.8%
• 91% of portfolio in Sydney
• Acquired remaining 50% interest in Stockland Piccadilly for $347m
(yielding ~5.5%) and divested 50% interest in 135 King Street for
$340m1 (yielding ~4.25%), Sydney (NSW)
• Strategic acquisition of 118 and 122 Walker Street sites2, amalgamated
with our existing asset, creating potential 60,000 sqm NLA prime office
space in North Sydney (NSW)
• Progressed in house asset and development management capability,
now internally managing 90% of built up book value, up from 20% at
30 June 2019
6 assets
$1.0bn3portfolio value
7% portfolio weighting
$2.2bn4development pipeline
For
per
sona
l use
onl
y

Gro
up
u
pd
ate
Fin
an
cia
l resu
lts an
d
cap
ital m
an
ag
em
en
tC
om
merc
ial
Pro
perty
Co
mm
un
ities
Su
mm
ary
an
d o
utlo
ok
$2.2bn1 development pipelineWorkplace
1H20 Results Presentation20
1. Stockland share of expected incremental development spend, excluding land cost and subject to planning approval.
2. Source www.sydneymetro.info
Walker Street, North Sydney, NSW Piccadilly, Sydney CBD, NSW
Close proximity to future Victoria Cross Station
Up to 60,000 sqm proposed NLA
new metro train station, expected to open in 20242
2,300 sqm amalgamated landholding
~5,000 sqm site area with dual frontage of Castlereagh and Pitt Streets
Development planning commenced
new metro train station, expected to open in 20242
existing Townhall Station
Located in the mid-town Sydney CBD
For
per
sona
l use
onl
y

Gro
up
u
pd
ate
Fin
an
cia
l resu
lts an
d
cap
ital m
an
ag
em
en
tC
om
merc
ial
Pro
perty
Co
mm
un
ities
Su
mm
ary
an
d o
utlo
ok
1. Of built up book value.
2. Excludes Unlisted Property Fund assets (19.9% ownership), WIP and sundry properties.
3. Includes food catering, food retail and mini majors foods.
4. Fashion includes apparel and jewellery.
5. Other Retail, non retail and other majors.
6. From 30 June 2019.
DDS
13.6%
Food3
9.6%Other5
8.8%Mobile Phones2.8% Mini majors
non-food8.9%General
Retail2.9%
Fashion4
9.3%
Homewares1.0%
Retail Services
4.4%
Supermarkets35.9%
DS0.9%
Leisure2.1%
Gro
up
u
pd
ate
Fin
an
cia
l resu
lts an
d
cap
ital m
an
ag
em
en
tC
om
merc
ial
Pro
perty
Co
mm
un
ities
Su
mm
ary
an
d o
utlo
ok
1H20 Results Presentation21
Co
mm
erc
ial
Pro
perty
• Income and capital performance tracking to guidance
• Actively stabilising the portfolio through a program of rebasing rents and up-weighting to Food
and Services categories underpinning a solid sales performance
• Occupancy maintained at 99.4%
• FY20 forecast capex slight increase on FY19
˗ maintenance capex and placemaking ~0.5%1
˗ incentives ~0.8%1
32assets
$6.6bn2
portfolio value
43% portfolio weightingtarget exposure to <40% over
the next five years
Stable performance, tracking to guidance
Retail Town Centres
(0.5)% valuation decline6
Low and non-discretionary
Diversified MAT ~70% low and non-discretionary
Discretionary
For
per
sona
l use
onl
y

Gro
up
u
pd
ate
Fin
an
cia
l resu
lts an
d
cap
ital m
an
ag
em
en
tC
om
merc
ial
Pro
perty
Co
mm
un
ities
Su
mm
ary
an
d o
utlo
ok
Continued growth in retail sales
1H20 Results Presentation22
• Comparable specialty sales growth of 2.7%
• Comparable specialty sales of $9,386 psm1, ~5% above Urbis benchmark2
• Growth driven by remixing to non-discretionary categories and non core assets
disposals
• Apparel sales performance stabilising
• Sales growth for stable basket continues
Mobile Phones
10.8%Retail Services
6.8%Food Catering
3.2%Apparel
(0.1)%
1. Comparable centres, excludes divestments and development centres and adjusted for stores trading less than 12 months.
2. Urbis Sub-Regional Double DDS Shopping Centre Benchmark.
3. Comparable basket of assets as per SCCA guidelines, which excludes Greenhills, Birtinya, Baringa which have been redeveloped within the past 24 months.
4. Sales data includes all Stockland managed retail assets – including Unlisted Property Fund and joint venture assets.
5. Other includes pad sites, non-retail, and cinemas.
Active asset management
Key categories change in comparable specialty MAT3
MAT Total portfolio Comparable centres3
MAT4 MATgrowth4
MAT growth
1H20 growth
Total $6,426m 5.5% 3.3% 2.9%
Specialties $2,022m 4.3% 2.3% 2.7%
Supermarkets $2,316m 7.7% 4.4% 3.1%
DDS/Department
Stores$867m 4.1% 3.7% 1.7%
Mini-Majors $656m 3.7% 0.7% 1.6%
Other5 $565m 5.5% 5.0% 7.4%
Retail Town CentresRetail
For
per
sona
l use
onl
y

Gro
up
u
pd
ate
Fin
an
cia
l resu
lts an
d
cap
ital m
an
ag
em
en
tC
om
merc
ial
Pro
perty
Co
mm
un
ities
Su
mm
ary
an
d o
utlo
ok
Rebasing rents supporting sustainable income
1H20 Results Presentation23
• Rebased rents to deliver sustainable occupancy
• Specialty occupancy cost of 15.1% compares favourably to market average1
• Negative rent reversions for 1H20 in line with FY20 guidance range of -5% to -7%
• Increase in incentives driven by remixing apparel to key growth categories
• Fixed rental increases on reset leases of between 3% to 5% remains sustainable
1H20 1H19
Occupancy2 99.4% 99.4%
Specialty retail leasing activity3
Tenant retention4 63% 63%
Total lease deals5 386 350
WALE6 6.0 yrs 6.1 yrs
Specialty occupancy cost ratio7 15.1% 15.0%
Average rental growth on lease deals8 (5.2)% (1.0)%
Renewals: number 168 142
area 20,324 sqm 20,467 sqm
rental growth8 (2.5)% 0.2%
New leases: number 122 111
area 16,502 sqm 12,207 sqm
rental growth8 (9.0)% (2.6)%
incentives: months9 13.8 11.4
as % of rent over lease term10 20.1% 14.5%
Retail Town Centres
1. Urbis Sub-Regional Double DDS Shopping Centre Benchmark.
2. Occupancy reflects stable assets for the period and differs from Property Portfolio which includes all assets.
3. Excludes Unlisted Property Fund assets. Metrics relate to stable assets unless otherwise stated.
4. Adjusted for operational centre remixes and reconfiguration as well as retailers subject to administration.
5. Includes project and unstable centre leases.
6. Assumes all leases terminate at earlier of expiry / option date.
7. Excludes divestments and unstable assets.
8. Rental growth on an annualised basis.
9. Represents the contributions made towards the retailers’ fit outs, expressed in equivalent months of net rent.
10. Incentive capital as a percentage of total rent over the primary lease term only.
Impact of retailer administrations
• A number of high profile retailers have gone into administration including
JeansWest, Harris Scarfe, Bardot, Curious Planet and Colette
˗ of our ~3,100 tenancies, 35 sites across 7 brands impacted by administrations
˗ of the 35 impacted tenancies, ~70% are under advanced negotiations with new
retailers
˗ reflected in Commercial Property FFO FY20 guidance
Active asset management
For
per
sona
l use
onl
y

Gro
up
u
pd
ate
Fin
an
cia
l resu
lts an
d
cap
ital m
an
ag
em
en
tC
om
merc
ial
Pro
perty
Co
mm
un
ities
Su
mm
ary
an
d o
utlo
ok
Remixing and placemaking support positive rental and sales growth
• Remixing to Food Catering and Services yielding higher rental and sales
productivity compared to Fashion
• Remixing to enhance:
• Low discretionary categories (Services & Food)
• Higher experiential categories (The Bavarian, Malt Shovel Tap House and
Lantern Lane Precinct)
• Increase resilience against online shopping
5 year CAGR 1
1H20 Results Presentation24
Stockland Shellharbour, Wetherill Park, Green Hills NSWThe Bavarian
Stockland Cairns, QLDLantern Lane
Stockland Birtinya, QLDMalt Shovel Tap House
1. Includes Unlisted Property Fund Assets (19.9% ownership) and WIP from 31 December 2014 to 31 December 2019.
1.7%
3.2%2.4%
9.1% 9.4%8.5%8.5%
9.7%
11.1%
0.0%
2.0%
4.0%
6.0%
8.0%
10.0%
12.0%
GLA Gross Rent MAT
Fashion (Apparel & Jewellery) Food Catering Services
Accelerated to focus on higher growth categories
For
per
sona
l use
onl
y
Gro
up
u
pd
ate
Fin
an
cia
l resu
lts an
d
cap
ital m
an
ag
em
en
tC
om
merc
ial
Pro
perty
Co
mm
un
ities
Su
mm
ary
an
d o
utlo
ok
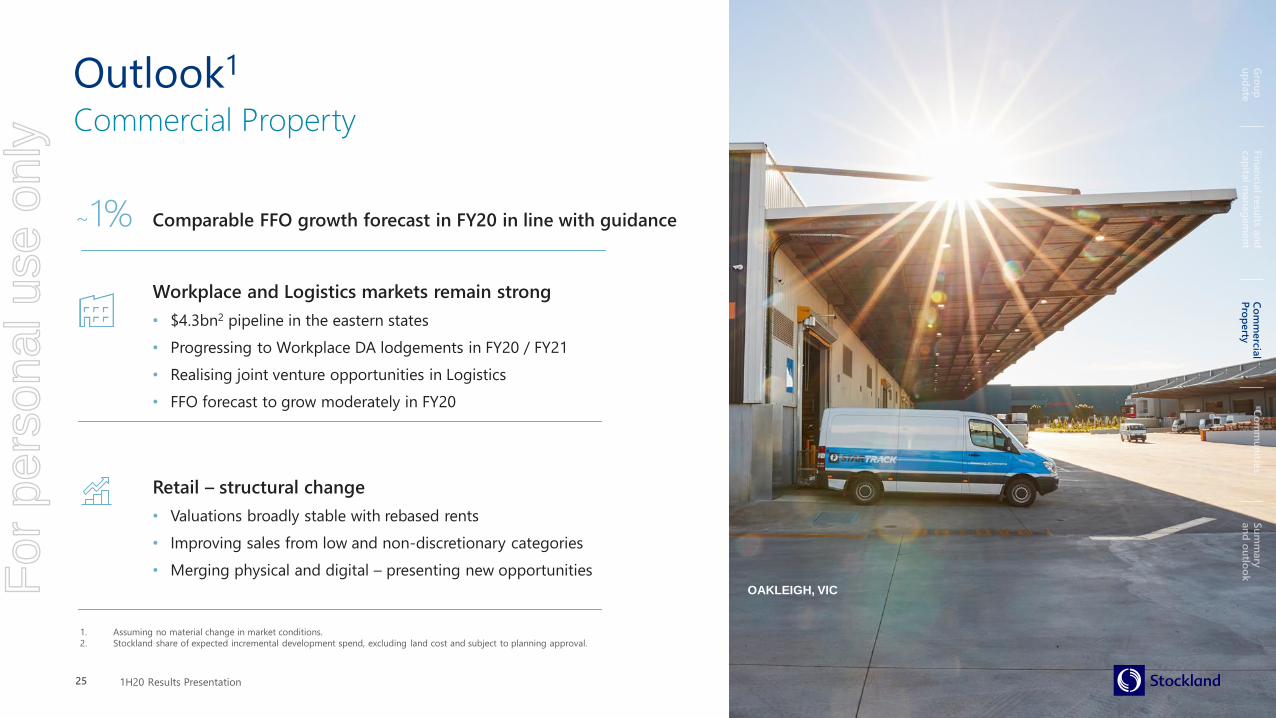
Outlook1
Commercial Property
1H20 Results Presentation25
1. Assuming no material change in market conditions.
2. Stockland share of expected incremental development spend, excluding land cost and subject to planning approval.
Comparable FFO growth forecast in FY20 in line with guidance ~1%
Workplace and Logistics markets remain strong
• $4.3bn2 pipeline in the eastern states
• Progressing to Workplace DA lodgements in FY20 / FY21
• Realising joint venture opportunities in Logistics
• FFO forecast to grow moderately in FY20
Retail – structural change
• Valuations broadly stable with rebased rents
• Improving sales from low and non-discretionary categories
• Merging physical and digital – presenting new opportunities
Co
mm
erc
ial
Pro
perty
OAKLEIGH, VICFor
per
sona
l use
onl
y

Gro
up
u
pd
ate
Fin
an
cia
l resu
lts an
d
cap
ital m
an
ag
em
en
tC
om
merc
ial
Pro
perty
Co
mm
un
ities
Su
mm
ary
an
d o
utlo
ok
CommunitiesAndrew Whitson
MINTA, VIC
ARTIST’S IMPRESSION1H20 Results Presentation26
For
per
sona
l use
onl
y

Gro
up
u
pd
ate
Fin
an
cia
l resu
lts an
d
cap
ital m
an
ag
em
en
tC
om
merc
ial
Pro
perty
Co
mm
un
ities
Su
mm
ary
an
d o
utlo
ok
Co
mm
erc
ial
Pro
perty
Gro
up
u
pd
ate
Fin
an
cia
l resu
lts an
d
cap
ital m
an
ag
em
en
tC
om
merc
ial
Pro
perty
Su
mm
ary
an
d o
utlo
ok
On track to deliver guidance for FY20
1. Includes 534 (1H19: 74) settlements under joint venture and project delivery agreements and six settlements from Brisbane Casino Towers (1H19: 326).
2. Merrylands Court settled on 9 January 2020. The second of the three tranches at The Grove is expected to settle in 4Q20.
1H20 Results Presentation27
(5,507)
Residential
• 2,158 settlements1 (including 266 townhome settlements) on track to deliver above 5,200
settlements for the full year
• 6.0% FFO decline reflects the impact of low sales volume in FY19 carrying into 1H20
• Operating profit margin reflects 2H skew to high margin Sydney projects and settlement
timing of Merrylands Court (NSW) and The Grove (VIC)2
• Default rates declined to 3.5% in December 2019 quarter
• Executed early cycle restocking with acquisition of sites including Donnybrook (VIC) and a
focus on finalising a number of significant opportunities in the near term
Execution of strategy drives 1H20 growth
FFO
(6.0)%
Operating profit margin
17.2%
ROA
19.3%
Total lots settled1
2,158
FFO
$134m
Improving lot sales
3,869 4,216
2,499 (2,152)313
0
1,000
2,000
3,000
4,000
5,000
6,000
7,000
30-Jun-2019
contracts on hand
Net deposits Settlements 31-Dec-19
Future
contracts on hand
Jan 2020
net deposits
Total lots settled1
(12.3)%
Co
mm
un
ities
For
per
sona
l use
onl
y

Co
mm
erc
ial
Pro
perty
Gro
up
u
pd
ate
Fin
an
cia
l resu
lts an
d
cap
ital m
an
ag
em
en
tC
om
merc
ial
Pro
perty
Su
mm
ary
an
d o
utlo
ok
• Net sales result underpinned by market strength on the
eastern seaboard with the return of owner occupiers
and investors
• 1,350 net deposits in 2Q20, exceeding expectations and
in line with long term average
• 2,499 net deposits in 1H20 represents ~38% increase
compared to 2H19 of 1,809
• Price growth is emerging in NSW and VIC, with rebates
being withdrawn from the market
• Continuing flight to quality with six Stockland
communities in the top 10 fastest selling projects
nationally
• Over 4,200 contracts on hand giving good visibility to
settlement volumes in FY20 and into FY21
Strong net sales in 2Q20 underpinning outlook for FY20 and beyond1
Residential
1. Assuming no material change in market conditions.
1H20 Results Presentation28
NSW
WA
QLD
VIC
482578 537 541 521 488
396330 288
481
544449
436557
420391
293280 407
366
419348
155
269
164181
98
96
273
311
227
186
209
168
188 235
176
140
181
192
0
200
400
600
800
1000
1200
1400
1600
1800
1Q18 2Q18 3Q18 4Q18 1Q19 2Q19 3Q19 4Q19 1Q20 2Q20
Co
mm
un
ities
1,672 1,561 1,337 1,535 1,293 963 846 1,149 1,3501,295Total
Net sales
For
per
sona
l use
onl
y

Gro
up
u
pd
ate
Fin
an
cia
l resu
lts an
d
cap
ital m
an
ag
em
en
tC
om
merc
ial
Pro
perty
Co
mm
un
ities
Su
mm
ary
an
d o
utlo
ok
Competitive advantage drives market share to 16%
Residential
1H20 Results Presentation29
Brand
• Focus on providing an exceptional customer
experience and measuring customer satisfaction
to drive accountability
• Brand built on the quality of the communities
we have created for over 60 years
• Continuing to measure liveability of our
communities to drive continual improvement
Scale
• Our market share of 16%1 is more than four times
that of our nearest competitor, giving us unique
competitive advantages including:
- Economies of scale to deliver our product at
lower cost
- The ability to invest in technology including
Salesforce and AI to increase lead generation
and sales productivity
- Deep understanding of what our customers
want
1. National Land Survey, December 2019, Research4 – annual market share 1H20 (Greater Sydney, Melbourne, Perth and South East Qld).
2. Represents lots under control of which ~28,000 are under joint venture and project delivery agreement.
Landbank
• 76,000 lot landbank2 with an average age of 10
years, skewed towards rail serviced growth
corridors in Sydney and Melbourne, with strong
embedded margins
• Focussed on early cycle restocking including
building a meaningful apartment pipeline
Cost per digital leaddown 20%
since investment in data analytics
Acquired Donnybrook (VIC) with expected yield of 1,500 dwellings
Forecast release in 2H20 with first settlements expected in FY22
Co
mm
erc
ial
Pro
perty
Gro
up
u
pd
ate
Fin
an
cia
l resu
lts an
d
cap
ital m
an
ag
em
en
tC
om
merc
ial
Pro
perty
Su
mm
ary
an
d o
utlo
ok
Co
mm
un
ities
Residential communities resident satisfaction
93%
For
per
sona
l use
onl
y

Gro
up
u
pd
ate
Fin
an
cia
l resu
lts an
d
cap
ital m
an
ag
em
en
tC
om
merc
ial
Pro
perty
Co
mm
un
ities
Su
mm
ary
an
d o
utlo
ok
• On track to deliver over 5,200 settlements and operating profit
margin ~19% in FY20
• Strong sales results and a normalised default rate are expected
to drive settlements to the top end of our through the cycle
range in FY21
• ~10% contribution from Townhome settlements in FY21
• Skew back to high margin Sydney and Melbourne projects
expected over 2H20 and FY21
• Full year of settlements from Minta (VIC), Grandview (VIC), Orion
(VIC), Waterlea (VIC) in FY21
• First settlements from three new projects over the next 24 months to drive landbank activation and ROA
- Red Hill (ACT), Hope Island (QLD), and Donnybrook (VIC)
Positioned to leverage strengthening residential market
WILLOWDALE, SYDNEY, NSW
Co
mm
erc
ial
Pro
perty
Gro
up
u
pd
ate
Fin
an
cia
l resu
lts an
d
cap
ital m
an
ag
em
en
tC
om
merc
ial
Pro
perty
Su
mm
ary
an
d o
utlo
ok
Co
mm
un
ities
1H20 Results Presentation30
For
per
sona
l use
onl
y

Co
mm
erc
ial
Pro
perty
Gro
up
u
pd
ate
Fin
an
cia
l resu
lts an
d
cap
ital m
an
ag
em
en
tC
om
merc
ial
Pro
perty
Su
mm
ary
an
d o
utlo
ok
Strategic initiatives and market improvement driving sales performance
1H20 Results Presentation31
(5,507)
Retirement Living
• Over 12% improvement in established sales in 1H20 compared to 1H191 with a ~30%
increase in contracts on hand compared to 30 June 2019
• Portfolio on track to deliver FY20 guidance of over 850 settlements
• Development sales impacted by project completion timing
• FFO decline reflects change in development settlement mix
• Expecting second half profit skew due to settlement timings and non core village disposal
profit
• Targeted repricing to drive increased occupancy
• Continue to build land lease community pipeline which is now over 2,000 dwellings
1H20 1H19 Change
Established sales 300 2671 12.4%
Development sales 121 140 (13.6)%
(13.8)%
Total contracts on hand increase2
5.9%
ROA
4.5%
Total units settled
412
FFO
$17m
14.8%On 1H19
Co
mm
un
ities
1. Prior period restated to exclude the 2H19 disposal of three Victorian villages; Taylors Hill, Keilor, Burnside.
2. Compared to 30 June 2019.
On 1H19
For
per
sona
l use
onl
y

Gro
up
u
pd
ate
Fin
an
cia
l resu
lts an
d
cap
ital m
an
ag
em
en
tC
om
merc
ial
Pro
perty
Co
mm
un
ities
Su
mm
ary
an
d o
utlo
ok
Retirement Living strategy
Improve quality
of our portfolio
• Continuing discussions with several parties
on sale of non core villages
• Progressing land lease community pipeline,
with two DAs lodged in 1H20
Increase returns through
development pipeline and capability
• Working with local planning authorities to assess
future redevelopment opportunities in Sydney
• Streamlined operations model driving customer
satisfaction
• Continuing to explore capital partnering
opportunities discussions which are likely to take
some time to reach a conclusion
Enhance customer
experience and satisfaction
• Continued leveraging of Salesforce and
data analytics to market our product and
appropriately price units
• Research-driven review of Customer Value
Proposition underway
• Customer initiatives such as trial stay and
rent to buy being scaled across the
portfolio
Disciplined execution of Retirement Living strategy
1H20 Results Presentation32
Co
mm
erc
ial
Pro
perty
Co
mm
erc
ial
Pro
perty
Su
mm
ary
an
d o
utlo
ok
Co
mm
un
ities
For
per
sona
l use
onl
y

Gro
up
u
pd
ate
Fin
an
cia
l resu
lts an
d
cap
ital m
an
ag
em
en
tC
om
merc
ial
Pro
perty
Co
mm
un
ities
Su
mm
ary
an
d o
utlo
ok
Summary and outlookMark Steinert
AURA, QLD
For
per
sona
l use
onl
y

Gro
up
u
pd
ate
Fin
an
cia
l resu
lts an
d
cap
ital m
an
ag
em
en
tC
om
merc
ial
Pro
perty
Co
mm
un
ities
Su
mm
ary
an
d o
utlo
ok
Creating value through our diversified model,
asset creation capabilities and brand
1H20 Results Presentation34
• Focused strategy to leverage our diversified model to
grow returns and improve portfolio quality
• Well positioned for future growth and to deal with
structural retail challenges
• Accelerating built form and acquisitions to leverage the
residential cycle
• Growing our workplace and logistics portfolio using
vertically integrated capabilities, $4.3bn1 pipeline
• Continue to actively reweight the portfolio to balance our
exposure to Communities, Workplace and Logistics and
Retail Town Centres over the next five years
1. Stockland share of expected incremental development spend, excluding land cost and subject to planning approval.
2. Includes Unlisted Property Fund Assets (19.9% ownership) WIP and sundry properties.
3. Excludes UK and apartments, representing 1%, at 31 December 2013.
Capital allocation2
31-Dec-133 31-Dec-19 ~5 year target
Communities 29% 31% ~30%
Workplace and Logistics 21% 26% ~30%
Retail Town Centres 49% 43% <40%
Co
mm
erc
ial
Pro
perty
Co
mm
erc
ial
Pro
perty
Co
mm
un
ities
Su
mm
ary
an
d o
utlo
okF
or p
erso
nal u
se o
nly

Gro
up
u
pd
ate
Fin
an
cia
l resu
lts an
d
cap
ital m
an
ag
em
en
tC
om
merc
ial
Pro
perty
Co
mm
un
ities
Su
mm
ary
an
d o
utlo
ok
Strong foundation to grow profit
1. Based on current internal Stockland forecasts and assuming no material change in market conditions. Full guidance for FY21 will be provided to the market in August 2020.
1H20 Results Presentation35
Major contributors1
FY20 FY21 Future pipeline
Commercial
Property
Secured key acquisitions and planning approvals to
progress development pipeline
Workplace and logistics portfolio weighting
increased to 26%, up 3% since 30 June 2019
Capital partnership opportunities continue to be
progressed
Gregory Hills (NSW) logistics trading lots
Melbourne Business Park (VIC)
M_Park Business Campus (NSW)
Kemps Creek (NSW)
Walker Street, North Sydney (NSW)
Piccadilly, Sydney CBD (NSW)
Communities >5,200 residential settlements, including around
500 townhomes
>850 established and development retirement
living settlements
Operating profit margin ~19%
Residential settlements at top end of our through
the cycle range ~5,800 lots including ~600
townhomes
Skew back to high margin Sydney and Melbourne
residential projects
Operating profit margin ~18%
Full year of settlements from Minta (VIC),
Grandview (VIC) and Mt Atkinson (VIC)
First settlements from Red Hill (ACT)
Rosebery (NSW)
Parramatta (NSW)
Hope Island (QLD)
Donnybrook (VIC)
For
per
sona
l use
onl
y
Gro
up
u
pd
ate
Fin
an
cia
l resu
lts an
d
cap
ital m
an
ag
em
en
tC
om
merc
ial
Pro
perty
Co
mm
un
ities
Su
mm
ary
an
d o
utlo
ok
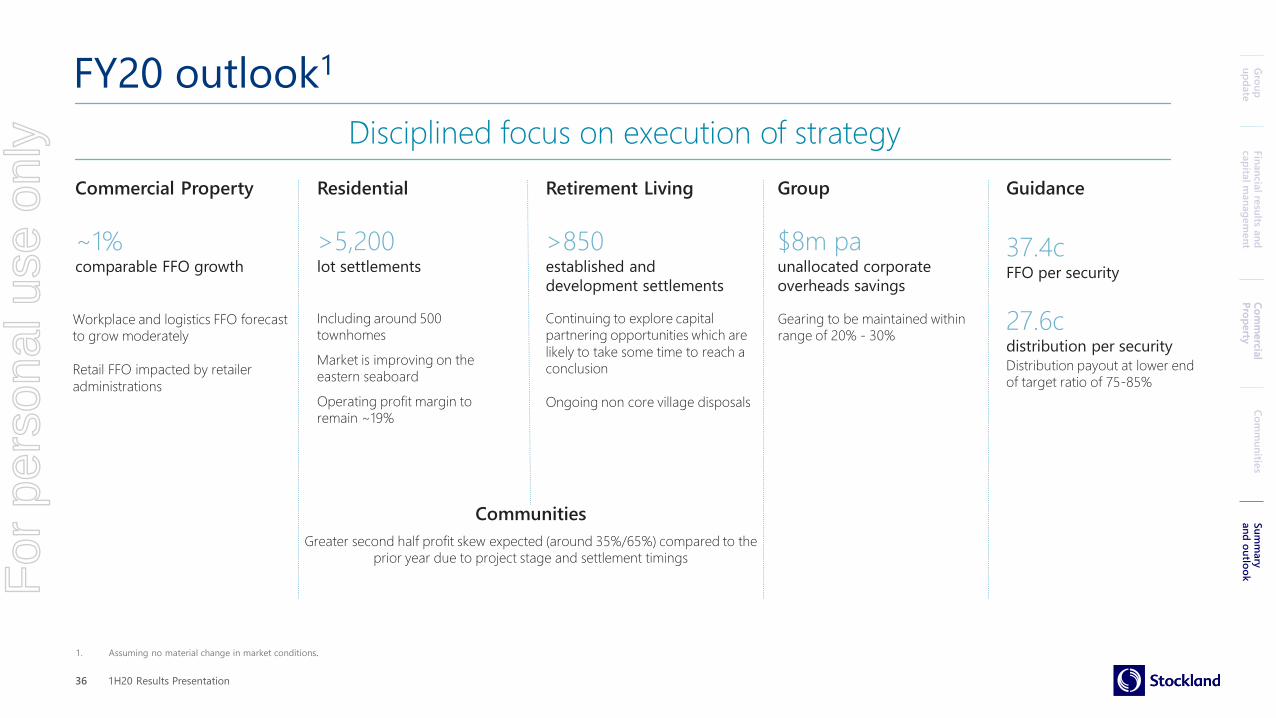
Commercial Property
Disciplined focus on execution of strategy
1H20 Results Presentation36
1. Assuming no material change in market conditions.
Residential Retirement Living Group Guidance
$8m pa unallocated corporate
overheads savings
37.4cFFO per security
27.6cdistribution per securityDistribution payout at lower end
of target ratio of 75-85%
Continuing to explore capital
partnering opportunities which are
likely to take some time to reach a
conclusion
Ongoing non core village disposals
>850 established and
development settlements
Communities
Greater second half profit skew expected (around 35%/65%) compared to the
prior year due to project stage and settlement timings
~1% comparable FFO growth
>5,200 lot settlements
Including around 500
townhomes
Market is improving on the
eastern seaboard
Operating profit margin to
remain ~19%
FY20 outlook1
Co
mm
erc
ial
Pro
perty
Gro
up
u
pd
ate
Fin
an
cia
l resu
lts an
d
cap
ital m
an
ag
em
en
tC
om
merc
ial
Pro
perty
Co
mm
un
ities
Su
mm
ary
an
d o
utlo
ok
Workplace and logistics FFO forecast
to grow moderately
Retail FFO impacted by retailer
administrations
Gearing to be maintained within
range of 20% - 30%
For
per
sona
l use
onl
y
Stockland Corporation LimitedACN 000 181 733
Stockland Trust Management Limited
ACN 001 900 741; AFSL 241190
As responsible entity for Stockland Trust
ARSN 092 897 348
LEVEL 25
133 Castlereagh Street
SYDNEY NSW 2000
Important NoticeWhile every effort is made to provide accurate and complete information, Stockland does not
warrant or represent that the information in this presentation is free from errors or omissions
or is suitable for your intended use. This presentation contains forward-looking statements,
including statements regarding future earnings and distributions that are based on information
and assumptions available to us as of the date of this presentation. Actual results, performance
or achievements could be significantly different from those expressed in, or implied by these
forward looking statements. These forward-looking statements are not guarantees or
predictions of future performance, and involve known and unknown risks, uncertainties and
other factors, many of which are beyond our control, and which may cause actual results to
differ materially from those expressed in the statements contained in the release.
The information provided in this presentation may not be suitable for your specific needs and
should not be relied upon by you in substitution of you obtaining independent advice. Subject
to any terms implied by law and which cannot be excluded, Stockland accepts no responsibility
for any loss, damage, cost or expense (whether direct or indirect) incurred by you as a result of
any error, omission or misrepresentation in this presentation. All information in this
presentation is subject to change without notice. This presentation is not an offer or an
invitation to acquire Stockland stapled securities or any other financial products in any
jurisdictions, and is not a prospectus, product disclosure statements or other offering
document under Australian law or any other law. It is for information purposes only.
This announcement is authorised for release to the market by Ms Katherine Grace, Stockland’s Company Secretary.
For
per
sona
l use
onl
y