stock price reaction to earning announcement
TRANSCRIPT
Munich Personal RePEc Archive
Stock Price Reaction to Earnings
Announcement: The Case of an
Emerging Market
Iqbal, Javed and Farooqi, Faraz Ahmed
Department of Statistics Karachi University
1 January 2011
Online at https://mpra.ub.uni-muenchen.de/30865/
MPRA Paper No. 30865, posted 11 May 2011 14:36 UTC

1
Stock Price Reaction to Earnings Announcement: The Case of an Emerging Market
By
Javed Iqbal* and Faraz Ahmed Farooqi
Department of Statistics, Karachi University
Karachi, Pakistan
Abstract
In an efficient stock market stock prices instantaneously and accurately adjust to new
information. This paper conducts an event study analysis on an emerging market namely
the Karachi Stock Exchange (KSE) by investigating the stock price reaction to public
announcement of quarterly after tax profit by listed firms. By employing 5 year data on
stock prices from January 2004 to August 2008 for 114 non financial firms we found that
there is no abnormal return post earnings announcement. Moreover the study provides
evidence that there is a bigger element of surprise in bad news than in good news as the
market reaction to bad news is stronger.
JEL Codes : G14
Key Words: Event Study, Earnings Announcement, Emerging Markets
2
1. Introduction
Timely announcement of earnings and other cash flows is an important ingredient of
efficient and transparent corporate practice. The magnitude and timing of announcement
related to earnings provide useful information to investors regarding the financial
soundness of firms. There are many studies which point towards information content of
earnings disclosure. For example Ball and Brown (1968), Chari, Jagannathan, and Ofer
(1988), Kross and Schroeder (1984), Easton and Zmijewski (1989), and Gennotte and
Truemann (1996) find that stock prices respond positively to announcements of increase
in earnings and negatively to announcements of decrease in earnings for the U.S. firms.
Khotari and Warner (2006) and MacKinlay (1997) provide a review of many articles
published on the subject.
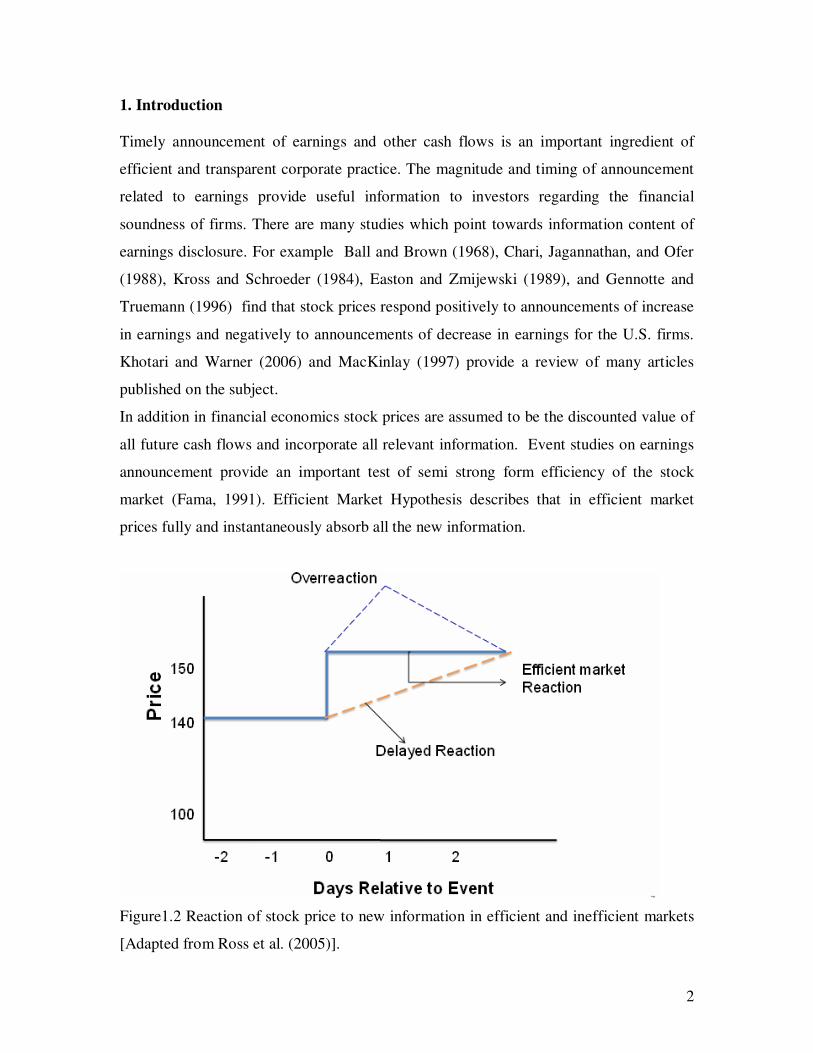
In addition in financial economics stock prices are assumed to be the discounted value of
all future cash flows and incorporate all relevant information. Event studies on earnings
announcement provide an important test of semi strong form efficiency of the stock
market (Fama, 1991). Efficient Market Hypothesis describes that in efficient market
prices fully and instantaneously absorb all the new information.
Figure1.2 Reaction of stock price to new information in efficient and inefficient markets
[Adapted from Ross et al. (2005)].

3
Figure 1.2 shows the difference between the efficient market and inefficient market. If
the market is efficient it will absorb all information at the event time and new price level
is instantaneously established but in inefficient market such information is not absorbed
at the event day and it takes many days to adjust to new equilibrium level.
There are very few event studies on non-US markets particularly in emerging markets. In
a study on the Chinese stock market Su (2003) investigated the stock price reactions to
changes in earnings per share (EPS) in the Chinese domestic A-shares and international
B-share firms. The results indicate that A-shares fail to adjust new earnings information
quickly, but international B-share investors can predict earnings changes better than A-
shares investors. As a result, abnormal returns can be obtained by trading on the earnings
information, but for A-shares only. They attribute this finding to the type of ownership of
the shares. A-shares holders are usually individual investors whereas the B-shares are
mostly owned by large institutions that trade on more detailed and accurate financial
information not immediately available to A-share holders.
The purpose of this paper is to conduct an event study analysis of earnings announcement
in an emerging market namely the Karachi Stock Exchange which is Pakistan’s biggest
and the most active stock exchange. For an overview of the stock market in Pakistan see
Iqbal (2008). Most of the event studies are performed in the developed capital markets
particularly the US and the UK markets. Conducting event studies on emerging markets
is quite challenging due to their excessive prices volatility which is a consequence of the
relatively instable political and macroeconomic conditions. So in emerging markets
uncovering any systematic abnormal returns to a corporate action is not easy. Further, in
the developed markets the firms are closely followed by financial analysts who provide
the forecast of the earnings for firms they follow. Thus a database of benchmark forecasts
is easily available to judge whether the actual announcement is considerably above
expected, below expected or have no information content. In developing countries such
database are difficult to obtain. Our contribution is to rely on the information contained in
the actual earnings figures to classify the type of announcement.
4
The event we consider is the quarterly after tax profit announcement by firms listed on
the Karachi Stock Exchange. We collected date on earnings announcement from the
Karachi Stock Exchange website (www.kse.com.pk) over the period from January 2004
to August 2008. The price data for the matching firms are obtained from DataStream
database. Following this introduction section 2 describes the methodology and the data
for the event study, section 3 discusses the results of analysis and section 4 provides
conclusion.
2. Methodology
2.1 Measuring Abnormal Returns
The event under study is after tax quarterly profit announcement by listed companies.
The date and amount of profit declared by companies are obtained from the website of
the Karachi Stock Exchange. Following Makinlay (1997) we include event day plus 30
surrounding days i.e. a total of 61 days as event window. The event period is not
included itself in estimation period to prevent the event from influencing the parameter
estimates. The next issue is the firms to include in the event study analysis.
For this study we employ the sample of non financial firms which are listed on the
Karachi Stock Exchange. Initially we considered the quarterly announcement for all the
listed firms. However for many firms sufficient number of announcements was not
available. We therefore restrict our sample to firms that have at least ten quarterly
announcements during the period. This is important since our benchmark quarterly
announcement (median earring) has to be estimated from the data. Filtering in this way
we finally arrived at 114 firms to be considered for the event study.
Using daily data on continuously compounded returns and returns on the KSE-100 index
as the market index we estimated the parameters of the market model which forms the
basis of measuring abnormal returns.
itmtiiit
RR (1)
With E )(it = 0 and Var(
it )= 2
i

5
Where Rit
and Rmt
are the period t return on firm and the market portfolio respectively,
and it is the zero mean disturbance term.
i ,
i and 2
i are the parameter of market
model. It is difficult to separate the movement of stock price resulting from the
announcement of an event by the firm from the general market movement. The use of
market model eliminates the general market movement so that the residuals of the market
model reflect the price reaction due to the event under study. Thus market model
provides a way of extracting signals from the noise. Through market model we estimate
the residuals. The average abnormal returns and cumulative abnormal returns are then
computed.
Using 61 days as the event window we to calibrate the abnormal returns as follow:
)ˆˆ(mtiiit
RR
AR (2)
The abnormal return is the residual of the market model calculated on an out of sample
basis over the event window. The abnormal returns are then averaged across firms and
announcement as follows.
N
i
iAR
NAR
1
1 (3)
Next the average abnormal returns can be aggregated over the event window to calculate
the cumulative abnormal returns (CAR) for each firm i as:
2
1
),( 21
T
T
ARTTCAR
(4)
Figure 1.1 Time line for event study
Figure 1.1 shows the schematic view of event window and estimation window.
6
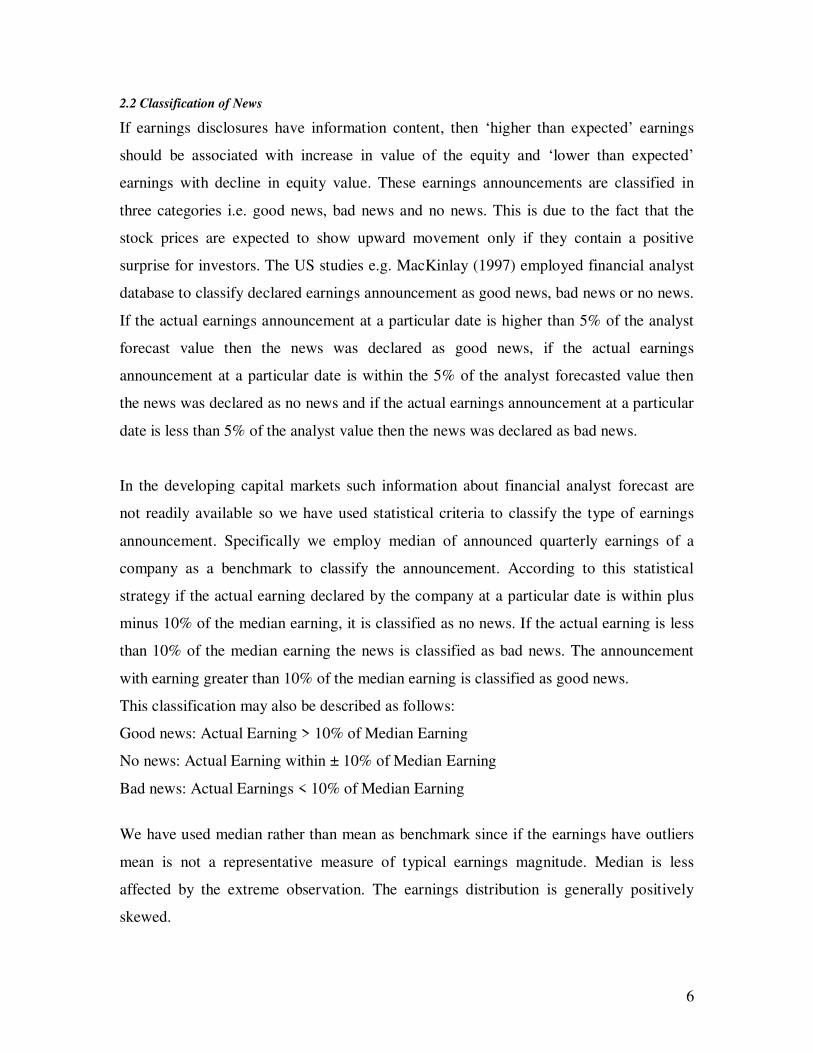
2.2 Classification of News
If earnings disclosures have information content, then ‘higher than expected’ earnings
should be associated with increase in value of the equity and ‘lower than expected’
earnings with decline in equity value. These earnings announcements are classified in
three categories i.e. good news, bad news and no news. This is due to the fact that the
stock prices are expected to show upward movement only if they contain a positive
surprise for investors. The US studies e.g. MacKinlay (1997) employed financial analyst
database to classify declared earnings announcement as good news, bad news or no news.
If the actual earnings announcement at a particular date is higher than 5% of the analyst
forecast value then the news was declared as good news, if the actual earnings
announcement at a particular date is within the 5% of the analyst forecasted value then
the news was declared as no news and if the actual earnings announcement at a particular
date is less than 5% of the analyst value then the news was declared as bad news.
In the developing capital markets such information about financial analyst forecast are
not readily available so we have used statistical criteria to classify the type of earnings
announcement. Specifically we employ median of announced quarterly earnings of a
company as a benchmark to classify the announcement. According to this statistical
strategy if the actual earning declared by the company at a particular date is within plus
minus 10% of the median earning, it is classified as no news. If the actual earning is less
than 10% of the median earning the news is classified as bad news. The announcement
with earning greater than 10% of the median earning is classified as good news.
This classification may also be described as follows:
Good news: Actual Earning > 10% of Median Earning
No news: Actual Earning within ± 10% of Median Earning
Bad news: Actual Earnings < 10% of Median Earning
We have used median rather than mean as benchmark since if the earnings have outliers
mean is not a representative measure of typical earnings magnitude. Median is less
affected by the extreme observation. The earnings distribution is generally positively
skewed.
7
Our data consist of 701 quarterly announcements in which the good news comprise 43%,
bad news are 42.5% while the remaining 16.5% are no news.
3. Results and Discussion
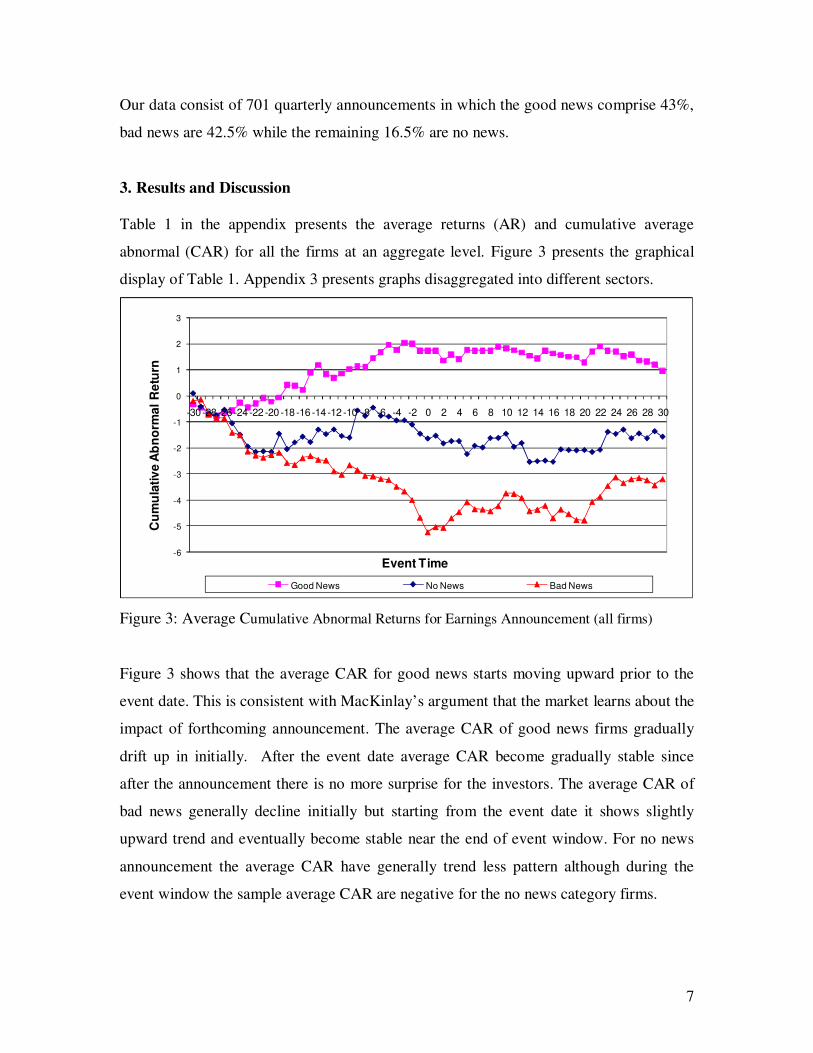
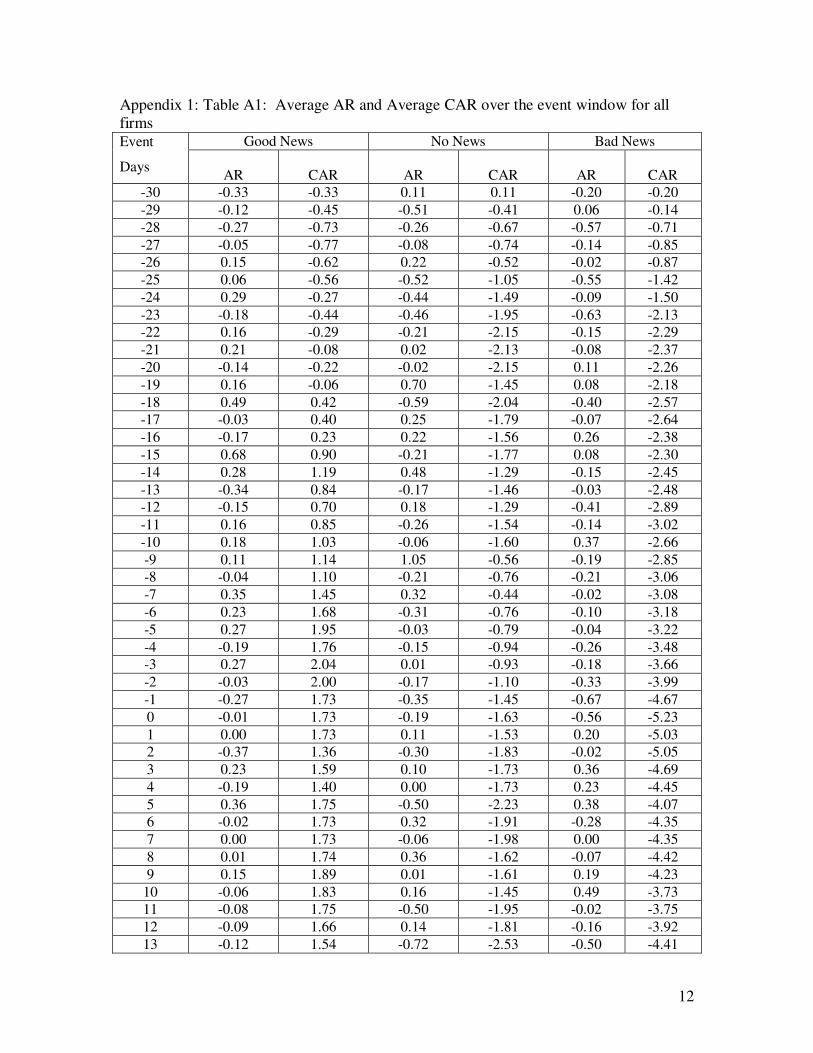
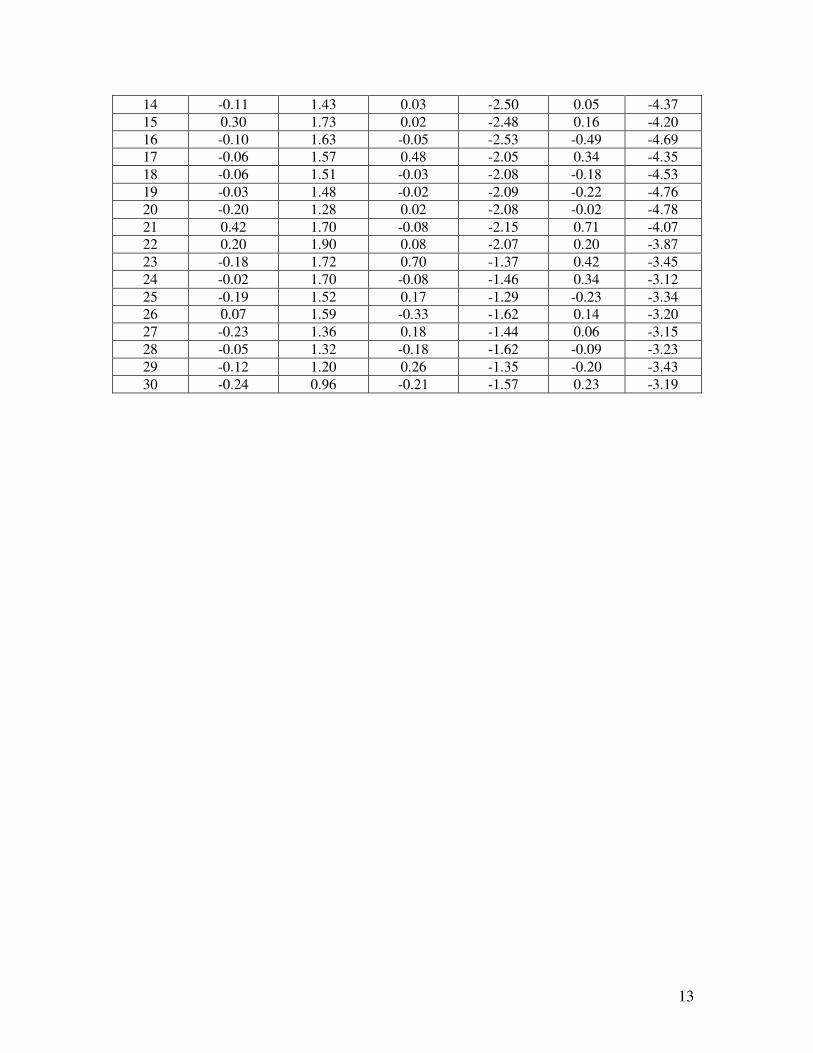
Table 1 in the appendix presents the average returns (AR) and cumulative average
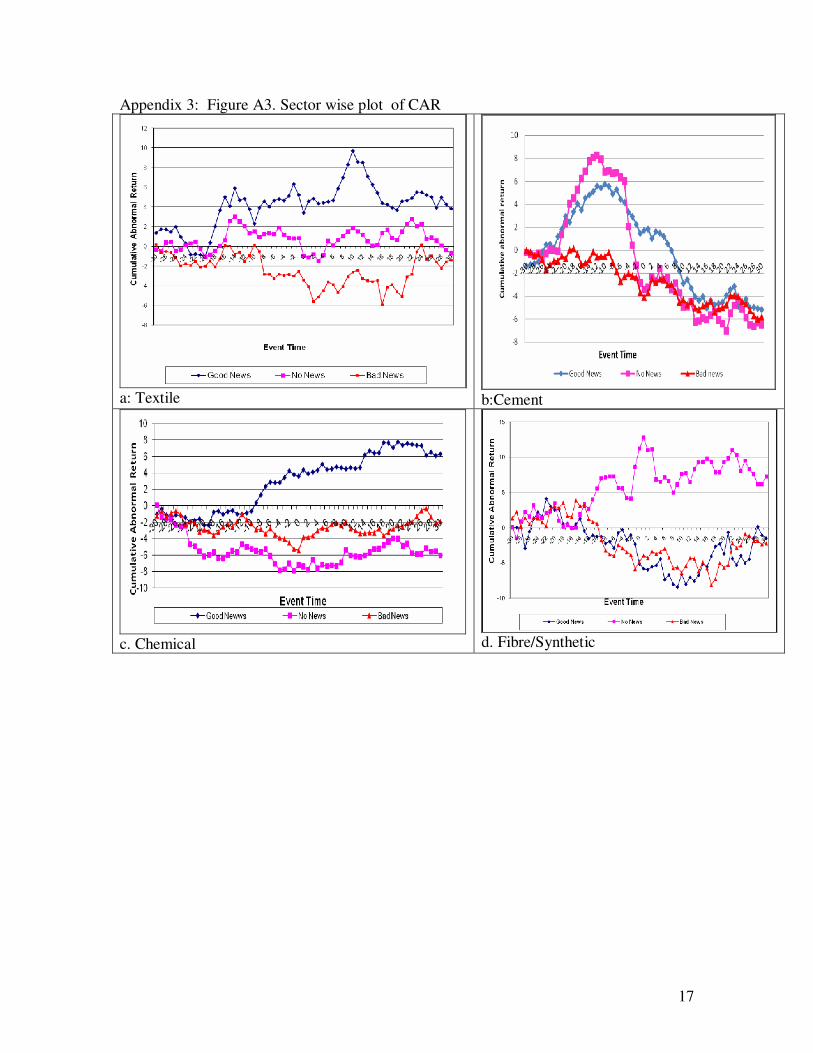
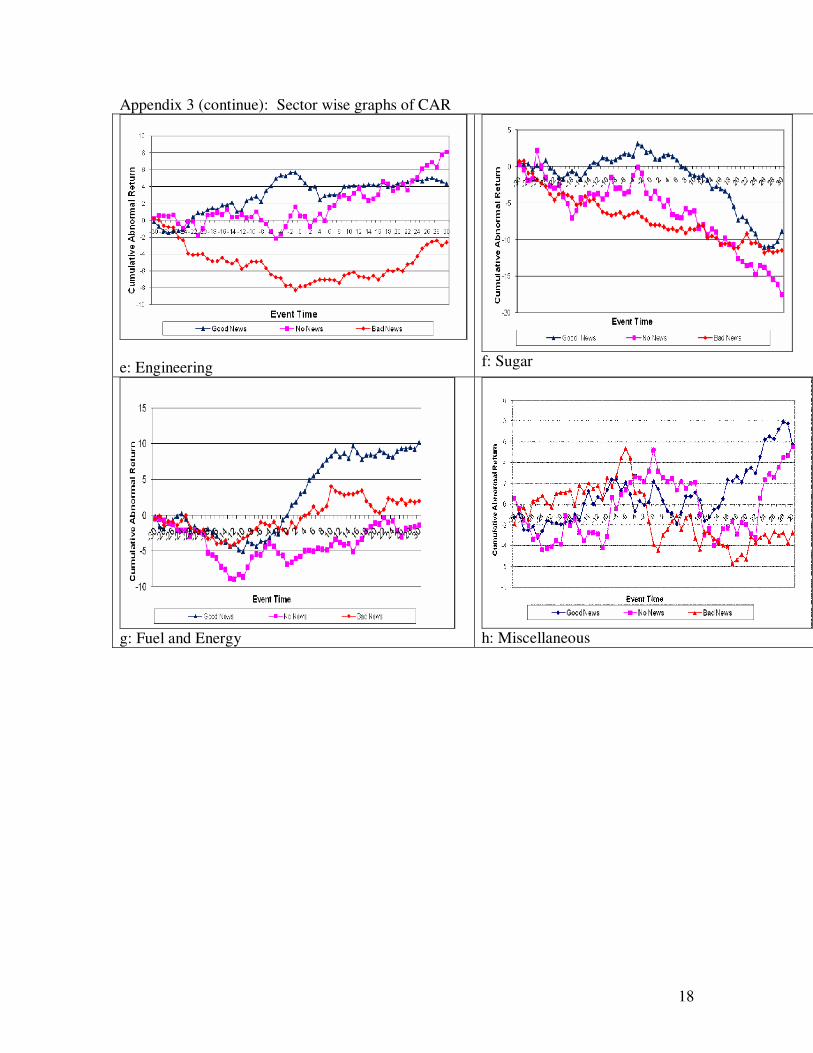
abnormal (CAR) for all the firms at an aggregate level. Figure 3 presents the graphical
display of Table 1. Appendix 3 presents graphs disaggregated into different sectors.
-6
-5
-4
-3
-2
-1
0
1
2
3
-30 -28 -26 -24 -22 -20 -18 -16 -14 -12 -10 -8 -6 -4 -2 0 2 4 6 8 10 12 14 16 18 20 22 24 26 28 30
Cu
mu
lati
ve
Ab
no
rm
al
Re
turn
Event Time
Good News No News Bad News
Figure 3: Average Cumulative Abnormal Returns for Earnings Announcement (all firms)
Figure 3 shows that the average CAR for good news starts moving upward prior to the
event date. This is consistent with MacKinlay’s argument that the market learns about the
impact of forthcoming announcement. The average CAR of good news firms gradually
drift up in initially. After the event date average CAR become gradually stable since
after the announcement there is no more surprise for the investors. The average CAR of
bad news generally decline initially but starting from the event date it shows slightly
upward trend and eventually become stable near the end of event window. For no news
announcement the average CAR have generally trend less pattern although during the
event window the sample average CAR are negative for the no news category firms.
8
The graphs for the individual sectors in the appendix (panel a, c, e) show a similar
pattern. Since the number of announcements in individual sectors is small the patterns
we observe for average CAR are not as discerning as for the aggregate of all firms.
Individual sector’s CAR are subject to higher fluctuations due to small sample size.
By looking at the results of overall sectors (Figure 3) it can be observed that if an investor
had invested in a company 30 day prior to the announcement of unexpected high earnings
company then she would have realized approximately 2% returns on event day. This
amount is about to 26.8% compounded annually. It is interesting to observe that our
estimate for event day average CAR is very close to the one obtained by MaKinlay
(1997) for Dow Jones 30 firms. During this period the i.e. risk free investment has
rewarded much less. For example average annual yield on 6 month State Bank of
Pakistan’s Treasury Bill rate was nearly 6.5% during the 5 year sample period
(International Financial Statistics, IMF). Thus good news firms reward nearly 20%
annual risk premium. On event day good news firms on average generate about 6% return
differential compared to the bad news firm. This amounts to on average about 100%
compounded annually.
Post announcement there are no significant excess abnormal returns. Thus is if an
investor had invested in good news firm on the event day then on average there are no
cumulative abnormal returns one month later. This result points to the fact that
information has been absorbed on or before the earnings announcement date. In the days
after the announcement the average CAR are relatively stable. These results are
consistent with semi strong form efficiency of the Karachi stock market.
Our results also corroborate the finding of earlier studies who document asymmetry of
stock price reaction of good and bad news. For example Fooladi and Roberts (1988)
found a stronger reaction to announcements of dividend cuts than to those of dividend
increases. Similarly Conrad, Corner and Landsman (2002) find that stock prices respond
more strongly to negative than positive earnings surprises. These studies provide
evidence that there is a bigger element of surprise in bad news than in good news. This
9
can also be related to the asymmetric GARCH literature where the volatility increases
following a bad news are higher than those for bad news of same magnitude.
We conduct a sequence of diagnostic and misspecification tests on the market model
regression for the estimation window. In the vast majority of cases for the earnings
announcement, there is no evidence of serial correlation, heteroskedasticity and model
misspecification. However in most of the cases we found non-normality in residuals due
to excess kurtosis. Since our analysis is based on economic significance of earning
disclosure the issue of excess kurtosis is not much concerned.
4. Conclusion
In this paper we investigated the stock price reaction to earnings announcement by firms
listed at the Karachi Stock Exchange. We selected the data for quarterly earnings
announcement from Karachi Exchange website and selected the matching firm’s stock
prices from the DataStream database. For each firm and for each announcement we
computed abnormal returns using market model regression. These abnormal returns and
cumulative abnormal returns were then aggregated across firms for each of the date in
event window.
We found that on average during the 30 day period prior to earnings announcement the
investor can gain 2% cumulative average returns on event day. This return is much higher
than the risk free rate during the period of study. We estimated that the firms with higher
than expected earnings announcement can provide 20% annual risk premium. On event
day good news firms on average generate about 6% differential in abnormal returns
compared to the bad news firm. This amounts to on average about 100% on annual basis.
Our results indicate that information in earnings disclosure has been absorbed on or
before the earnings announcement date. This implies that the Karachi stock market can be
considered informational efficient since that stock prices quickly absorb the new
information. In the days after the announcement the average cumulative abnormal returns
are relatively stable consistent the market efficiency. We also observe that the stock price

10
react asymmetrically to the unexpectedly high and unexpectedly low earnings
announcement. If the earnings announced is less than expected the price drop is much
higher than the earnings increase announcement of the same magnitude. Our results thus
support the finding of earlier studies who document asymmetry of stock price reaction of
good and bad news. Our study provides evidence that there is a bigger element of surprise
in bad news than in good news as the market reaction to bad news is stronger.
11
References
Ball, R., and P. Brown (1968). An empirical evaluation of accounting income numbers.
Journal of Accounting Research 6: pp. 159-177.
Chari, V., Jagannathan, R., & Ofer, A. (1988). Seasonalities in security returns: The case
of earnings announcements. Journal of Financial Economics, 21, 101–121.
Conrad, J. B. Corner, and W. Landsman. (2002). When Is Bad News Really Bad News?
Journal of Finance, 2002, 57, 2507-2532.
Easton, P., & Zmijewski, M. (1989). Cross-sectional variation in the stock market
response to the announcement of accounting earnings. Journal of Accounting and
Economics, 11, 117–142.
Fama, E., (1991). Efficient capital markets: II, Journal of Finance, 46, pp. 1575-1617.
Fooladi, I., and G. S. Roberts (1988). Dividend Changes and Preferred Stock Returns.
International Journal of Finance, 1988, 1, 96-112.
Gennotte, G., & Truemann, B. (1996). The strategic timing of corporate disclosures.
Review of Financial Studies, 9, 665–690.
Iqbal, J. (2008). Stock Market in Pakistan: An overview. Forthcoming in Journal of
Emerging Market Finance.
Khotari, S.P., and J. Warner (2006). Econometrics of event studies. Handbook of
Corporate Finance: Empirical Corporate Finance, Elsevier/North-Holland.
Kross, W., & Schroeder, D. (1984). An empirical investigation of the effect of quarterly
earnings announcement timing on stock returns. Journal of Accounting Research,
22, 153–176.
MacKinlay A.C., (1997). Event studies in economics and finance. Journal of Economic
Literature 35, pp. 13-39.
Ross, S. A. Westerfield, R. W and Joffe, J. (2008). Corporate Finance. McGraw Hill.
Su, D (2003). Stock price reactions to earnings announcements: evidence from Chinese
markets. Review of Financial Economics 12, 271–286.
12
Appendix 1: Table A1: Average AR and Average CAR over the event window for all
firms Good News No News Bad News Event
Days AR CAR AR CAR AR CAR
-30 -0.33 -0.33 0.11 0.11 -0.20 -0.20
-29 -0.12 -0.45 -0.51 -0.41 0.06 -0.14
-28 -0.27 -0.73 -0.26 -0.67 -0.57 -0.71
-27 -0.05 -0.77 -0.08 -0.74 -0.14 -0.85
-26 0.15 -0.62 0.22 -0.52 -0.02 -0.87
-25 0.06 -0.56 -0.52 -1.05 -0.55 -1.42
-24 0.29 -0.27 -0.44 -1.49 -0.09 -1.50
-23 -0.18 -0.44 -0.46 -1.95 -0.63 -2.13
-22 0.16 -0.29 -0.21 -2.15 -0.15 -2.29
-21 0.21 -0.08 0.02 -2.13 -0.08 -2.37
-20 -0.14 -0.22 -0.02 -2.15 0.11 -2.26
-19 0.16 -0.06 0.70 -1.45 0.08 -2.18
-18 0.49 0.42 -0.59 -2.04 -0.40 -2.57
-17 -0.03 0.40 0.25 -1.79 -0.07 -2.64
-16 -0.17 0.23 0.22 -1.56 0.26 -2.38
-15 0.68 0.90 -0.21 -1.77 0.08 -2.30
-14 0.28 1.19 0.48 -1.29 -0.15 -2.45
-13 -0.34 0.84 -0.17 -1.46 -0.03 -2.48
-12 -0.15 0.70 0.18 -1.29 -0.41 -2.89
-11 0.16 0.85 -0.26 -1.54 -0.14 -3.02
-10 0.18 1.03 -0.06 -1.60 0.37 -2.66
-9 0.11 1.14 1.05 -0.56 -0.19 -2.85
-8 -0.04 1.10 -0.21 -0.76 -0.21 -3.06
-7 0.35 1.45 0.32 -0.44 -0.02 -3.08
-6 0.23 1.68 -0.31 -0.76 -0.10 -3.18
-5 0.27 1.95 -0.03 -0.79 -0.04 -3.22
-4 -0.19 1.76 -0.15 -0.94 -0.26 -3.48
-3 0.27 2.04 0.01 -0.93 -0.18 -3.66
-2 -0.03 2.00 -0.17 -1.10 -0.33 -3.99
-1 -0.27 1.73 -0.35 -1.45 -0.67 -4.67
0 -0.01 1.73 -0.19 -1.63 -0.56 -5.23
1 0.00 1.73 0.11 -1.53 0.20 -5.03
2 -0.37 1.36 -0.30 -1.83 -0.02 -5.05
3 0.23 1.59 0.10 -1.73 0.36 -4.69
4 -0.19 1.40 0.00 -1.73 0.23 -4.45
5 0.36 1.75 -0.50 -2.23 0.38 -4.07
6 -0.02 1.73 0.32 -1.91 -0.28 -4.35
7 0.00 1.73 -0.06 -1.98 0.00 -4.35
8 0.01 1.74 0.36 -1.62 -0.07 -4.42
9 0.15 1.89 0.01 -1.61 0.19 -4.23
10 -0.06 1.83 0.16 -1.45 0.49 -3.73
11 -0.08 1.75 -0.50 -1.95 -0.02 -3.75
12 -0.09 1.66 0.14 -1.81 -0.16 -3.92
13 -0.12 1.54 -0.72 -2.53 -0.50 -4.41
13
14 -0.11 1.43 0.03 -2.50 0.05 -4.37
15 0.30 1.73 0.02 -2.48 0.16 -4.20
16 -0.10 1.63 -0.05 -2.53 -0.49 -4.69
17 -0.06 1.57 0.48 -2.05 0.34 -4.35
18 -0.06 1.51 -0.03 -2.08 -0.18 -4.53
19 -0.03 1.48 -0.02 -2.09 -0.22 -4.76
20 -0.20 1.28 0.02 -2.08 -0.02 -4.78
21 0.42 1.70 -0.08 -2.15 0.71 -4.07
22 0.20 1.90 0.08 -2.07 0.20 -3.87
23 -0.18 1.72 0.70 -1.37 0.42 -3.45
24 -0.02 1.70 -0.08 -1.46 0.34 -3.12
25 -0.19 1.52 0.17 -1.29 -0.23 -3.34
26 0.07 1.59 -0.33 -1.62 0.14 -3.20
27 -0.23 1.36 0.18 -1.44 0.06 -3.15
28 -0.05 1.32 -0.18 -1.62 -0.09 -3.23
29 -0.12 1.20 0.26 -1.35 -0.20 -3.43
30 -0.24 0.96 -0.21 -1.57 0.23 -3.19
14
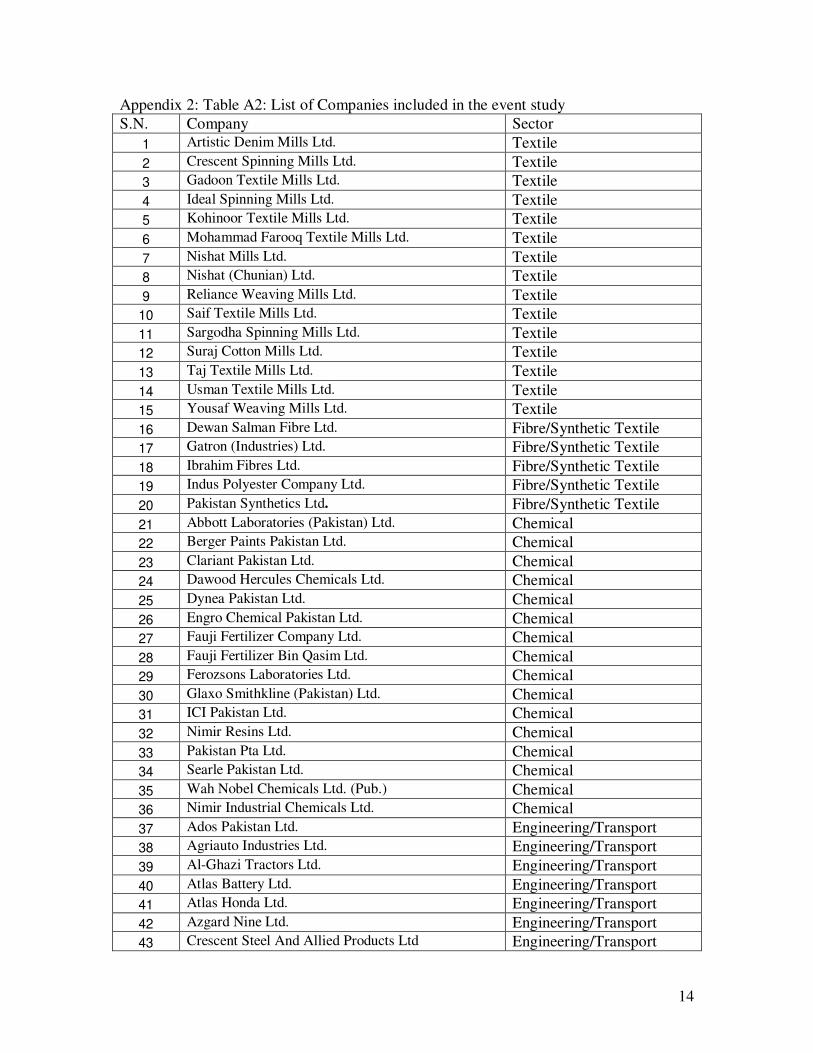
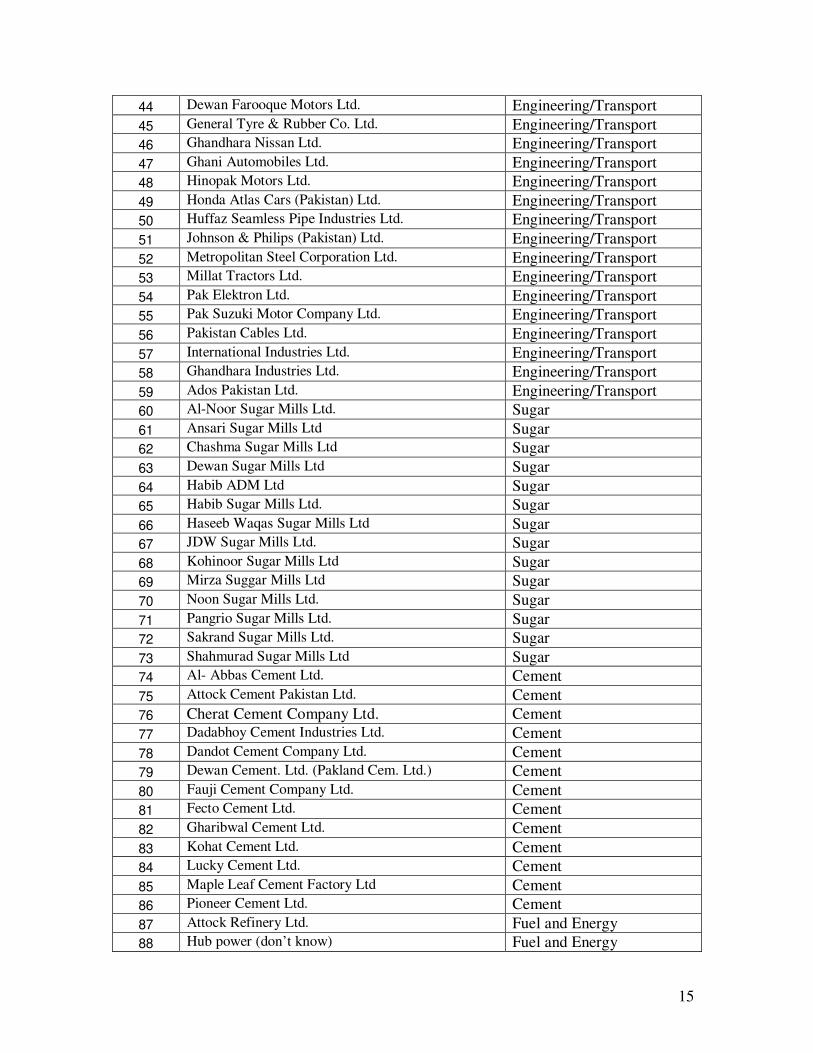
Appendix 2: Table A2: List of Companies included in the event study
S.N. Company Sector
1 Artistic Denim Mills Ltd. Textile
2 Crescent Spinning Mills Ltd. Textile
3 Gadoon Textile Mills Ltd. Textile
4 Ideal Spinning Mills Ltd. Textile
5 Kohinoor Textile Mills Ltd. Textile
6 Mohammad Farooq Textile Mills Ltd. Textile
7 Nishat Mills Ltd. Textile
8 Nishat (Chunian) Ltd. Textile
9 Reliance Weaving Mills Ltd. Textile
10 Saif Textile Mills Ltd. Textile
11 Sargodha Spinning Mills Ltd. Textile
12 Suraj Cotton Mills Ltd. Textile
13 Taj Textile Mills Ltd. Textile
14 Usman Textile Mills Ltd. Textile
15 Yousaf Weaving Mills Ltd. Textile
16 Dewan Salman Fibre Ltd. Fibre/Synthetic Textile
17 Gatron (Industries) Ltd. Fibre/Synthetic Textile
18 Ibrahim Fibres Ltd. Fibre/Synthetic Textile
19 Indus Polyester Company Ltd. Fibre/Synthetic Textile
20 Pakistan Synthetics Ltd. Fibre/Synthetic Textile
21 Abbott Laboratories (Pakistan) Ltd. Chemical
22 Berger Paints Pakistan Ltd. Chemical
23 Clariant Pakistan Ltd. Chemical
24 Dawood Hercules Chemicals Ltd. Chemical
25 Dynea Pakistan Ltd. Chemical
26 Engro Chemical Pakistan Ltd. Chemical
27 Fauji Fertilizer Company Ltd. Chemical
28 Fauji Fertilizer Bin Qasim Ltd. Chemical
29 Ferozsons Laboratories Ltd. Chemical
30 Glaxo Smithkline (Pakistan) Ltd. Chemical
31 ICI Pakistan Ltd. Chemical
32 Nimir Resins Ltd. Chemical
33 Pakistan Pta Ltd. Chemical
34 Searle Pakistan Ltd. Chemical
35 Wah Nobel Chemicals Ltd. (Pub.) Chemical
36 Nimir Industrial Chemicals Ltd. Chemical
37 Ados Pakistan Ltd. Engineering/Transport
38 Agriauto Industries Ltd. Engineering/Transport
39 Al-Ghazi Tractors Ltd. Engineering/Transport
40 Atlas Battery Ltd. Engineering/Transport
41 Atlas Honda Ltd. Engineering/Transport
42 Azgard Nine Ltd. Engineering/Transport
43 Crescent Steel And Allied Products Ltd Engineering/Transport
15
44 Dewan Farooque Motors Ltd. Engineering/Transport
45 General Tyre & Rubber Co. Ltd. Engineering/Transport
46 Ghandhara Nissan Ltd. Engineering/Transport
47 Ghani Automobiles Ltd. Engineering/Transport
48 Hinopak Motors Ltd. Engineering/Transport
49 Honda Atlas Cars (Pakistan) Ltd. Engineering/Transport
50 Huffaz Seamless Pipe Industries Ltd. Engineering/Transport
51 Johnson & Philips (Pakistan) Ltd. Engineering/Transport
52 Metropolitan Steel Corporation Ltd. Engineering/Transport
53 Millat Tractors Ltd. Engineering/Transport
54 Pak Elektron Ltd. Engineering/Transport
55 Pak Suzuki Motor Company Ltd. Engineering/Transport
56 Pakistan Cables Ltd. Engineering/Transport
57 International Industries Ltd. Engineering/Transport
58 Ghandhara Industries Ltd. Engineering/Transport
59 Ados Pakistan Ltd. Engineering/Transport
60 Al-Noor Sugar Mills Ltd. Sugar
61 Ansari Sugar Mills Ltd Sugar
62 Chashma Sugar Mills Ltd Sugar
63 Dewan Sugar Mills Ltd Sugar
64 Habib ADM Ltd Sugar
65 Habib Sugar Mills Ltd. Sugar
66 Haseeb Waqas Sugar Mills Ltd Sugar
67 JDW Sugar Mills Ltd. Sugar
68 Kohinoor Sugar Mills Ltd Sugar
69 Mirza Suggar Mills Ltd Sugar
70 Noon Sugar Mills Ltd. Sugar
71 Pangrio Sugar Mills Ltd. Sugar
72 Sakrand Sugar Mills Ltd. Sugar
73 Shahmurad Sugar Mills Ltd Sugar
74 Al- Abbas Cement Ltd. Cement
75 Attock Cement Pakistan Ltd. Cement
76 Cherat Cement Company Ltd. Cement
77 Dadabhoy Cement Industries Ltd. Cement
78 Dandot Cement Company Ltd. Cement
79 Dewan Cement. Ltd. (Pakland Cem. Ltd.) Cement
80 Fauji Cement Company Ltd. Cement
81 Fecto Cement Ltd. Cement
82 Gharibwal Cement Ltd. Cement
83 Kohat Cement Ltd. Cement
84 Lucky Cement Ltd. Cement
85 Maple Leaf Cement Factory Ltd Cement
86 Pioneer Cement Ltd. Cement
87 Attock Refinery Ltd. Fuel and Energy
88 Hub power (don’t know) Fuel and Energy
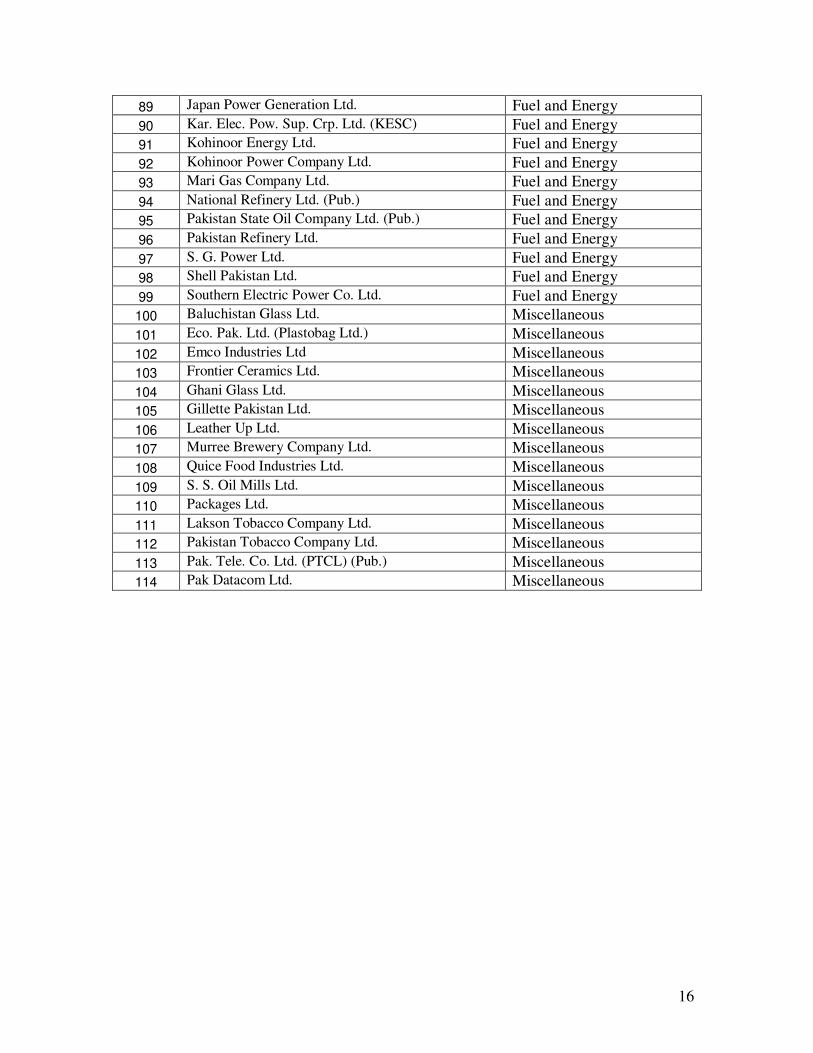
16
89 Japan Power Generation Ltd. Fuel and Energy
90 Kar. Elec. Pow. Sup. Crp. Ltd. (KESC) Fuel and Energy
91 Kohinoor Energy Ltd. Fuel and Energy
92 Kohinoor Power Company Ltd. Fuel and Energy
93 Mari Gas Company Ltd. Fuel and Energy
94 National Refinery Ltd. (Pub.) Fuel and Energy
95 Pakistan State Oil Company Ltd. (Pub.) Fuel and Energy
96 Pakistan Refinery Ltd. Fuel and Energy
97 S. G. Power Ltd. Fuel and Energy
98 Shell Pakistan Ltd. Fuel and Energy
99 Southern Electric Power Co. Ltd. Fuel and Energy
100 Baluchistan Glass Ltd. Miscellaneous
101 Eco. Pak. Ltd. (Plastobag Ltd.) Miscellaneous
102 Emco Industries Ltd Miscellaneous
103 Frontier Ceramics Ltd. Miscellaneous
104 Ghani Glass Ltd. Miscellaneous
105 Gillette Pakistan Ltd. Miscellaneous
106 Leather Up Ltd. Miscellaneous
107 Murree Brewery Company Ltd. Miscellaneous
108 Quice Food Industries Ltd. Miscellaneous
109 S. S. Oil Mills Ltd. Miscellaneous
110 Packages Ltd. Miscellaneous
111 Lakson Tobacco Company Ltd. Miscellaneous
112 Pakistan Tobacco Company Ltd. Miscellaneous
113 Pak. Tele. Co. Ltd. (PTCL) (Pub.) Miscellaneous
114 Pak Datacom Ltd. Miscellaneous
17
Appendix 3: Figure A3. Sector wise plot of CAR
a: Textile
b:Cement
c. Chemical
d. Fibre/Synthetic
18
Appendix 3 (continue): Sector wise graphs of CAR
e: Engineering
f: Sugar
g: Fuel and Energy
h: Miscellaneous