stock note - mangalore refinery and petrochemical ltd
TRANSCRIPT
RETAIL RESEARCH Page | 1
Mangalore Refinery and Petrochemical Ltd
Scrip Code Industry CMP Recommendation Add on Dips to band Sequential Targets Time Horizon MANREFEQNR Oil and Gas 74 Buy at CMP and add on declines Rs. 59‐65 Rs.85 and 96 2‐3 quarters
Mangalore Refinery and Petrochemical Ltd (MRPL), is a Mini Ratna Company and subsidiary of ONGC (owns 71.6% stake) located in Mangalore, strategically located on west coast of south India. MRPL has a refining capacity of 15 MMTPA (million metric tons of crude per annum) and has two Hydrocrackers producing Premium Diesel (High Cetane). Triggers
• Will benefit out of completion of capacity expansion through Phase‐III up‐gradation project, which was delayed, • GRM is likely to improve, with phase III commissioning, polypropylene unit commissioning to aid in margin expansion • Return Ratios could recover in near future as no major capex required in next few years, • Entitled to an incentive package from the Karnataka government, • Re‐Commencing Retail outlets and Aggressive Marketing initiatives.
Risks/Concerns
• Currency exchange and crude price risk, • Delay in getting benefit of recently commissioned capacities, • OMPL acquisition and possible merger? Unknown impact at this point. • Geo political concerns on its crude supplier from Iran.
Conclusion and Recommendation:
Expectations of strong revenue growth and margins expansion, combined strong RoE make a sense of higher multiple. We feel investors could “Buy” the stock at the CMP and add on declines to Rs.59‐65(4.25‐4.5x FY17E EV/EBITDA) band for sequential target prices of of Rs 85.8 (5.5xFY17E EV/EBITDA) and Rs.96.3 (6.0xFY17e EV/EBITDA) over 2‐3 quarters. At the CMP of Rs 74 stock trades at 5.3x of FY17E EV/EBITDA. Financial Summary (Consolidated)
Particulars‐Rs in Cr FY12 FY13 FY14 FY15 FY16E FY17E Net Sales 53770.3 65695.7 71814.8 57122.4 69007.8 70749.4 EBITDA 1613.4 300.2 1005.5 ‐2153.2 3154.3 3706.1 EBITDAM‐% 3.0% 0.5% 1.4% ‐3.8% 4.6% 5.2% Reported PAT after MI 908.6 ‐756.5 601.2 ‐1886.3 1922.5 2552.5 PATM‐% 1.7% ‐1.2% 0.8% ‐3.3% 2.8% 3.6% EPS 5.2 ‐4.3 3.4 ‐10.8 11.0 14.6
(Source: Company, HDFCSec,)
RETAIL RESEARCH
STOCK NOTE June 30, 2015
Price Chart
Stock Details BSE Code 500109
NSE Code MRPL
Bloomberg MRPL INPrice (Rs) as on 30 June, 2015 74
Equity Capital (Rs Cr) 1752.59
Face Value (Rs) 10
Eq. Shares O/s (Cr) 175.259Market Cap (Rs. Cr.) 12969.4
Book Value (Rs) 33.6
Avg. Volume (52 Week) 174210
52 wk H/L (Rs) 77.8/45.1
Shareholding Pattern (As on Mar, 31 2015)
Indian Promoters 88.58
Foreign Promoters 0.73
Institutions 3.53
Non Institutions 7.16
Total 100
Abdul Karim
Research Analyst [email protected]

RETAIL RESEARCH Page | 2
Company Profile Mangalore Refinery and Petrochemical Ltd (MRPL), is a Mini Ratna Company and subsidiary of ONGC (owns 71.6% stake ) located in Mangalore, strategically located on west coast of south India. The Refinery has got a versatile design with high flexibility to process Crudes of various API and with high degree of Automation. MRPL has a refining capacity of 15 MMTPA (million metric tonnes of crude per annum) and has two Hydrocrackers producing Premium Diesel (High Cetane) and 2 CCRs (Continuous Catalytic Reformer) producing Unleaded Petrol of High Octane. Moreover, the Company has Refinery Complexity of around Nelson 9.5. Currently many types of Petroleum and Petrochemical products viz. Naphtha, Jet Kero, HSD/ Gas Oil, FO, Reformate, VGO and Mixed Xylene are available for export. MRPL has high standards in refining and environment protection matched by its commitments to society. MRPL has also developed a Green Belt around the entire Refinery with plant species specially selected to blend with the local flora. MRPL buys crude oil from ONGC, Saudi ARAMCO (National Oil Company of Saudi Arabia), ADNOC (National Oil Company of Abu Dhabi), NIOC (National Oil Company of Iran), Kuwait Petroleum Corporation (KPC), Nigeria, Angola, Egypt, etc.
Business Overview: Refinery Business:
Recently, MRPL has completed its Phase III refinery expansion & up‐gradation project at Mangalore including (1) up‐gradation project (Rs 12160 crore), (2) polypropylene unit (Rs1804 crore) and (3) single point mooring (SPM) facility (Rs1044 crore). Originally the Phase III was expected to be completed by FY13, but due to delay in the completion of Captive Power Plant, it got delayed by almost 12‐15 months. Now everything is in place and MRPL could benefit out of completion of the Phase III. MRPL Refining processes are classified into; Primary Processing Unit: Crude Oil is separated into various products depending on the relative volatility of the Hydrocarbon components. Secondary Processing Units: This process receives feedstock from the Crude Unit and upgrades it to value added products. The main Secondary Processing Units in MRPL are:
• Hydrocracker Unit • Continuous Catalytic Regeneration Platforming Unit • Visbreaker Unit • Bitumen Unit
Treating Unit: Treating Units play an important role in removing impurities like Sulphur, Nitrogen and Metals from the products thereby meeting the stipulated product specifications. The important Treating Units in MRPL are:
• LPG/Naphtha/Kerosine Merox Unit • Diesel Hydrotreater Unit
RETAIL RESEARCH Page | 3
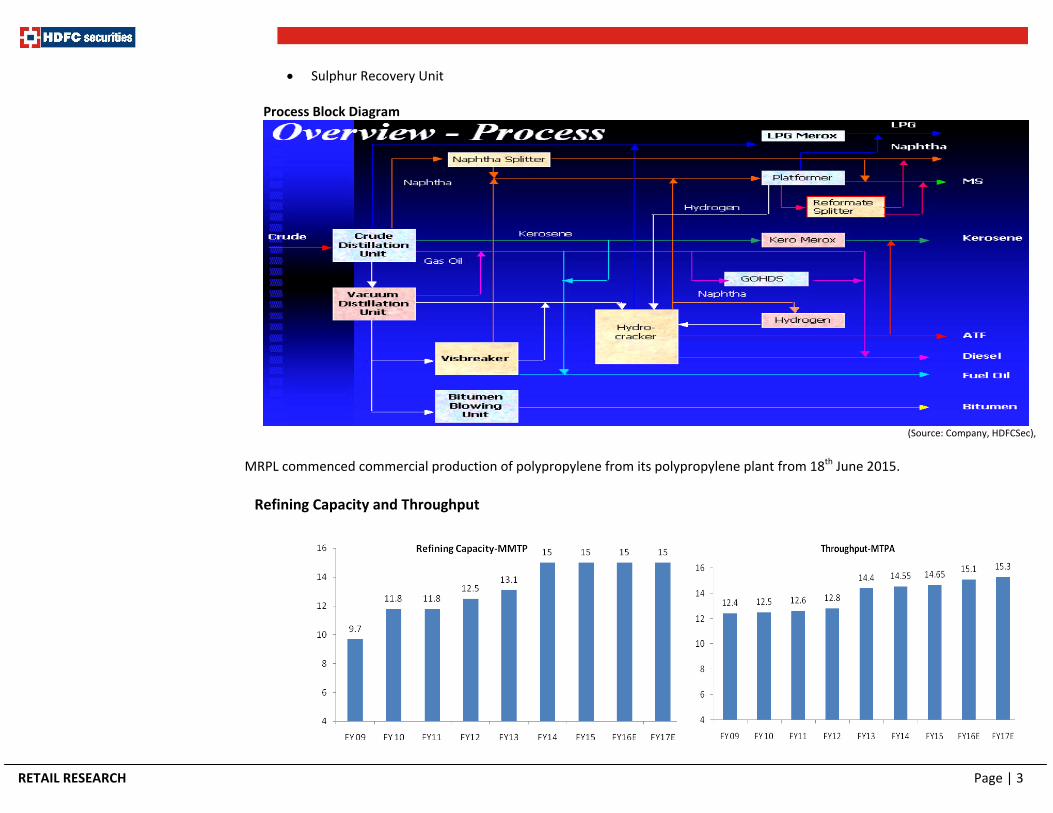
• Sulphur Recovery Unit Process Block Diagram
(Source: Company, HDFCSec),
MRPL commenced commercial production of polypropylene from its polypropylene plant from 18th June 2015. Refining Capacity and Throughput

RETAIL RESEARCH Page | 4
(Source: Company, HDFCSec,)
GRM (USD/bbl) v/s Singapore GRM (USD/bbl)
(Source: Company, HDFCSec,
Export Business: MRPL contributes 10.3%, out of the total exports of petroleum products by India. MRPL is investing in up gradation, expansion and setting up of new project for lifting the quality to international standards. It is also are planning to convert low value products to high value products. MRPL has reported export revenue of Rs.22790 cr in FY15, while it achieved highest ever export revenue of Rs 35392cr during FY14 by exporting products like MS (Motor Spirit), Naphtha, MX (Mixed Xylene), HSD (High Speed Diesel, ATF (Air Turbine Fuel), and FO (Fuel Oil). In the global competitive market, the Company has secured its place by exporting petroleum products to 21 countries viz. Bahamas , China , Egypt, Hongkong, Japan, Jordan, Kenya ,Korea, Malaysia ,Mauritius, Netherlands, Oman ,Saudi Arabia, Singapore, Slovenia, South Africa, Taiwan, Turkey ,UAE, UK and Yemen and continues to explore more opportunities for its growth.
Key Strengths:
Marketing:
MRPL is aggressive on its direct marketing activities in the state of Karnataka and its adjoined states. With the availability of natural gas pipeline in North Karnataka and Goa, some major customers have shifted from liquid fuels to gas, leading to shrinkage of liquid fuels market. However, MRPL could establish a good market reach for sale of Petcoke produced from the Delayed Coker
MRPL

RETAIL RESEARCH Page | 5
Unit (DCU) commissioned in Phase‐III project during April, 2014. The total Direct Marketing revenue during the FY14 was at Rs 2589 cr.
MRPL continues to develop its direct marketing network for various values added products like Pet coke, Polypropylene, etc. These products will be produced in Phase III Refinery Projects. Retail Operations: MRPL embarked into bulk sales of HSD after the introduction of dual pricing for HSD which has improved sales considerably in the bulk consumer segment. Domestic sale of Mixed Xylene has increased considerably against previous year. Keeping in view the gradual decontrol of HSD in retail segment; the Company is evaluating the opportunity to set up few retail outlets in select markets. New Product Marketing Plan: The Company has commissioned a Polypropylene (PP) plant of 440 KTPA capacities for bulk supplies to downstream processing industry. The channel partners have been identified for sale of Polypropylene (PP) in key areas in the domestic market. In addition to this, the Company is also developing storage infrastructure for Polypropylene (PP) in Karnataka for managing its supply chain for marketing networks. Joint Ventures: MRPL has formed a Joint Venture with with Shell B.V. Netherland known as Shell MRPL Aviation Fuel Services Limited (SMAFSL) which supplies Aviation Turbine Fuel (ATF) to both domestic and international airlines at Indian airports. The turnover of the SMAFSL was at Rs 651 Crore during the FY14 against Rs 486 Crore during FY13 and the Pre‐tax profit of Rs 18.40 Crore during the FY14 against Rs 13.14 Crore during FY13.
Manufacturing Facilities: Crude and Vacuum Distillation Unit: The Atmospheric, Vacuum Distillation Units and Naphtha Splitter Unit designed by M/s Engineers India Ltd., are heat integrated, using Pinch Technology to achieve high‐energy efficiency, thereby reducing Fuel Oil consumption and in turn reducing air emissions. Hydrocracker Units: This Unit produces high quality sulphur free Diesel and ATF. The plant has been designed for 100% conversion of low value Vacuum Gas oils to lighter and low sulphur valuable product.
Plat forming Units: The Continuous Catalytic Regeneration Platforming Unit( CCR) produces lead free, high Octane Motor Spirit (Petrol).

RETAIL RESEARCH Page | 6
Merox : LPG Merox unit controls the Sulphur contents in LPG. The Kerosene Merox unit converts mercaptans to disulphide. Soaker Visbreakers: Shell Soaker Visbreaker technology under the Licence of ABB Lummus, Holland, has been adopted to upgrade heavy vacuum residue to Gas, Naphtha and Gas Oil. This is the first Unit in India to have Vacuum Flash column producing Vacuum Gas Oil, that is used for supplementing the feed stock to Hydrocracker Unit and extracting maximum value from short residue.
Hydrogen: The Hydrogen produces Hydrogen by steam reforming of Naphtha. Hydrogen purity of 99.9% is achieved through the UOP Pressure Swing Adsorption (PSA) unit. Bitumen: This unit employs the highly efficient Biturox process given by M/s Porner, Austria to produce various grades of asphalt.
Captive Power Plant: For Phase I and Phase II, captive power plant with a capacity of 118.5MW, and for Phase III captive power plant with a capacity of 116MW.
Pipelines:
MRPL Oil Jetties are located inside the NMPT (New Mangalore Port Trust). There are 6 lines running from Refinery to coastal terminal out of which 4 are White Oil lines and 2 are Black Oil lines. Out of 2 Black Oil lines 1 is a Crude receipt line of 36 diameters and other 1 is used for Furnace oil/ LSHS service. From coastal terminal hook up is taken for supplying products to IOCL and BPCL.
MRPL Capabilities:
Products Capabilities
NAPTHA Petrochemical grade Naphtha with 70 vol% paraffins and 10 vol% Aromatics with very low Metals and Sulphur.
Fertilizer grade Naphtha with 65 vol% Paraffins and 12 vol% Aromatics and low in Sulphur. High Aromatic Naphtha with 60 vol% Paraffins max. and 12 vol% Aromatics min.
MS
Motor Gasoline with 3% Benzene, 89 Ron & 0.05% Sulphur Grade. Motor Gasoline with 1% Benzene, 89 Ron & 0.05% Sulphur. Motor Gasoline Export 5% Benzene, 97 Ron, Doctor test negative & aromatics 68 vol%. Reformate with 96 Ron (Aromatic Stream). Reformate RON upto 107. MRPL is the first Refinery in India to release Euro‐III MS.

RETAIL RESEARCH Page | 7
ATF Domestic grade ATF. Export grade ATF meeting Def Stan 91‐91 (Defence Standard) issue ‐5.
HSD HSD with 0.25% & 0.05 Sulphur with 35 flash HSD with 0.5% Sulphur or even less, upto 0.05 wt% and 66 flash (Export grade) MRPL is the first Refinery in India to produce Euro‐III HSD.
FO
FO Domestic with 180 cst viscosity and Max. 4.0 % Sulphur. FO Export with 380 cst viscosity & 3.2 % Sulphur. LVFO with 80 cst viscosity . LSFO with 2% S and 180 CST
(Source: Company, HDFCSec)
Completed Projects: Phase ‐III Refinery Up gradation and Expansion Project: The commissioning of all the Secondary Process Units of Phase ‐III Refinery Upgradation and Expansion project were completed in September 2014, these units will increase the distillate yield and produce high value products viz Propylene, Gasoline from low value black oils. Crude Distillation Unit (CDU), Hydrogen Generation Unit (HGU) and Diesel Hydrotreater Unit (DHDT) were commissioned in the previous financial years. Now, the Refinery is capable for processing most difficult crudes from 18API (Blended) to 46 API gravity and light to heavy.
Single Point Mooring (SPM) Project: The Company has setup SPM Project on 29th Aug 2013 partnership with Coastal booster pumping station within the port limits at a location of 16 Km with estimated cost of Rs 1044 cr. This facility will enable the company to receive crude in Suez max and VLGG vessels which in turn will give freight economics and also allow access to West African and Latin American countries for sourcing crudes. Polypropylene Unit: The Polypropylene (PP) unit commercial production has been started since 18th June, 2015 and set up with the licensor M/s Novolen Technology, Germany in integration with the Phase ‐III Project at an estimated Capex of Rs 1804 Crore.
Future Projects: MRPL has decided to minor revamp of its CCR project, investment with an estimated cost of Rs 195cr.
Investment Rationale:
Capacity expansion through PhaseIII up‐gradation project:
RETAIL RESEARCH Page | 8
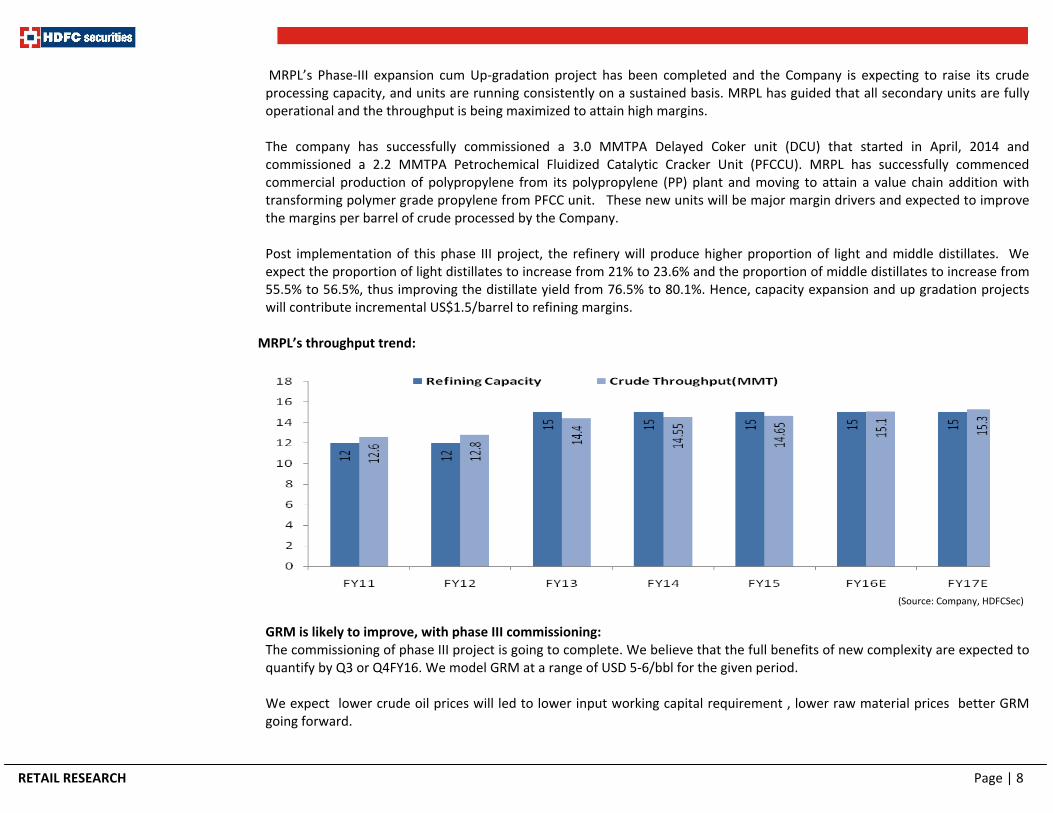
MRPL’s Phase‐III expansion cum Up‐gradation project has been completed and the Company is expecting to raise its crude processing capacity, and units are running consistently on a sustained basis. MRPL has guided that all secondary units are fully operational and the throughput is being maximized to attain high margins. The company has successfully commissioned a 3.0 MMTPA Delayed Coker unit (DCU) that started in April, 2014 and commissioned a 2.2 MMTPA Petrochemical Fluidized Catalytic Cracker Unit (PFCCU). MRPL has successfully commenced commercial production of polypropylene from its polypropylene (PP) plant and moving to attain a value chain addition with transforming polymer grade propylene from PFCC unit. These new units will be major margin drivers and expected to improve the margins per barrel of crude processed by the Company. Post implementation of this phase III project, the refinery will produce higher proportion of light and middle distillates. We expect the proportion of light distillates to increase from 21% to 23.6% and the proportion of middle distillates to increase from 55.5% to 56.5%, thus improving the distillate yield from 76.5% to 80.1%. Hence, capacity expansion and up gradation projects will contribute incremental US$1.5/barrel to refining margins.
MRPL’s throughput trend:
(Source: Company, HDFCSec)
GRM is likely to improve, with phase III commissioning: The commissioning of phase III project is going to complete. We believe that the full benefits of new complexity are expected to quantify by Q3 or Q4FY16. We model GRM at a range of USD 5‐6/bbl for the given period. We expect lower crude oil prices will led to lower input working capital requirement , lower raw material prices better GRM going forward.

RETAIL RESEARCH Page | 9
(Source: Company, HDFCSec)
Polypropylene unit commissioning to add to GRMs: MRPL has successfully commenced commercial production of polypropylene from its polypropylene (PP) plant. The plant, which is a part of its phase III refinery expansion and up‐gradation project, has capacity to produce 4,40,000 TPA polypropylene. In the first two quarters Q2 and Q3 of FY16, it targets around 60‐65% of the capacity utilisation and hopefully, from Q4 it should be touching the full capacity. Coming to the impact in terms of gross refining margins (GRMs), on 15 million tonne basis, it should give MRPL an incremental GRM of USD 1.25‐1.5 per barrel across the board. MRPL PP unit is the only plant in South India, which is estimated to have 5 lakh tonnes per annual demand for polypropylene. MRPL Return Ratio could recover in near future: Historically, MRPL has enjoyed with good return ratio (more than 18%). Due to large investment in phase III project for up gradation and expansion, and decline in GRM from USD 6/bbl (FY11) to USD2.5/bbl (FY13E), the company reported loss. However, we expect that return ratios would bounce back into the positive node, given the benefit of incremental GRMs will start accruing to MRPL from FY16E onwards.
(Source: Company, HDFCSec)

RETAIL RESEARCH Page | 10
Aggressive Marketing initiatives: The Company has retained its strong market presence in its Refinery zone for products (viz. Bitumen, CRMB) and has also been able to get a good market reach for Petcoke. The Company could evacuate on a consistent basis Petcoke and Sulphur in domestic as well as export market.
Entitled to an incentive package from the Karnataka government: MRPL’s Phase III up‐gradation has completed and a separate project‐ which is the polypropylene unit, which has also commissioned this month. Post completion of these projects the Overall GRM could improve because of value added unit PFCC. MRPL is entitled to an incentive package from the Karnataka government for Phase III expansion; this includes
• Exempting MRPL from payment of entry tax on plant and machinery and capital goods during the initial period of four years from the date of commencement of project implementation.
• Exempting MRPL from Payment of entry tax on the crude oil required for third phase over and above the refining capacity of first and second phase for 15 years from the start of commercial production of third phase.
• CST exemption for 15 years from the date of commencement of commercial production of third phase for all interstate sales made out of the phase III throughput.
• Interest free soft loan at the rate of 100% of the eligible gross VAT during the first three years and thereafter at 60% of eligible Gross VAT, on the sale of Poly Propylene, Petroleum Coke, LSHS, Naphtha, LPG (incremental production), Mixed Xylenes and Reformate to non SEZ units for 15 years to be repaid in 15 years equal annual installments thereafter, limited to Rs. 500 crore per annum.
Moreover, the refinery’s distillate yield should increase to almost 80% from 76.5%. Cheaper inputs and an increase in the quantity of higher‐value products mean better gross refining margins for the company. This benefit will translate into higher profits and profitability in the coming years.
Re‐Commencing Retail outlets: Post deregulation of Diesel prices, MRPL is planning to open 100 retail outlets in near to medium term. At present, the company has started this retail initiative by opening 2 outlets in Chennai. Concerns:
Currency exchange risk: Oil refinery business is USD dominated and the prices of both input (crude Oil) and Output (Products) are based on international quotes. Currency fluctuation in INR against USD provides a natural hedge against the exchange rate volatility in normal case. MRPL imports usually 80% of its crude oil and exports almost 47% of the total production, where sale proceeds are realized in USD term and even, domestic sales also depends trade and import parity prices based on USD. The Company exports its major products like HSD, ATF, MX under tender on monthly average prices. However, sudden fluctuation in crude and product prices will have a significant impact on its margin.

RETAIL RESEARCH Page | 11
Delay in operation: Any delay on operation of projects like Phase III Projects, or propylene projects, etc could significantly impact it earnings as well as valuation. Earlier, the commissioning of MRPL’s ambitious project (refinery expansion & up‐gradation and polypropylene unit) had got delayed due to a delay in commissioning of the captive power plant (CPP) being built by BHEL. Geo political concern on its supplier: The current region‐wide sectarian war could easily bump oil prices up dramatically. And, the expected nuclear deal with Iran could drop them—dramatically. Any slowdown in the global economy and weaker demand will lead to a decline in gross refining margins and will have a negative impact on the profitability of the company. Decline in Refining Margin: Any Slowdown in the global economy and miss‐ match between demand and supply could impacts its profitability.
OMPL acquisition and possible merger? The possibility of merger between OMPL (ONGC Mangalore Petrochemical Ltd ) and MRPL has been doing the rounds due to close integration. ONGC holds almost 42% stake in OMPL and 72% stake in MRPL. MRPL supplies 70% of the feedstock requirement of OMPL and both the plants are located very near to each other; therefore, it makes sense to ensure further integration between the two. If OMPL merges with MRPL, the impact on MRPL is unknown at this point. Conclusion and Recommendation: We expect an improvement in complexity, better GRM and lower crude oil prices would support better visibility on profitability. With the commencement of operations at all secondary processing units, operational efficiencies will kick in that will boost refining margins from US$2.5/barrel in FY13 to US$5.4/barrel and US$6/barrel in FY16E and FY17E, respectively. An improvement in operational performance led by expansion and up‐gradation projects and expectation of bounce back in GRM could lead to strong earning visibility and RoE improvement. Expectations of strong revenue growth and margins expansion, combined with strong RoE make a sense of higher multiple. We feel investors could “Buy” the stock at the CMP and add on declines to Rs.59‐65(4.25‐4.5x FY17E EV/EBITDA) band for sequential target prices of of Rs 85.8 (5.5xFY17E EV/EBITDA) and Rs.96.3 (6.0xFY17e EV/EBITDA) over 2‐3 quarters. At the CMP of Rs 74 stock trades at 5.3x of FY17E EV/EBITDA. Key estimates: Financials
Particulars‐Rs in Cr FY12 FY13 FY14 FY15E FY16E FY17E Net Sales 53770.3 65695.7 71814.8 57122.4 69007.8 70749.4 EBITDA 1613.4 300.2 1005.5 ‐2153.2 3154.3 3706.1 EBITDAM‐% 3.0% 0.5% 1.4% ‐3.8% 4.6% 5.2% Reported PAT after MI 908.6 ‐756.5 601.2 ‐1886.3 1922.5 2552.5 PATM‐% 1.7% ‐1.2% 0.8% ‐3.3% 2.8% 3.6% EPS 5.2 ‐4.3 3.4 ‐10.8 11.0 14.6
(Source: Company, HDFCSec, E: Estimates)

RETAIL RESEARCH Page | 12
Key estimates: Physical Performance
Particulars FY11 FY12 FY13 FY14 FY15 FY16E FY17E
Refining Capacity 12.0 12.0 15.0 15.0 15.0 15.0 15.0
Crude Throughput(MMT) 12.6 12.8 14.4 14.6 14.7 15.1 15.3
Capacity Utilisation 107.0% 108.0% 93.0% 95.0% 97.7% 100.7% 102.0%
GRM‐USD/bbl 6.0 5.6 2.5 2.7 ‐0.6 5.4 6.0 (Source: Company, HDFCSec, E: Estimates
Physical Performance‐Quarterly
Particulars Q3FY13 Q4FY13 Q1FY14 Q2FY14 Q3FY14 Q4FY14 Q1FY15 Q2FY15 Q3FY15 Q4FY15 Throughput(MMTPA) 3.81 4.12 3.27 3.69 3.75 3.84 3.2 3.47 3.86 4.12 Product sales (Incl Expt) 3.6 3.7 3.19 3.36 3.39 3.44 2.93 3.1 3.57 3.62 GRM 1.9 2 2.9 5 ‐0.6 3.2 0 ‐4 ‐6.7 6.97 Sales Growth(%) 39.1% 17.3% 19.2% 15.0% 3.7% 2.9% 3.1% ‐15.2% ‐21.1% ‐34.3%
(Source: Company, HDFCSec, E: Estimates)
Financial Performance‐Quarterly
Quarterly
Particulars Q4FY15 Q3FY15 %Chg Q4FY14 %Chg. 2HFY15 2HFY14 %Chg3.
Total Sales 13156 15833 ‐16.91% 20032 ‐34.3% 28989 39538 ‐26.7%
Less: Excise Duty 2063 1121 84.05% 904 128.2% 3184 1756 81.4%
Net Sales 11093 14712 ‐24.60% 19128 ‐42.0% 25805 37782 ‐31.7%
Other Operating Income 180 4 4936.69% 579 ‐69.0% 183 775 ‐76.3% Total income from operations (net) 11273 14715 ‐23.40% 19707 ‐42.8% 25988 38557 ‐32.6%
Raw Materials Cost 9639 14625 ‐34.09% 19060 ‐49.4% 24264 38241 ‐36.6%
Employee Cost 70 59 18.74% 57 21.3% 128 113 13.0%
Changes in inventory 140 1199 ‐88.36% ‐503 ‐127.8% 1339 ‐928 ‐244.3%
Other expenses 167 636 ‐73.74% 150 11.5% 803 251 220.3%
Total expenses 10015 16519 ‐39.37% 18765 ‐46.6% 26534 37678 ‐29.6%
EBITDA 1257 ‐1804 ‐169.71% 942 33.4% ‐546 879 ‐162.1%
Core EBITDA 1257 ‐1804 ‐169.71% 942 33.4% ‐546 879 ‐162.1%
Depreciation 149 143 4.21% 177 ‐15.9% 292 362 ‐19.3%
Other Income 202 180 12.17% 157 28.4% 382 251 52.1%

RETAIL RESEARCH Page | 13
Exceptional Items 0.00 ‐0.03 ‐ 0.00 ‐ 0 0 ‐
EBIT 1108.29 ‐1946.43 ‐156.94% 765.24 44.8% ‐838 518 ‐261.9%
Interest Cost 113.81 127.90 ‐11.02% 58.19 95.6% 242 151 60.1%
Profit Before Taxes 1196.31 ‐1894.36 ‐163.15% 864.23 38.4% ‐698 618 ‐213.0%
Provision for Taxes 26.61 0.00 ‐ ‐202.81 ‐113.1% 27 ‐202 ‐
Net Profit (+)/Loss (‐) 1169.70 ‐1894.36 ‐161.75% 1067.04 9.6% ‐725 819 ‐188.4% (Source: Company, HDFCSec, E: Estimates) Profit & Loss (Consolidated)
Rs in Cr FY11 FY12 FY13 FY14 FY15 FY16E FY17E
Revenue from Operations 43730.46 57213.69 68837.715 75230.41 62077 74784.91 76672.36
Less: Excise Duties 4843.57 3443.41 3142.05 3415.62 4954.61 5777.13 5922.94
Net Sales 38886.89 53770.28 65695.665 71814.79 57122.39 69007.8 70749.4
Cost of raw materials consumed 37219.34 51236.75 65400.18 70852.52 55670.06 62807.11 64040.02
Changes in inventories, ‐815.27 ‐150.21 ‐1116.53 ‐674.08 1864.17 1895.2 1587.6
Employee benefits expense 184.54 160.64 184.56 215.48 245.58 289.0 354.2
Other expenses 275.52 909.71 927.3 415.38 1495.74 862.1 1061.5
Total expenses 36864.13 52156.89 65395.51 70809.3 59275.55 65853.5 67043.3
EBITDA 2022.76 1613.39 300.155 1005.49 ‐2153.16 3154.3 3706.1
Depreciation and amortization 391.42 433.87 604.41 706.42 521.65 719.9 839.9
EBIT 1631.34 1179.52 ‐304.255 299.07 ‐2674.81 2434.4 2866.3
Other income 210.38 347.38 111.88 320.17 794.52 690.2 849.2
Finance costs 104.65 206.68 328.55 321.44 448.21 718.0 521.2
Profit before Tax 1737.07 1320.22 ‐520.925 297.8 ‐2328.5 2406.6 3194.2
Total tax expense 560.45 411.63 280.07 ‐191.49 ‐442.18 484.1 641.7
PAT Reported 1176.62 908.59 ‐800.995 489.29 ‐1886.32 1922.5 2552.5
Exceptional Items 0 0 ‐44.45 ‐111.89 33.45 0.0 0.0
PAT before Minority 1176.62 908.59 ‐756.55 601.18 ‐1852.87 1922.5 2552.5
Minority Interest 0 0 0 0 0 0.0 0.0 Net Profit ‐ Adjusted 1176.62 908.59 ‐756.55 601.18 ‐1886.32 1922.5 2552.5
(Source: Company, HDFCSec, Estimates)
RETAIL RESEARCH Page | 14
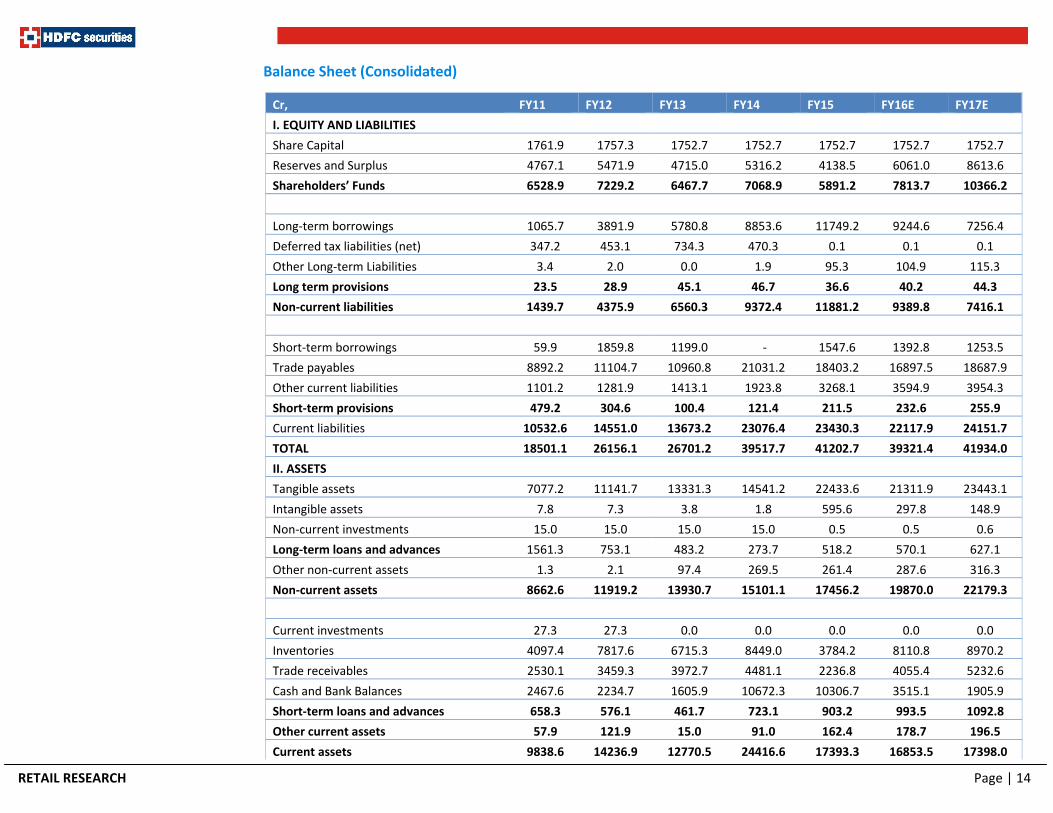
Balance Sheet (Consolidated)
Cr, FY11 FY12 FY13 FY14 FY15 FY16E FY17E
I. EQUITY AND LIABILITIES
Share Capital 1761.9 1757.3 1752.7 1752.7 1752.7 1752.7 1752.7
Reserves and Surplus 4767.1 5471.9 4715.0 5316.2 4138.5 6061.0 8613.6
Shareholders’ Funds 6528.9 7229.2 6467.7 7068.9 5891.2 7813.7 10366.2
Long‐term borrowings 1065.7 3891.9 5780.8 8853.6 11749.2 9244.6 7256.4
Deferred tax liabilities (net) 347.2 453.1 734.3 470.3 0.1 0.1 0.1
Other Long‐term Liabilities 3.4 2.0 0.0 1.9 95.3 104.9 115.3
Long term provisions 23.5 28.9 45.1 46.7 36.6 40.2 44.3
Non‐current liabilities 1439.7 4375.9 6560.3 9372.4 11881.2 9389.8 7416.1
Short‐term borrowings 59.9 1859.8 1199.0 ‐ 1547.6 1392.8 1253.5
Trade payables 8892.2 11104.7 10960.8 21031.2 18403.2 16897.5 18687.9
Other current liabilities 1101.2 1281.9 1413.1 1923.8 3268.1 3594.9 3954.3
Short‐term provisions 479.2 304.6 100.4 121.4 211.5 232.6 255.9
Current liabilities 10532.6 14551.0 13673.2 23076.4 23430.3 22117.9 24151.7
TOTAL 18501.1 26156.1 26701.2 39517.7 41202.7 39321.4 41934.0
II. ASSETS
Tangible assets 7077.2 11141.7 13331.3 14541.2 22433.6 21311.9 23443.1
Intangible assets 7.8 7.3 3.8 1.8 595.6 297.8 148.9
Non‐current investments 15.0 15.0 15.0 15.0 0.5 0.5 0.6
Long‐term loans and advances 1561.3 753.1 483.2 273.7 518.2 570.1 627.1
Other non‐current assets 1.3 2.1 97.4 269.5 261.4 287.6 316.3
Non‐current assets 8662.6 11919.2 13930.7 15101.1 17456.2 19870.0 22179.3
Current investments 27.3 27.3 0.0 0.0 0.0 0.0 0.0
Inventories 4097.4 7817.6 6715.3 8449.0 3784.2 8110.8 8970.2
Trade receivables 2530.1 3459.3 3972.7 4481.1 2236.8 4055.4 5232.6
Cash and Bank Balances 2467.6 2234.7 1605.9 10672.3 10306.7 3515.1 1905.9
Short‐term loans and advances 658.3 576.1 461.7 723.1 903.2 993.5 1092.8
Other current assets 57.9 121.9 15.0 91.0 162.4 178.7 196.5
Current assets 9838.6 14236.9 12770.5 24416.6 17393.3 16853.5 17398.0

RETAIL RESEARCH Page | 15
TOTAL 18501.1 26156.1 26701.2 39517.7 41202.7 39321.4 41934.0 (Source: Company, HDFCSec, E: Estimates)
Cash Flow Statement (Consolidated)
Particulars, Rs in Cr FY11 FY12 FY13 FY14 FY15 FY16E FY17E
EBT 1737.08 1320.20 ‐476.85 409.70 ‐2674.81 2434.38 2866.27
Depreciation and Amortization 393.03 439.38 604.41 706.02 521.65 719.88 839.86
Interest /Dividend paid 104.65 206.68 328.55 321.44 448.21 1179.43 1133.84
Other Adjustment ‐194.56 ‐332.30 ‐62.19 ‐737.26 ‐1684.60 ‐3023.58 ‐2902.05
(Inc)/Dec in working Capital 723.35 ‐1860.97 597.28 8401.67 5463.93 ‐7409.38 19.32
Tax Paid ‐821.22 ‐432.26 ‐109.34 ‐138.10 442.18 ‐484.07 ‐641.67
CF from Operating Activities 1942.34 ‐659.26 881.86 8963.45 2516.56 ‐6583.35 1315.57
Capital expenditure ‐3561.62 ‐3263.59 ‐2331.88 ‐1499.66 ‐7892.46 1121.68 ‐2131.19
(Purchase)/Sale of Investment 0.00 0.00 27.33 0.00 ‐14.52 0.05 0.05
Others 240.39 299.33 95.48 201.03 150.00 150.00 200.00
CF from Investing Activities ‐3321.22 ‐2964.26 ‐2209.07 ‐1298.63 ‐7756.98 1271.73 ‐1931.14
Inc/(Dec) in Share capital 0.00 ‐4.59 ‐4.59 0.00 0.00 0.00 0.00
Inc/(Dec) in Debt ‐139.42 4626.14 1230.33 1702.74 4443.21 ‐2659.36 ‐2127.48
Dividend and Interest Paid ‐349.90 ‐450.99 ‐527.55 ‐299.66 448.21 1179.43 1133.84
CF from Financing Activities ‐489.32 4170.55 698.19 1403.08 4891.42 ‐1479.93 ‐993.64
Net Cash Flow ‐1868.20 547.03 ‐629.02 9067.90 ‐349.00 ‐6791.55 ‐1609.22
Opening Balance 3537.94 1669.74 2216.77 1587.75 10655.65 10306.65 3515.10
Closing Balance 1669.74 2216.77 1587.75 10655.65 10306.65 3515.10 1905.88 (Source: Company, HDFCSec, E: Estimates)
Key Ratios (Consolidated)
Particulars FY11 FY12 FY13 FY14 FY15 FY16E FY17E
No of Equity Shares‐cr 175.26 175.26 175.26 175.26 175.26 175.26 175.26
Current Market Price‐Rs 61.36 66.54 53.43 42.22 63.56 70.00 70.00
Market Capitalization‐cr 10754.0 11661.8 9364.1 7399.5 11139.5 12268.2 12268.2
Enterprise Value‐cr 9411.9 15178.8 14738.1 5580.7 14129.7 19390.5 18872.3
EPS 6.7 5.2 ‐4.3 3.4 ‐10.8 11.0 14.6
Cash EPS 8.9 7.7 ‐0.9 7.5 ‐7.8 15.1 19.4
Book Value Per Share(Rs.) 37.3 41.2 36.9 40.3 33.6 44.6 59.1
RETAIL RESEARCH Page | 16
PE(x) 9.1 12.8 ‐12.4 12.3 ‐5.9 6.4 4.8
P/BV (x) 1.6 1.6 1.4 1.0 1.9 1.6 1.2
Mcap/Sales(x) 0.3 0.2 0.1 0.1 0.2 0.2 0.2
EV/EBITDA 4.7 9.4 49.1 5.6 ‐6.6 6.1 5.1
EBITDAM (%) 5.2% 3.0% 0.5% 1.4% ‐3.8% 4.6% 5.2%
EBITM (%) 4.2% 2.2% ‐0.5% 0.4% ‐4.7% 3.5% 4.1%
PATM (%) 3.0% 1.7% ‐1.2% 0.8% ‐3.3% 2.8% 3.6%
ROCE (%) 25% 13% ‐3% 4% ‐8% 17% 21%
RONW (%) 18.02% 13% ‐12% 9% ‐32% 25% 25%
Current Ratio 0.93 0.98 0.93 1.06 0.74 0.76 0.72
Quick Ratio 0.55 0.44 0.44 0.69 0.58 0.40 0.35
Debt‐Equity 0.16 0.54 0.89 1.25 1.99 1.18 0.70 (Source: Company, HDFCSec, E: Estimates)
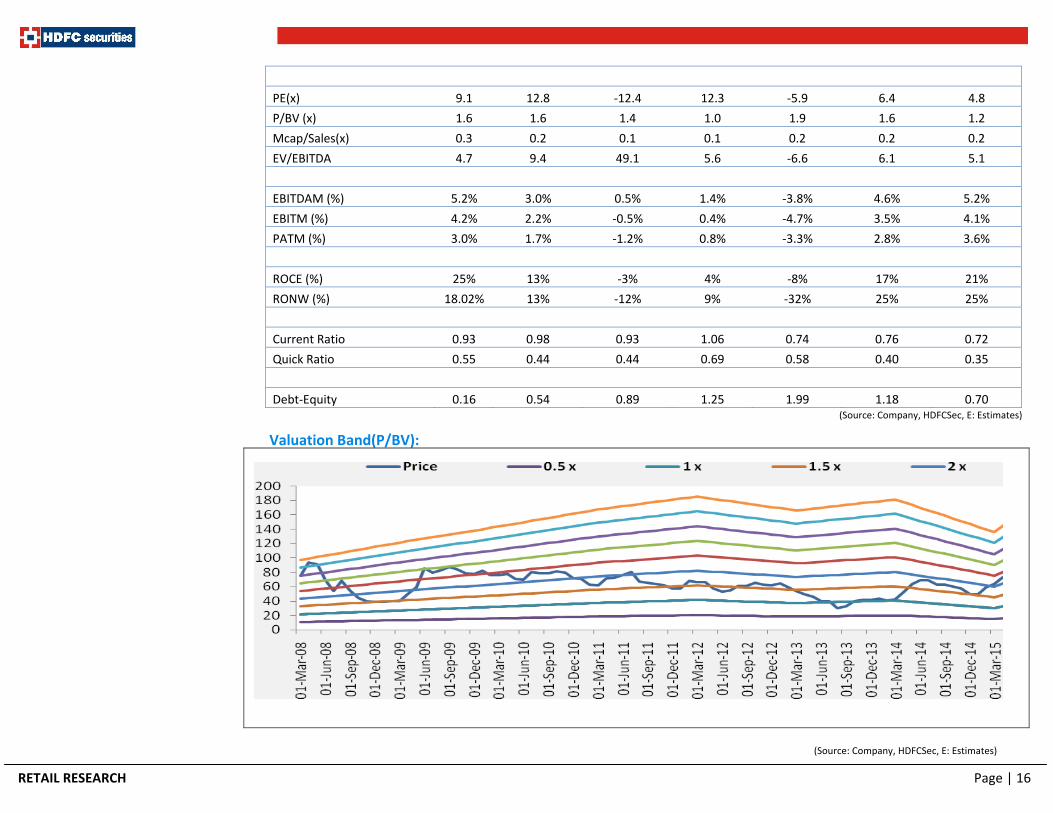
Valuation Band(P/BV):
(Source: Company, HDFCSec, E: Estimates)

RETAIL RESEARCH Page | 17
1‐Year closing price chart:
30 J 25 J 21 A 18 S 12 25 O 28 N 25 D 19 J15 15 29 F 25 M 23 A 21 M 18 29 J 24
86
84
82
80
78
76
74
72
70
68
66
64
62
60
58
56
54
52
50
48
46
44
42
40
1-MRPL.Mang. Ref & Petochem Ltd..NSE - 29/06/15 Trend7
Daily
Fundamental Research Analyst: Abdul Karim [email protected].
RETAIL RESEARCH Tel: (022) 3075 3400 Fax: (022) 2496 5066 Corporate Office
HDFC securities Limited, I Think Techno Campus, Building - B, "Alpha", Office Floor 8, Near Kanjurmarg Station, Opp. Crompton Greaves, Kanjurmarg (East), Mumbai 400 042 Phone: (022) 3075 3400 Fax: (022) 2496 5066 Website: www.hdfcsec.com Email: [email protected]
Disclaimer: This document has been prepared by HDFC Securities Limited and is meant for sole use by the recipient and not for circulation. This document is not to be reported or copied or made available to others. It should not be considered to be taken as an offer to sell or a solicitation to buy any security. The information contained herein is from sources believed reliable. We do not represent that it is accurate or complete and it should not be relied upon as such. We may have from time to time positions or options on, and buy and sell securities referred to herein. We may from time to time solicit from, or perform investment banking, or other services for, any company mentioned in this document. This report is intended for non-Institutional Clients
This report has been prepared by the Retail Research team of HDFC Securities Ltd. The views, opinions, estimates, ratings, target price, entry prices and/or other parameters mentioned in this document may or may not match or may be contrary with those of the other Research teams (Institutional, PCG) of HDFC Securities Ltd.
Disclosure by Research Analyst: Research Analyst or his relative or HDFC Securities Ltd. does not have any financial interest in the subject company. Also Research Analyst or his relative or HDFC Securities Ltd. or its Associate does not have beneficial ownership of 1% or more in the subject company at the end of the month immediately preceding the date of publication of the Research Report. Further Research Analyst or his relative or HDFC Securities Ltd. or its associate does not have any material conflict of interest. Any holding in stock - No
Disclosure by Research Entity: HDFC Securities Ltd. may have received any compensation/benefits from the subject company, may have managed public offering of securities for the subject company in the past 12 months. Further, Associates of the Company may have financial interest from the subject company in the normal course of Business. The subject company may have been our client during twelve months preceding the date of distribution of the Research report. Research analyst has not served as an officer, director or employee of the subject company. Research entity has not been engaged in market making activity for the subject company. We have not received any compensation/benefits from the subject company or third party in connection with the Research Report.