stock market reactions to announcements of boards of
TRANSCRIPT

Munich Personal RePEc Archive
Stock Market Reactions to
Announcements of Boards of Director
Appointments: Evidence from Italy
Rossi, Fabrizio and Cebula, Richard
University of Cassino and Southern Lazio, Jacksonville University
5 September 2013
Online at https://mpra.ub.uni-muenchen.de/58403/
MPRA Paper No. 58403, posted 08 Sep 2014 04:48 UTC
1
Stock Market Reactions to Announcements of Board of Director
Appointments: Evidence from Italy
Fabrizio Rossi1
University of Cassino and Southern Lazio, Italy
e-mail: [email protected]
Richard J. Cebula
Davis College of Business, Jacksonville University, Jacksonville, FL 32211, USA
e-mail: [email protected]
Abstract
The Board of Directors plays an important role in corporate governance. It is an internal
mechanism that controls and monitors the actions of managers and aligns the utility functions
between corporate owners and managers. The board of directors performs multiple functions
that concern, for example, the replacement of the managers, financial policy, the preparation of
strategic plans, and other actions that affect the performance of the firm. The board plays an
important role since on the one hand it controls the actions of management and on the other it
advises management regarding the strategies to be adopted. In this study, 100 announcements
for the appointment to the board of directors of 100 Italian listed public companies during the
period 2012-2014 are investigated. The results show a positive reaction within 20 days around
the announcement date of the appointments. In four of the six study periods, Cumulative
Abnormal Returns (CARs) are positive and statistically significant. The difference between the
sub-sample composed of a higher presence of women, non-executives, and independents on the
Board of Directors does not seem to perform better than the one composed of a smaller presence
of women, non-executives, and independents.
JEL codes: G14; G30; G34
Keywords: boards of directors; corporate governance; agency theory; ownership structure;
event studies; firm performance
1. Introduction
During recent decades, the academic literature has devoted considerable attention to the
issue of corporate governance - ownership structure and board of directors - and its hypothetical
1 Corresponding Author. Department of Electrical and Information Engineering, University of Cassino and
Southern Lazio, Via G. Di Biasio 43, Cassino (FR), 03043, Italy. Phone +39 0776 2993481.

2
relationship with the performance of public enterprises, opening up a new field of research
known as “law and finance”. Studies of corporate governance have intensified as a result of the
numerous financial scandals that have taken place in the world (e.g., Enron, Lehman Brothers,
and World-Com in the US and Parmalat in Italy) and which prompted policymakers to intervene
in order to regulate more rigorously the exercise of corporate governance2.
However, even before the financial scandals and the laws and codes adopted in the
various countries around the globe to regulate corporate governance, the debate on the optimal
ownership structure, the centrality of the board and the opportunistic behavior of management-
arising from the relationship between principal and agent, had already been initiated, although
primarily in theoretical terms.
Berle and Means (1932) were the first to examine the ownership structures of firms and
in particular the problem of the separation of ownership and control, emphasizing the possible
divergence between the interests of owners (founders of the company) and those executives
managing the corporation’s.
Jensen and Meckling (1976) examined the agency costs caused by the possible
opportunistic behavior of managers whose utility function may diverge from the interests of the
ownership (stockholders). They could manage the resources in an inefficient manner in order
to maximize their own self interests.
Fama (1980), starting with the assumption that markets are fully efficient, emphasizes
the importance of managerial resources as a monitor of managers’ opportunistic behavior. If
there exists a managerial market in which skills are traded, it is in the manager’s best interest
2 The first act of regulation was adopted in the UK with the introduction of the Cadbury Act (1992), subsequently
revised by the Combined Code (2003). In 1999, the OECD published Principles of Corporate Governance, a
document subsequently revised in 2004. In 2002 the Sarbanes-Oxley Act was issued in the US. In Italy the first
code of conduct for listed companies dates back to 1999 (“Codice Preda”), subsequently revised in 2002, 2006 and lastly in 2010 a change was made on the subject of directors' remuneration. The last formal review is dated
July 2014. For a detailed analysis, please refer to Alvaro, S., Ciccaglioni, P., and Siciliano, G. (2013).
L’autodisciplina in materia di corporate governance. Quaderni giuridici. CONSOB – Commissione Nazionale per
le Società e la Borsa -.

3
not to depreciate his skills in order to avoid reducing his potential market compensation and
incentives. Thus, a manager who fails to maximize the firm’s economic value undergoes a
depreciation of his own value in the market of human resources.
Fama and Jensen (1983), however, point out that there is not necessarily a monotonically
decreasing relationship between agency costs and the share held by managers. With an increase
of the stake they own in the corporation, managers could help prevent their dismissal, since it
becomes difficult for other managers to take over.
Demsetz (1983) does not believe that there is an appropriate ownership structure for all
situations if the value of the firm’s assets is to be maximized. As Demsetz (1983, p. 386)
observes, “The ownership structure likely to maximize the value of the firm’s assets depends
on the technology of the tasks required of the firm’s labor force, on the desired scale of
operation and on the managerial ability of potential owners of the firm. No single ownership
structure is suitable for all situations if the value of the firm’s assets is to be maximized. In
particular, from the viewpoint of the owner(s), the optimal distribution of profits is 100 percent
to a single owner-manager only in special circumstances”.
Jensen (1986) believed that by reasoning in terms of free cash flows, the debt may limit
any opportunistic behavior, thus ensuring greater efficiency. He argued that excess cash
resources should be distributed to the shareholders and thereby removed from the discretion of
managers, who tend to reinvest them even in the absence of profitable investment opportunities.
Many authors (e.g., Morck et al., 1988; Demsetz and Villalonga, 2001; Earle et al.,2005;
Barontini and Caprio, 2006) have analyzed empirically the relationship between ownership
structure and firm performance, finding mixed results.
An equally large literature has developed on the relationship between boards of directors
and the performance of firms. In various studies, there has been an examination of the
relationship between board size and firm performance (Yermack, 1996; Coles et al., 2008) and

4
between the characteristics of the board (independent, executive, women directors, and so forth)
and firm performance (Hermalin and Weisbach, 1991; Agrawal and Knoeber, 1996; Baghat and
Bolton, 2008; Adams and Ferreira, 2009).
Yet another strand of literature has focused on the stock market reaction to the
appointment of the boards (e.g., Rosenstein and Wyatt, 1990; Adams, Gray and Nowland,
2011).
The goal of this study is to verify whether there is an abnormal reaction of the Italian
stock market to the announcements of the board of directors and whether abnormal returns
differ according to the characteristics of the board members.
2. Board of Directors: A Literature Review
In the relationship involving ownership structure and control of public corporations, a
crucial role may be played by the board of directors. The board of directors of a corporation,
among other things, should play a monitoring role on the possible opportunistic behavior of the
management of the firm (Fama and Jensen, 1983).
The board of directors performs multiple functions that concern, for example, the
replacement of managers, financial policies, the preparation of strategic plans, and other actions
that affect the performance of the company. The board plays an important role since on the one
hand it oversees and can redirect the actions of management and on the other it advises
management regarding the strategies to be adopted due to its wealth of knowledge (Fama and
Jensen, 1983).
Firms that aim to have a qualified board should prefer a board of directors who have
held multiple positions since they have thereby more experience (Perry and Peyer, 2005). Many
empirical studies have examined the relationship between firm performance, board size and the
characteristics of the board.

5
Hermalin and Weisbach (2003) emphasize the existence of an endogenous relationship
between the characteristics of the board, the actions of the board, and the firm's performance.
They analyzed the economic literature regarding ownership and board structure and how their
characteristics can affect firm performance. They mention the notorious surveys demonstrating
that there is a negative relationship between board size and company profitability and that both
board compensation and board size have a significant relationship with the primary board
decisions, such as a CEO replacement. Finally, Hermalin and Weisbach (2003, p. 20) suggest
that the board is “…an institution that has arisen endogenously in response to the agency
problem inherent in governing any organization”.
Agrawal and Knoeber (2013) point out that boards of directors have often been
measured on the basis of two characteristics: size and composition. Both theory and empirical
evidence have long debated the effectiveness of the optimal size of the board and therefore the
relationship between performance and board size. A more diverse board may, on the one hand,
be less advantageous because less cohesive and coordinated (Lipton and Lorsch, 1992),
whereas on the other it may be more effective as it brings together a greater breadth of
knowledge thanks to the diversity of gender and background components. The optimal board
size and composition is the one that can maximize the value of the firm by finding the right
trade-off between greater knowledge in decisions made and greater ability to make collective
decisions (Agrawal and Knoeber, 2013).
Jensen (1993) argues that a smaller board is more effective in carrying out monitoring
activities. He recommends that to be most effective a board must be composed of a maximum
of seven or eight members. On the same topic, Yermack (1996) empirically investigates the
relationship between board size and Tobin's Q and finds that the smallest boards have a positive
impact on performance. He analyzed 454 companies in the US between 1984 and 1991 and
noticed an inverse relationship between Tobin's Q and board size. An increase in board size

6
leads to higher costs and a reduction in value for the enterprise. The loss of value for the
company, which goes from six to twelve members, is the same as that which is estimated when
the board goes from twelve to twenty-four members. Both profitability and operational
efficiency decrease with the increase in board size. Moreover, companies that announce a
reduction in board size actually experience excess returns around the announcement date,
which is in contrast to what happens to firms that announce an increase in board size.
Raheja (2005) asserts that the structure of an optimal board is one that results from the
optimal trade-off between maximizing the incentives for insiders to disclose additional
information in their possession on the enterprise, minimizing costs for outsiders in design
verification and maximizing outsiders' ability to reject unprofitable investment projects.
Coles, Naveen and Naveen (2008), however, studied a sample of 8,165 observations
during the period 1992-2001 and observed that board size depends on the complexity of the
enterprise and that there is no standard size. Both large and small boards can be optimal for
firm value. Thus, the empirical evidence on the relationship between board size and
performance has produced mixed results.
Likewise, there are mixed results on the relationship between board characteristics and
firm performance. For example, Hermalin and Weisbach (1991) investigated the relationship
between the proportion of outsiders and Tobin's Q but could not find any relationship.
Hart (1995) doubts the effectiveness of the board in practice. Assuming that the board
is composed of executives, who are members of the management team and non-executives, who
are the outsiders, he finds it difficult for various reasons for them effectively to effectively fulfill
the role of monitoring. The executives should actually monitor themselves and the non-
executive may not be incentivized, since they have no significant financial interests in the firm
or because they are involved with other boards and therefore may have little time to take care
of the interests of the company.

7
Agrawal and Knoeber (1996) studied the relationship between insider ownership and
firm performance in a sample of American firms in 1987. In this study, seven variables of
governance are introduced, including board outsiders. They observed a negative and
statistically significant relationship between board outsiders and Tobin's Q.
Baghat and Black (2002) documented that firms with more independent members in the
board do not record better performance and that the increase in the numbers of independents on
the board is more common in enterprises with weak or poor performance records. Baghat and
Bolton (2008), however, by studying a sample of firms during the period 1990-2004, noticed a
negative relationship between board I\independence and operating performance as measured
by Return on Assets (ROA).
On the other hand, many researchers have investigated the relationship between board
characteristics and performance using the event-study methodology in order to measure the
stock market reaction to the announcement of changes in boards. The pioneering study in this
area is that of Rosenstein and Wyatt (1990), who analyzed 1,251 announcements during the
period 1981 to 1985 and observed that the appointment of an outsider in the board provides a
wealth of relevant knowledge and increases the value of the firm. They find a positive reaction
from the market, which translates into an increase in stock prices on average by about 0.2%
when the company appoints an additional outside director, especially if he/she comes from a
financial institution. Instead, on average there is no reaction if the additional member of the
board is an insider. Rosenstein and Wyatt (1990) hypothesize that the appointment of
independent directors may be interpreted as signaling a change in strategy by companies.
DeFond, Hann and Hu (2005) examined 850 new appointments for the 1993-2002
period of outsider directors with financial accounting experience, findings that the CARs are
positive during the three days around the announcement date only when the outsiders are
independent.

8
Perry and Peyer (2005), for the period 1994-1996, analyzed 349 announcements
regarding the appointment of new directors, with the result that the average cumulative
abnormal returns are negative but not statistically significant for those defined as “sending
firms” in which executives hold a lower share ownership and when the board of the sender
companies does not have a majority of independent directors. By contrast, however, the CARs
are not negative for the sender firms in which the executives hold two or more outside
directorships.
Farrell and Hersch (2005) examined 111 appointments of only women directors for the
US during the period 1990-1999 and found no significant reaction by the stock market. By
contrast, Kang, Ding and Charoenwong (2010) investigated the reaction of the stock market in
Singapore using a sample of 53 appointments of women directors made during the period 1994-
2004. Between the day of the announcement and the following one they observed positive and
statistically significant CAAR equal to 1.22%. Furthermore, Campbell and Minguez-Vera
(2010) also observed that cumulative abnormal returns are positive and significant, after
studying 47 appointments of women directors in Spain in the period 1989-2001. Interestingly,
Adams, Gray and Nowland (2011) did research on 1,126 appointments of outside directors
between 2004 and 2006 in Australia and the CARs are positive and statistically significant in
the three days around the announcement date. They divided the sample into two sub-samples
consisting of 67 announcements of women directors and 1,059 of men directors and noticed
that the announcement of outside women directors generates higher, always positive and
statistically significant CARs in all time frames observed, unlike what takes place with the
appointment of men.
An original and interesting work belongs to Koch, Fenili and Cebula (2011), who
researched the reaction of the security prices of Apple, Inc. stock shares during the period of
illness of Steve Jobs, founder and CEO of the company. The authors studied nine events during

9
the period 2004-2009 to test the stock market reaction of the Apple stock, since Steve Jobs was
one of the best-known CEOs in the world and “the mind” that had revived the company by
increasing its market capitalization from 2.4 billion to 210.1 billion dollars between 1997 and
2010. Many analysts and commentators attributed its growth to Steve Jobs and believed that
the company was dependent on its CEOs more than any other company. The impact of the
announcements on the price of the Apple securities is mixed and the results achieved do not
have a definite explanation. The authors reported almost always negative but never statistically
significant cumulative abnormal returns. The only event where there is a negative and
statistically significant CARs equal to -10.5% is the day when Steve Jobs took part in the
Worldwide Developers Conference and presented the new iPhone with more functions and in
the meantime Apple announced a new price strategy. The combination of events makes it
impossible to accurately determine which of the two –Steve Jobs' health or his announced new
business strategy - is the more significant event. Although they found negative abnormal
returns, the authors cannot attribute these results to a single event, and in particular it is not
clear which of the events take precedence over the other. Koch, Fenili and Cebula (2011)
conclude that Jobs’ health had an impact on the market capitalization of the company but that
this impact was not always negative and also not so strong as many believed.
More recently, however, Baghat and Bolton (2013) studied the impact of the Sarbanes-
Oxley Act on the relationship between corporate governance and performance during the period
1998-2007, on a sample of 13,000 firm-year observations, and found a negative relationship
between board independence and operating performance for the period 1998-2001 and a
positive and statistically significant relationship for the period 2003-2007. In addition, they also
tested the reaction of the market through market-adjusted cumulative abnormal returns and
discovered that during the three days around the announcement date the CARs were positive
(0.48%) for the companies that complied with the Sarbanes-Oxley Act and increased the
10
independent directors. This finding is consistent with the Renas and Cebula (2005) prediction
that public corporations shown to be visibly complying with the Sarbanes-Oxley Act would
reap benefits for their shareholders.
In Italy, the situation is arguably much more complex than in the U.S. Most companies
have a high ownership concentration and both the share of independents and women is lower
than in most other countries. The presence of women on boards is still marginal/minimal even
if the relative share of women board members has grown over the last ten years. Interestingly,
in 2011 Parliament passed a law which provides that from 2015 a third of the boards must be
composed of women.
Undoubtedly, Italy has accelerated the pace of its reforms in the realm of corporate
governance, starting from the Legislative Decree of 1998 (also known as Draghi Reform) and
then the Corporate Governance Code of 1999, including its 2011 and 2014 revision. The
Corporate Governance Code in its present form recommends the adoption of a set of best
practices regarding governance with the inclusion of the principle “comply or explain”.3
The numerous efforts made regarding regulation and the compliance with the Code of
almost all listed companies have not however eliminated the skepticism that is apparent in much
of the literature on the quality of Italian corporate governance and this may be due to the gap
between the level of compliance and what is stated in the report (Bianchi et al., 2011).
Bianco, Ciavarella and Signoretti (2011) investigated the gender composition of the
boards of directors of listed companies in Italy and reported that only 6.8% of the boards is
composed of women and that 55.6% of the companies, in which there is at least one woman,
operates in the Information Technology sector and high-tech industries. In addition, they
observed that in 47.3% of the companies in which at least one woman sits on the board there is
3 Please refer to the study by Alvaro, S., Ciccaglioni, P., and Siciliano, G. (2013). L’autodisciplina in
materia di corporate governance. Quaderni giuridici. CONSOB – Commissione Nazionale per le Società e la
Borsa -.

11
a family control model. The analysis did not suggest any relationship between the presence of
women in boards and Tobin's Q; however, it was found that the presence of women on boards
increases the number of board meetings, especially in companies that have a non-family
ownership.
Among the studies on the Italian context, the contributions of Barontini and Caprio
(2002), Belcredi and Rigamonti (2008) and Celenza, Manfredi and Rossi (2014) can be
highlighted. Barontini and Caprio (2002) examined the relationship between the composition,
the turnover of the board, and the performance of a sample of listed companies in Italy over the
period 1976-1996. The results show, for the sample of firms studied, that there is a positive and
statistically significant relationship between board size and firm size, while the relationship
between board size and ownership concentration is always statistically significant and negative,
much like the relationship between board turnover and firm performance.
Belcredi and Rigamonti (2008) analyzed the relationship between ownership structure,
board structure and performance of a large sample of Italian listed companies, finding that board
size is larger in bigger firms and when the parent company holds a smaller share of cash flow
rights. They also observed a strong relationship between the structure of the board and the
proprietary model as well as between ownership concentration and firm valuation.
In other words, family firms, or at least high ownership concentration firms, tend to compose
the board of directors “on a human scale”.
Celenza, Manfredi and Rossi (2014) researched the relationship between the ownership
structure, the board of directors, and the performance of a sample of listed companies in Italy
for the period 2002-2012. In addition to the performance measures widely used in the literature,
the authors also included the efficiency of intellectual capital as an additional variable. The
results obtained do not appear to be particularly significant. The relationship between
performance and the fraction of women directors alternates the signs and when it is positive it
12
is highly significant. Greater interest seems to be found in the statistically significant positive
relationship between the ROA and non-executive directors and between the ROA and the third
block-holder for two sub-periods out of four. The relationship between performance and board
size is almost always negative, but, with the exception of one sub-period, it is never statistically
significant.
3. Sample and Survey Methodology
The research sample in the present study consists of 100 announcements of boards of
directors made by 100 companies listed on the Italian stock market during the period 2012-
2014. Most of the announcements were made between April and June of each year. The
information on the announcements was acquired from various sources and subsequently the
minutes of the Board of Directors of each company in the sample were checked for verification.
For the construction of the selected sample, the following criteria were adopted:
a) The availability of the announcement date4 of the appointment of the Board and the
possibility to observe the data found on the corporate minutes;
b) The availability of data on the composition of the board, namely: size of the board,
the number of independents on the board, the number of executives on the board,
the number of non-executives on the board, the number of women on the board, and
the number of men on the board;
c) The availability of the time series of stock prices for each company included in the
sample whose data were acquired by Datastream;
4 To better identify the announcement, different sources of information were chosen and in particular "Il
Sole 24 Ore" - the leading Italian financial newspaper - the website of Borsa Italiana Spa, the sites of the individual
companies, and the minutes of the boards of directors. The date of the announcement in these types of
investigations is not so easy to identify because very often, even before the appointment, there are "rumors" about
the possible appointed candidates. This aspect is very common especially in companies where the Ministry of
Economy and Finance is a shareholder and the appointment of board members is politically discretionary.
Typically in these companies the first names that appear in the press are the ones that are likely to be “burned”
because the final choice falls on other names.
13
d) Sector diversification (industry, finance, services, and so forth) for listed companies.
The final sample investigated is fairly equally distributed with respect to the number of
announcements per year: 37 (2012), 29 (2013) and 34 (2014). Almost all of the announcements
(91 out of 100) take place within the months of April, May, and June of each year. Only nine
cases out of the 100 the announcement falls outside that period. Regarding the sectoral
distribution of the sampled companies, they belong to about 70 different micro-sectors.
Lastly, in the construction of the sample there was an attempt to carefully check whether
there were any other kinds of announcements on the same date (e.g., dividends, changes in
business strategy, M&As, and so forth) for the same company in order to avoid the
“contamination” of the announcement. If on the same date there is more than one announcement
relating to different events, it becomes difficult to separate which event prevails over the other;
therefore, those companies that had several announcements were removed from the final
sample.
The abnormal returns were estimated using the methodology proposed by Fama et al.
(1969) and Warner, Watts and Wruck (1988)5:
titmiiitrαR
,, (1)
where i
α and i
β are the estimated parameters for each stock, ti,ε the random term or residual
of the estimate, )(Plog)(PlogR1ti,eiteit , and where
itP , e, and 1ti,
P indicate the daily
closing prices adjusted to time t and time t-1, and tm,
r the return of the benchmark portfolio,
respectively, which in the present work was assumed to be equal to the FTSE MIB6.
5 The Market Model has been used in several works of this type (e.g. DeFond, Hann and Hu, 2005; Perry
and Peyer, 2005; Kang, Ding and Charoenwong, 2010; Koch, Fenili and Cebula, 2011; Baghat and Bolton, 2013). 6 The FTSE MIB is a value-weighted index and is the main reference index for the Italian equity market.
This index consists of stocks of primary liquidity and dimension belonging to different sectors of the Italian stock
market.

14
The values of i
α and i
β were estimated using the time window (-250, -11), including
240 observations (Brown and Warner, 1985). The choice of a longer time horizon is more
accurate and reduces the risk of biased estimates of the parameters i
α andi
β , which were both
assumed to be stable over time. The hypothetical instability of the coefficients is a real risk
especially in equity markets that are still undersized.
Moreover, the decision to estimate the parameters by considering the window that
ranges from 200 to 250 days before the announcement date is in line with the approach used in
similar studies (e.g., Warner, Watts and Wruck, 1988; DeFond, Hann and Hu, 2005; and Perry
and Peyer, 2005).
The Abnormal Returns (ARs) were calculated as the difference between the expected returns
and the actual values for t (-10, +10):
)(mtiiititrRAR (2)
from which it is possible to aggregate the individual AR values using the following formula:
N
i
itt ARN
AR1
1 (3)
and then the CAR:
ititit ARCARCAR 1 (4)
For the statistical significance of the results, the method suggested by Brown and
Warner (1985)7 with the relative standardization of the CARs was adopted, considering six
different time windows that contain both the event and the pre- and post-event:(-10, 0); (0,5);
(-5, 5); (0, 10); (-10, 10); (-1, 1).
7 Brown and Warner (1980 and 1985) suggest calculating the t-test as the ratio between the average AR
and the relative standard deviation of the estimation period that is earlier than the verification period in order to
avoid increases in variance that may occur around the announcement period.

15
The announcement of the board could be either good news, bad news, or neutral news;
therefore, the market reaction cannot be known a priori. Compared to other studies, in this
paper the entire board is examined as a block, without any distinction based on the elements
that compose that block.
In other words, it is not possible to discriminate the reaction according to the variables
considered in the event (size, number of independents, number of executives, number of non-
executives, number of women on the board, and number of men on the board). However, to
avoid this problem, a second analysis can be used in order to understand which of the variables
considered in the announcement are the most significant to the market valuation. In particular,
the entire sample was reorganized according to the individual variables and then divided into
two “portfolios” in decreasing order, and, subsequently, a test on the average for each variable
was undertaken.
For example, the CAR is divided into two sub-samples that include 50 companies
ranked on the basis of the variable board size and the difference between the CARs of firms
with a larger board and the CARs of companies with a smaller board size is tested in order to
measure whether the difference is statistically significant, and so on for the other variables.
In this study, the following hypotheses are formulated:
H1. The announcement of the board is news that produces a reaction by the market,
which can be either positive or negative.
In accordance with the reasoning given by Lipton and Lorsch (1992) and Jensen (1993)
and with the empirical evidence of Yermack (1996), the second hypothesis is formulated:
H2. The difference between the CAR of firms with a larger board and the CAR of firms
with a smaller board is negative and statistically significant, such that:
0S_BS
CARL_BS
CAR .

16
Kang, Ding and Charoenwong (2010), Campbell and Minguez-Vera (2010) and Adams,
Gray and Nowland (2011) observed positive and statistically significant cumulative abnormal
returns in three different countries (Singapore, Spain, and Australia) if women directors are
appointed. Bianco, Ciavarella and Signoretti (2011), however, found no such relationship
between the presence of women on the boards and Tobin's Q, but observed that the presence of
women increases board meetings.
In accordance with the results present in the literature and with the new legislation which
came into effect in Italy regarding the compulsory presence of women on the boards, since the
diversity of gender and profession is an indicator of the enhanced effectiveness of boards, the
third hypothesis is formulated:
H3. The difference between the CAR of companies with a board comprised of a larger
relative representation women than those of companies with a board composed of a smaller
relative representations of women is positive and statistically significant:
0L_WoB
CARH_WoB
CAR .
Agency theory suggests that non-executive directors provide greater control and
monitoring on executives and help to realign the interests of managers with those of
shareholders (Fama and Jensen, 1983). International best practices and the Corporate
Governance Code in Italy emphasize the usefulness of non-executives both in relation to their
professionalism and to their propensity to realign the divergences between executives and the
ownership/shareholders. In other countries, non-executive directors are treated as outsiders
because they generally have no dealings with the company and can effectively play the role of
“controllers” of the actions of the executives. In Italian family businesses, executive positions
are held mostly by family members (Belcredi and Rigamonti, 2008). The results of the
international literature on the relationship between the number of outsiders (non-executive) and

17
firm performance appear to be mixed for example, Agrawal and Knoeber (1996) and Yermack
(1996) found negative results.
Following the tenets of agency theory and the recommendations of the Corporate
Governance Code, in this study the following two additional hypotheses are formulated:
H4. The difference between the CAR of companies with a board composed of a greater
number of executives and those of companies with a board made up of a smaller number is
negative and statistically significant: 0L_EX
CARH_EX
CAR .
H5. The difference between the CAR of companies with a board composed of a greater
number of non-executives and those of companies with a board made up of a smaller number
is positive and statistically significant: 0L_NEX
CARH_NEX
CAR .
Rosenstein and Wyatt (1990) assert that the appointment of an additional outsider to the
board increases the value of the firm since it could signal a change in strategy. DeFond, Hann
and Hu (2005) found a positive CAR if the outsiders are independent and Adams, Gray and
Nowland (2011) found positive abnormal returns if the outsiders are appointed. Baghat and
Bolton (2013) observed that during the three days around the announcement date the CAR are
positive (0.48%) for companies that comply with the Sarbanes-Oxley Act and increase the
independent directors.
Consistent with the results of previous studies and with the Codes adopted in various
countries, including Italy, where it is believed that independents express an “independent and
unbiased judgment”, thus improving the action of control and monitoring, the sixth and final
hypothesis is formulated:
H6. The difference between the CAR of companies with a board composed of several
independent members and those of companies with a board composed of a smaller number of
independents is positive and statistically significant: 0L_IND
CARH_IND
CAR .
18
4. Results and Discussion
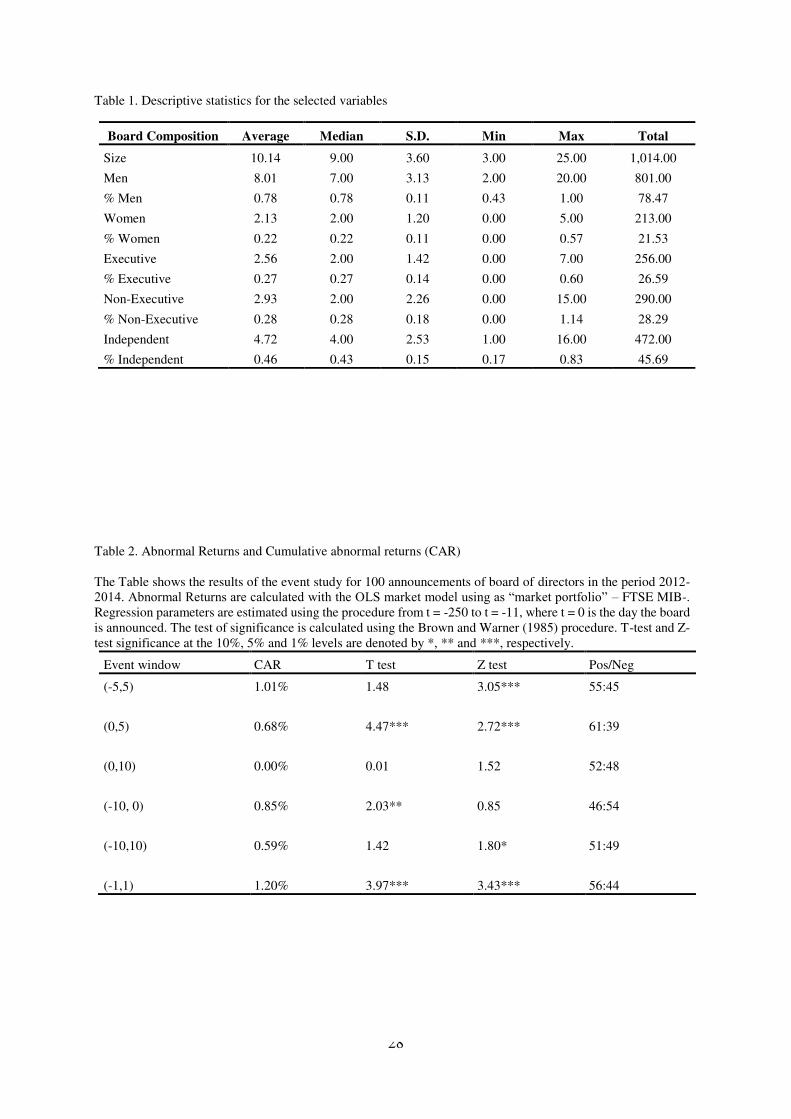
Table 1 shows the descriptive statistics of the observed variables. The total number of
members of the board is 1,014 during the period examined, with 801 being men and 213 being
women. The size of the boards varies from a minimum of 3 to a maximum of 25 members. The
average number of board members is 10.14 (the median is 9.00). The men who sit on the boards,
as expected, clearly outnumber the women: 78% of the members of the boards are men
compared to 22% being women.
The data on board size are consistent with the total number of listed companies in Italy.
Indeed, the Consob report (2013) shows that the average number of components/board
members is 9.9 and the boards range from 2 to 25 members in size.
Please insert table 1 about here
The number of independents varies from 1 to 16 members with a mean value equal to
4.72 (the median is 4.00). In addition, 46% of the components of the sample is made up of
independents and the total is 472 members. In this case as well, the data are similar to the
entirety of listed companies in Italy, where there is an average of 4.5 independents with a
relative weight of 43.9% (Consob, 2013).
The number of non-executives outnumbers the executives. As expected for a country
with a high ownership concentration, the power is concentrated in the hands of the company's
major shareholders or in the hands of “trusted people” designated by them. However, in the
sample examined there are 256 executives as opposed to 290 non-executives and the median
value is the same for both (2.00).
Table 2 contains data on the cumulative abnormal returns (CAR) for the six time
windows observed. The cumulative abnormal returns are always positive and statistically
significant in 4 windows out of 6.
Please table 2 about here
19
The greatest significance is observed, however, within 3 days around the announcement
date (1.20%) and within 11 days around the date (1.01%). Within 5 days after the announcement
the CAR is equal to 0.68%, and during the whole period of 20 days around (ten days before and
ten days following) the announcement date, the CAR is 0.59%. At the date of announcement
the average abnormal returns are also positive but not statistically significant (0.27%).
From the standpoint of informational efficiency, however, it seems that the market
anticipates the reaction compared to the announcement date (Figure 1).
Please insert figure 1 about here
Two days before the date of announcement of the boards, the market response is positive
and the trend continues up until the following two days. The CAR maintains the trend for the
whole period of 20 days around the announcement date. An analysis of the data clearly shows
that the market reacts positively to the announcement of the boards, which could be consistent
with the signaling hypothesis. The announcement of a new board might imply a company's
change of strategy and decision inconsistency as compared to the past. Furthermore, it becomes
difficult to establish how the individual members of the board can affect the reaction of stock
prices, although it is appropriate to point out that 472 out of 1,014 appointments are independent
(46.54%) and 28.59% are non-executive members. The results could therefore be consistent
with the line of reasoning given by Rosenstein and Wyatt (1990) on the hypothesis of a
signaling market.
Therefore, hypothesis 1 can be accepted since there is a reaction by investors. It can be
excluded that the market reacts differently in the three years examined because there were no
apparent statistically significant differences from the AAR of the three years. The test on the
means (not shown here) does not report any significant difference between 2012 and 2013, 2012
and 2014 and between 2013 and 2014.

20
Table 3 illustrates the results of the second analysis, which seeks to test hypotheses H2-
H6.
The CARs of firms that have a larger board are negative whereas the CARs of
companies that appoint a smaller board (≤ 9) are positive and equal to 1.32%.
Please insert table 3 about here
The test between the means of the two sub-samples does not report any statistically
significant difference/discrepancy. The market reacts positively when fewer people sit on the
board, in line with the arguments of Jensen (1993) and with the empirical evidence of Yermack
(1996). Therefore, hypothesis 2 cannot be rejected.
Companies that appoint more men on the board obtain positive CAR (3.20%) as
compared to those companies in which the male presence is lower (-2.02%), and this difference
is statistically significant at the 5% level (rejects the null hypothesis at the 95% confidnece
level).
More women on the board do not increase company values, but on the contrary seem to
reduce them. The sub-sample made up of more women generates a negative performance
(-2.20%), and the one in which there are fewer women achieves a particularly positive
performance (3.40%). The difference between the means is statistically significant at the 5%
level.
In contrast to the results obtained by Kang, Ding and Charoenwong (2010), Campbell
and Minguez-Vera (2010), and Adams, Gray and Nowland (2011) and consistent with the
reasoning given by Bianco, Ciavarella and Signoretti (2011), this study does not show any
substantive improvement in terms of market response when more women sit on the boards. The
balance between the two genders is not rewarded by the market. Hypothesis 3 must therefore
be rejected.
21
The executives do not seem to guarantee better performance as compared with non-
executives and as compared to the sub-sample in whose boards there are fewer executives. The
sub-sample made up of the highest number of executives seems to record a negative CAR of -
2.00%, while the CAR of the portfolio consisting of fewer executives records positive CAR
equal to +3.18% and the difference between the two means is statistically significant at beyond
the 5% level. The results obtained on the executives, although contradictory, seem to be
consistent with the assumptions of the agency theory. On the one hand, it emerges that the
portfolio made up of more executives performs worse whereas on the other hand it emerges
that the portfolio consisting of a smaller number of non-executives records higher CAR,
although the difference is not statistically significant. Therefore, with regard to the results
achieved on the non-executives, they might be more consistent with the arguments of Knoeber
and Agrawal (1996) and Yermack (1996), who find a negative relationship between the number
of outsiders (non-executive) and firm performance. Consequently, Hypothesis 4 can be
accepted, but H5 must be rejected.
With regard to the sixth and final hypothesis, it should be noted that the portfolio with
a higher number of independents records a negative CAR equal to -1.05%, whereas the sub-
sample corresponding to fewer independents obtains positive CAR (2.23%), although the
difference is not statistically significant at the 5% level. The results of this study would seem
to be in contradiction to those of Rosenstein and Wyatt (1990), DeFond, Hann and Hu (2005),
Adams, Gray and Nowland (2011), and Baghat and Bolton (2013) and closer to the positions
of Agrawal and Knoeber (1996) and Yermack (1996). In any case, Hypothesis 6 must be
rejected.
5. Conclusion

22
The goal of this paper is to analyze a sample of 100 announcements regarding the
appointment of the boards of directors of listed companies in Italy during the period 2012-2014.
The empirical analysis is divided into two stages. In the first, all the announcements are
analyzed using the event study methodology and considering six time windows around the
announcement date. The results obtained lead to the conclusion that the market reacts positively
to the announcement of the boards and therefore they are likely to be consistent with the
signaling hypothesis.
In the second stage, however, the sample has been divided into two sub-samples of 50
announcements each, constructed after having reordered the variables examined in decreasing
order and also after having conducted a test between the means of the CAR. The results reported
in this second step of the analysis lead to the conclusion that the stock market does not react
positively when more women sit on the board and that the presence of men guarantees higher
CAR. Similarly, when more executives sit on the board, the market reacts negatively, just as it
reacts negatively when the boards are occupied by a greater number of independents. Lastly,
the non-executives do not seem to guarantee the desired effect. When the number of non-
executives on the board is higher, the CARs are lower than when fewer non-executive members
sit on the board.
The results obtained seem to be consistent with the signaling market hypothesis.
However, they suggest the need for further studies in order to verify the extent to which women,
independents, and non-executives do not (or do) truly represent a significant element for the
board and create implications for the value of the firm.
References

23
Adams, R., and Ferreira D. (2009). Women in the boardroom and their impact on
governance and performance. Journal of Financial Economics, 94 (2), pp. 291-309.
Adams, R., Gray, S., and Nowland, J. (2011). Does Gender Matter in the Boardroom?
Evidence from the Market Reaction to Mandatory New Director Announcement. Available at:
http://papers.ssrn.com/sol3/papers.cfm?abstract_id=1953152.
Agrawal, A., and Knoeber, C.R. (2013). Corporate Governance and Firm Performance,
in Managerial Economics. The Oxford Handbook Eds. (Edited by Christopher R. Thomas and
William F. Shughart II), pp. 491-509.
Agrawal, A., and Knoeber, C.R. (1996). Firm performance and Mechanism to Control
Agency Problems between Managers and Shareholders. Journal of Financial and Quantitative
Analysis, 31 (3), pp. 377-397.
Alvaro, S., Ciccaglioni, P., and Siciliano, G. (2013). L’autodisciplina in materia di
corporate governance. Quaderni giuridici. CONSOB – Commissione Nazionale per le Società
e la Borsa -. Available at:
www.consob.it/documenti/Pubblicazioni/Quaderni_giuridici/qg2.pdf.
Barontini, R., and Caprio, L. (2006). The effect of family control on firm value and
performance: Evidence from continental Europe. European Financial management, 12 (5), pp.
689-723.
Barontini, R., and Caprio, L. (2002). Il consiglio di amministrazione, la rotazione degli
amministratori e la performance dell’impresa: l’esperienza italiana in una prospettiva
comparata. Quaderni di Finanza. Consob. Available at:
www.consob.it/documenti/quaderni/qdf51.pdf
Belcredi, M., and Rigamonti, S. (2008). Ownership and board structure in Italy (1978-
2003). Working paper. Available at:
http://www.efmaefm.org/0EFMAMEETINGS/EFMA%20ANNUAL%20MEETINGS/2008-
24
athens/Rigamonti.pdf.
Berle, A.A., and Means, G. C. (1932) The modern corporation and private property.
New York: Macmillan Publishing Co.
Bhagat, S., and Bolton, B. (2013). Director Ownership, Governance, and Performance.
Journal of Financial and Quantitative Analysis, 48 (1), pp. 105-135.
Bhagat, S., and Bolton, B. (2008). Corporate Governance and Firm Performance.
Journal of Corporate Finance, 14, pp. 257-273.
Bhagat, S., and Black, B. (2002). The non-correlation between board independence and
long term firm performance. Journal of Corporation Law, 27, pp. 231–274.
Bianchi, M., Ciavarella, A., Novembre, V., and Signoretti, R. (2011). Comply or
Explain: Investor Protection Through the Italian Corporate Governance Code. Journal of
Applied Corporate Finance, 23 (1), pp. 107-121.
Bianco, M., Ciavarella, A., and Signoretti, R. (2011). Women on boards in
Italy.Quaderni di Finanza.Commissione Nazionale per le Società e la Borsa. Available at:
www.consob.it/documenti/quaderni/qdf70.pdf
Brown, S., and Warner, J. (1985). Using Daily Stock Returns: The Case of Event
Studies. Journal of Financial Economics, 14, pp. 3-31.
Brown S., and Warner, J. (1980). Measuring Security Price Performance. Journal of
Financial Economics, 8 (3), pp. 205-258.
Campbell, K., and Minguez-Vera, A. (2010). Female board appointments and firm
valuation: short and long-term effects. Journal of Management and Governance, 14 (1), pp.
37-59.
Celenza, D., Manfredi, S., and Rossi, F. (2014). How much do Intellectual Capital,
Ownership Structure and the Board of Directors affect the Performance of Italian listed

25
companies? Proceeding 9thInternational Forum on Knowledge Asset Dynamics (IFKAD 2014),
11-13 June 2014, Matera (Italy), pp. 3431-3460.
Coles, J.L., Naveen, D.D., and Naveen, L. (2008). Boards: Does one size fit all? Journal
of Financial Economics, 87, pp. 329-356.
Commissione Nazionale per le Società e la Borsa. (2013). Report on corporate
governance of Italian listed companies. Available at:
http://www.consob.it/mainen/consob/publications/rcg/index.html.
Corporate Governance Committee. (2014). Corporate Governance Code. Borsa
Italiana. Available at: http://www.borsaitaliana.it/comitato-corporate-
governance/codice/2014cleaneng.en.pdf.
DeFond, M.L., Hann, R.N., and Hu, X. (2005). Does the market value financial
expertise on audit committees of boards of directors? Journal of Accounting Research 43, pp.
153–193.
Demsetz, H. (1983). The structure of ownership and the theory of the firm. Journal of
Law and Economics, 26 (2), pp. 375-390.
Demsetz, H., and Villalonga, B. (2001). Ownership structure and corporate
performance. Journal of Corporate Finance, 7 (3), pp. 209-233.
Earle, J.S., Kucsera, C., and Telegdy, A. (2005). Ownership concentration and corporate
performance on the budapest stock exchange: Do too many cooks spoil the goulash?. Corporate
Governance: An International Review, 13 (2), pp. 254-264.
Fama, E.F. (1980). Agency problems and the theory of the firm. Journal of Political
Economy, 88 (2), pp. 288-307.
Fama, E. F., and Jensen, M. C. (1983). Separation of ownership and control. Journal of
Law and Economics, 26 (2), pp. 301-325.

26
Fama, E., Fisher, L., Jensen, M., and Roll, R. (1969). The adjustment of stock prices to
new information. International Economic Review, 10(1), pp. 1–21.
Farrell, K., and Hersch, P. (2005). Addition to corporate boards: the effect of gender.
Journal of Corporate Finance, 11, pp. 85-106.
Hart, O. (1995). Corporate Governance: Some Theory and Implications. The Economic
Journal, 105 (430), pp. 678-689.
Hermalin, B.E., and Weisbach, M.S. (2003). Board of directors as an endogenously
determined institution: a survey of the economic literature. Economic Policy Review, April, pp.
7-26.
Hermalin, B.E., and Weisbach, M.S. (1991). The Effects of Board Composition and
Direct Incentives on Firm Performance. Financial Management, 20 (4), pp. 101–112.
Jensen, M.C. (1993). The Modern Industrial Revolution, Exit, and the Failure of Internal
Control Systems. The Journal of Finance, 48 (3), pp. 831-880.
Jensen, M.C. (1986). Agency costs of free cash flow, corporate finance and takeovers.
American Economic Review, 76 (2), pp. 323-329.
Jensen, M.C., and Meckling, W.H. (1976). Theory of the firm: Managerial behavior,
agency costs, and ownership structure. Journal of Financial Economics, 3 (4), pp. 305-360.
Kang, E., Ding, D. K., and Charoenwong, C. (2010). Investor Reaction to Women
Directors. Journal of Business Research, 63 (8), pp. 888-894.
Koch, J.V., Fenili, R.N., and Cebula, R.J. (2011). Do Investors Care if Steve Jobs is
Healthy? Atlantic Economic Journal, 39 (1), pp. 59-70.
Lipton, M., and Lorsch, J.W. (1992). A modest proposal for impoved corporate
governance. Business Lawyer, 48, pp. 59-77.
Morck, R., Shleifer, A., and Vishny, R. W. (1988). Management ownership and market
valuation: An empirical analysis. Journal of Financial Economics, 20 (1-2), pp. 293-315.

27
Perry, T., and Peyer, U. (2005). Board Seat Accumulation by Executives: A
Shareholder’s Perspective. The Journal of Finance, 60 (4), pp. 2083-2123.
Raheja, C.G. (2005). Determinants of Board Size and Composition: A Theory of
Corporate Boards. Journal of Financial and Quantitative Analysis, 40 (2), pp. 283-306.
Renas, S.M., and Cebula, R.J. (2005). Enron, herding, and the deterrent effect of
disclosure of improprieties. The American Journal of Economics and Sociology, 64 (3), pp.
743-756.
Rosenstein, S., and Wyatt, J.G. (1990). Outside directors, board independence, and
shareholder wealth. Journal of Financial Economics, 26 (2), pp. 175-191.
Warner, J.B., Watts, R.L., and Wruck, K.H. (1988). Stock Prices and Top Management
Changes. Journal of Financial Economics, 20(3), pp. 461-492.
Yermack, D. (1996). Higher market valuation of companies with a small board of
directors. Journal of Financial Economics, 40 (2), pp. 185-211.
28
Table 1. Descriptive statistics for the selected variables
Board Composition Average Median S.D. Min Max Total
Size 10.14 9.00 3.60 3.00 25.00 1,014.00
Men 8.01 7.00 3.13 2.00 20.00 801.00
% Men 0.78 0.78 0.11 0.43 1.00 78.47
Women 2.13 2.00 1.20 0.00 5.00 213.00
% Women 0.22 0.22 0.11 0.00 0.57 21.53
Executive 2.56 2.00 1.42 0.00 7.00 256.00
% Executive 0.27 0.27 0.14 0.00 0.60 26.59
Non-Executive 2.93 2.00 2.26 0.00 15.00 290.00
% Non-Executive 0.28 0.28 0.18 0.00 1.14 28.29
Independent 4.72 4.00 2.53 1.00 16.00 472.00
% Independent 0.46 0.43 0.15 0.17 0.83 45.69
Table 2. Abnormal Returns and Cumulative abnormal returns (CAR)
The Table shows the results of the event study for 100 announcements of board of directors in the period 2012-
2014. Abnormal Returns are calculated with the OLS market model using as “market portfolio” – FTSE MIB-.
Regression parameters are estimated using the procedure from t = -250 to t = -11, where t = 0 is the day the board
is announced. The test of significance is calculated using the Brown and Warner (1985) procedure. T-test and Z-
test significance at the 10%, 5% and 1% levels are denoted by *, ** and ***, respectively.
Event window CAR T test Z test Pos/Neg
(-5,5) 1.01% 1.48 3.05*** 55:45
(0,5) 0.68% 4.47*** 2.72*** 61:39
(0,10) 0.00% 0.01 1.52 52:48
(-10, 0) 0.85% 2.03** 0.85 46:54
(-10,10) 0.59% 1.42 1.80* 51:49
(-1,1) 1.20% 3.97*** 3.43*** 56:44

29
Table 3. Cumulative abnormal returns (CAR) for portfolio and variables
Panel A (1) (2) (3) (4)
Board size Biggest (≥ 9) Smaller (≤ 9) Difference T test
CAR -0.14 1.32 -1.45 0.58
Panel B (1) (2) (3) (4)
High Low Difference T test
% Men
CAR 3.20 -2.02 5.22** 2.11
% Women on
board
CAR -2.20 3.40 -5.62** 2.28
% Executive
CAR -2.00 3.18 -5.17** 2.09
% Non executive
CAR 0.41 0.77 -0.37 0.15
% Independent
CAR -1.05 2.23 -3.28 1.31

30
Figure 1. Trend AAR and CAR in the window t -10, 10
-0.01
-0.01
0.00
0.01
0.01
0.02
0.02
-10 -9 -8 -7 -6 -5 -4 -3 -2 -1 0 1 2 3 4 5 6 7 8 9 10
AAR CAR