stochastic modeling of a musical …ismir2011.ismir.net/papers/ps4-10.pdf · 12th international...
TRANSCRIPT

12th International Society for Music Information Retrieval Conference (ISMIR 2011)
STOCHASTIC MODELING OF A MUSICAL PERFORMANCE WITHEXPRESSIVE REPRESENTATIONS FROM THE MUSICAL SCORE
Kenta Okumura, Shinji Sako and Tadashi KitamuraNagoya Institute of Technology, Japan
{k09,sako,kitamura}@mmsp.nitech.ac.jp
ABSTRACT
This paper presents a method for describing the characteris-tics of human musical performance. We consider the prob-lem of building models that express the ways in which devi-ations from a strict interpretations of the score occurs in theperformance, and that cluster these deviations automatically.The clustering process is performed using expressive rep-resentations unambiguously notated on the musical score,without any arbitrariness by the human observer. The resultof clustering is obtained as hierarchical tree structures foreach deviational factor that occurred during the operation ofthe instrument. This structure represents an approximationof the performer’s interpretation with information notatedon the score they used during the performance.
This model represents the conditions that generate thedifference in the fluctuation of performance expression andthe amounts of deviational factors directly from the dataof real performance. Through validations of applying themethod to the data measured from real performances, weshow that the use of information regarding expressive repre-sentation on the musical score enables the efficient estima-tion of generative-model for the musical performance.
1. INTRODUCTIONThe idea of having a computer perform like human musicianarose more than two decades ago. There have been variousproposals for making a computer understand the rich expres-sion of a performance [2]. Historically, the mainstream ap-proach to capturing the nuances of performance has changedfrom rule-based methods to learning-based methods. Onemodel that shows the effectiveness of the latter approachis represented by the generative model. Also, there is an-other motivation for this kind of research, that is, learningwhat makes a performance humanlike; however, there arefew initiatives based on such questions. One approach to
Permission to make digital or hard copies of all or part of this work for
personal or classroom use is granted without fee provided that copies are
not made or distributed for profit or commercial advantage and that copies
bear this notice and the full citation on the first page.c© 2011 International Society for Music Information Retrieval.
analyze performance statistically, by capturing the trends ofthe performance in the acoustic features, has already beenattempted [3, 8, 10, 11]. These studies are admirable in thattheir verification used a large quantity of expressive perfor-mance; we also essentially agree that it is desirable to per-form the verification with such an approach. However, itis difficult to observe the expressiveness of a performancefrom diverse perspectives by these approaches as expres-siveness consists of various factors. We adopt a MIDI-basedapproach to simplify such problems, and consider a varietyof expressive representations notated on the musical score asthe factor that describes how the expressive performance hasbeen generated. In addition, our method to capture the per-formance is based on the idea of a generative model. There-fore, our method has the potential to generate an unseen per-formance, not merely to analyze an already known one.
In the following sections, we propose a method for theautomatic analysis of the characteristics of a performancebased on various combinations of expressive representations.Also, we observe what kinds of representation constitute thehuman quality of the performance by apply them to the datameasured from the real performance to evaluate the validityof this method.
2. METHODIn this section, we propose a method for the automatic clas-sification of trends of the deviations in performance, so as todescribe the dependencies between score and performance.On the keyboard instrument, a performer’s key operation,in terms of timing and intensity, causes deviations from thescore for the purpose of artistic expression. We believe thatthe performer’s individuality would occur in the differencesin the trend of deviations. The occurrence tendencies ofthese deviations in the performance are not constant, as theyare affected by various factors such as the differences in mu-sical compositions. To capture the characteristics of indi-viduals who performed only in terms of deviation from theaverage trend in the overall performance is difficult; there-fore, it is necessary to handle deviations in each key action,specifically and in general. Using this awareness, we havebeen studying a method that regards the trends in the de-viation as a stochastic model and acquire these trends vialearning and instructions on the score.
531

Poster Session 4
artistic-deviations
extract amount ofdeviations for eachdeviational factor
scorereferred by
the performer
samplesmeasured from
the performance
-1/2 -1/4 just 1/4 1/2
onset
beat-1/2 -1/4 just 1/4 1/2
o!set
beat
0 0.5 1 1.5 2
gate time
ra o
0 0.5 1 1.5 2
dynamics
ra o0 0.5 1 1.5 2
tempo
ra o
frequency
Figure 1. Extraction of deviational factors
sco
re(M
usi
cXM
L)
melody,c,
16thNote,mezzoForte,
melody,f#,
16thNote,mezzoForte,polyphony,
b,8thNote,
mezzoForte,
polyphony,a,
8thNote,mezzoForte,
・ ・ ・ etc.・ ・ ・
・ ・ ・ ・ ・ ・ etc.
extract values for eachcontextual factor and add
them to deviational factors foreach note as a label to buildcontext-dependent models
Figure 2. Extraction of contextual factors
2.1 Context-dependent model
If the performance seems to be personalized, it is consideredthat the resultant personality is caused by biases in the trendsof performance. The trend of deviation is observed as a dis-tribution with some focus, according to deviations for eachnote extracted from each note o observed from the measuredperformance and the corresponding score (see Figure 1). Wecan think of the model as a Gaussian probability densityfunction (PDF) so as to approximate the behavior of devi-ations; this model is able to cope with complex behaviorsaccording to the Gaussian mixture model (GMM) approach.The PDF N of the observation vector o is defined by
N (om|µm, σm)
=1√
(2π)DΠDd=1|σmd|
exp
(−1
2
D∑d=1
(od − µmd)2
σmd
),
(1)
where o is observed with D deviational factors, od is thedth dimension for observation vector o, m is the mixture in-dex of the M Gaussian component densities, µ is the meanvector, and σ is the diagonal covariance matrix.
However, the cause of the deviating behavior is not con-sidered in this model. The performance of musical instru-ments consists of playing the sequences of notes accordingto the score. Therefore, it is obvious that the qualities ofeach note have some musical significance. As a general ex-ample, we consider performing two notes with different rep-resentations in terms of dynamics. In this case, the amountof deviation between them may be differ not only in the dy-namics, but also in the timing, because of their expressiverepresentations. Also, the extent to which the performer de-viates from the average for the note with the representationis considered to be under the influence of some individual-ity. In the past, there were several studies that attempted toestimate the performers’ characteristics by referring to theamount of deviation in timing and dynamics [5–7]. How-ever, it is also necessary to consider what kind of representa-tion leads to such behavior, using some musical knowledgethat supersedes the mixture in the GMM.
Several factors complicate the process of occurrence. Wemake the following considerations to organize this subject:
• The performer obtains information from the musicalscore, and then creates his/her own interpretation us-ing that information, thus introducing deviations intothe performance.
• The trend of deviations occurring is also influenced byunintentional factors such as the performer’s physicallimitations.
We believe that the latter factor is not necessary, because it isconsidered likely based on relatively simple arguments, andthe progress of performance technology is a means to reducethe interference of factors, such as unintentional representa-tions. Additionally, factors (such as the former) influencethe occurrence of this deviation, which is considered signif-icant because it is intended to expand the range of expres-sion in accordance with technological progress. However,criteria tend to be abstract and difficult to qualify, even forthe performers themselves. Therefore, we do not directlyaddress the interpretation of the music itself. Instead, weassociate the trends in the deviation with the expressive rep-resentations, which affects the performer’s musical interpre-tation.
All the information used here is in the form of unambigu-ous values that are available in the score, such as pitch, notevalue, dynamics, and so on, because we want to eliminateany undefined properties throughout the process. There isalso the musical phrase to consider, which has some rela-tionship that holds among surrounding notes. We introducethem under the term ”context.” Models in which context isapplied are called ”context-dependent,” because they con-struct a kind of context that contributes to the interpretation.The parameters of the model are the same as the model men-tioned above; however, each model has its own combinationof contexts that is dealt with individually (see Figure 2). Thedescription of the behavior for each model can be simplifiedbecause it is defined by a number of combinations. There-fore, each model is trained using a single Gaussian compo-nent density, as shown in Equation (1) .
2.2 Tree-based clustering
The purpose of introducing context is to associate a per-former’s interpretation of the musical composition with thedeviations in the performance. A more detailed representa-tion of the information obtained from the score has to con-
532

12th International Society for Music Information Retrieval Conference (ISMIR 2011)
leaf S1 leaf S2 leaf S3 leaf S4 leaf S5 leaf S6 leaf S7 leaf S8
yes no
yes no yes no
yes no yes no yes no yes no
Is part ofcurrent note
melody?
Is notation ofcurrent note
slur?
Is octave ofcurrent note
lower than 4th?
Is syllable ofcurrent note
higher than V?
Is local pos. ofpreceding notelater than 50%?
Is type ofsucceeding notedotted quarter?
Is beam ofsucceeding note
continue?
S0
Sq+ Sq-
q
apply questions aboutcontext to the wholecontext-dependentmodels
share parameters in each leaf-node as model U, M=8
Figure 3. Example of a decision tree
sider a variety of contexts. However, with increasing use ofcontexts, the quantity of combinations of contexts increasesexponentially. This effect is detrimental to model training,because the training data for each model will be significantlyreduced. On the other hand, fragmented information has lit-tle meaning by itself. Therefore, it is necessary to classifya large number of combinations of contexts at a scale thatmatches the performer’s significant interpretation. How-ever, it is beyond human power to decide appropriate cri-teria for each case of classification. To address these issues,a method is necessary to reconstruct and decompose modelsefficiently, and to capture the varied expressive representa-tions obtained from the score. We use tree-based cluster-ing [4] to classify the context-dependent models.
Tree-based clustering divides all possible combinationsof context-dependent model into a countable number of clus-ters. As a result, a decision tree (a binary tree in whicha question is attached to each node) is obtained. In thismethod, each of the questions relates to the contextual fac-tors for the preceding, current, and succeeding note. Onetree is constructed for each deviational factor so as to clusterall of the corresponding behaviors of all context-dependentmodels. This is done because there are different trends ofbehavior for each deviational factor. All context-dependentmodels in the decision tree are divided into M nodes byclusters S1, · · · , SM , such that one model U(S1, · · · , SM )is defined for each leaf node. For example, the tree shown inFigure 3 will partition its behaviors into eight subsets withthe same number of leaf nodes. The questions and topologyof the tree are chosen so as to maximize the likelihood of thetraining data, given these tied behaviors, by estimating theparameters of a Gaussian PDF. Once these trees have beenconstructed, data with unseen contexts can be classified inany leaf node by tracing the questions in the tree.
Initially, all the context-dependent models to be clusteredare placed at the root node of the tree. The log likelihoodof the training data is calculated, supposing that all of themodels in that node are tied. Then, this node is divided intotwo by finding a question that divides the model in the par-ent node such that the log likelihood (maximally) increases.
The log likelihood L for node Sm is given by
L(Sm) = −12Γm(K + K log(2π)L log |Σm|), (2)
where Γm is the amount of data for training at node Sm.This process is then repeated by dividing the node in a waythat creates the maximum increase of log likelihood untilthe minimum description length (MDL) criterion [9] is met.This step is carried out to optimize the number of clusterswithout using external control parameters. In order to opti-mize the size of the tree, we use an algorithm with a prag-matic cost of computation. Here, let us assume that nodeSm of model U divides into two nodes, Smq+ and Smq−,by answering question q. Then, let ∆m(q) be the differencebetween the description length after division and before di-vision, that is l(U ′)− l(U). The description length of modelU ′ is represented by the following equation:
I(U ′) =M∑
m′=1, 6=m
12Γm′ (K + K log(2π) + log |Σm′ |)
+12Γmq+ (K + K log(2π) + log |Σmq+|)
+12Γmq− (K + K log(2π) + log |Σmq−|)
+ K (M + 1) log W + C, (3)
where W =∑M
m=1 Γm, and C is the length of code re-quired to choose a model (assumed here to be a constantvalue). The number of nodes in U ′ is M + 1, Γmq+ is theoccupancy count for node Smq+, and Γmq− is that of nodeSmq−. The difference ∆m(q) is given by
∆m(q) = l(U ′) − l(U)
=12(Γmq+ log |Σmq+| + Γmq− log |Σmq−|
− Γm log |Σm|) + K logM∑
m=1
Γm. (4)
When dividing models, we first determine the questionq′ that minimizes ∆0q′ and that is used at root node S0.If ∆0(q′) < 0, node S0 is divided into two nodes, Sq+
and Sq−, and the same procedure is repeated for each ofthese two nodes. This process of dividing nodes is car-ried out until there are no nodes remaining to be divided.If ∆0(q′) > 0, then no dividing is executed.
3. EXPERIMENTS
In this section, we apply the method mentioned above tothe real-measured performance data to verify its efficacy ofusing expressive representations from the musical score aspriori information. This information is applied to the issueof classifying the trends of the deviational behavior duringthe musical performance.
533
Poster Session 4
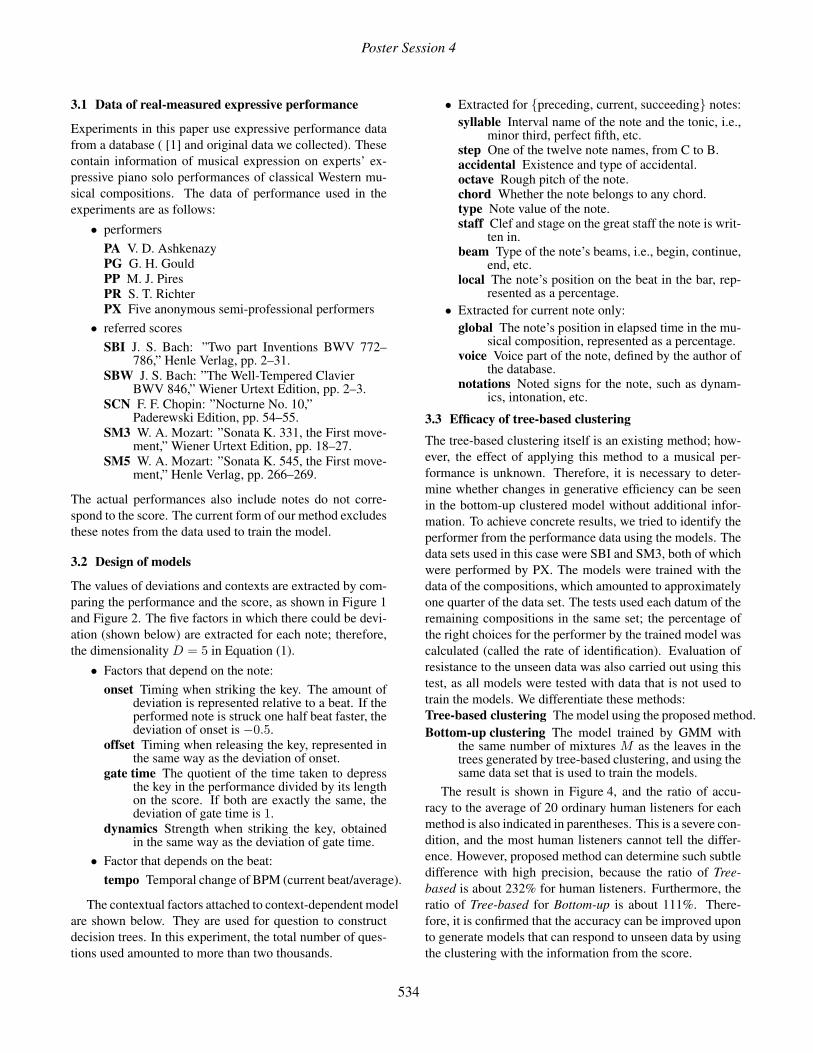
3.1 Data of real-measured expressive performance
Experiments in this paper use expressive performance datafrom a database ( [1] and original data we collected). Thesecontain information of musical expression on experts’ ex-pressive piano solo performances of classical Western mu-sical compositions. The data of performance used in theexperiments are as follows:
• performersPA V. D. AshkenazyPG G. H. GouldPP M. J. PiresPR S. T. RichterPX Five anonymous semi-professional performers
• referred scoresSBI J. S. Bach: ”Two part Inventions BWV 772–
786,” Henle Verlag, pp. 2–31.SBW J. S. Bach: ”The Well-Tempered Clavier
BWV 846,” Wiener Urtext Edition, pp. 2–3.SCN F. F. Chopin: ”Nocturne No. 10,”
Paderewski Edition, pp. 54–55.SM3 W. A. Mozart: ”Sonata K. 331, the First move-
ment,” Wiener Urtext Edition, pp. 18–27.SM5 W. A. Mozart: ”Sonata K. 545, the First move-
ment,” Henle Verlag, pp. 266–269.
The actual performances also include notes do not corre-spond to the score. The current form of our method excludesthese notes from the data used to train the model.
3.2 Design of models
The values of deviations and contexts are extracted by com-paring the performance and the score, as shown in Figure 1and Figure 2. The five factors in which there could be devi-ation (shown below) are extracted for each note; therefore,the dimensionality D = 5 in Equation (1).
• Factors that depend on the note:onset Timing when striking the key. The amount of
deviation is represented relative to a beat. If theperformed note is struck one half beat faster, thedeviation of onset is −0.5.
offset Timing when releasing the key, represented inthe same way as the deviation of onset.
gate time The quotient of the time taken to depressthe key in the performance divided by its lengthon the score. If both are exactly the same, thedeviation of gate time is 1.
dynamics Strength when striking the key, obtainedin the same way as the deviation of gate time.
• Factor that depends on the beat:tempo Temporal change of BPM (current beat/average).
The contextual factors attached to context-dependent modelare shown below. They are used for question to constructdecision trees. In this experiment, the total number of ques-tions used amounted to more than two thousands.
• Extracted for {preceding, current, succeeding} notes:syllable Interval name of the note and the tonic, i.e.,
minor third, perfect fifth, etc.step One of the twelve note names, from C to B.accidental Existence and type of accidental.octave Rough pitch of the note.chord Whether the note belongs to any chord.type Note value of the note.staff Clef and stage on the great staff the note is writ-
ten in.beam Type of the note’s beams, i.e., begin, continue,
end, etc.local The note’s position on the beat in the bar, rep-
resented as a percentage.• Extracted for current note only:
global The note’s position in elapsed time in the mu-sical composition, represented as a percentage.
voice Voice part of the note, defined by the author ofthe database.
notations Noted signs for the note, such as dynam-ics, intonation, etc.
3.3 Efficacy of tree-based clusteringThe tree-based clustering itself is an existing method; how-ever, the effect of applying this method to a musical per-formance is unknown. Therefore, it is necessary to deter-mine whether changes in generative efficiency can be seenin the bottom-up clustered model without additional infor-mation. To achieve concrete results, we tried to identify theperformer from the performance data using the models. Thedata sets used in this case were SBI and SM3, both of whichwere performed by PX. The models were trained with thedata of the compositions, which amounted to approximatelyone quarter of the data set. The tests used each datum of theremaining compositions in the same set; the percentage ofthe right choices for the performer by the trained model wascalculated (called the rate of identification). Evaluation ofresistance to the unseen data was also carried out using thistest, as all models were tested with data that is not used totrain the models. We differentiate these methods:Tree-based clustering The model using the proposed method.Bottom-up clustering The model trained by GMM with
the same number of mixtures M as the leaves in thetrees generated by tree-based clustering, and using thesame data set that is used to train the models.
The result is shown in Figure 4, and the ratio of accu-racy to the average of 20 ordinary human listeners for eachmethod is also indicated in parentheses. This is a severe con-dition, and the most human listeners cannot tell the differ-ence. However, proposed method can determine such subtledifference with high precision, because the ratio of Tree-based is about 232% for human listeners. Furthermore, theratio of Tree-based for Bottom-up is about 111%. There-fore, it is confirmed that the accuracy can be improved uponto generate models that can respond to unseen data by usingthe clustering with the information from the score.
534
12th International Society for Music Information Retrieval Conference (ISMIR 2011)
9.399e-02
2.693e-01 2.668e-02
5.980e-01 -6.722e-02
Is type of currentNote shorter than doubleDottedEighth?
Is voice of currentNote 5?
yes
Is octave of succeedingNote higher than 1?
no
no150
Is beam of succeedingNote begin?
yes
no62
yes24
no4
yes74
(b) offset for SCN by PA
1.430e+00 4.232e-01
1.325e+00 2.568e+00 1.302e+00 1.005e+00
Is voice of currentNote 5?
Is octave of succeedingNote higher than 3?
yes
Is type of currentNote shorter than Whole?
no
no60
Is global of currentNote earlier than 3%?
yesno36
Is type of currentNote longer than Eighth?
yes
no13
yes14
no144
yes47
(c) gate time for SCN by PA
-5.183e-02
1.390e-03
5.174e-03 -3.092e-02
Is type of currentNote shorter than doubleDottedQuarter?
no43
Is octave of currentNote 3?
yes
no166
Is beam of currentNote end?
yes
no62
yes43
(a) onset for SCN by PA
3.075e-01 2.669e-01 3.341e-01
3.894e-01 4.521e-01
Is staff of succeedingNote 1G2?
Is voice of currentNote 4?
no
Is type of succeedingNote shorter than DottedQuarter?
yes
no90
yes106
no29
Is octave of currentNote 5?
yes
no40
yes49
(d) dynamics for SCN by PA
1.053e+00
8.427e-01
9.314e-01 1.128e+00
Is local of currentNote later than 20%?
yes172
Is local of succeedingNote later than 5%?
no
no64
Is local of precedingNote later than 71%?
yes
no63
yes15
(e) tempo for SCN by PA
Figure 5. Examples of structural and statistical differences in tree-structures for each deviational factor
0 10 20 30 40 50 60 70
SBI
SM3
Tree-basedclustering
Bo om-upclustering
da
ta s
et
rate of iden"fica"on [%]
random choice average rate of 20 human listeners (baseline)
(2.48x)
(2.28x)
(2.16x)
(1.92x)
Figure 4. Results of identification test
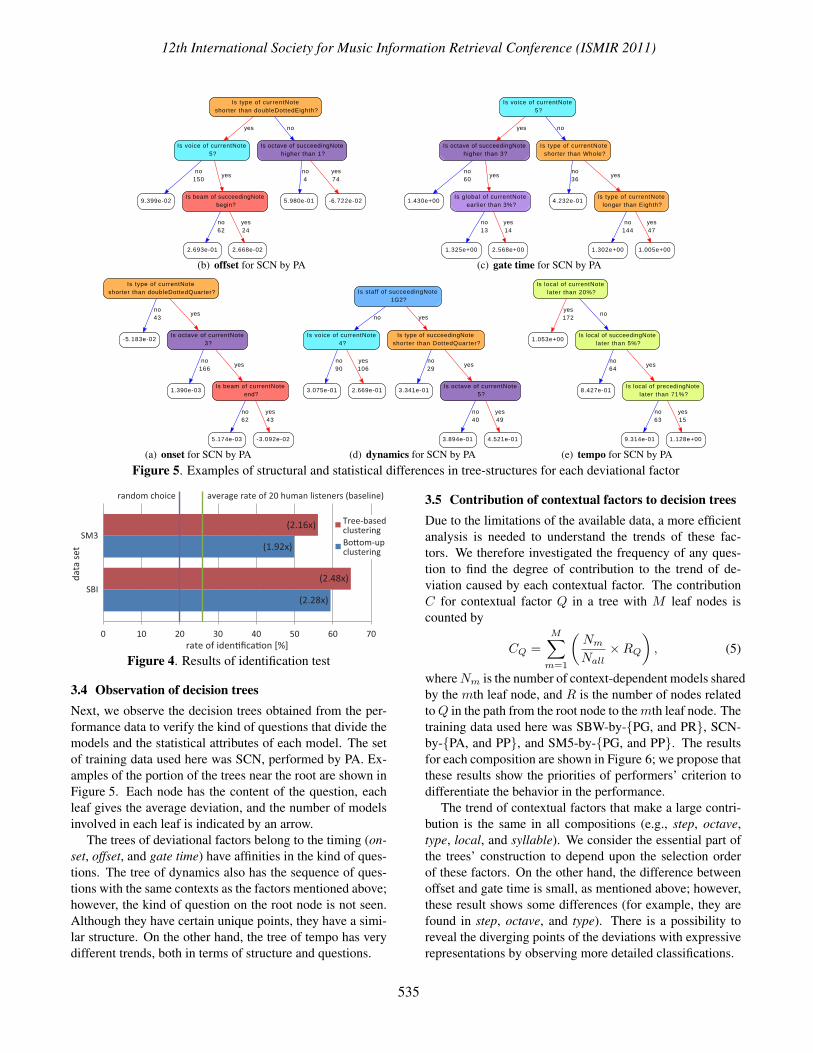
3.4 Observation of decision treesNext, we observe the decision trees obtained from the per-formance data to verify the kind of questions that divide themodels and the statistical attributes of each model. The setof training data used here was SCN, performed by PA. Ex-amples of the portion of the trees near the root are shown inFigure 5. Each node has the content of the question, eachleaf gives the average deviation, and the number of modelsinvolved in each leaf is indicated by an arrow.
The trees of deviational factors belong to the timing (on-set, offset, and gate time) have affinities in the kind of ques-tions. The tree of dynamics also has the sequence of ques-tions with the same contexts as the factors mentioned above;however, the kind of question on the root node is not seen.Although they have certain unique points, they have a simi-lar structure. On the other hand, the tree of tempo has verydifferent trends, both in terms of structure and questions.
3.5 Contribution of contextual factors to decision treesDue to the limitations of the available data, a more efficientanalysis is needed to understand the trends of these fac-tors. We therefore investigated the frequency of any ques-tion to find the degree of contribution to the trend of de-viation caused by each contextual factor. The contributionC for contextual factor Q in a tree with M leaf nodes iscounted by
CQ =M∑
m=1
(Nm
Nall×RQ
), (5)
where Nm is the number of context-dependent models sharedby the mth leaf node, and R is the number of nodes relatedto Q in the path from the root node to the mth leaf node. Thetraining data used here was SBW-by-{PG, and PR}, SCN-by-{PA, and PP}, and SM5-by-{PG, and PP}. The resultsfor each composition are shown in Figure 6; we propose thatthese results show the priorities of performers’ criterion todifferentiate the behavior in the performance.
The trend of contextual factors that make a large contri-bution is the same in all compositions (e.g., step, octave,type, local, and syllable). We consider the essential part ofthe trees’ construction to depend upon the selection orderof these factors. On the other hand, the difference betweenoffset and gate time is small, as mentioned above; however,these result shows some differences (for example, they arefound in step, octave, and type). There is a possibility toreveal the diverging points of the deviations with expressiverepresentations by observing more detailed classifications.
535

Poster Session 4
0
5
10
15
20
25
30
35
40
45 onset offset gate "me dynamics tempo average
contextual factor
rate
of
fre
qu
en
cy [
%]
(a) average of performances for SBW by PG and PR
0
5
10
15
20
25
30
35
40
45 onset offset gate "me dynamics tempo average
contextual factor
rate
of
fre
qu
en
cy [
%]
(b) average of performances for SCN by PA and PP
0
5
10
15
20
25
30
35
40
45 onset offset gate "me dynamics tempo average
contextual factor
rate
of
fre
qu
en
cy [
%]
(c) average of performances for SM5 by PG and PP
Figure 6. Frequencies of contextual factors for each composition
4. CONCLUSIONS
In this paper, we presented a method for describing the char-acteristics of human musical performance. The experimen-tal results of performer identification showed the use of theexpressive representations from the musical score enablesthe efficient acquisition of the model of the performance.The results also showed that the proposed model can cap-ture the characteristics of the performance from any subtledifferences that cannot be found by most human listeners.Therefore, the efficacy of using expressive representationsfrom the musical score to describe the characteristics of themusical performance was shown. This method can auto-matically learn the knowledge necessary to describe the treestructure of the model directly from the data of the perfor-
mance. We believe that the availability of such objectiveelements from the proposed model is effective for the anal-ysis of the performance. In the future, we will make compar-isons based on more common and more extensive examples,in addition to attempting to improve the modeling method.Furthermore, this method can be applied to generate unseenperformances. We are also making efforts in that direction.
5. ACKNOWLEDGEMENTThis research was partially supported by NIT president’sdiscretionary expense for young researchers and a Grant-in-Aid for Young Scientists (B) from the Ministry of Educa-tion, Culture, Sports, Science, and Technology, Japan.
6. REFERENCES
[1] M. Hashida, T. Matsui, and H. Katayose: ”A New MusicDatabase Describing Deviation Information of Perfor-mance Expressions,” Proceedings of the InternationalSymposium on Music Information Retrieval, pp. 489–494, 2008.
[2] A. Kirke and E. R. Miranda: ”Survey of ComputerSystems for Expressive Music Performance,” Journalof ACM Computing Surveys, Vol. 42, No. 1, Article 3,2009.
[3] J. Langner and W. Goebl: ”Visualizing expressive per-formance in tempo-loudness space,” Computer MusicJournal, Vol. 27, No. 4, pp. 69–83, 2003.
[4] J. J. Odell: ”The Use of Context in Large VocabularySpeech Recognition,” Ph.D thesis, Cambridge Univer-sity, 1995.
[5] B. H. Repp: ”A microcosm of musical expression: I.Quantitative analysis of pianists’ timing in the initialmeasures of Chopin’s Etude in E major,” Journal ofthe Acoustical Society of America, Vol. 104, No. 2,pp. 1085–1100, 1998.
[6] B. H. Repp: ”A microcosm of musical expression: II.Quantitative analysis of pianists’ dynamics in the ini-tial measures of Chopin’s Etude in E major,” Journalof the Acoustical Society of America, Vol. 105, No. 3,pp. 1972–1988, 1999.
[7] B. H. Repp: ”A microcosm of musical expression: III.Contributions of timing and dynamics to the aestheticimpression of pianists’ performances of the initial mea-sures of Chopin’s Etude in E major,” Journal of theAcoustical Society of America, Vol. 106, No. 1, pp. 469–478, 1999.
[8] C. S. Sapp: ”Comparative analysis of multiple musicalperformances,” Proceedings of the International Sym-posium on Music Information Retrieval, pp. 497–500,2007.
[9] K. Shinoda and T. Watanabe: ”MDL-Based context-dependent subword modeling for speech recognition,”A. Acoustical Society Japan (E), Vol. 21, No. 1, pp. 70–86, 2000.
[10] G. Widmer: ”Machine discoveries: A few simple, ro-bust local expression principles,” Journal of New MusicResearch, Vol. 31, No. 1, pp. 37–50, 2002.
[11] G. Widmer, S. Dixon, W. Goebl, E. Pampalk, and A. To-budic: ”In search of the Horowitz factor,” AI Magazine,Vol. 24, No. 3, pp. 110-130, 2003.
536