stiffness degradation characteristics destructive testing
TRANSCRIPT
Copyright © 2018 Tech Science Press CMES, vol.114, no.1, pp.75-93, 2018
CMES. doi:10.3970/cmes.2018.114.075 www.techscience.com/cmes
Stiffness Degradation Characteristics Destructive Testing and Finite-Element Analysis of Prestressed Concrete T-Beam
Chengquan Wang1, Yonggang Shen2, *, Yun Zou1, Tianqi Li1 and Xiaoping Feng1
Abstract: The failure behavior of the precast prestressed concrete T girder was investigated by destructive test and finite-element analysis, and the mid-span deflection, girder stiffness and the variation of the cross section strain in the loading process were obtained, and the mechanical properties, mechanical behavior, elastic and plastic behavior and ultimate bearing capacity of T girder with large span were revealed. Furthermore, the relationship between the beam stiffness degradation, the neutral axis in cross-section, steel yielding and concrete cracking are investigated and analyzed. A method was proposed to predict the residual bearing capacity of a bridge based on the variation of the position of the cross section strain distribution and the section neutral axis, which provided a theoretical basis for predicting the stiffness detection and carrying capacity assessment of prestressed concrete beam.
Keywords: Prestressed concrete T-beam, destructive testing, finite-element, stiffness, plane-section assumption.
1 Introduction Prefabricated simply supported prestressed concrete T-girder bridge is widely used in small and medium-span bridges, because of its simple structure, clear mechanical system, easily standardized prefabricated and construction. As for this prestressed concrete components, when experience a period of service time or under the overloaded vehicle impact load, its surface concrete will crack, and lead to the degradation of the components; what’s more, for statically indeterminate prestressed concrete bridge, the degradation of section stiffness not only affects the deformation properties, but also affects the internal force distribution between components [Gu, Xu and Zhang (2005)]. In addition, stiffness deterioration has an impact on the dynamic characteristics of the structure (overall stiffness of the structure, vibration period, modal distribution, etc.) and reduces the seismic performance of the bridge structure. In the loading process, stiffness deterioration, beam deflection, strain and cracks have a certain relationship, and systematically investigating on this relationships not only has great significance on structural design, the ultimate bearing capacity calculation of components, bridge inspection and maintenance, but also contributes to assessing the safety and usability of existing bridges and components.
1 School of Environment and Civil Engineering, Jiangnan University, Wuxi, China, 214122. 2 College of Civil Engineering and Architecture, Zhejiang University, Hangzhou, China, 310058. * Corresponding author: Yonggang Shen. Email: [email protected].

76 Copyright © 2018 Tech Science Press CMES, vol.114, no.1, pp.75-93, 2018
The behaviour of reinforced concrete and prestressed concrete beams is being studied by many researchers. Gu et al. [Gu, Xu and Zhang (2005)] compiled the computer program to calculate the moment-curvature relationship of reinforced concrete beam section, the components with different concrete strength grades, different dimensions, and different reinforcement ratios were calculated, based on the calculation results, the beam stiffness deterioration behavior after cracking were studied, an applicable method to estimate the bending stiffness for cracked reinforced concrete beam was proposed; Zhang et al. [Zhang, Zhu, Meng et al. (2011)] investigated the calculation method of both pre-yield stiffness and post-yield stiffness of FRP (fiber reinforced polymer) sheets strengthened reinforced concrete beams, and stiffness calculating formulas of FRP beam were proposed by regression analysis of the data from 80 pieces of test beams and 40 pieces of full-range analysis beams; In terms of the prestressed concrete beam finite element theory analysis, Zhao et al. [Zhao, Li, Wang et al. (2012)] tested nine experimental beams and studied the influence of non-prestressed longitudinal reinforcement strength, reinforced ratio and the layout of unbounded tendons on the flexural stiffness, and found that reinforcement strength and the layout of unbounded tendons have small impact on the stiffness, while the increase of non-prestressed steel rate led the beam stiffness after cracking larger; Zhang et al. [Zhang and Ye (2005a, 2005b)] made researches on the structure behavior of the cracked prestressed concrete beam, respectively, based on Timoshenko layered beam model and solid degenerate shell element, T-beam finite element models were established, the whole process of the prestressed concrete beam’s cracking and crushing was simulated and compared with the results from the static test. However, the stiffness results slightly different, the stiffness results of the beam model based on Timoshenko layered beam theory was about 45% of the stiffness before cracking while the stiffness loss of the model using solid degenerate shell element was about 20%; Fanning [Fanning (2001)] proposed appropriate ANASYS numerical modeling strategies, made finite element analysis of reinforced concrete beam and post-tensioned prestressed concrete beam and the results compared with the experimental results shown that through selecting proper material constitutive model, the nonlinear finite element model can accurately simulate the load-deflection change and beam stiffness change of reinforced concrete beam and post-tensioned prestressed concrete beam; Liu et al. [Liu, Yan, Zhang et al. (2006)] analyzed the ultimate load of prestressed high-strength concrete T-beam by considering material nonlinear properties, investigated the deformation and failure characteristics, and influence of main structural parameters upon the ultimate load; In aspects of research on beam section stiffness and the relationship between stiffness and other parameters, Song et al. [Song, Cui and Zhao (2001)] tested a 2.6 m span reinforced concrete T-beam in the laboratory, analyzed the relationship between the crack characteristic, the sectional compression height in beam pure bending zone and the sectional curvature, then the method to forecast the structural steel ratio based on crack distinctive feature was proposed; Ai et al. [Ai, Chen and Zhang (2010)] based on analysis and modeling with ANSYS and taken average crack distance and crack depth as crack statistic parameters, the modified bending rigidity formula for the reinforced concrete beam was proposed; Ballim et al. [Ballim, Reid and Kemp (2001)] tested 12 reinforced concrete beams under the combined effect of long-term loads and corrosion to ultimate limit state, and investigated the effects of reinforcement corrosion

Stiffness Degradation Characteristics Destructive Testing 77
on beam stiffness and performance at the ultimate limit state; Harries [Harries (2009)] carried out destructive test on two 42-year-old reinforced concrete adjacent box girder recovered from the partially collapsed Lake View Drive Bridge, and mainly studied the effects of corrosion of prestressing strand and concrete cover thickness to the bending performance and stiffness of the box girders, the impact of box girder shear key corrosion on the transverse load distribution; He et al. [He, Guo, Song et al. (2003)] based on dilapidated dynamic test on four reinforced concrete model beam girder from intact to destroyed, studied the variation of stiffness ratio, frequency ratio and load, and the experiential formula between the ratio of static stiffness to dynamic stiffness and the ratio of frequency were founded by non-linear regression method, which will be helpful to assess the bridge load carrying capacity. In summary, these papers mainly take old bridge components or scale model beams as test objects, and most of the studies focus on the reinforced concrete beams, the destructive testing on new prefabricated prestressed concrete beams is quite few. Old bridge components’ operating time is relatively long, the mechanical performance of which has been weakened by the concrete carbonation, prestressing loss and concrete cracks, while the scale model testing is difficult to accurately reflect the actual changing process of stiffness, stress and deformation, and the ultimate bearing capacity of beam in bridge construction; Due to the prestressing force, the failure mechanism and stiffness degradation of prestressed concrete beam are significantly different from reinforced concrete; previous researches mainly focus on the stiffness degradation of the beam under fatigue and earthquake load, the stiffness degradation in the static load failure process is relatively less. For practical engineering applications, figuring out the actual bending stiffness of bridge components is helpful for engineers to assess the bridge carrying capacity and take bridge strengthening. As for stiffness influencing factors, the change of neutral axis position is easier to be quantified and detected than the concrete cracks, which is also a realization of cracks changing. Thus, this paper presents testing to ultimate capacity (that is, through the entire range of post-elastic response) of a new 20 m span prestressed concrete T-beam as well as the subsequent FEA of the specimen. One purpose of this study is to expand the engineering community’s knowledge of the post-elastic response of T-beam and bridge to better understand section stiffness degradation mechanism and analyzed the changes and relationships of beam stiffness, deflection, cross-sectional strain and cracks in the destruction process; The second objective is investigating the relationship between the neutral axis position and beam stiffness, proposing a new simple and intuitive way for the stiffness detection and carrying capacity assessment of bridge; The third purpose is to then develop a method to perform accurate FEA of the ultimate capacity and stiffness degradation of prestressed concrete T-beam.
2 Introduction of destructive testing of T-beam
2.1 T-beam structure Fig. 1 is the structural diagram of the test beam, which height is 1m, width of wing is 1 m, the width of web from midspan to beam end is 30 cm~40 cm, the actual concrete strength grade is C50, tendons are composed of two 9 ϕs15.2 mm high-strength low relaxation

78 Copyright © 2018 Tech Science Press CMES, vol.114, no.1, pp.75-93, 2018
strands with tensile strength fptk=1860 N/mm2 and tension control stress σcon=0.75 fptk., other ordinary rebars are hot-rolled steel, the grade of which respectively is HRB335 and R235.
Figure 1: Structure and reinforcement diagram of prestressed concrete T-beam/mm
2.2 The test loading and monitoring programs A new 20 m span precast prestressed concrete T-beam destructive testing was performed to measured the beam flexural stiffness degradation, cracking capacity and ultimate bearing capacity. Fig. 2 is the field test photo.
Figure 2: Field test photo
(1) Loading devices As shown in Fig. 3, two 100 t hydraulic jacks are placed at two loading regions in the midspan, and the distance between the loading regions is 2 m; the system providing reaction force consists of two two-steel I beam welded steel beam, four steel columns and anchors connected to the bottom of steel column. Firstly, the loading step is determined, before concrete cracking the load increment is 20 kN, duration for 10 mins; closing to cracking moment, load increment is reduced to 5 kN until cracks appear; the load increment after cracking is 10 kN, holding charge time is still 10 mins.

Stiffness Degradation Characteristics Destructive Testing 79
Figure 3: T-beam test loading device and measuring points setup/cm
(2) Strain measurement devices Resistance strain gauges are used to detect the concrete surface strain, while the strain tester made up of micrometer gauge and ceramic rod is also used in order to be checked. The girder in the midspan section increases the beam bending stiffness, and FEM results shown that the strain of section in the distance of 60 cm from the midspan section is the largest, so totally twelve strain measurement points are layed from top to bottom at the facade which distance is 60 cm from the midspan girder. Layout of the strain measurement devices are shown in Fig. 3. (3) Deflection measurment devices Long range dial gauges are used to measure the vertical deflection, and sections in span of 1/8 L(7/8 L), 1/4 L(3/4 L), 3/8 L(5/8 L), 1/2 L and two supports all are arranged two measuring points. The range of dial gauges at 1/2 L, 3/8 L (5/8 L) sections is 200 mm, the range of dial gauges at 1/4 L (3/4 L) sections and 1/8 L (7/8 L) sections respectively is 150 mm and 100 mm, other dial gauges are 50 mm range. Layout of the deflection measurement devices are also shown in Fig. 3. (4) Crack measurement Before the field test, cleaning the beam surface and drawing 100×100 mm grid. In the loading process, the crack length and direction are depicted on the grid while the crack observation instrument is used to measure the width of cracks.
2.3 The termination conditions of the test When the T-beam reaches one of the following criteria, which is considered the component damaged and loadings are stopped [GB/T50152-2012]: (1) Bending span deflection reaches 1/50 beam length. (2) Concrete in compression zone cracked or crushed. (3) Width of the crack beside the tensile reinforcement is up to 1.5 mm or steel strain
reaches to 0.01.

80 Copyright © 2018 Tech Science Press CMES, vol.114, no.1, pp.75-93, 2018
(4) The tension reinforcement in beam fractures.
3 Finite element modeling 3.1 Element types and simulation of prestressed force T-beam three-dimensional finite element model adopted by software ABAQUS was established, the solid element C3D8R is used to stimulate the concrete; the truss element T3D2, which only withstanding tensile and compressive loads is used to simulate steel reinforcement and prestressed strand. Rebars and prestressing strands are embedded into the concrete solid, assuming perfect bond between strand and concrete [ABAQUS (2000)]. The interaction between cracked concrete and reinforcement that is known as ‘bond-slip’ was indirectly included by modifying the post-peak behavior of concrete (i.e. the so-called ‘tension stiffening’ effect for concrete in tension). The T-beam FE model used 20, 328 solid elements, the maximum size of which is 50 mm, and there are 17,770 truss elements the maximum unit size is 200 mm. Model meshing graph is shown in Fig. 4.
a) FE model mesh of T beam
b) Reinforcement truss model
Figure 4: Finite element model of T-beam
Cooling method is used in the FE model to simulate the posttensioned prestressing force. An initial temperature value and linear expansion coefficient of the tendon are set up, then giving a temperature drop value to generate contraction deformation which produces pretension effect. The temperature drop value is calculated as follows.
αEAPT /=∆ (1) Where, ΔT is the value of temperature drop; E is the elastic modulus of prestressing strand, α is the linear expansion coefficient; A is the sectional area of prestressing strand; P is the effective prestressing force values.
3.2 Material constitutive relations Fig. 5 shows the constitutive model of concrete [GB50010-2011] in this paper, the rising section of which is used the formula proposed by Mander et al. [Mander, Priestley and

Stiffness Degradation Characteristics Destructive Testing 81
Park (1988)], the decreasing section adopted by the formula proposed by Guo et al. [Guo and Shi (2003)]. The material model for all steel elements was based on elastic-perfectly plastic behavior, which is shown in Fig. 6, the elastic modulus and yield strengths are listed in Tab. 1.
Figure 5: Concrete constitutive relation Figure 6: Perfectly plastic model
Elastic modulus of concrete was determined as 34.5 GPa and the concrete compressive strength was 32.4 MPa, tensile strength of 2.65 MPa. The damage-plasticity model for concrete was preferred in this study to take into account the behavior of cracked sections. The dilation angle was taken as 30º; The ratio of initial equi-biaxial compressive yield stress to initial uniaxial compressive yield stress was 1.16; The ratio of the second stress invariant on the tensile meridian to that on the compressive meridian was 0.6667 and visosity parameter was 0.0005. Concrete damage due to loading and unloading the specimen during the experiment was not considered in the model and monotonic loading was applied. At some level of loading, concrete weakens after crushing in compression or cracking in tension. Thus, when unloading occurs in the tension or compression softening regions, concrete damage results in a degradation of initial elastic stiffness. This is of particular importance for cyclic loading. But such effect is generally insignificant for monotonic loading and was neglected in this study by assuming constant properties for the elastic component of concrete material model.
Table 1: Steel material parameters Unit: MPa Material name Elastic modulus Es Yield strength fy R235 steel 2.1×10⁵ 235 HRB335 steel 2.0×10⁵ 335 prestressed strand
1.95×10⁵ 1860
3.3 Boundary condition and solving method The vertical and vertical degree of freedom of T-beam supports are completely constrained, and springs are set at the longitudinal of the supports to simulate the rubber bearings’ longitudinal deformation under loading. There are two analysis steps in the model, the first step only counted the response of beam under effective prestressing force
82 Copyright © 2018 Tech Science Press CMES, vol.114, no.1, pp.75-93, 2018
and own weight. The second step can gradually apply displacement on the points in mid-span of the beam. Steel pads are applied on the beam to prevent stress concentration on the bottom of the beam during loading process, the translational degree of freedom on the vertical load of all nodes on the loading surface are coupled (Fig. 4-a), the static general algorithm considering geometric nonlinear effects is used to compute the FE model.
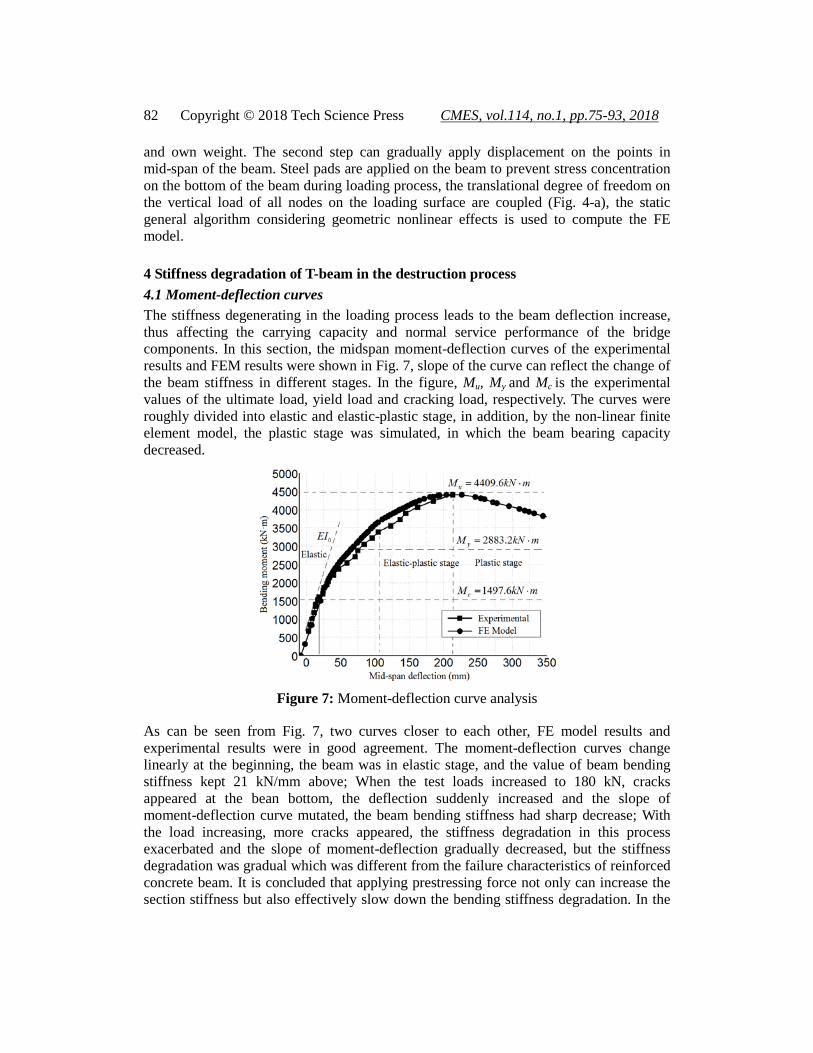
4 Stiffness degradation of T-beam in the destruction process 4.1 Moment-deflection curves The stiffness degenerating in the loading process leads to the beam deflection increase, thus affecting the carrying capacity and normal service performance of the bridge components. In this section, the midspan moment-deflection curves of the experimental results and FEM results were shown in Fig. 7, slope of the curve can reflect the change of the beam stiffness in different stages. In the figure, Mu, My and Mc is the experimental values of the ultimate load, yield load and cracking load, respectively. The curves were roughly divided into elastic and elastic-plastic stage, in addition, by the non-linear finite element model, the plastic stage was simulated, in which the beam bearing capacity decreased.
Figure 7: Moment-deflection curve analysis
As can be seen from Fig. 7, two curves closer to each other, FE model results and experimental results were in good agreement. The moment-deflection curves change linearly at the beginning, the beam was in elastic stage, and the value of beam bending stiffness kept 21 kN/mm above; When the test loads increased to 180 kN, cracks appeared at the bean bottom, the deflection suddenly increased and the slope of moment-deflection curve mutated, the beam bending stiffness had sharp decrease; With the load increasing, more cracks appeared, the stiffness degradation in this process exacerbated and the slope of moment-deflection gradually decreased, but the stiffness degradation was gradual which was different from the failure characteristics of reinforced concrete beam. It is concluded that applying prestressing force not only can increase the section stiffness but also effectively slow down the bending stiffness degradation. In the
Stiffness Degradation Characteristics Destructive Testing 83
field test, when the load of a single loading point arrived to 520 kN, the maximum width of cracks in mid-span tensile region was over 1.5 mm and the tensile strain of steel rebar was 20828 με, which indicated that T-beam was destroyed, and the loadings were stopped. At this point, the measured T-beam mid-span deflection was 213.01 mm which approximately was 1/100 span, and the experimental value of the ultimate moment was 4409.6 kN·m, which was 1.65 times of the code “JTG D62-2012” calculated value 2665.8 kN·m, and the FEM result was 4496.47kN·m; the experimental value of cracking moment was 1497.6 kN·m, which was 1.39 times of the code calculated value 1077.4 kN·m, the FEM result was 1796.0 kN·m. The error between experimental results and FEM results was slightly larger, which may be due to the prestressing force in FE model was larger than the actual value. What’s more, the plastic stage in which the beam bearing capacity decreased was simulated by non-linear finite element model, Fig. 7 shown that the plastic changes of the T-beam were gentle, and the beam had good ductility.
4.2 Stiffness degradation analysis of T-beam Section stiffness degradation is closely linked to the deflection and bearing capacity of the components. Althoughthe moment-deflection curve can reflect the stiffness degradation in the damage process, but not intuitive, so it is necessary to quantify the bending stiffness with a method. There are two methods to make stiffness degradation analysis [Du (1988)]: CEB Code and UK specifications use tangent stiffness method; American ACI Code uses secant stiffness method. Ye et al. [Ye and Zhang (2007)] proposed that after concrete units cracking, the force bear by the concrete in partial loading section will gradually be released and passed to steel, which results in the stiffness instability. If the load-deflection curve tangent is used to analysis the stiffness reduction, then with the increase of load, the curve tangent will fluctuate. In this paper, at first the calculation method from the paper [Lubliner, Oliver, Oller et al. (1989)] is used to analyze the beam stiffness K, which determined as follows:
i
iPK
∆= (2)
Where Pi is the i-level load, ∆i is the mid-span deflection corresponding the i-level load.
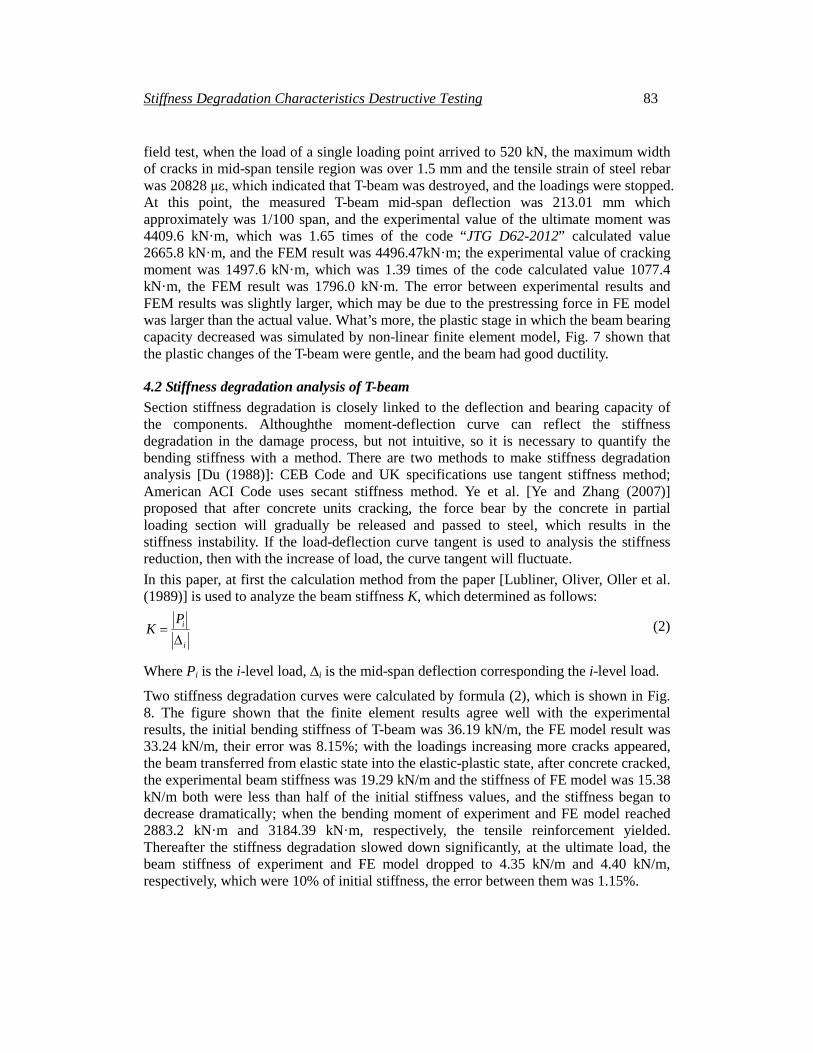
Two stiffness degradation curves were calculated by formula (2), which is shown in Fig. 8. The figure shown that the finite element results agree well with the experimental results, the initial bending stiffness of T-beam was 36.19 kN/m, the FE model result was 33.24 kN/m, their error was 8.15%; with the loadings increasing more cracks appeared, the beam transferred from elastic state into the elastic-plastic state, after concrete cracked, the experimental beam stiffness was 19.29 kN/m and the stiffness of FE model was 15.38 kN/m both were less than half of the initial stiffness values, and the stiffness began to decrease dramatically; when the bending moment of experiment and FE model reached 2883.2 kN·m and 3184.39 kN·m, respectively, the tensile reinforcement yielded. Thereafter the stiffness degradation slowed down significantly, at the ultimate load, the beam stiffness of experiment and FE model dropped to 4.35 kN/m and 4.40 kN/m, respectively, which were 10% of initial stiffness, the error between them was 1.15%.
84 Copyright © 2018 Tech Science Press CMES, vol.114, no.1, pp.75-93, 2018
Figure 8: Stiffness degradation curves
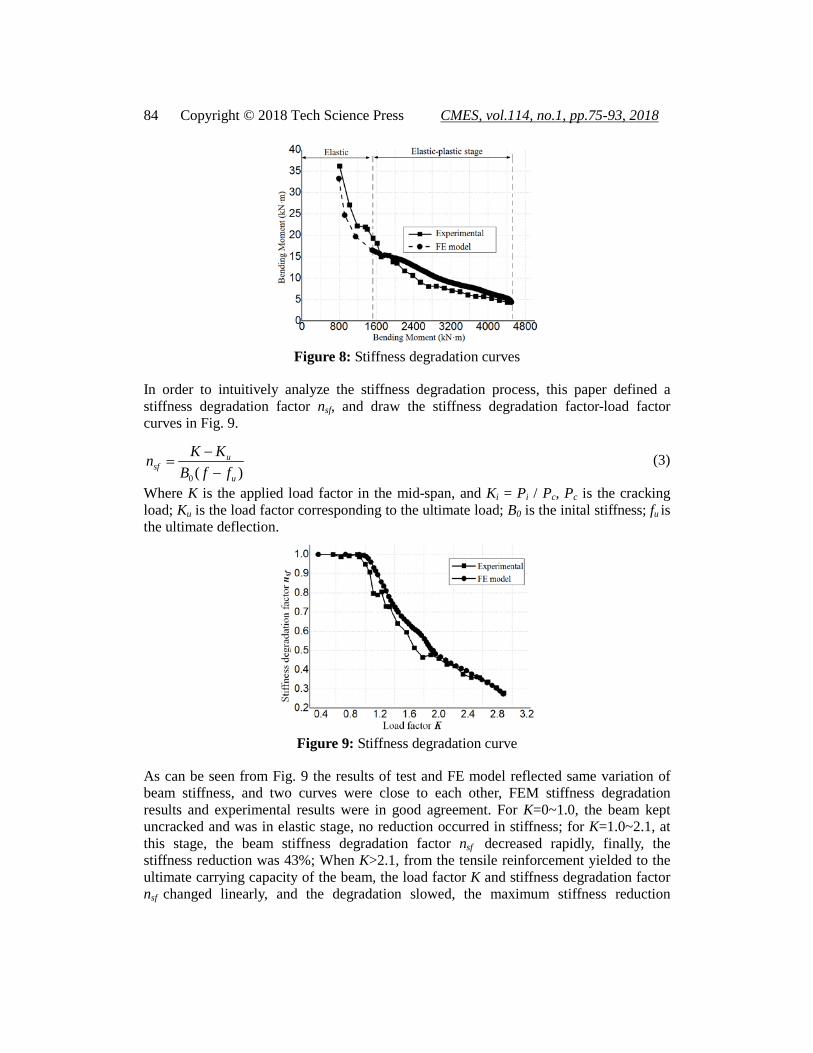
In order to intuitively analyze the stiffness degradation process, this paper defined a stiffness degradation factor nsf, and draw the stiffness degradation factor-load factor curves in Fig. 9.
)(0 u
usf ffB
KKn−
−= (3)
Where K is the applied load factor in the mid-span, and Ki = Pi / Pc, Pc is the cracking load; Ku is the load factor corresponding to the ultimate load; B0 is the inital stiffness; fu is the ultimate deflection.
Figure 9: Stiffness degradation curve
As can be seen from Fig. 9 the results of test and FE model reflected same variation of beam stiffness, and two curves were close to each other, FEM stiffness degradation results and experimental results were in good agreement. For K=0~1.0, the beam kept uncracked and was in elastic stage, no reduction occurred in stiffness; for K=1.0~2.1, at this stage, the beam stiffness degradation factor nsf decreased rapidly, finally, the stiffness reduction was 43%; When K>2.1, from the tensile reinforcement yielded to the ultimate carrying capacity of the beam, the load factor K and stiffness degradation factor nsf changed linearly, and the degradation slowed, the maximum stiffness reduction

Stiffness Degradation Characteristics Destructive Testing 85
reached 26%.
4.3 Analysis of the relationship between stiffness and the neutral axis Measuring the strain at the facade of the T-beam to verify whether the deformation of the mid-span cross-section meets the plane-section assumption and investigate the relationship between the beam section stiffness and the sectional neutral axis. The field test used the strain tester made up of micrometer gauge and ceramic rod to measure the average strain of the concrete on the left side facade of the webs, the layout of the strain tester is shown in Fig. 10.
Figure 10: Micrometer gauge layout
Extracting the test results to draw the load-strain curves of different points on the beam facade, the curves are shown in Fig. 11.

86 Copyright © 2018 Tech Science Press CMES, vol.114, no.1, pp.75-93, 2018
Figure 11: Mid-span section strain analysis
Fig. 11 shown that the strain distribution of mid-span cross-section along the vertical demonstrated linear line both under the normal service load and after the concrete cracking, which verified the strain of the mid-span cross-section of prestressed T-beam after cracking meets the plane-section assumption. Until the load of single loading point reaches 500 kN, the strain of beam bottom edge began to increase significantly, and at the final level load 520 kN, the increase of bottom edge strain became more pronounced. In addition, as can be seen from Fig. 11, when T-beam damaged the compressive strain of upper edge concrete was -1149 µε. It is demonstrated that for the prestressed concrete T-beam with larger stiffness of flange plate, its destruction state is the pulling damage of the web bottom edge, the beam less prone to crushing damage. Therefore, the reinforcement design of prestressed concrete T-beam be mainly in increasing the tensile and cracking strength of the beam bottom and the web facade. In destructive testing, with the increase of loading, the concrete in tension zone gradually cracked and quitted working, which led to the cross-section effective area decrease, the sectional neutral axis moved upward, and section stiffness decreased. The position of the mid-span cross-sectional neutral axis has close relationship with the stiffness degradation, the beam destructive state and the beam carrying capacity, so this paper draw the position of the neutral axis - bending moment curve and the beam stiffness degradation factor-the position of the neutral axis curve of the experimental results and FE model results, the curves were shown in Fig. 12 and Fig. 13.

Stiffness Degradation Characteristics Destructive Testing 87
Figure 12: Neutral axis position-midspan moment curve
Figure 13: Stiffness degradation factor-neutral axis position curve
The figures shown that in the first few loading levels, the neutral axis position substantially kept unchanged, but when the test mid-span bending moment reached 1526.4 kN·m, the neutral axis position began to move upward, then some 0.02 mm width cracks appeared on the bottom edge and surface of the beam middle section. Thus, it demonstrated that the change of the neutral axis position can reflect the changes of the section stiffness and the concrete cracking. In addition, the finite element analysis results were in good agreement with the experimental results, the FE model cracking load value was larger than the experimental results, after concrete cracking the position of the neutral axises of FE model and test beam all significantly changed, then with the load increasing, more cracks appeared and extended, the neutral axis constantly moved upward, but in the last few loading levels, both in the FE model curves and in experimental curves, the neutral axis position stabilized and remained at the distance of 76~78 cm with the beam bottom, the neutral axis did not move into the flange plate. Moreover, as can be seen from the curves in Fig. 13, after concrete cracking, the stiffness degradation factor nsf and the position moving of the neutral axis shown a linear
88 Copyright © 2018 Tech Science Press CMES, vol.114, no.1, pp.75-93, 2018
relationship, but when the distance between the neutral axis and beam bottom increased to 70 cm, with the neutal axis moving upward, the stiffness drastically decreased.
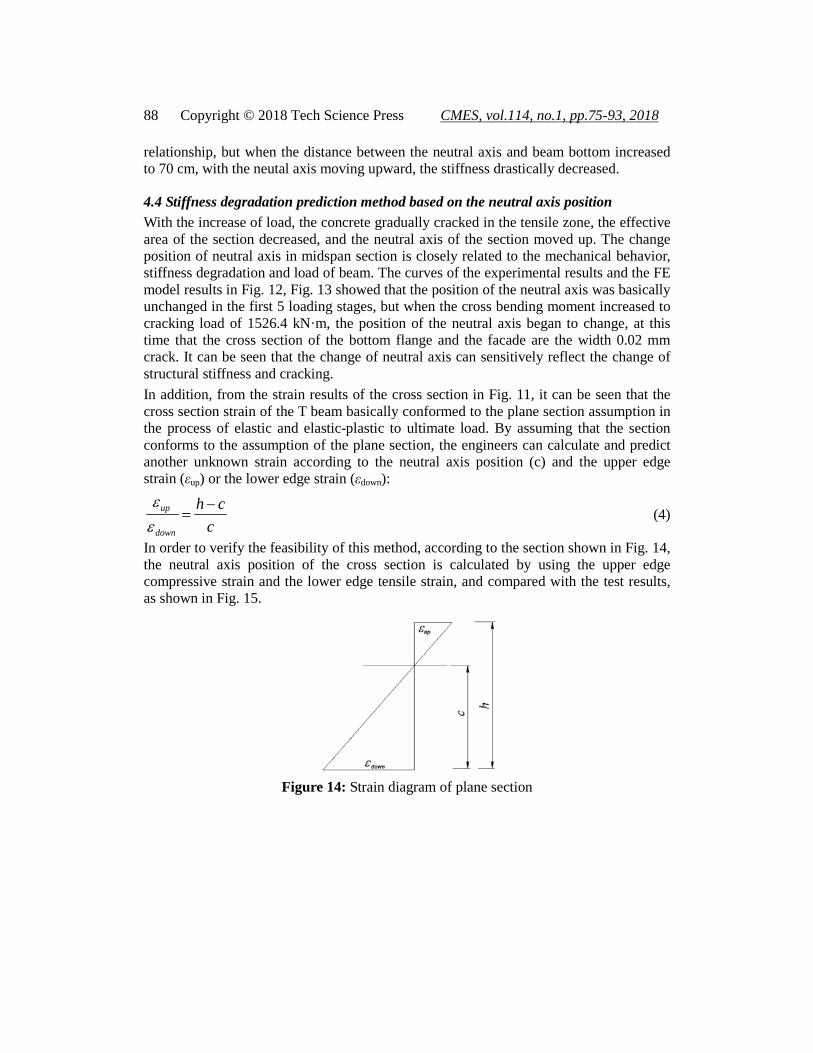
4.4 Stiffness degradation prediction method based on the neutral axis position With the increase of load, the concrete gradually cracked in the tensile zone, the effective area of the section decreased, and the neutral axis of the section moved up. The change position of neutral axis in midspan section is closely related to the mechanical behavior, stiffness degradation and load of beam. The curves of the experimental results and the FE model results in Fig. 12, Fig. 13 showed that the position of the neutral axis was basically unchanged in the first 5 loading stages, but when the cross bending moment increased to cracking load of 1526.4 kN·m, the position of the neutral axis began to change, at this time that the cross section of the bottom flange and the facade are the width 0.02 mm crack. It can be seen that the change of neutral axis can sensitively reflect the change of structural stiffness and cracking. In addition, from the strain results of the cross section in Fig. 11, it can be seen that the cross section strain of the T beam basically conformed to the plane section assumption in the process of elastic and elastic-plastic to ultimate load. By assuming that the section conforms to the assumption of the plane section, the engineers can calculate and predict another unknown strain according to the neutral axis position (c) and the upper edge strain (εup) or the lower edge strain (εdown):
cch
down
up −=
εε
(4)
In order to verify the feasibility of this method, according to the section shown in Fig. 14, the neutral axis position of the cross section is calculated by using the upper edge compressive strain and the lower edge tensile strain, and compared with the test results, as shown in Fig. 15.
Figure 14: Strain diagram of plane section

Stiffness Degradation Characteristics Destructive Testing 89
500 1000 1500 2000 2500 3000 3500 4000 450050
55
60
65
70
75
80
85
90
The
neut
ral a
xis p
ositi
on(c
m)
Bending moment (kN.m)
Theoretical Experimental
Figure 15: Neutral axis position-mid span moment curve
It can be seen from the diagram that the calculated value agrees well with that of the neutral axis calculated by the experimental value. According to the neutral axis position (c) and the upper edge strain (εup) or the lower edge strain (εdown), another unknown strain can be calculated, the premise of this method is to determine the position of the neutral axis of the midspan section. Fig. 15 shown that the neutral axis beam section was constantly on the move in the early stage of loading, but when the moment was more than 3222.4 kN·m, the neutral axis was located between 76~78 cm, and the range of variation was very small. The web height of the T girder in Fig. 1 was 78 cm, which indicated that the neutral axis will remain in the web and not extend to the beam flange until loaded to the ultimate load. Therefore, in engineering applications, in order to predict the ultimate strain of the lower edge, it is assumed that the neutral axis is located at the bottom of the flange 0.5~1 cm, and then the maximum tensile strain of the lower edge is calculated according to the ultimate compressive strain of the upper edge concrete. With this method, from the strain measuring points installed on the beam of the upper edge and the lower edge, the section neutral axis position can be inferred, then according to the location of neutral axis, the bridge bearing capacity and mechanical performance will be predicted.
4.5 Analysis of the relationship of the stiffness and the concrete cracks In the damage process, the beam stiffness degradation, the neutral axis moving had close relationship with the concrete cracks, and the three-dimensional nonlinear finite element model not only can simulate the beam stiffness degradation process but also can simulate the concrete cracks and predict the beam destructive states. In this paper, the FE model used the plasticity damage model to simulate the concrete mechanical behavior, in this model the crack did’t evolved in the material integration point but using the cloud chart to show the direction and distribution of cracks. According to the studies of Lubliner et al. [Lubliner, Oliver, Oller et al. (1989)], when the tensile plastic strain at a point is greater than zero and the maximum principal plastic strain is positive, the initial crack generates at this point, and the normal vector of the crack surface parallels to the direction of the maximum principal plastic strain, so this paper can use the tensile plastic strain cloud chart of the concrete points to simulate the distribution of the cracks. Comparision of the test measured cracks distribution graph

90 Copyright © 2018 Tech Science Press CMES, vol.114, no.1, pp.75-93, 2018
with the tensile plastic strain cloud chart of the FE model was shown in Fig. 16. In the field test, when the single loading point of test beam was loaded to 180 kN, cracks appeared in the mid-span section, when loaded to 340 kN, the diagonal cracks began to appear at the outside of the pure bending zone, and symmetric uniformly distributed. The average distance of the cracks was 290 mm, the maximum width and extension height of cracks was 0.30 mm, 320 mm, respectively, the average width of cracks was 0.20 mm, then with the increase of the test loadings; the load continued to increase, the number of cracks in pure bending zone was essentially same, and the crack width continued to increase, more new cracks appeared in the area from pure bending zone to the shearing zone; when loaded to 520 kN, the maximum width of cracks in the mid-span section reached to 1.5 mm, T-beam reached the ultimate bearing capacity, and the field stopped increasing the loadings. From the Fig. 14, the failure modes and cracks distribution of FE model and the test beam were similar, and the directions of vertical and diagonal cracks in the FE model were consistent with the measured results. Therefore, the nonlinear finite element method in this paper can simulate the failure modes of the prestressed concrete beam. In addition, Fig. 16 shows the failure mode of the T-beam was plastic failure, the uniform distribution of the cracks provided the conditions for the uniform stress of tendons in many mid-span cross-sections and was conductive for prestressed tendons plastically deformed in many sections, which increased the deformability of the prestressed concrete T-beam.
(a) Applied load is 200 kN
(b) Applied load is 340 kN
(c) Applied load is 520 kN
Figure 16: Tensile plastic strain cloud images of finite element model
5 Conclusions The experimental and finite element failure behaviour of 20 m span prestressed concrete T-beam are compared in this paper, and the beam characteristics of stiffness degradation and destruction are systematically studied, the following conclusions can be derived from the study conducted in this paper: (1) The finite element model in this paper can effectively model the complex structure the
large-span prestressed concrete and simulate the stiffness degradation, deformation and cracks distribution in the destructive testing, and the FE model results are in good

Stiffness Degradation Characteristics Destructive Testing 91
agreement with the experimental results. Moreover, by the nonlinear analysis the capacity decline stage is simulated, which can provide supplement and help for the beam failure analysis.
(2) In the destruction process, from the elastic stage, the concrete crack, the elastic-plastic stage to the tensile reinforcement yield and change into plastic deformation, the strain of the mid-span cross-section well meets the plane-section assumption.
(3) The stiffness degradation factor in this paper can accurately reflect the degradation of the prestressed concrete beam in the destructive testing, when the concrete uncracked and be at the elastic stage, the factor almost has no reduction; at the stage from the concrete cracking to the tensile reinforcement yielding, the stiffness degradation factor decreased rapidly, the stiffness reduction reached 43%; from the tensile reinforcement yielded to the ultimate carrying capacity of the beam, stiffness degradation factor changed linearly with the load, and the degradation slowed, the final stiffness reduction reached 26%.
(4) The stiffness degradation factor after concrete cracking and the position moving of the neutral axis shown a linear relationship, the position of the mid-span cross-sectional neutral axis has close relationship with the stiffness degradation, the beam destructive state and the beam carrying capacity. By analyzing and deriving the relationship between the neutral axis and the stiffness degradation factor, can provide a more simple intuitive method for the stiffness detection and carrying capacity assessment of prestressed concrete beam.
Acknowledgements: We gratefully acknowledge the support from the Program for Natural Science Foundation of Zhejiang Province (LY16E080006), National Natural Science Foundation of China (51378240), 2015 Jiangsu provincial building energy saving and construction industry science and technology project, 2016 Jiangsu provincial construction industry modernization base project. The authors declare that there is no conflict of interest regarding the publication of this paper.
References ABAQUS: User’s Manual: Version 6.1. Hibbitt, Karlsson & Sorensen, Incorporated, 2000. Ai, J.; Chen, J.; Zhang, L. F.; Liu. F. (2010): Calculation of sectional stiffness and deflection of FRP sheets strengthened reinforced concrete beams. Modificaton and research on bending rigidity formula of reinforced concrete beam. Transactions of Nanjing University of Aeronautics and Astronautics, vol. 27, no. 4, pp. 299-305. Ballim, Y.; Reid, J. C.; Kemp, A. R. (2001): Deflection of RC beams under simultaneous load and steel corrosion. Magazine of Concrete Research, vol. 53, no. 3, pp. 171-181. Du, G. C. (1988): Modern prestressed concrete structure. China Architecture & Building Press, Beijing, pp. 334-342. Fanning, P. (2001): Nonlinear models of reinforced and post-tensioned concrete beams. Electronic Journal of Structural Engineering, vol. 1, pp. 111-119.

92 Copyright © 2018 Tech Science Press CMES, vol.114, no.1, pp.75-93, 2018
Gu, X. L.; Xu, Yong, Zhang, W. P. (2005): Study on stiffness deterioration of RC beams after cracking. Structural Engineers, vol. 21, no. 5, pp. 20-23. Guo, Z. H.; Shi, X. D. (2003): Reinforced concrete theory and analyse. Tsinghua University Press, Beijing. Harries, K. A. (2009): Structural testing of prestressed concrete girders from the Lake View Drive Bridge. Journal of Bridge Engineering, vol. 14, no. 2, pp. 78-92. He, S. H.; Guo, Q.; Song, Y. F.; Zhao, X. X. (2003): Health condition and load carrying capacity evaluation of RC beam based on dynamic testing. Journal of Chan’an University (Natural Science Edition), vol. 23, no. 6, pp. 36-39. Hibitt, D.; Karlsson, G.; Sorensen, T. (2007): ABAQUS online documentation-version 6.7. Dassault Systemes (SIMULIA), Providence, RI. Liu, X. Y.; Yan, D. H.; Zhang, F.; Wei, H. C.; Wei, C. L. (2006): Ultimate load analysis of prestressed high-strength concrete beam. China Journal of Highway and Transport, vol. 19, no. 1, pp. 58-61. Lubliner, J.; Oliver, J.; Oller, S.; Oñate, E. (1989): A plastic-damage model for concrete. International Journal of Solids and Structures, vol. 25, no. 3, pp. 299-326. Mander, J. B.; Priestley, M. J. N.; Park, R. (1988): Theoretical stress-strain model for confined concrete. Journal of structural engineering, vol. 114, no. 8, pp. 1804-1826. National Standard of the People’s Republic of China. Code for design of concrete structures (GB50010-2011). Beijing, 2011. Song, Y. F.; Cui, J.; Zhao, X. X.; He, S. H. (2001): Testing research on the relation between the crack distinctive feature and the structural performance of reinforced concrete T-beams. Journal of Traffic and Transportation Engineering, vol. 1, no. 3, pp. 46-49. Standard for test method of concrete structures GB/T50152-2012. Xia, Y. F. (2006): Test of limit of bearing capacity of prestressed concrete simple T-shape beam bridge (Ph.D. Thesis). Southeast University. Xu, Y. L.; Zhou, S. (2005): Comprehension and application for code for design of concrete structures. China Architectural Industry Press (in Chinese), Beijing. Ye, J. S.; Zhang, F. (2007): Stiffness degeneration model of prestressed concrete continuous box girder after cracking. China Journal of Highway and Transport, vol. 20, no. 6, pp. 67-72. Zhang, F.; YE, J. S. (2005): Mechanical behavior of prestressed concrete beams after cracking. Journal of Highway and Transportation Research and Development, vol. 22, no. 7, pp. 64-67. Zhang, F.; Ye, J. S. (2005): Structure behavior of cracked prestressed concrete beam. Journal of Southeast University (Natural Science Edition), vol. 35, no. 4, pp. 584-588. Zhang, P.; Zhu, H.; Meng, S. P.; Wu, G.; Wu, Z. S. (2011): Calculation of sectional stiffness and deflection of FRP sheets strengthened reinforced concrete beams. Journal of Building Structures, vol. 04, pp. 87-94. Zhao, S. W.; Li, X. T.; Wang, R. X.; Wu, L. F. (2012): Flexural stiffness of unbounded
Stiffness Degradation Characteristics Destructive Testing 93
partially prestressed concrete beams with high strength rebars. Journal of Hebei University of Technology, vol. 05, pp. 88-91.