status report 2021 - international carbon action partnership
TRANSCRIPT

EMISSIONS TRADING WORLDWIDE
International Carbon Action Partnership
Status Report 2021

EMISSIONS TRADING WORLDWIDEInternational Carbon Action Partnership (ICAP)Status Report 2021
EDITORIAL TEAM:
Emma Krause, Baran Doda, Alexander Eden, Christopher Kardish, Lina Li, Stephanie La Hoz Theuer, William Acworth, Jana Elbrecht, Julia Groβ, Maia Hall, Constanze Haug, Martina Kehrer, Kai Kellner, Ernst Kuneman, Andrés Olarte Pena, Victor Alejandro Ortiz Rivera.
CITE AS:
ICAP. (2021). Emissions Trading Worldwide: Status Report 2021. Berlin: International Carbon Action Partnership.
The ICAP Secretariat expresses its gratitude to policymakers from the ICAP membership and further collab-orators from the emissions trading field, who provided insightful written contributions and/or carefully reviewed the report:
Raquel Breda dos Santos (Brazil), Gustavo Saboia Fontenele e Silva (Brazil), Inaiê Takaes Santos (PMR Consultant, Brazil), Jason Gray (California), Shelby Livingston (California), Amy Ng (California), Rajinder Sahota (California), Stephen Shelby (California), Mark Sippola (California), Mavis Chan (Canada), Simon Tudiver (Canada), Francisco Dall’Orso (Chile), Juan Pedro Searle (Chile), Qiang Li (Chongqing Carbon Emissions Trading Center), Linjun Xie (Chongqing Carbon Emissions Trading Center), Germán David Romero Otálora (Colombia), Beatriz Yordi (European Commission), Julia Ziemann (European Commission), Alexander Handke (Germany), Michael Themann (Germany), Sirui Xiao (China Emissions Exchange, Guangzhou), Guangxing Yang (China Hubei Emission Exchange), Dida Gardera (Indonesia), Yosuke Mori (Japan), Aiman Esekina (Kazakhstan), William Space (Massachusetts), Suriel Islas Martínez (Mexico), María de la Paz Ortiz (Mexico), Zineb Bouzoubaa (New York City), Kate Gouin (New York City), Ross MacWhinney (New York City), Lindsey-Paige McCloy (New York City), Vanessa Chalk (New Zealand), Scott Gulliver (New Zealand), Paula Hemmer (North Carolina), John Cooper (Nova Scotia), Sachi Gibson (Nova Scotia), Jason Hollett (Nova Scotia), Michelle Miller (Nova Scotia), Andrew Webber (Nova Scotia), Brittany White (Nova Scotia), Colin McConnaha (Oregon), Syeda Hadika Jamshaid (Pakistan), Sarah Pinter (Pennsylvania), Glenda Daco (Philippines), Jonathan Beaulieu (Québec), Pierre Bouchard (Québec), Julie Côté (Québec), Hugo Desrosiers (Québec), Steve Doucet-Héon (Québec), Thomas Duchaine (Québec), Stéphane Legros (Québec), Chang-hwan Lee (Republic of Korea), Sungwoo Lee (Republic of Korea), Kyeongah Ahn (Republic of Korea), Younghyun Lee (Republic of Korea), William Lamkin (RGGI), Marat Latypov (Sakhalin), Jin Li (Shanghai Environment and Energy Exchange), Xing’an Ge (China Shenzhen Emissions Exchange), Qi Wang (China ShenzhenEmissions Exchange), Zhibin Chen (SinoCarbon), Guoqiang Qian (SinoCarbon), Sophie Wenger (Switzerland), Anothai Sangthong (Thailand), Cheng Liu (Tianjin Climate Exchange), Satoshi Chida (Tokyo Metropolitan Government), Takuya Ozawa (Tokyo Metropolitan Government), Jian Zhou (Tsinghua University), Engin Mert (Turkey), Tuba Seyyah (Turkey), Olga Yukhymchuk (Ukraine), Joe Cooper (United Kingdom), Henry Dieudonné-Demaria (United Kingdom), Charlie Lewis (United Kingdom), Chris Shipley (United Kingdom), Brian Woods (Vermont), Huy Luong Quang (Vietnam), Bill Drumheller (Washington).
The ICAP Secretariat is grateful to the German Federal Ministry for Environment, Nature Conservation and Nuclear Safety (BMU) for funding this report. adelphi consult GmbH lends scientific and technical support to the ICAP Secretariat and coordinated the compilation and production of the report.

TABLE OF CONTENTSFOREWORD 05
EXECUTIVE SUMMARY 07
PRACTITIONER INSIGHTS
CHINA 11
EUROPEAN UNION 15
THE REPUBLIC OF KOREA 17
NEW ZEALAND 19
RGGI 21
UNITED KINGDOM 23
INFOGRAPHICS
FROM SUPRANATIONAL TO LOCAL 26
SECTOR COVERAGE 27
EMISSIONS TRADING WORLDWIDE 28
GLOBAL EXPANSION OF ETS 29
DIFFERENT SHAPES OF ETS 30
AUCTION REVENUE 31
DEEP DECARBONIZATION AND ETS 32
ALLOWANCE PRICE DEVELOPMENTS 33
FACTSHEETS
EUROPE AND CENTRAL ASIA European Union 37Germany 43Kazakhstan 47Montenegro 50Sakhalin 51Switzerland 52Turkey 56Ukraine 58United Kingdom 59
NORTH AMERICA California 64Canada 69Massachusetts 72New Mexico 75New York City 76North Carolina 77Nova Scotia 78

Oregon 82Pennsylvania 83Québec 84Regional Greenhouse Gas Initiative 88Transportation and Climate Initiative 91Washington 93Western Climate Initiative 95
LATIN AMERICA AND THE CARIBBEAN Brazil 97Chile 98Colombia 100Mexico 101
ASIA-PACIFIC Beijing 106China 109Chongqing 114Fujian 117Guangdong 120Hubei 124Indonesia 127Japan 128New Zealand 129Pakistan 134Philippines 135Republic of Korea 136Saitama 141Shanghai 145Shenzhen 148Taiwan, China 151Thailand 152Tianjin 153Tokyo 156Vietnam 160
ABOUT ICAP & NOTES
ABOUT THE INTERNATIONAL CARBON ACTION PARTNERSHIP 162
NOTES ON METHODS AND SOURCES 166
LIST OF ACRONYMS 170
IMPRINT 172

Stat
us R
epor
t 202
1IC
AP
05
FOREWORDShort-term resilience and long-term ambition: ETS in the context of a net-zero consistent recovery
The COVID-19 pandemic and climate change are the global crises of our time. The virus has affected every corner of the world, but so too has the climate crisis, with year-on-year record temperatures driving a host of very visible, intensifying impacts, among these the extraordinary and tragic wildfires in Australia, California, and the Arctic Circle. Both crises threaten our public health, our environ-ment, our economies, and our ways of life. They highlight the value of transparent, evidence-based information for decision-making and demonstrate the benefits of working together – in our commu-nities, businesses, institutions, and governments. They also teach us that while facing challenges can pose risks and hardships, it also spurs creative and innovative solutions, and provides opportunities to create a safer, healthier, fairer, and more prosperous world.
In facing the economic shock of the pandemic, carbon markets have demonstrated remarkable resilience. Since spring 2020, the pandemic has impacted economic activity, reducing both emissions and demand for emissions allowances. Carbon markets reacted rationally as prices and auction volumes initially dropped. However, after a period of volatility, they stabilized, and allowance trading soon returned to pre-pandemic price and volume levels. This shows that the underlying structures of markets are sound and can foster resilience to external shocks, enabling market actors to react ratio-nally, both to short-term signals and longer-term perspectives.
This is a different story compared to the global financial crisis, the last major external demand shock to hit carbon markets, which exacerbated structural surpluses, suppressed prices, and under-mined confidence in emissions trading. ETS policymakers reflected on the lessons of the past decade and worked to improve the design of their systems by building increasingly sophisticated market stability elements into their regulations. These reforms have also been embedded in overarching policy frameworks, more ambitious 2030 targets, and long-term net-zero commitments, giving market actors confidence in the longevity of the policy.
Over the last years, a spectrum of innovative market stability mech-anisms have been designed and implemented across major ETSs around the world, including auction floor prices, market stability reserves, and emissions containment reserves. They are trans-parent and predictable rule-based mechanisms, devised to ensure orderly market functioning by adjusting the supply of allowances and moderating undesirable price effects in response to external shocks or structural imbalances. These technical design features give market participants confidence in the carbon market by miti-gating price volatility and supporting long-term trends in price development.
Anchoring an ETS within a robust framework with clear and ambi-tious policy targets further increases certainty, fostering resilience and longevity of the instrument. Having the role of ETS articulated in a policy mix and an overarching strategy to reach emissions targets offers a political and legal mandate for action. In particular, ambi-tious 2030 targets send a clear message that markets will need to provide a sufficiently strong and credible price signal to drive signifi-cant abatement and stimulate low-carbon investment.
Today, the number of jurisdictions announcing net-zero climate targets is on the rise, anchoring these commitments in high-level political pledges and/or legislation. National net-zero targets are catalyzed by the urgent need to align policy action with the goals of the Paris Agreement. Net-zero legislation has been passed or is currently under discussion in several key jurisdictions, including the European Union, France, Germany, Spain, Sweden, the UK, Republic of Korea, and New Zealand. Other key ETS jurisdictions such as California, Tokyo, and some RGGI states have explicitly set climate neutrality goals through executive orders or within policy documents. High-level political pledges have also been made by climate giants China, the US and Japan. This is truly encouraging, as achieving these net-zero targets will start to bring the Paris Agree-ment goals within reach.
Achieving climate neutrality by mid-century will require a concerted, long-term policy approach. Enacting net-zero climate laws and strengthening existing policy frameworks can set the scene for proactive policy development, allowing policymakers to adopt regulations, calculate emissions budgets, and set ever more ambitious emissions caps. They also assure market actors that despite temporary market fluctuations, the overall policy direction is towards steady and inevitable emissions reductions.
Anchoring an ETS within a robust framework with clear and ambitious policy targets further increases certainty.
← CONTENT

Stat
us R
epor
t 202
1IC
AP
06
The public response to the economic impacts of the pandemic also presents a historic opportunity to direct economic stimulus towards low-carbon development.However, net-zero aspirations also raise a host of challenges for ETS policymakers, who need to think more concretely about pathways to net zero, the policies needed to achieve these pathways, and possible changes to carbon markets as we draw nearer to a state of deep decarbonization. ICAP is looking forward to diving deeper into these topics in the coming year through advancing the ICAP work-stream on ETS and net zero.
The public response to the economic impacts of the pandemic also presents a historic opportunity to direct economic stimulus towards low-carbon development, specifically by linking economic recovery packages to climate objectives. Under the European Green Deal, the EU is explicitly pursuing a recovery agenda oriented around a green and digital transition. The UK and Republic of Korea have also committed to greening their recovery packages. In the US, Pres-ident Biden has articulated the strategic link between pandemic recovery and climate investment, proposing the USD 2 trillion ‘Build Back Better’ program. These green recovery plans foresee major investment in low-carbon infrastructure and human capital, while explicitly striving for a just transition. While a range of investments, subsidies and direct regulatory policies will be central to achieving green recovery goals around the world, well-designed ETSs are a key strategy to advancing these objectives. ETS auction revenue is also an important resource that policymakers can use to counter distributional effects and support the social and environmental objectives of green recovery packages.
In the past year, emissions trading systems have shown their mettle, withstanding a real-world test of resilience and demon-strating that well-designed carbon markets, while more complex than some other climate policies, are reliable and robust instru-ments that will play a fundamental role in achieving net-zero targets. Evidence from well-functioning and resilient markets is steadily building trust in the ability of ETSs to achieve cost- effective mitigation, while also maintaining economic compet-itiveness and fostering low-carbon investment. Policymakers can now look with more confidence to develop and expand their
systems as they work towards meeting increasing levels of ambi-tion. Several jurisdictions are considering more ambitious econo-my-wide targets, while discussing options to increase the stringency of ETS caps, broaden the scope of existing systems and develop new systems in previously uncovered sectors. Examples include Germany’s new national ETS for transport and heating fuels that will work alongside the energy and industrial coverage of the EU ETS, and New Zealand’s efforts to put a carbon price on the agriculture sector. These innovations have run in parallel to key policy devel-opments in China that have paved the way for the world’s largest carbon market. ICAP continues to contribute to ETS developments by, for example, convening technical dialogue among our members, aimed at drawing together their rich experience in designing and operating an ETS across a range of sectors.
As we look ahead, we anticipate increasing momentum for the expansion of ETS policy, both in existing and newly emerging markets. ETS will become ever more relevant as a tried and trusted instrument with proven resilience. As we continue to adapt and improve our systems, we will strive to incorporate lessons and implement best practices to make our markets even more resilient. By engaging with each other through ICAP, we can actively support this process, with our diversity being our key strength. As policy-makers implement robust ETS policies at home, we are also gener-ating a world of practical knowledge from myriad perspectives. ICAP continues to provide an ideal forum to make the most of this wealth of ETS expertise, and our collaborations will ultimately create more robust and resilient carbon markets. And this starts when we reach out and engage with our peers around the world, share experi-ences and lessons learned, and cross-pollinate ideas to achieve our climate targets.
BEATRIZ YORDICo-chair of the International Carbon Action Partnership and Director of Euro-pean and International Carbon Markets, Directorate-General for Climate Action, European Commission
RAJINDER SAHOTACo-chair of the International Carbon Action Partnership and Chief of the Industrial Strategies Division,California Air Resources Board
← CONTENT

Stat
us R
epor
t 202
1IC
AP
07
EXECUTIVE SUMMARYThe economic impact of the COVID-19 pandemic had the poten-tial to shock carbon markets around the world. However, markets demonstrated remarkable resilience, first reacting rationally to lower demand through price decreases, and then returning to near-normal functioning. Compared to after the global financial crisis, ETSs have weathered the shock without major effects. Market resilience can be attributed to two factors. First, market stability measures imple-mented in the last years have provided rule-based and predictable tools to support market function and adjust to structural imbalances. Secondly, ETS reforms have been embedded in overarching policy frameworks, more ambitious 2030 targets, and long-term net-zero commitments, fostering policy certainty and longevity.
Over the last year, jurisdictions worldwide have demonstrated their commitment to achieving net-zero emissions by announcing high-level pledges and/or embedding targets in law. Furthermore, as jurisdictions create pandemic economic recovery packages, some, such as the European Union, United Kingdom, the Republic of Korea, and the United States, are linking their plans to low-carbon develop-ment goals and greening their recovery spending. Meeting net-zero targets will require a concerted long-term approach that could bring the Paris Agreement goals within reach. Although a range of invest-ments, subsidies and regulatory policies will be required, a well-de-signed ETS is a key strategy in advancing these objectives.
Thus, experience has now shown that well-designed ETSs are resilient to economic shocks and that policymakers can be more confident in developing and expanding their systems through more ambitious caps and broader scope coverage. In the last year, several jurisdictions have worked to expand ETSs into new sectors, policy developments in China have paved the way for the world’s largest carbon market, and new systems have been announced around the world. Looking ahead, ETS will become even more relevant as a tried and trusted instrument that jurisdictions can rely on to achieve their climate targets. ICAP continues to be an ideal forum to collab-orate on ETSs, by engaging with policymakers as they build ever more robust, resilient, and ambitious systems.
This edition of the International Carbon Action Partnership’s (ICAPs) Emissions Trading Worldwide report outlines the key developments and trends over the past year. It presents infographics examining and comparing key ETS facts and figures and detailed factsheets on each system currently in force, under development, or under consideration. The Status Report also features articles from poli-cymakers and experts in key ETS jurisdictions that provide insights into recent policy developments, responses to the economic impact of COVID-19, and efforts to instill greater climate ambitions.
The European Commission, for example, delves into recent devel-opments and prospects for the EU ETS. Following a strong year in 2019, the EU carbon market passed a resilience test in 2020, as EU ETS market prices rebounded soon after the initial impact of the pandemic. The response is attributed to a robust carbon market
framework with an effective MSR, providing long-term policy certainty at the EU level. Looking ahead, the Green Deal recovery package and new 2030 targets encapsulated in the EU Climate Law are set to drive even greater climate ambition. Carbon pricing will be instrumental in delivering objectives, with the upcoming revision of the EU ETS further ensuring a long-term, credible price signal. Climate neutrality and green recovery were also key themes this year in the Republic of Korea. Experts at the Korean government research center GIR comment on the advances made in Korea’s long-term climate policy, specifically the Korean commitment to achieve net-zero emissions by 2050 and the release of a Green New Deal framework. They further detail the recent developments in the K-ETS as it moves into Phase 3 and look ahead to aligning the system with steeper reductions projected under the new climate policy framework.
In separate articles, policymakers from the Regional Greenhouse Gas Initiative (RGGI), a collective of 12 US states, and from the New Zealand government, discuss how the impact of COVID-19 affected their systems. RGGI policymakers focus on the evolution of market stability design elements throughout the program, and how existing and pending stability measures have contributed to maintaining a functional and resilient carbon market. The New Zealand govern-ment recounts its experience with implementing major structural changes to the NZ ETS during the COVID-19 lockdown, including setting an emissions cap on the NZ ETS, introducing auctioning, and developing new price control mechanisms. They also outline the impacts of the pandemic on market price and functioning and look towards the full implementation of a newly reformed ETS.
The UK Government also looks ahead, outlining recent important developments in UK climate policy, including the world’s first net-zero legislation and the decision to establish a UK ETS, which entered into force at the start of 2021. The UK’s approach provides continuity for businesses after Brexit enables emissions trajectories to be aligned with net-zero targets and empowers policymakers to expand both the ambition and scope of the ETS. Policymakers in the UK are optimistic that despite the current challenges, there are opportunities to be realized in the transition to a green economy and the recovery from the COVID-19 pandemic.
Finally, experts from SinoCarbon, a key Chinese think tank, discuss how over the last year China has made progress with commitments and policy. At the highest political level, China has decided to pursue a green development strategy for high-quality growth, with Pres-ident Xi Jinping pledging to peak CO2 emissions before 2030 and achieve carbon neutrality by 2060. In early 2021, after releasing the final allocation plan for the power sector and the legal and admin-istrative arrangements, the Ministry of Ecology and Environment officially announced that the national ETS had entered operation with the start of compliance obligations. SinoCarbon also discusses China’s green development strategy and how the national ETS fits into the puzzle.
← CONTENT

Stat
us R
epor
t 202
1IC
AP
081 – The developments in Finland were announced after the editorial cut-off date for the 2021 ICAP Status Report and are therefore summarized only briefly here. For more information, please refer to the ICAP website.
A YEAR OF ETS DEVELOPMENTS
Over the course of 2020, emissions trading systems underwent a range of developments, with some fine-tuning and enhancing system coverage and flexibility, and others launching into operation. New systems are also in the making, as jurisdictions work to design and implement anticipated ETSs. Here we summarize updates from the systems currently in force (i.e., those already in operation) and those under development (i.e., jurisdictions in which a mandate for an ETS is in place, and where system rules are currently being drafted), as well as other jurisdictions with major ETS developments in 2020.
Europe and Central Asia
• European Union: Started Phase 4 in 2021, with a steeper annual cap reduction factor of 2.2%, revised free allocation bench-marks, and launched the Modernization Fund and Innovation Fund. Revisions to align the ETS with the EU’s 2030 Climate Plan are to be presented by mid-2021. These may include a possible expansion of the system’s scope, revisions to the Market Stability Reserve, and a carbon border adjustment mechanism to protect against carbon leakage. The link with the Swiss ETS became operational in September 2020. As of January 2021, UK installa-tions are no longer covered by the EU ETS.
• Germany: A national ETS was introduced in 2021, covering heating and transport fuels upstream. With the EU ETS covering Germany’s energy, industry, and domestic aviation sectors, most major sectors in Germany are now covered by an ETS. The national system will be phased in gradually, with an annually increasing fixed price per tCO2 from 2021 to 2025 and auctioning from 2026. A price corridor during auctions will apply in 2026 and, depending on decisions to be made in 2025, potentially also thereafter. The cap will be determined annually based on Germa-ny’s reduction targets for non-EU ETS sectors as defined by the ‘European Effort Sharing Regulation’. A Carbon Leakage Regula-tion and a Cap Setting Regulation are expected in mid-2021.
• Finland: The government has appointed an intersectoral working group of public officials to assess and prepare for an emissions trading scheme in the transport sector.1
• Kazakhstan: Completed the final year of the system’s third phase, during which participating operators could choose between grandparenting and product-based benchmarking as the allocation method. Operators participating in the fourth phase must use benchmarking as the method of allocation. A new National Allocation Plan was also issued, setting the cap for 2021.
• Montenegro: ETS legislation was adopted in 2020, launching preparations for the development of a domestic system that would enable Montenegro to take part in the EU ETS should it become a member state of the European Union.
• Sakhalin (Russia): A mandate was created for a pilot carbon trading system in the Sakhalin region, in cooperation with the Russian government. The system could begin operating as early as 2022.
• Switzerland: Completed the second trading period (2013 –2020). A provisional registry link between the EU ETS and the Swiss system launched in September 2020, allowing the transfer of allowances on specific dates. Changes to the Swiss system in line with the EU ETS include a revised linear reduction factor from 1.74% to 2.2%, updated benchmarks to be implemented by 2022, and an indefinite extension of the system.
• Ukraine: An MRV law entered into force in 2020 and applies to installations beginning in 2021. A recent statement by the Minister of Environmental Protection and Natural Resources suggests the ETS could launch in 2025.
• United Kingdom: Launched its own domestic ETS at the start of 2021, after 2020 was the last compliance year for UK installa-tions under the EU ETS. The UK ETS design mostly mirrors the EU ETS Phase 4. The cap is initially set at 5% below the UK’s notional share of the EU ETS cap, will be reduced annually, and is aligned with the country’s legislated net-zero target. The UK is considering expanding the scope beyond power, industry, and domestic aviation and is open to linking with other systems.
North America
• California: Key amendments to the system took effect in January 2021. These include changes to allowance price containment provisions, reductions in the use of offset credits, and a sharper cap decline to 2030. The amendments stem from a regulatory overhaul in 2018 in response to state legislation clarifying the role of the program after 2020.
• Massachusetts: 2020 saw an increase in the share of allow-ances auctioned, with the system planning to increase to full auctioning in 2021. The system covers the power sector and complements RGGI.
• Nova Scotia: Held its first auction in June 2020 and sold all allowances on offer.
• Oregon: After several attempts to pass ETS legislation, an exec-utive order was issued in 2020 mandating an emissions ‘Cap and Reduce Program’ for large emitters and transportation fuels. Program options and design elements were studied and work-shopped during 2020.
• Pennsylvania: In its aim to join RGGI, Pennsylvania released a draft regulation in 2020 for a power sector ETS that aligns with the RGGI Model Rule. After public consultation and regulatory review, a final regulation is expected in 2021. Pennsylvania is expected to join RGGI and start participating in the ETS in 2022.
• Québec: Passed environmental legislation that also impacts the cap-and-trade program, including dedicating all revenue from the program to climate change measures as well as allowing regulators to enact reforms to industrial allocation aimed at better supporting decarbonization. Québec also updated its climate action plan for 2030, which includes the aim of achieving carbon neutrality by 2050.
• Regional Greenhouse Gas Initiative: Following the adoption of post-2020 regulations by each RGGI state, tighter annual cap reduction factors and an emissions containment reserve apply to all 12 participating states from 2021 onwards. Virginia joined RGGI in January 2021. Pennsylvania is also developing a power sector ETS and is expected to join the RGGI program in 2022.
• Transport and Climate Initiative: In December 2020, Massachu-setts, Connecticut, Rhode Island, and Washington D.C. signed a memorandum of understanding to participate in the Transport and Climate Initiative Program (TCI-P). The program caps CO2 emissions from road transport in participating states. Following the development of a Model Rule in 2021, mandatory reporting will begin in 2022, with the first compliance period starting in 2023. Other states also have the option to join the TCI-P.
• Washington: In early 2021, state legislators introduced a bill proposing a cap-and-trade program covering industry, energy, and fuel suppliers. The first compliance period would start in 2023.
← CONTENT

Stat
us R
epor
t 202
1IC
AP
09
Latin America and the Caribbean
• Colombia: Work on the design of a national ETS continues, with technical elements currently under internal revision. Develop-ment of system infrastructure is set to follow, with the pilot phase expected to start between 2023 and 2024.
• Mexico: Completed the first year of the Mexican Pilot ETS in 2020. The registry was developed, and the first allocations took place in early 2021.
Asia Pacific
• China: In late 2020, President Xi pledged to peak China’s emis-sions before 2030 and achieve net zero by 2060. In this context, the Chinese national ETS became operational in 2021 as the world’s largest system, covering more than four billion tCO2 (approximately 40% of national carbon emissions). The system operates as an intensity-based ETS and covers the power sector, with other sectors expected to be introduced later. The national registry and trading platform are currently being developed, and details of key design elements, such as MRV, are being finalised.
• Chinese Pilots: Throughout 2020, the eight Chinese regional ETS pilots continued operating and further developed alloca-tion, offsetting, and trading rules. While the Chinese pilots will initially operate in parallel to the national ETS, it is anticipated that overlapping entities will be gradually integrated into the national market.
• Indonesia: Currently developing a presidential regulation providing a framework for carbon pricing. A limited ETS pilot for the power sector is planned for implementation in 2021.
• Japan: Pledged to reduce emissions to net zero by 2050. Carbon pricing options are under discussion before an expert committee and a voluntary carbon market continues to operate.
• New Zealand: Completed comprehensive legislative reforms in 2020, laying the foundations for new regulatory settings for 2021–2025 in line with newly legislated net-zero targets to 2050. A cap on emissions was established for the first time under the NZ ETS, and auctioning was introduced in March 2021, incorpo-rating new market stability measures. Other reforms include the phase down of free allocation for EITE activities, forestry sector accounting changes, and plans to put a price on agricultural emissions by 2025.
• Philippines: A bill with provisions for a domestic cap-and-trade system for the industrial and commercial sectors was submitted in 2020. The proposed bill is being reviewed by a technical working group.
• Republic of Korea: Phase 3 is set to start in 2021 with a stricter cap, updated allocation provisions, and financial intermediary and other third party participation in the secondary market. The share of auctioning for non-EITE sectors was increased to 10% in Phase 3, while the number of offsets allowed in the system was reduced. The system’s scope will expand to include construc-tion industries and large transport companies. Following Korea’s announcement to reach net-zero emissions by 2050, updates across the climate policy framework are expected to be announced in the coming years.
• Taiwan, China: An act creating a mandate for an ETS is currently under revision.
• Thailand: Through 2020, MRV systems were developed for addi-tional sectors under the voluntary ETS. An ETS pilot is currently being planned for the Eastern Economic Corridor region, and work is beginning on developing national ETS legislation.
• Tokyo and Saitama: Linked since 2011, these two systems continue to drive emissions reductions in large buildings and factories. They both entered their third compliance period in April 2020.
• Vietnam: The legal mandate for a domestic ETS was adopted in 2020. A pilot system is expected to start by 2025 and become fully operational by 2027.
ICAP and the years ahead
The COVID-19 pandemic and climate change are the global crises of our time, as both of these great challenges have affected every corner of the world and threaten our public health, environment, economies, and ways of life. Well-designed emissions trading systems capable of responding to short-term shocks and supporting long-term, ambitious climate goals will be crucial to driving neces-sary deep decarbonization and low-carbon investment. ICAP is a forum for policymakers worldwide to share best practices and learn from experiences designing and implementing emissions trading systems. We look forward to continuing to stimulate discussions in an ever-expanding circle of peers dedicated to using carbon markets as a key tool on the path towards a net zero consistent recovery.
← CONTENT

PRACTITIONER INSIGHTS 01

Chin
a PR
ACTI
TIO
NER
INSI
GHTS
–
Stat
us R
epor
t 202
1IC
AP
11
01
In response to the COVID-19 pandemic, China has chosen green development to achieve economic recovery and high-quality growth. After President Xi Jinping’s pledge in September 2020 to peak China’s CO2 emissions before 2030 and achieve carbon neutrality by 2060, attention on climate policy has reached new highs and turned to domestic implementation. The Chinese government is formulating an action plan for peaking its CO2 emissions, with targets and preparation at the provincial level. A low emission development path in line with the peaking target will be mainstreamed into the 14th Five-Year Plan for National Economic and Social Development this year. The national ETS, a key pillar of China’s vision for low-carbon development, made a breakthrough at the end of 2020 and early 2021. After releasing the final alloca-tion plan for the power sector and a document providing the legal and administrative arrangements for China's national ETS, the Ministry of Ecology and Environment (MEE) officially announced the start of the first compli-ance cycle in January 2021, ending in December 2021.
NATIONAL ETS STARTS FIRST COMPLIANCE CYCLE
Details on the implementation of surrender obliga-tions are not yet clear, but MEE’s announcement means this will certainly take place in 2021. Two outstanding issues remain. First, emissions of covered entities and their allowance levels need to be confirmed. Provincial authorities are required to calculate and pre-allo-cate allowances for 2019 and 2020 to covered entities. Secondly, MEE needs to launch the national registry and trading platform. According to the national allocation plan, entities will likely need to comply for both 2019 and 2020.
The implementation of the national ETS will follow the Work Plan for Construction of the national ETS (Power Sector), which was released in 2017 by the National Devel-opment and Reform Commission before responsibility was shifted to MEE. The national ETS was prepared based on experiences of the past years, in particular China’s eight regional pilots.
DESIGN AND GOVERNANCE OF THE NATIONAL ETS
A three-tiered governance structure
MEE acts as the national competent authority setting the rules and overseeing the system, with joint oversight of trading activities with other regulators, while its subsid-iaries at the provincial level oversee the implementation of these rules and the municipal-level authorities take on some management duties locally.
Monitoring, reporting, and verification (MRV)
The MRV framework of the national ETS builds on the experience of historical emissions data collection in past years, with some adjustments to integrate the carbon market into the existing environmental governance struc-ture and mechanisms. Two draft technical documents on MRV were released in December 2020. The “Guidelines on Enterprise Greenhouse Gas Emissions Accounting and Reporting − Power Generation Facilities” build on two existing technical guidelines and aim to establish the MRV foundation for the national ETS. The “Guidelines for Enterprise Greenhouse Gas Verification (Trial)” build on a previous document from 2016 and provide further details on verification.
System coverage
The power sector is the first covered by China's national ETS, with others to be added gradually during the coming Five-Year Plan, such as steel, aluminum, and other industrial materials. The threshold for coverage under the ETS is 26,000 tons of CO2 annually for one company (including indirect emissions), resulting in 2,245 covered entities (see Figure 1). The scope of compliance obligation is the direct and indirect CO2 emissions from power generation, which amounts to 4 billion MtCO2 and accounts for around 40% of national carbon emissions. For comparison, the eight regional pilots cover about 1.27 billion MtCO2, around 30% of the national ETS.
Cap-setting
The national ETS adopts a bottom-up approach to cap-setting (see Figure 2). Based on the allocation plan, provincial Ecology and Environment Bureaus (EEBs) calculate the allowances of the covered entities within their jurisdiction and report them to MEE, which confirms the allowances of each province and sums them to get the cap of the national ETS.
CHINA World’s largest ETS goes live Chen Zhibin and Qian Guoqiang → SinoCarbon Innovation & Investment Co., Ltd
← CONTENT

Chin
a PR
ACTI
TIO
NER
INSI
GHTS
–
Stat
us R
epor
t 202
1IC
AP
12
01
China Figure 2
national cap
province1
Company 1
Generator 1
Electricityallowances
Electricityallowances
heatallowances
heatallowances
provincen
Company n
Generator n
MEE adds up to the cap
Provincial EEBs calculate the allowances according to the unified allocation plan
Figure 1: Number of covered entities in each province
Figure 2: Bottom-up cap-setting approach
0
Shan
dong
Shaa
nxi
Jian
gsu
Sich
uan
inne
r Mon
golia
Jilin
Zhej
iang
Jian
gxi
hena
n
hube
i
Shan
xi
Guan
gxi
Corp
s*
*Corps refers to the Xinjiang Production and Construction Corps, a special provincial-level entity.
heilo
ngjia
ng
Fujia
n
Tian
jin
hebe
i
ning
xia
Shan
ghai
Guan
gdon
g
huna
n
Gans
u
Xinj
iang
Guiz
hou
Beiji
ng
anhu
i
Chon
gqin
g
Qin
ghai
Liao
ning
Yunn
an
hain
an
350
50
100
150
200
250
300
338 216 168 141 120 119 95 86 85 76 74 68 64 51 51 50 46 45 43 35 35 34 31 28 28 24 23 19 13 12 7
China Figure 1nu
mbe
rs o
f cov
ered
ent
ities
in e
ach
prov
ince
← CONTENT

Chin
a PR
ACTI
TIO
NER
INSI
GHTS
–
Stat
us R
epor
t 202
1IC
AP
13
01
Types of GeneratorsBenchmarks for
Electricity Supply(tCO2 / MWh)
Benchmarks for heating Supply
(tCO2 / GJ)
Conventional coal-fired generators with installed capacity above 300 MW 0.877 0.126
Conventional coal-fired generators with installed capacity below 300 MW 0.979 0.126
Unconventional coal-fired generators 1.146 0.126
Gas-fired generators 0.392 0.059
Load factor (F) Ff
F≥85% 1.0
80%≤F<85% 1+0.0014 × (85 – 100F)
75%≤F<80% 1.007+0.0016 × (80 – 100F)
F<75% 1.015(16 – 20F)
Allowance allocation for 2019 and 2020
The allocation plan provides 100% free allocation for 2019 and 2020 at benchmark levels with a correction factor. The allocation plan adopts benchmarking as the main allocation approach and includes processes for pre-allo-cation based on 2018 data and ex-post adjustments (final allocation) after the verification of 2019 and 2020 emis-sion data. Auctioning will be introduced gradually, but there is not yet a timeline.
There are four distinct benchmarks based on type of power generation (see Table 1). In addition, an adjust-ment factor is used that allocates more allowances for entities operating at output below 85% (see Table 2). This is designed to help less efficient facilities transition to the ETS.
The allowance formula for one generator A=Ae+Ah
A—Total CO2 allowance of the generator (unit: tCO2)Ae—CO2 allowance of the electricity supply (unit: tCO2)Ah—CO2 allowance of the heating supply (unit: tCO2)
The formula for electricity supplyAe=Qe×Be×Fl×Fr×Ff
Qe—Electricity supply (unit: MWh)Be—Benchmarks of electricity supply (Table 1)Fl—The correction factor of the cooling mode: 1 for water cooling, 1.05 for air cooling.Fr—The correction factor of heat supply: 1-0.25×heat supply ratio.Ff—The correction factor of the load factor. For general coal-fired generators, this factor follows Table 2. For other generators, this factor is 1.
The formula for heating supplyAh=Qh×Bh
Qh—Heating supply of the generator set (unit: GJ)Bh—The CO2 emission benchmarks for heating supply (Table 1)
Table 1: Benchmarks for different generators for 2019–2020
Table 2: The correction factor of the load factor
Registry and exchange
Hubei and Shanghai are working on the readiness of the registry and exchange system, respectively. In December 2020, MEE released the draft “Administrative Measures for the Registration, Trading, and Settlement of the National Carbon Emission Rights (Trial)”. The Provincial Ecology and Environment Bureaus already collected the informa-tion of covered entities for opening accounts in the two systems and submitted it to MEE. The first trading of emis-sion allowances is anticipated to take place by mid-year.
Compliance
For 2019 and 2020, compliance obligations are limited. For gas-fired plants they will be capped at the level of free allocation. Advanced gas-fired plants can sell surplus allowances. Other covered entities will need to surrender allowances of up to 20% of verified emissions above the level of free allocation. These measures aim to promote gas-fired units and reduce the overall compliance burden.
The fine for non-compliance is CNY 20,000 to 30,000 (~USD 1,500 to ~USD 4,500) in total. Any gap between compliance obligation and allowances submitted shall also be deducted from the following year’s allocation. In the future, the State Council national ETS regulation will impose a penalty of 2–5 times the average market price.
← CONTENT

Chin
a PR
ACTI
TIO
NER
INSI
GHTS
–
Stat
us R
epor
t 202
1IC
AP
14
01
CONTINUOUS RUNNING OF REGIONAL MARKETS
In the past year, eight Chinese regional ETS pilots have continued their operation and policy modifications. Due to the impact of the pandemic, 2019 compliance timelines across the regional systems were postponed. As the country recovered gradually in the middle of the year, most regional pilots finished their regular ETS management tasks with a few months of delay. With the announcement of a national carbon neutrality pledge, investor confidence grew in the last quarter. Prices in 2020 were largely unaffected overall (see Figure 3), with average prices in all regional markets increasing 25% over 2019, though trading volumes were down 17%.
Figure 3: Average trading price in regional markets
According to the national allocation plan, those markets that have already allocated 2019 and/or 2020 allowances will maintain authority over the power sector for the respective year(s). All regional markets have allocated 2019 allowances, while only Guangdong, Fujian, and Tianjin have already allocated 2020 allowances. For 2021, the power sector in all regional markets will be covered in the national ETS, while other sectors will continue to fall under the regional markets until they are brought into the national system.
Three years after the political launch of China’s national ETS kickstarted planning and consultations, and in the midst of a worldwide pandemic, the world’s largest carbon market is now online and ready to play its role in China’s vision for low-carbon development.
all markets
Fujian
Chongqing
hubei
Tianjin
Guangdong
BeijingShanghai
Shenzhen
2013
59.4
16.2
22.9
28.6
2014 2015 2017 2018 2019 202020160
40
20
60
80
annu
al a
vera
ge p
rice
(CnY
)
← CONTENT

EUrO
pEan
Uni
On
PRAC
TITI
ONE
R IN
SIGH
TS –
St
atus
Rep
ort 2
021
ICAP
15
01
EUROPEAN UNION The resilience test of 2020 and the road ahead Beatriz Yordi → European Commission
The year 2019 was important for the functioning of the EU ETS. The Market Stability Reserve (MSR) became opera-tional and began gradually removing the structural surplus of allowances built up in the system. We saw the EU ETS deliver on its environmental objective again, showing strong promise for the next trading phase running from 2021 until 2030. Emissions from stationary installations decreased by 9.1% relative to 2018 emissions. The carbon price signal remained strong, levelling at an average of almost EUR 25 (USD 28.55) per tonne CO2e. As a result, a total of EUR 14 billion (USD 16 billion) in auction revenues was distributed to Member States and largely directed to climate- and energy-related purposes.
We also saw the carbon price reflected in investment decisions and strategic planning, which in turn translated into tangible results. Coal-to-gas switching and increased deployment of renewable energy capacity yielded an overall decrease of emissions in the power sector of 15%. While this largely drove 2019 emissions reductions under the EU ETS, industrial emissions experienced their biggest annual drop of the third trading phase, running from 2013 until 2020. Only emissions from the aviation sector within the European Economic Area continued to increase, albeit modestly, by 1% relative to 2018.
The year 2020, however, has painted a far more compli-cated picture. The COVID-19 pandemic spared no country, no sector, and no market, causing economic downturn and disrupting supply chains. Nevertheless, the EU ETS passed this resilience test. After a significant short-term dip in March/April 2020, the carbon price grad-ually bounced back to pre-pandemic levels and remains strong. This can be attributed to a robust carbon market framework and long-term policy certainty at the EU level.
Owing to the MSR and the 2018 ETS revisions for the fourth trading phase, the EU ETS is better equipped to deal with economic shocks than during the Great Reces-sion just a decade ago. Should a significant imbalance of allowances arise threatening to undermine the orderly functioning of the market, the MSR adjusts the supply of allowances to be auctioned accordingly. The carbon market is also forward-looking, whereby the long-term outlook for market scarcity remains key for the carbon price development.
Here, the European Green Deal1 provides an explicit long-term policy context – an action plan to becoming the first climate-neutral continent by mid-century, calling on all sectors of the economy to contribute. Presented
1 – https://eur-lex.europa.eu/legal-content/EN/TXT/?uri=CELEX%3A52019DC0640&qid=1608201512919
EU Figure 1
TheEuropean
Green deal
Transforming the EU’s economy for a sustainable future
The EU as a global leader
Financing the transition
Building and renovating in an energy and resource eff icient way
accelerating the shift to sustainable and smart mobility
Mobilizing industry for a clean and circular economy
From ʻFarm to Fork’: a fair, healthy and environmentally friendly food system
Supplying clean, aff ordable and secure energy
preserving and restoring ecosystems and biodiversity
increasing the EU’s Climate ambition for 2030 and 2050
a zero pollution ambition for a toxic-free environment
Mobilizing research and fostering innovation
Leave no one behind (Just Transition)
A European Climate Pact
and leave no one behind
Figure 1: The European Green Deal – the EU’s growth and green recovery agenda
← CONTENT

EUrO
pEan
Uni
On
PRAC
TITI
ONE
R IN
SIGH
TS –
St
atus
Rep
ort 2
021
ICAP
16
01
by the European Commission in late 2019 as the new growth strategy for the EU, the Green Deal has become the EU’s recovery agenda (Figure 1). It aims to make the EU’s economy sustainable, foster resilience, improve the health of our environment, and achieve this transition in a socially fair manner. This is reflected in the historic Recovery and Resilience Facility2 put forward by the Commission, centered on the twin green and digital tran-sitions, as well as announced policy initiatives.
The Climate Law3 proposes a legally binding target of climate neutrality by 2050 as well as addresses the steps necessary to deliver on this objective in a gradual and responsible manner. This includes increasing the EU’s 2030 emissions reduction target from 40% to at least 55% relative to 1990 levels, including emissions and removals. The proposal garnered broad support, as all Member States endorsed the initiative at the Euro-pean Council’s summit in December 2020. This year the Commission will come forward with an enabling policy package necessary to deliver the additional emissions reductions for 2030, including revisions to existing policy instruments like the ETS.
Carbon pricing will be instrumental in delivering on this increased climate ambition and supporting a green economic recovery – by providing an incentive for emis-sions reductions and low-carbon investment as well as mobilizing resources that can be re-invested in the economy in support of these objectives. Investment choices made today will define our economy in 2050, and investment is needed across all sectors in support of the EU’s economic recovery. We thus need to make sure that today’s choices will not jeopardize our climate ambitions. As we work towards a revision of the ETS, it will be crucial to maintain a long-term, credible carbon price signal, as projects in the ETS sectors are characterized by high capital expenditure and long payback periods.
To further enable climate-proof investments, specific policy choices in the ETS revision will have to consider not only elements of its framework, but also their bearing on sectoral decarbonization i.e. alignment with companion policies deployed under the Green Deal. The European Commission sees important benefits in expanding the use of emissions trading in the EU to new sectors, to deliver the increased climate ambition in an economically efficient manner. In effect, the ETS should be comple-mentary to relevant sectoral companion policies already in place or in development, providing a harmonized signal for emissions abatement. It needs to incentivize producers and consumers to change their behavior and
progressively adopt low-carbon alternatives. To this end, we need the carbon price to be reflected in the prices of goods and services in a transparent way. Furthermore, any expansion of emissions trading will need to effectively mitigate and address adverse distributional impacts of carbon pricing on the most vulnerable, low-income groups. Only by doing so can we advance a transition that is truly just.
The year 2020 concluded an intensive preparatory period for the implementation of the fourth trading phase of the ETS, yet prefaced another – of developing the carbon market framework in step with EU’s increased climate target. While we have 15 years of ETS experience to build on, we need to ensure that it will continue to stand the test of time and turmoil, empowering far-reaching changes in some key sectors of the EU’s economy.
Carbon pricing will be instrumental in delivering on this increased climate ambition and supporting a green economic recovery.
2 – https://ec.europa.eu/info/business-economy-euro/recovery-coronavirus/recovery-and-resilience-facility_en3 – https://eur-lex.europa.eu/legal-content/EN/TXT/?uri=CELEX:52020PC0563
← CONTENT

ThE
rEpU
BLiC
OF
KOrE
a PR
ACTI
TIO
NER
INSI
GHTS
–
Stat
us R
epor
t 202
1IC
AP
17
01
THE REPUBLIC OF KOREA Looking ahead from COVID-19 to a new trading phase and beyondSungwoo Lee, Kyeongah Ahn, and Younghyun Lee → Greenhouse Gas Inventory and Research Center of Korea (GIR)
AN INTERVIEW
1. The government approved the allocation plan for Phase 3 (2021–2025) in September 2020. What are the main regulatory changes?
Before coming to the ETS, it is important to highlight the broader context of climate policy development in the Republic of Korea over the past year. President Moon Jae-in pledged in October 2020 to embark on a carbon neutrality emissions pathway to be reached by 2050. The updated long-term target is paired with the Green New Deal framework aimed at boosting investment in low-carbon technologies and accelerating the decou-pling of emissions from economic growth.
The Korea Emissions Trading System (K-ETS) is one of the Republic of Korea's main climate policy instruments and will hence play a major role in reducing emissions in line with steeper reductions projected under the new climate policy framework. It is anticipated that the targets of the ETS will be gradually expanded to achieve carbon neutrality in 2050. We may therefore expect further changes to the system in the coming years consistent with a net-zero emissions pathway. The Phase 3 Alloca-tion Plan was approved in September 2020 and preceded by a revision to the ETS Act in August 2020, which enabled the implementation of several reforms that are key to the third trading phase, such as the broadening of market participation to non-compliance entities, which can trade allowances starting this year.
In Phase 2 (2018–2020) of the K-ETS, the liable entities were classified into six sectors and 62 sub-sectors. They were subject to free allocation (36 sub-sectors) and auctioning (26 sub-sectors) after analyzing international competitiveness, trade intensity, production cost, and other factors. More sub-sectors, 69 in total, are included in Phase 3, which means more industries will share respon-sibility in achieving the national emissions reduction target. With the inclusion of additional sectors in Phase 3, the K-ETS covers about 73% of national emissions. The cap was calculated in alignment with the national reduc-tion target in 2030.
When auctioning was first introduced, 3% of the allocated amount was deducted from entities in sub-sec-tors subject to auctioning, those not considered at risk of carbon leakage. In Phase 3, the percentage has been increased to 10% of the allocated amount in accordance with practices in other ETSs, the “polluter pays” principle, and other K-ETS objectives.
Emission permits are allocated using either grandpar-enting or benchmarking. In Phase 1, three sub-sectors were subject to benchmarking, gradually increasing to 12 in Phase 3.
In Phase 3, market functions are going to be expanded by allowing additional participants and introducing deriva-tives. Currently, only liable entities and designated banks can trade emission permits in the exchange market, but other participants such as securities companies and indi-viduals are expected to join the market and trade more products in Phase 3.
In Phase 3, market functions are going to be expanded by allowing additional participants and introducing derivatives.
← CONTENT

ThE
rEpU
BLiC
OF
KOrE
a PR
ACTI
TIO
NER
INSI
GHTS
–
Stat
us R
epor
t 202
1IC
AP
18
01
2.Could you provide an overview of price devel-opments in the past year, including the impact of COVID-19?
To begin with the broader picture, prices rose steadily during Phase 2. The average price of a Korea Allowance Unit (KAU) during Phase 1 (2015–2017) was KRW 16,661 (USD 14.12) and rose to KRW 27,926 (USD 23.66) in Phase 2’s second compliance year (ending September 2020), an increase of 68%.
Overall, the introduction of market makers in 2019 has played a stabilizing role for prices in the latter half of Phase 2. They act as additional sellers and buyers of allowances to ensure liquidity in the market, taking part in the market when the price sharply increases or decreases. Their introduction helped moderate prices after a drastic change in price levels in June 2019, for instance. By intro-ducing market makers, the share of competitive, real-time trading transactions dramatically improved, indicating that their intervention is revitalizing the market.
However, price development of KAUs was more turbulent in 2020. The market reached a peak in early April 2020, when the price rose to KRW 42,400 (USD 35.92), but fell sharply from May onwards as the effect of COVID-19 on emissions for the 2020 trading year factored in. At the same time, it became clear that emissions for 2019 had decreased more than initially projected, thereby exerting downward pressure on allowance demand ahead of the compliance deadline. KAU prices recovered to KRW 20,000 (USD 16.95) in August 2020 and climbed back to KRW 30,500 (USD 25.84) in December before closing the year at KRW 23,000 (USD 19.49). 3. What is the expected impact of Phase 3 changes on market dynamics and emissions?
Increased participants and products will bring more stability to trading conditions and flexibility to trading volumes. Those developments are expected to invigorate the market and further enhance its functioning as well as bringing about continued and greater reductions in GHG emissions.
As the introduction of market makers helped revitalize the K-ETS and improve market functioning in Phase 2, we expect similar effects from the introduction of deriva-tive products and third-party transactions in Phase 3. The participation of securities companies and individuals in financial institutions other than the covered entities will be allowed. Within a certain limit, financial institu-tions will be able to trade themselves, while individuals will be allowed to trade on consignment. In addition, by introducing futures trading, the aim is to enhance price discovery and expand the predictability of the market.
Increased participants and products will bring more stability to trading conditions and flexibility to trading volumes.
← CONTENT

nEW
ZEa
Land
PR
ACTI
TIO
NER
INSI
GHTS
–
Stat
us R
epor
t 202
1IC
AP
19
01
NEW ZEALAND Achieving major structural changes to the NZ ETS during a global pandemic Vanessa Chalk → New Zealand Ministry for the Environment
NEW ZEALAND EMISSIONS TRADING SCHEME LEGISLATIVE REFORMS
Significant reforms to the New Zealand Emissions Trading Scheme (NZ ETS) were passed into law on 16 June 2020, culminating nearly five years of policy development and public consultation. The legislative reforms encompass major structural changes to the NZ ETS that are designed to support domestic emissions reduction targets by setting an emissions cap on the NZ ETS, introducing New Zealand emissions unit (NZU) auctioning, and developing new NZU price control mech-anisms. The broad array of reforms also includes changes to accounting methods for calculating unit allocation to foresters and the removal of the fixed price option (FPO), a type of price ceiling that allowed participants to pay NZD 25 (USD 16.23) cash per tonne of carbon instead of surrendering units.
The reforms1 were passed despite the major widespread challenges of COVID-19, which included the delay of the New Zealand election by a month and short-term restric-tions to the capacity of Parliament to address non-urgent matters. The major opposition party called for imple-mentation of the Climate Change Response (Emissions Trading Reform) Amendment Act 20202 to be delayed by 12 months to take the effects of COVID-19 into account, and there was pressure from some NZ ETS participants to relieve them of their 2019 ETS obligations. These requests were not acted on by the government.
COVID-19 IN NEW ZEALAND
The virus in New Zealand was predominantly contained by a full lockdown on 25 March 2020 that was phased out in stages after four weeks. While the New Zealand economy officially fell into recession and experienced a record fall in GDP of over 11%, it bounced back by 14% in the July–September 2020 quarter, the strongest quarterly growth in GDP on record in New Zealand. This is despite some industries still not returning to pre-lockdown levels, such as tourism, which previously directly contributed nearly 6% to New Zealand’s total GDP.
Emissions from transport and industrial activities are expected to have dropped due to the lockdown, but this will not be confirmed until the 2020 national greenhouse gas inventory is published in 2022. Therefore, predicting the long-term impacts of COVID-19 and the swiftly fluctu-ating economy on future emissions and NZ ETS partici-pants is particularly challenging.
IMPACTS ON THE NZ ETS
The reporting deadline for participants to submit emis-sions returns for the 2019 compliance period (for activities over the calendar year) was 31 March 2020, a week after the full lockdown period began. This meant some partic-ipants were physically unable to fulfill their obligations due to the COVID-19 restrictions, for example foresters who needed access to their land to verify activity. Those participants were encouraged to apply for an extension so they could undertake the reporting once restrictions were lifted. Extensions were sought for 49 emissions returns this year. This is a small increase from the previous year, when 30 extension applications were made.
The deadline for unit surrender for the 2019 emissions compliance period was 31 May 2020, soon after the full lockdown ended. Participants were encouraged to volun-tarily disclose to the regulator if they anticipated being unable to meet their unit surrender obligation due to COVID-19 or the lockdown. If participants made this advanced voluntary disclosure, the NZ ETS compliance authority had the discretion to consider a reduction in the penalty fine they would ordinarily receive for their noncompliance by up to 100%. The potential reduction in the penalty fine is separate from the unit surrender obligation, which remained unchanged by this voluntary disclosure.
The rate of unit surrender noncompliance was expected to increase for the 2019 period as participants faced the financial strain of the COVID-19 lockdown immediately prior to the compliance date. However, this did not even-tuate, as COVID-19 did not significantly impact partici-pants’ compliance.
An area that COVID-19 did appear to impact was use of the FPO. The proportion of emitters choosing to pay cash to the government for emission units (which are then immediately transferred back to the government and surrendered), dropped significantly. In 2019, 50% of emissions obligations were met using the NZD 25 (USD 16.23) per emission unit FPO. This dropped to just 21% in 2020, despite near identical prices of the NZU at the time surrenders were due (NZD 24.70 in 2019 vs. NZD 25.00 in 2020). This was presumably caused by a reluctance to spend cash in the uncertain economic times if participants already had NZUs available to use, and less confidence in the future rise of the NZU price. Another influence may have been the drop in
1 – https://www.mfe.govt.nz/overview-reforming-new-zealand-emissions-trading-scheme2 – https://www.legislation.govt.nz/bill/government/2019/0186/latest/whole.html
← CONTENT

nEW
ZEa
Land
PR
ACTI
TIO
NER
INSI
GHTS
–
Stat
us R
epor
t 202
1IC
AP
20
01
NZU prices during the lockdown, and participants may have used that opportunity to purchase sufficient units for compliance below the FPO price.
IMPACTS ON THE NZU PRICE
At the end of 2019, a public consultation document was released that proposed the government’s preferred options for the future NZU auction supply and prices controls. This included an NZD 50.00 (USD 32.47) price trigger for the cost containment reserve. This likely contributed to a rapid price jump from just below NZD 25.00 to NZD 29.00 (USD 18.83) by the end of January 2020 (see Figure 1).
During the COVID-19 lockdown, the NZU price dropped briefly to a low of NZD 22.10 (USD 14.35) at the end of March but recovered very quickly, climbing back to NZD 25.00 by mid-May, above NZD 30.00 (USD 19.48) at the start of June, and over NZD 35.00 (USD 22.73) in September. This is despite an NZD 35 FPO available for all 2020 emissions.
The significant and increasing trajectory of the NZU price indicates that, despite a swiftly fluctuating economy, participants and investors see the implementation of an emissions cap and removal of the FPO as factors that will significantly increase the competitive demand of accessing units.
NEXT STEPS FOR THE NZ ETS
The NZ ETS operation and NZU price held up well throughout the uncertain times of COVID-19 in 2020. However, the impact that COVID-19 will have on the New Zealand economy and how this may flow through to emissions will play a role in the review and develop-ment of future NZ ETS settings regulations. This will occur through choices under the NZ ETS five-year rolling cycle framework.
Future unit supply and auction price control settings are always required to be announced five years in advance to maintain predictability and stability. However, the announced settings must also be reviewed every year and take into consideration any relevant circumstantial changes or adjustments for significant or adverse events, such as COVID-19. This will help to mitigate the risk of substantial oversupply of units. Review of future settings is also required to take place if either the cost containment reserve trigger price or auction reserve price is reached. Other improvements are being considered for future reviews, including changes to forestry accounting, market governance arrangements, and the current approach to free unit allocation to emissions-intensive, trade-exposed businesses.
The reformed scheme officially came into effect on 1 January 2021, and the first government NZU auction took place on 17 March, with 4.75 million units available. With those structural changes in place, New Zealand has laid the foundations for deeper climate ambition as it continues to recover from the impacts of the pandemic and in the critical decades ahead.
Figure 1: NZU prices from late 2019–2020
nZ 1
40
35
30
25
20
15
10
5
0
2/12
/19
16/1
2/19
30/1
2/19
13/0
1/20
27/0
1/20
10/0
2/20
24/0
2/20
9/03
/20
23/0
3/20
COvid-19 lockdown
period
6/04
/20
20/0
4/20
4/05
/20
18/0
5/20
1/06
/20
15/0
6/20
29/0
6/20
13/0
7/20
27/0
7/20
10/0
8/20
24/0
8/20
7/09
/20
21/0
9/20
5/10
/20
19/1
0/20
2/11
/20
16/1
1/20
30/1
1/20
nZU
pric
e (n
Zd)
← CONTENT

rGGi
PR
ACTI
TIO
NER
INSI
GHTS
–
Stat
us R
epor
t 202
1IC
AP
21
01
RGGI Resilience and market stability through program designWilliam Space → Massachusetts Department of Environmental Protection / Brian Woods → Vermont Agency of Natural Resources
The COVID-19 pandemic has focused attention on how carbon markets respond to change. The Regional Green-house Gas Initiative (RGGI) includes design elements that adjust allowance supply when unexpected demand shocks occur. In most years since the program launched in 2009, these elements have influenced allowance prices, making the program more resilient to factors such as unanticipated changes in fuel prices and federal climate policy.
RGGI’s original design included several program elements intended to address the possibility that unanticipated or extraordinary events could increase demand for allowances, such as the loss of a nuclear power plant. To accomplish this, two stages of “trigger events” were defined in the regulation based on observed 12-month average allowance prices. At stage one limits on offset allowance supply and use for compliance were automati-cally relaxed. At stage two limits on offset allowances were further relaxed and the three-year compliance period was extended by one year. While it was important for the initial program design to acknowledge possible high demand for allowances under certain conditions, ultimately these mechanisms were never invoked. Consistent with the experience of many ETSs, the initial regional cap was conservatively established, and subsequent domestic economic conditions resulted in an allowance market that was oversupplied during the first two compliance periods (2009–2014).
In fact, this mismatch between supply and demand was so large that prices might have fallen to zero but for another design element: the minimum reserve price. This minimum bid price, which increases by 2.5% per year, was included in the first RGGI auctions based on advice from auction experts that it could deter buyer-side collusion. However, the mechanism ended up serving the equally important purpose of keeping allowance prices from dropping to zero. The minimum reserve price supported the allowance price over a period of several years, preserving the viability of the market and maintaining allowance revenue, and has remained in place through two program reviews.
Beginning in 2014, the trigger event design elements were replaced with a much simpler mechanism called a cost containment reserve (CCR). This mechanism immediately introduces a fixed quantity of additional allowances into each auction if there is sufficient demand above a set CCR trigger price. Market participants benefit from a more predictable price signal, and observed prices suggest that the CCR likely played a role in price formation and transparency over a period of several years. Based partly on the success of the CCR, a corresponding emission containment reserve (ECR) took effect this year. The ECR functions as a mirror image of the CCR, as it immediately removes allowances from an auction if there is not suffi-cient demand at prices above the ECR trigger price. The expectation that the ECR will support prices after 2020 appears to have already pushed allowance prices into
Figure 1: RGGI's market stability design elements have been revised at each program review
• Extended Compliance periods• international Credit Cancellations• Five Offset project Categories
• Minimum auction reserve price
• Five Offset project Categories with state option to implement
• Minimum auction reserve price• Cost Containment reserve
• Three Offset project Categories with state option to implement
• Minimum auction reserve price• Cost Containment reserve• Emission Containment reserve
2009–2014 2015–2020 2021–2030
← CONTENT

rGGi
PR
ACTI
TIO
NER
INSI
GHTS
–
Stat
us R
epor
t 202
1IC
AP
22
01
the range established by the ECR-CCR trigger prices. The CCR and ECR trigger prices are informed by modeling and represent allowance prices that could be realized in scenarios beyond the high and low emissions cases that were examined during program design.
A market may be considered resilient if it responds to demand shocks without price spikes or crashes. Figure 2 shows that, in most years, RGGI allowance prices appear to have been influenced by at least one price-based design element. This history shows how these design elements have in fact made the program more resilient and enhanced market stability.
The RGGI market response to economic conditions of the COVID-19 pandemic provides a recent example of the resiliency of the market (see Figure 3). Early 2020 pre-pandemic allowance prices in the futures and allow-ance markets were relatively stable, averaging USD 5.77. Imposition of coronavirus management measures in the US in early March resulted in a drop in futures prices to USD 4.69, followed by a rapid recovery by early April. By the June 2020 auction the futures market had stabilized and prices had returned to their pre-pandemic levels. This response reflected short-term uncertainty that was
followed by data showing that demand for electricity was not going to be affected nearly as much as was the case for liquid transportation fuels. While it is not possible to know what the market response would have been absent the existing and pending stability measures, it is clear from this example that RGGI can and does exhibit the characteristics of a functional, resilient carbon market.
In developing RGGI’s newest design element, the ECR, RGGI staff drew on the EU ETS Market Stability Reserve (MSR) mechanism. In particular, the CCR/ECR combina-tion builds on the MSR experience in its use of similar design elements to address high and low allowance demand, which contrasts with the original RGGI program design. In a similar manner, the RGGI history presented here may offer lessons that can help other programs inno-vate to become more resilient.
How the ECR and CCR support market stability
• in the near term, the ECr and CCr can automatically adjust allowance supply to compensate for demand shocks. For example, the pandemic may affect near-term allowance demand for compliance entities.
• in the longer term, the ECr and CCr reduce the likelihood of allowance prices below or above the corresponding trigger prices. This deters trading of allowances at prices outside this range and creates a more stable market for compliance.
2008
2009
2010
2011
2012
2013
2014
2015
2016
2017
2018
2019
2020
2021
2022
2023
pric
e (U
Sd)
15
12
9
6
3
0allowance price
Minimum reserve price
Stage Two Threshold price
Stage One Threshold price
Cost Containment reserve
Emission Containment reserve
Figure 2: RGGI's market stability design elements have strengthened market performance
Figure 3: RGGI market prices January-June 2020
12.1
0.20
19
1.12
.201
9
20.0
1.20
20
10.0
3.20
20
29.0
4.20
20
18.0
6.20
20
pric
e (U
Sd)
0
1
2
3
4
5
6
7
auction clearing priceFutures price (iCE)
← CONTENT

UniT
Ed K
inGd
OM
PR
ACTI
TIO
NER
INSI
GHTS
–
Stat
us R
epor
t 202
1IC
AP
23
01
UNITED KINGDOM A net-zero cap-and-trade market Charlie Lewis → UK Department for Business, Energy and Industrial Strategy
The new UK Emissions Trading Scheme came into force on 1 January 2021, increasing the climate ambition of the UK’s carbon pricing policy. The UK was a pioneer of emissions trading when it set up the first cap-and-trade scheme in 2002 and will continue to be a world leader in carbon pricing as the government builds towards hosting the United Nations Climate Change Conference of the Parties (COP26) in Glasgow at the end of the year.In 2019 the UK was the first major economy to legislate for net-zero emissions, with a target of 2050. The UK ETS will be among the first cap-and-trade markets aligned with net zero, and is a crucial step in achieving this goal. From day one, the cap on emissions was reduced by 5% compared to the UK’s notional share of the European Union (EU) ETS cap.
The UK government and devolved administrations will consult on aligning the ETS cap with the net-zero target. The consultation follows the advice recently published by the UK’s independent Climate Change Committee (CCC) on the UK’s carbon budget for 2033–2037. The UK has already accepted the CCC’s advice on its 2030 Nation-ally Determined Contribution (NDC), in December 2020 committing to a more ambitious target of at least 68% below 1990 emissions.
THE SCALE OF THE CHALLENGE
The UK government and devolved administrations are united in their determination to address climate change. The UK ETS was designed by the UK government jointly with the Scottish government, Welsh government, and Northern Ireland executive.
The scale of the challenge in the UK is clear, but so are the opportunities presented by the transition to a green economy and the recovery from the COVID-19 pandemic. Policy action has spurred rapid decarbonization in the power sector, with emissions from electricity generation in 2019 down by 72% from 1990 levels (see Figure 1).1
Industrial emissions have also halved, but the remaining reduction required for industry to be consistent with net zero is equivalent to taking all the cars in the UK off the road.2 Overall, the UK has in the last 30 years grown its GDP by 75% while cutting emissions by 43% (see Figure 2).3 Growth and decarbonization, now more than ever, can and must go hand in hand.
THE UK ETS
The UK government had also consulted on a carbon emissions tax but will not progress with this option. The government felt the UK ETS, with a cap on emissions aligned with a net-zero target, and the continuity it offers participants, provides a better basis for businesses to decarbonize.
The scope of the UK ETS is initially the same as the EU system. This provides continuity of emissions trading for affected businesses–especially important, as those same businesses will have to fulfil 2020 EU ETS compliance obli-
1990
1992
1994
1996
1998
2000
2002
2004
2006
2010
2008
2012
2014
2016
2019
Emis
sion
s (M
tCO
2e)
0
50
100
150
200
250
Figure 1: Emissions from power stations, UK, 1990–2019 (MtCO2e)
1 – The 2019 figures are provisional estimates. BEIS (2020), ‘Provisional UK greenhouse gas emissions national statistics 2019’: https://www.gov.uk/government/statistics/provisional-uk-greenhouse-gas-emissions-national-statistics-2019 2 – BEIS energy and emissions projections, based on committed policies. https://www.gov.uk/government/collections/energy-and-emissions-projections3 – Office of National Statistics, BEIS Greenhouse Gas Inventory.
1990
1992
1994
1996
1998
2000
2002
2004
2006
2010
2008
2012
2014
2016
2018
UK Gdp UK emissions
0
80
40
120
100
UK Gdp +75%
UK emissions –43%
160
200
Figure 2: UK GDP and emissions, 1990–2018*
* Note: both GDP and emissions are indexed to 1990 values.
← CONTENT

UniT
Ed K
inGd
OM
PR
ACTI
TIO
NER
INSI
GHTS
–
Stat
us R
epor
t 202
1IC
AP
24
01
gations in the first quarter of 2021. A third of UK territorial emissions are covered by the new scheme (see Figure 3).
Figure 3: UK ETS sectors and emissions covered
Together, these sectors make up a third of UK territorial emissions
industry aviation power
However, with the new UK ETS the UK will be able to expand carbon pricing across the economy and encourage innovation in emerging decarbonization tech-nologies. There is a case for expanding carbon pricing, especially in the context of a net-zero emissions target. We have committed to exploring expanding the UK ETS to other sectors that are currently not included. This will also include how the UK ETS could incentivize deploying greenhouse gas removal technologies.
The UK also recognizes the risk of carbon leakage and will seek to ensure that the UK ETS does not lead to offshoring of emissions. Initially, free allocation of emissions allow-ances under the UK ETS will be calculated using the same methodology as Phase IV of the EU ETS, which the UK has been involved in designing, to provide a smooth transi-tion for participants. However, the UK will be reviewing free allocation to ensure the system is best suited to UK participants and is fair and equitable.
SUPPORTING DECARBONIZATION
The introduction of a UK ETS sends a strong signal to businesses. It will help mobilize the scale of capital invest-ment necessary to deploy clean energy technologies and to capture new trade opportunities in the energy transition. As a trading system, it will promote cost-effec-tive decarbonization, allowing businesses to cut carbon where it is cheapest to do so.
Alongside the UK ETS, the UK government is also supporting businesses in industry, power, and across the economy to decarbonize. In November 2020, the prime minister unveiled the UK’s Ten Point Plan for a Green Industrial Revolution. The plan recognizes the support that will be needed across the economy if sectors are to reach the levels of decarbonization required to achieve net zero by 2050.
In total the plans set out will mobilize GBP 12 billion (USD 15.4 billion) of government investment, and poten-tially three times as much from the private sector, to create and support up to 250,000 green jobs.
The government is investing GBP 1 billion (USD 1.3 billion) up to 2025 to facilitate the deployment of Carbon Capture, Utili zation, and Storage in two industrial clusters by the mid-2020s, with a further two by 2030, and consulting on how to incentivize greenhouse gas removals. The UK is also providing up to GBP 500 million (USD 641 million) for low-carbon hydrogen production across the decade, aiming for 5 gigawatts of capacity by 2030, and increasing the ambi tion of our Industrial Clusters Mission, a public-private initiative aimed at decarbonizing areas with heavy concentrations of emissions-intensive industries.
In December, the UK’s Energy White Paper put in place a strategy for the wider energy system that will transform energy, support a green recovery, and provide a fair deal for consumers.
The UK government’s Industrial Decarbonisation Strategy will be published in spring 2021, setting out how energy-intensive industries can thrive in the transition to net zero.
INTERNATIONAL COOPERATION
The UK government recognizes the importance of interna-tional cooperation on carbon pricing and the important role international carbon markets can play. While the UK ETS currently operates as a standalone scheme, the UK is open to linking the UK ETS internationally in principle.
The UK’s free trade agreement with the EU demonstrates continued commitment to carbon pricing as an effective tool to fulfil climate change objectives. It confirms that both the UK and the EU shall have in place an effective system of carbon pricing, which covers emissions from electricity and heat generation, industry, and aviation. The UK and EU have agreed to cooperate on carbon pricing, including considering linking their respective carbon pricing systems, although neither side is under any obligation to do so.
LOOKING AHEAD
As part of its incoming COP presidency, the UK is urging all parties to come forward with ambitious, updated NDCs. Net-zero commitments by the EU, China, Japan, and Republic of Korea in 2020 are very welcome. As in the UK, delivering on these commitments will require radical change and decisive action.
The UK is already taking the necessary steps, including launching the UK ETS as a keystone of its climate policy. 2021 will be a critical year for climate action, and the UK’s presidency of COP26 in Glasgow in November provides the opportunity to drive further ambitious action on climate change and unite the world on a path to achieving the goals of the Paris Agreement.
← CONTENT

INFOGRAPHICS 02

INFO
GRAP
HICS
– F
rOM
SUp
rana
TiO
naL
TO LO
CaL
02St
atus
Rep
ort 2
021
ICAP
26
FROM SUPRANATIONAL TO LOCALEmissions trading operates at every level of government
1 SupranationalEU Member States+ Iceland+ Liechtenstein + Norway
18 Provinces & States8 CountriesChinaGermanyKazakhstan MexicoNew ZealandRepublic of KoreaSwitzerlandUnited Kingdom
6 CitiesBeijing*Chongqing*Shanghai*ShenzhenTianjin*Tokyo
16%of global GHG emissions are covered by an ETS
Almost 1/3 of the global population lives under an ETS in force
Jurisdictions making up 54%of global GDP are using emissions trading
California Connecticut Delaware FujianGuangdongHubeiMaine Maryland Massachusetts
New HampshireNew JerseyNew YorkNova Scotia Québec Rhode IslandSaitama PrefectureVermontVirginia
* In the Chinese administrative system, Beijing, Chongqing, Shanghai and Tianjin are provincial level municipalities.
← CONTENT

INFO
GRAP
HICS
– S
ECTO
r CO
vEra
GE02
Stat
us R
epor
t 202
1IC
AP
27
SECTOR COVERAGESectors covered by emissions trading across systemsThe graphic shows sectors (types of economic activity) covered by an ETS in force in 2021. Systems are listed clockwise in decreasing order of share of aggregate emissions covered, with the numbers in the outermost ring indicating the share of aggregate emissions covered by the system. Upstream coverage is indicated with an asterisk (*). Sectors are considered covered when at least some entities in the sector have explicit compliance obligations. Typically, not all facilities in the sector are regulated because of limits like inclusion thresholds. In addition, not all gases or processes of a given sector are covered. The jurisdictions’ respective factsheets provide more information on system coverage. Only sectors covered by at least one ETS are included in the graphic. See “Notes on Methods and Sources” for further details.
Forestry
Waste
domestic aviation
Transport
Buildings
industry
power
Sectorscovered
**
*
*
*
*
*
*
*
**
NOVA
SCO
TIA
EU E
TS
CHINESE
PILOTS
MEX
ICO
MASSACHUSETTS
SWITZERLAND
RGGI
CALIFORNIA
QUÉBEC
REPUBLIC
OF KOREA
CHINAGERMANY
NEW ZEALAND
KAZAKHSTAN UNITED
KINGDOM
SAITAMA
TOKYO
Beijing, Shanghai,
ShenzhenFujian, Guang-
dong, Shanghai,
Tianjin
Beijing, Shanghai,
Shenzhen
10% 82%
78%
75%
74%
51%
41%
10%
11%
20%
20
%
31%
32%
39% 40%
40%
40%
Emission coverage
← CONTENT

EMISSIONS TRADING WORLDWIDEThe state of play of cap-and-trade in 2021
virginia adopted legislation in 2020 to establish an ETS and participate in rGGi from 2021.
in February 2021, Massachusetts, Connecticut, rhode island, and Washington d.C. have signed a final memorandum of understanding to establish a regional transport sector ETS, the Transpor-tation and Climate initiative program (TCi-p) starting in 2023.
Regional Greenhouse Gas Initiative (RGGI)
• Connecticut • delaware • Maine• Maryland• Massachusetts• new hampshire• new Jersey• new York• rhode island• vermont• virginia
Québec
held its first auction in June 2020, selling all allowances on offer.
Transportation and Climate Initiative (TCI-P)
• Connecticut • Massachusetts• rhode island • Washington d.C.
Mexico
Nova Scotia
MassachusettsPennsylvania
Oregon
Washington
New Mexico
CaliforniaNew York City
North Carolina
Brazil
Chile
Colombia
In force
Under development
Under consideration
The ICAP ETS world map depicts emissions trading systems currently in force, under development or under consideration. As of 31 January 2021, there are 24 ETS in force. Another eight are under development and expected to be in operation in the next few years. These include ETS in Colombia and the Transportation and Climate Initiative Program (TCI-P) in northeastern US States. 14 jurisdictions including Chile, Turkey and Pakistan are also considering the role an ETS can play in their climate change policy mix. If a jurisdiction has multiple systems in force or has a system in force but is at the same time developing or considering an additional system, it is depicted in blue.
phase 4 commenced in 2021 establishing a new cap, introducing new provisions on free allocation, auctioning, Mrv and the Union registry, as well as operationalizing the innovation Fund.
EU ETS
Switzerland
Launched a national ETS for heating and transport fuels in 2021, complementing the EU ETS. The system starts with a fixed price that increases annually.
Launched in 2021 following the end of UK’s participation in the EU ETS. The new system mostly mirrors the EU ETS phase 4 design.
Germany
Fully launched its national power sector ETS in 2021 bringing the world’s largest carbon market online after three years of preparation.
China
• Beijing• Chongqing• Fujian• Guangdong• hubei• Shanghai• Shenzhen• Tianjin
• EU Member States• iceland• Liechtenstein• norway
Chinese PilotsThird trading phase will commence in July 2021 extending the scope, increasing auctioning and intro-ducing financial intermediaries to its market.
Republic of Korea
a new legislative framework for the 2021–2025 period establishes a cap on emissions from 2021 for the first time under the nZ ETS.
New Zealand
Turkey
UK
Pakistan
KazakhstanUkraine
Montenegro
Indonesia
Japan
Sakhalin (Russia)
Tokyo
ThailandVietnam
Philippines
Taiwan (China)
Saitama
Finland
inFO
Grap
hiCS
– E
MiS
SiO
nS T
radi
nG W
OrL
dWid
E02
Stat
us r
epor
t 202
1iC
ap
28

3 GtCO2e
0 GtCO2e
6 GtCO2e
9 GtCO2e
GLOBAL EXPANSION OF ETSThe share of global GHG emissions under an ETS tripled since 2005
2005
+ EU
ETS
2006 2007 2008
+ Ne
w Z
eala
nd
2009
+ RG
GI*
2010
+ To
kyo
2011
+ Sa
itam
a
2012 2013
+ Sw
itzer
land
+ C
alifo
rnia
+ Q
uébe
c +
Kaza
khst
an +
Chi
nese
Pilo
ts*
The graphic depicts the worldwide growth of emissions trading over time. Systems are spreading around the world. With new additions in China, Germany, the UK and Virginia, the share of GHG emissions covered by emissions trading has tripled since the launch of the EU ETS in 2005. Changes over time are driven by the addition of new sectors and systems, as well as by the counteracting trends of declining caps in many systems and growing global emissions. See “Notes on Methods and Sources” for further details.
2014+
Chon
gqin
g +
Hub
ei (N
ew C
hine
se P
ilots
)2015
+ Re
publ
ic o
f Kor
ea
2016
+ Fu
jian
(New
Chi
nese
Pilo
t)
2017
+ O
ntar
io
2020
+ M
exic
o
2021
+ U
K +
Chin
a* +
Ger
man
y
2019
– O
ntar
io +
Nov
a Sc
otia
*The Chinese National ETS came into force in 2021 but has retroactive compliance obligations in 2019 and 2020, indicated above by the striped bars.
2018
5%of global GHG
emissions
16%of global GHG
emissions
inFO
Grap
hiCS
– G
LOBa
L EX
panS
iOn
OF
ETS
02St
atus
rep
ort 2
021
iCap
29
* Beijing,Guangdong, Shanghai, Shenzhen, Tianjin
* RGGI includes New Jersey (as of 2020) and Virginia (as of 2021).

INFO
GRAP
HICS
– d
iFFE
rEnT
Sha
pES
OF
ETS
02St
atus
Rep
ort 2
021
ICAP
30
SWISS ETS
10%
17%*
DIFFERENT SHAPES OF ETSA comparative look at key metrics in six well-established systems
EU ETS
KOREA ETS
allowance price allowance price
allowance price allowance price
Coverage Coverage
Coverage Coverage
Coverage Coverage
auction share
auction share
auction share
auction share
auction share
auction share
40%
74%
57%
3%
$28.28
$27.62
The axes on each graph correspond to a specific metric. Allowance price is measured in USD per metric tonne of CO2e in each system and averaged over 2020. Coverage shows the share of the jurisdiction's emissions covered under the ETS. Auction share, expressed as a share of the 2020 cap, denotes the number of allowances that were auctioned and generated revenues for the jurisdiction’s government. To aid comparison, the axes share the same scale across graphs. See “Notes on Methods and Sources” for further details.
RGGI
100%
$7.06
10%
QUÉBEC
allowance priceallowance price
CALIFORNIA
75%
32%
$17.04
78%
67%
$17.04
* Not considering cancelled auctions. See “Notes on Methods and Sources” for further details.
$28.28
← CONTENT

INFO
GRAP
HICS
– a
UCTi
On
rEvE
nUE
02St
atus
Rep
ort 2
021
ICAP
31
AUCTION REVENUEEmissions trading as an additional source of government revenue
• Energy efficiency• Clean/renewable energy• Low-carbon innovation• industrial decarbonization
(e.g. r&d for CCS technologies)
2020
2019
2018
Québec
Allowance auctions generate revenue that can be used in areas reflecting jurisdictional priorities. Jurisdictions have tended to use auction revenues to fund climate programs, including on energy efficiency, low-carbon transport and renewable energy. Revenues have also been used to support energy intensive industries, as well as to assist disadvantaged and low-in-come groups. The amount of revenue collected depends on the jurisdiction’s size, ETS coverage, share of auctioned allow-ances and their prices. By the end of 2020, systems worldwide raised over USD 103 billion cumulatively. See “Notes on Methods and Sources” for further details.
• Energy efficiency• renewable energy• Low-carbon transport• industrial decarbonization• Other mitigation
727.7
514.4
641.5
$3,485
• Energy efficiency• Low-carbon transport• Transfer to households and energy users• Other mitigation
$103billion
total
since 2009
million since 2013
Massachusetts $27million since 2018
Nova Scotia $21million since 2020
Chinese Pilots $215 million since 2013
EU ETS 2020
2019
2018
16,413.5
21,769.6
16,747.3
$80,737 million since 2009
• Energy efficiency• renewable energy• Transfer to households and energy users• Other mitigation
2020
2019
2018
RGGI
284.0
416.3
239.4
$3,775 million since 2009
2020
2019
2018
Swiss ETS
8.6
7.8
4.5
• Federal government budget
$45 million since 2013
2020
2019
2018
California
3,065.3
1,699.3
3,018.0
$14,238 million since 2013
Korea ETS
• Low-carbon innovation• Other mitigation
$509 million since 2019
2020
2019 199.4
210.4
← CONTENT

INFO
GRAP
HICS
– d
EEp
dECa
rBO
niZa
TiO
n an
d ET
S02
Stat
us R
epor
t 202
1IC
AP
32
DEEP DECARBONIZATION AND ETSETS as an important policy instrument for the net-zero transitionAround the world an increasing number of jurisdictions are formally adopting mid-century net-zero emissions targets to limit global warming to 1.5°C. Emissions trading is an important component of the policy portfolios aimed at achieving these targets. The inner ring of this infographic shows the share of global GHG emissions by status of net-zero target devel-opment at the national or, for EU member states, supranational level based on the categorization from the Energy & Climate Intelligence Unit’s Net Zero Tracker. For each stage of net-zero target development, the outer ring indicates the share of emissions covered by an ETS currently in force at the subnational, national or supranational level. See “Notes on Methods and Sources” for further details.
ETS COVERED EMISSIONS BY STATUS OF NET-ZERO TARGETNON-ETS COVERED EMISSIONS BY NET-ZERO CATEGORY
STATUS OF NET-ZERO TARGET:- IN-LAW - IN PROPOSED LEGISLATION- IN POLICY DOCUMENT - NO TARGET
ETS-covered emissions34%
ETS-
cove
red
emiss
ions
49%
ETS-covered emissions
26%
in-law1%
ETS-covered emissions1%
prop
osed
legi
slatio
n10
%
in policy document40%
Note: Numbers may not add up to 100% due to rounding
no net-zero target48%
Global emissions:
52.43 GtCO2e
← CONTENT

INFO
GRAP
HICS
– a
LLOW
anCE
pri
CE d
EvEL
OpM
EnTS
02St
atus
Rep
ort 2
021
ICAP
33
ALLOWANCE PRICE DEVELOPMENTSAllowance price developments since 2010The top panel of the figure uses data from the ICAP Allowance Price Explorer to visualize price developments in primary (*) and secondary (**) markets between 2010 and 2020 in major ETSs around the world. Sustained upward trends and short-term volatility were driven by changes in current and expected future scarcity of allowances, due to variations in general economic conditions, revisions to the rules of the systems (including those governing offsets and market stability mechanisms), and interac tions with other climate and energy policies. The lower panel shows an index of allowance prices in selected ETSs in 2020. The index value is set to 100 across all prices at the start of 2020 and values at other dates indicate price changes relative to this base period. Prices indicated to the right are the yearly average of the daily secondary market prices. Highlighted dates indicate the first major government announce ments regarding restrictions to stop the spread of COVID-19. Although most of the displayed systems experienced a sharp price decrease early in the pandemic, prices recovered for most systems by the second half of 2020. See “Notes on Methods and Sources” for further details.
2010
5
10
15
20
25
30
35
40
USd
EU ETS**
2011 2012 2013 2014 2015 2016 2017 2018 2019 2020
2020
republic of Korea**new Zealand**
California*Québec*
rGGi*Chinese pilots**
EU ETS (USd 28.28)
new Zealand (USd 19.68)
republic of Korea (USd 27.62)
rGGi (USd 6.33)
Califronia/Quebec (USd 16.92)
21 March: new Jersey's Governor issues stay-at-home order.
25 March: new Zealand goes into self-isolation.
10 March: non-essential movement banned in italy.23 February: The republic of
Korea raises its infectious disease alert to highest level. 14 March: Québec declares public
health emergency.
2020
pric
e de
velo
pmen
t ind
ex
80
60
40
100
120
140
160
Jan2020 Feb2020 Mar 2020 apr 2020 May2020 Jun2020 Jul2020 aug2020 Sep2020 Oct2020 nov2020 dec2020
← CONTENT

03FACTSHEETS

EUROPE AND CENTRAL ASIA European Union 37Germany 43Kazakhstan 47Montenegro 50Sakhalin 51Switzerland 52Turkey 56Ukraine 58United Kingdom 59
NORTH AMERICA California 64Canada 69Massachusetts 72new Mexico 75new York City 76north Carolina 77nova Scotia 78Oregon 82pennsylvania 83Québec 84regional Greenhouse Gas initiative 88Transportation and Climate initiative 91Washington 93Western Climate initiative 95
LATIN AMERICA AND THE CARIBBEAN Brazil 97Chile 98Colombia 100Mexico 101
ASIA-PACIFIC Beijing 106China 109Chongqing 114Fujian 117Guangdong 120hubei 124indonesia 127Japan 128new Zealand 129pakistan 134philippines 135republic of Korea 136Saitama 141Shanghai 145Shenzhen 148Taiwan, China 151Thailand 152Tianjin 153Tokyo 156vietnam 160

EUROPE AND CENTRAL ASIA

FACT
SHEE
TS –
03
EUrO
pEan
Uni
On
Stat
us R
epor
t 202
1IC
AP
37
EUROPEAN UNIONEuropean Union Emissions Trading System
All EU Member States as well as Iceland, Liechten-stein, and Norway
SECTORS:
MEMBER STATES (2021):
CAP1,610 MtCO2e (2021)1,572 MtCO2e for stationary installations38 MtCO2e for aviation operators
GASES Several gases
OFFSETS AND CREDITSOffsets and international credits can no longer be used for compliance since phase 4 (2021–2030)
ALLOCATION Free allocation: Benchmarkingauctioning
AVERAGE 2020 PRICE1
EUr 24.76 / tCO2 (USd 28.28)TOTAL REVENUE EUr 69.7 billion (USd 80.7 billion) since beginning of program, EUr 19.2 billion (USd 21.8 billion) collected in 2020
ETS DESCRIPTIONThe European Union Emissions Trading System (EU ETS) is a cornerstone of the EU’s policy to combat climate change and a key tool for reducing, on a cost-effective basis, GHG emis-sions from the regulated sectors. The system covers ~40% of the EU’s emissions, from the power sector, manufacturing industry, and aviation within the European Economic Area. It is the oldest and and now second largest ETS operating worldwide. Introduced in 2005 and now in its fourth trading phase, the EU ETS has gone through several reforms. The latest revision of the system’s framework for Phase 4 was completed in 2018 and took effect in January 2021. The next reform of the ETS will be proposed later in 2021 as part of steeper emission reductions across the economy envisaged under the European Green Deal. As of January 2020, the EU ETS became linked to the Swiss ETS, the first linking of this kind for both parties.
YEAR IN REVIEW2020 was an important year for the EU ETS with: the announcement of milestone climate policy initiatives under the European Green Deal; the finalization of the regulatory preparations ahead of Phase 4 (2021–2030); and a market that proved itself resilient amidst macroeconomic shocks prompted by the COVID-19 pandemic. The Market Stability Reserve (MSR), now in its third year of operation, absorbed a total of 773 million allowances through reduced auction volumes in 2019 and 2020. The proposed Climate Law and the 2030 Climate Target Plan pave the way for steeper emis-sions reductions and will see the EU ETS play a central role in Europe’s deep decarbonization pathway.
Under the 2030 Climate Plan, the European Commission (the Commission) has launched the revision process for the EU ETS, with a proposal due by June 2021. The objectives are to: strengthen the system in line with the more ambitious 2030 emissions reductions target; adjust the MSR and provi-
sions to protect against the risk of carbon leakage; extend the system’s scope to emissions from the maritime sector and, possibly, the road transport and buildings sectors; and review existing support mechanisms for low-carbon invest-ment. Alternative options, e.g., to address the risk of carbon leakage, are also considered—including a carbon border adjustment mechanism targeting specific industrial sectors. The impact assessment for the revision of the EU ETS is coor-dinated with the scheduled review of the MSR.
In addition to the developments outlined above, 2020 saw further operationalization of the EU ETS framework for Phase 4. This included implementing rules for the ETS’ Modernisation Fund. The first open call for large-scale proj-ects under the ETS’ Innovation Fund was also launched. The Commission published the cap for 2021, which no longer covers the United Kingdom but does include emissions from electricity generation in Northern Ireland. Other building blocks for Phase 4 had been implemented through key legis-lation in 2019; these included free allocation, auctioning, MRV, and the Union Registry, as well as the operationalization of the Innovation Fund.
2020 also saw major developments on the international front. The linking agreement between the EU ETS and the Swiss ETS took effect in January 2020, and a provisional link was established in September allowing for allowance trans-fers between both registries on pre-announced dates. The UK formally withdrew from the EU on 31 January 2020, but continued to participate in the EU ETS until the end of the year as part of the transition period. Linkage with the UK ETS might be considered in the future.
1 – Average secondary market spot price from EEX exchange.
POWER
INDUSTRY
AVIATION
Oldest ETS in force –now in its fourth trading phase
Link with the Swiss ETS operational since Q3 2020
Reduced ETS emissions from stationary sources by 9.1% in 2019
In force
Under development
Under consideration
← CONTENT

FACT
SHEE
TS –
03
EUrO
pEan
Uni
On
Stat
us R
epor
t 202
1IC
AP
38
2 – EU-27 comprises all European Member States, which as of 2021 no longer includes the United Kingdom. 3 – Both updated targets (2030 and 2050) recently have been endorsed by the European Parliament and European Council, and are currently in the process of being
enshrined into the European Climate Law.4 – Including emissions and verified emissions of the EU-28, Iceland, Liechtenstein and Norway
Background Information
OVERALL GHG EMISSIONS (excl. LULUCF) EU-28: 4,391.9 MtCO2e (2018) EU-27:2 3,893.1 MtCO2e (2018)
OVERALL GHG EMISSIONS BY SECTOR (MtCO2e)
Energy 2,907.1 (75%)industrial processes 343.5 (9%)international aviation 129.2 (3%)agriculture 395.4 (10%)Waste 117.2 (3%)
GHG REDUCTION TARGETSBY 2030: At least 55% below 1990 GHG levels proposed (European Green Deal), to be set in the Climate LawBY 2050: Climate neutrality target proposed (European Green Deal), to be set in the Climate Law3
ETS Size
COVERED EMISSIONS4
1,749.5 MtCO2e(verified emissions 2018)
GHGs COVEREDCO2, N2O, PFCs
SECTORS AND THRESHOLDSPHASE ONE (2005–2007): Power stations and other combus-tion installations with >20 MW thermal rated input (except hazardous or municipal waste installations), industry (various thresholds) including oil refineries, coke ovens, and iron and steel plants, as well as production of cement, glass, lime, bricks, ceramics, pulp, paper, and cardboard.
PHASE TWO (2008–2012): Aviation was introduced in 2012 (>10,000 tCO2/year for commercial aviation; >1,000 tCO2/year for non-commercial aviation since 2013) (see "Aviation" section). A number of countries included NOx emissions from the production of nitric acid. The EU ETS also expanded to include Iceland, Liechtenstein, and Norway.
PHASE THREE (2013–2020): Carbon capture and storage installations, production of petrochemicals, ammonia, nonferrous and ferrous metals, gypsum, aluminum, as well as nitric, adipic, and glyoxylic acid (various thresholds) were included.
PHASE FOUR (2021–2030): Based on the current legislation, no changes to the scope have been agreed on for Phase 4. Changes are being considered as part of the review of the ETS foreseen under the 2030 Climate Target Plan (see “Year in Review” section).
Aviation: Emissions from international aviation were included in the EU ETS in 2012. In November 2012, the EU temporarily suspended enforcement of the EU ETS require-ments for flights operating from or to non-EEA countries (“stop the clock”) while continuing to apply the legislation to flights within and between countries in the EEA. Exemptions for operators with low emissions have also been introduced.
In light of the progress made under the International Civil Aviation Organization (ICAO) towards a global measure to reduce emissions from the aviation sector (the Carbon Offset-ting and Reduction Scheme [CORSIA]), the EU will maintain the intra-EEA scope for the ETS Aviation until 31 December 2023. In 2020, the Commission initiated a process to revise the ETS Directive to address the implementation of CORSIA in EU law in a way that is consistent with the EU’s 2030 climate target, with a view of adoption in 2021.
POINT OF REGULATIONDownstream
NUMBER OF ENTITIES 10,569 power plants and manufacturing installations.
CAPPHASE ONE (2005–2008) and PHASE TWO (2009–2012): The cap was established bottom-up, based on the aggrega-tion of the national allocation plans of each Member State. Phase 1 started with a cap of 2,096 MtCO2e in 2005; Phase 2 started with a cap of 2,049 MtCO2e in 2009.
PHASE THREE (2013–2020): A single EU-wide cap for stationary sources: 2,084 MtCO2e in 2013, which is annu-ally reduced by a linear reduction factor (currently 1.74% or ~38.3 million allowances). This amounts to a cap of 1,816 MtCO2e in 2020.
39%
← CONTENT

FACT
SHEE
TS –
03
EUrO
pEan
Uni
On
Stat
us R
epor
t 202
1IC
AP
39
PHASE FOUR (2021–2030): A single EU-wide cap for stationary installations set for 2021 at 1,572 MtCO2e. A linear cap reduction factor of 2.2% (of 2008–2012 baseline emis-sions) applies to both stationary sources and the aviation sector each year. This translates into a year-on-year reduc-tion of the cap by 43 million allowances. The linear reduc-tion factor does not have a sunset clause and the cap will continue to decline beyond 2030. Starting 2021, emissions from UK entities previously covered by the EU ETS are no longer considered in the cap. However, pursuant to Article 9 and Annex 4 of the Protocol on Ireland/Northern Ireland, the cap trajectory in Phase 4 does account for emissions from electricity generators in Northern Ireland.
Aviation Sector Cap: Emissions for intra-EEA aviation in 2021 are capped at 38 million allowances and will decrease each year by the linear reduction factor of 2.2%. The avia-tion sector cap was set in 2012 at 210 MtCO2e/year. This cap was meant to reflect the initial inclusion of all flights from, to, and within the EEA in the EU ETS. However, following the “stop the clock” temporary suspension until the end of 2016, the number of aviation allowances put into circulation in 2013 –2016 was reduced to 38 million allowances annually and set considerably below verified intra-EEA aviation emis-sions. In 2017, the intra-EEA scope for aviation was prolonged until 2023. The adjusted annual aviation cap applies up to 2021 and decreases thereafter.
Phases & Allocation
TRADING PERIODSPHASE ONE: 3 years (2005–2007)PHASE TWO: 5 years (2008–2012)PHASE THREE: 8 years (2013–2020)PHASE FOUR: 10 years (2021–2030)
ALLOCATIONPHASE ONE (2005–2007): Allocation established through the Member State national allocation plans. Allocation through grandfathering. Some Member States used auctioning and some used benchmark-based allocation.
PHASE TWO (2008–2012): Similar to Phase 1, with ~90% of allowances allocated for free. Some benchmark-based free allocation; and some auctioning in eight Member States (Germany, United Kingdom, The Netherlands, Austria, Ireland, Hungary, Czech Republic, and Lithuania), amounting to ~3% of total allowance allocation.
PHASE THREE (2013–2020): 57% of allowances auctioned over the entire trading period with the remaining allowances allocated through benchmarking. 88% of the auctioned allowances were distributed to EU Member States based on verified 2005 or average 2005–2007 emissions.
10% was allocated to lower-income EU Member States and the remaining 2% distributed among nine Member States that reduced 2005 emissions by 20% compared to the base year. Power Sector: 100% auctioning with an optional deroga-tion for the modernization of the electricity sector in certain Member States whose GDP per capita was below 60% of the EU average in 2013.
Manufacturing/Industry: Free allocation follows prod-uct-based benchmarks. Benchmarks were based on activity levels in 2007–2008 and were set at the average of the 10% most efficient installations in the (sub)sector.
Subsectors deemed at risk of carbon leakage received free allocation at 100% of the predetermined benchmarks. Subsectors deemed not at risk of carbon leakage had free allocation phased out gradually from 80% of the respec-tive benchmarks in 2013 to 30% by 2020. Where free allo-cation exceeded the amount reserved for free allocation, a cross-sectoral correction factor applied.
Carbon leakage risk was assessed against the following criteria of emissions intensity and trade exposure:• direct and indirect cost increase >30%; or• non-EU trade intensity >30%; or• direct and indirect cost increase >5% and trade intensity
>10%.
Cost intensity was determined by the formula[Carbon price × (direct emissions × auctioning factor + electricity consumption × electricity emission factor)] / GVA
Trade intensity was determined by the formula(imports + exports)/(imports + production)
Aviation Sector: In 2012, 85% of allowances were allocated for free, based on benchmarks. In Phase 3 (2013–2020), 15% of allowances were auctioned and 82% allocated for free, based on benchmarks. The remaining 3% constituted a special reserve for new entrants and fast-growing airlines. Due to the temporary derogation that applied to flights with third countries, the allocation was adjusted to the intra-EEA scope.
Back-loading: As a short-term measure to address a growing surplus in the EU ETS, the auctioning of 900 million allow-ances from 2014–2016 was postponed to 2019–2020. In line with the decision to create the market stability reserve, the back-loaded allowances were placed in the MSR, which became operational in 2019.
New Entrants Reserve: 5% of the total allowances are set aside to assist new installations coming into the EU ETS or to cover installations whose capacity has significantly increased
← CONTENT

FACT
SHEE
TS –
03
EUrO
pEan
Uni
On
Stat
us R
epor
t 202
1IC
AP
40
since their free allocation was determined. Until June 2020, a total of 171.1 million allowances were reserved for 1,089 installations during Phase 3. At the end of Phase 3, any unal-located allowances (excluding 200 million reserved for the NER3004 in Phase 4) were placed into the MSR.
PHASE FOUR (2021–2030): Manufacturing/Industry: Benchmark values are updated twice to reflect technological progress in different sectors. The first set of benchmark values applies to the period 2021–2025; the second set of values will cover the period from 2026 to 2030. Member States submitted lists of incumbent installations and updated emissions data by 30 September 2019 and are required to do so again by 30 September 2024. Based on this data, the European Commission will update Phase 3 benchmarks. • Benchmark values in Phase 4 will be adjusted for techno-
logical progress year-on-year. An annual reduction rate (0.2% to 1.6%) will be determined for each benchmark. For the steel sector, which faces high abatement costs and leakage risks, the lower end of 0.2% annual benchmark reduction will apply. Further updates on the above may be released as part of the broader ETS review.
• Free allocation may be updated annually to mirror sustained changes in production (if the change is more than 15% compared to the initial level, based on a 2-year rolling average).
Carbon leakage rules:• The third carbon leakage list adopted in February 2019
applies for the period 2021–2030. The revised list includes a reduced number of sectors classified at risk of carbon leakage. Free allocation for other sectors will be discon-tinued by 2030 (except district heating).
• Carbon leakage is assessed against a composite indicator of trade intensity and emissions intensity.
• As an additional safeguard for industry, the Phase 4 cap breakdown includes a free allocation buffer of more than 450 million allowances, initially earmarked for auctioning, which can be made available for free allocation if the initial free allocation volume is fully absorbed (thereby avoiding the need to apply the cross-sector correction factor).
• Carbon leakage risk is assessed according to the following criteria: - Trade Intensity x Emissions Intensity > 0.2 - Trade intensity x Emissions Intensity > 0.15 < 0.2; qualita-tive assessment will follow based on abatement poten-tial, market characteristics, and profit margins.
Emissions intensity is determined by: [direct emissions + (electricity consumption x electricity emission factor)]/GVA
Trade exposure is determined by: (imports + exports)/(imports + production)
Power Sector: 100% auctioning with an optional deroga-tion for the modernization of the electricity sector in certain Member States. Those Member States whose GDP per capita was below 60% of the EU average in 2013 may continue to make use of this optional free allocation through bench-marking. Three out of ten eligible Member States make use of the derogation in Phase 4 (2021–2030). Some Member States chose to monetize the corresponding share of allowances or use them to boost their share of the Modernization Fund.
Aviation: Free allocation for the aviation sector will be reduced compared to the 82% in Phase 3. A proposal is expected in June 2021.
Auctioning: 57% of allowances in Phase 4 will be auctioned. Out of these, 90% will be distributed to Member States based on their share of verified emissions, with 10% distributed among the lower-income EU Member States. Authorities have the right to cancel auctions when the highest bidding price is significantly below the prevailing secondary market price to avoid market distortion. In such a situation, allow-ances are transferred to subsequent auctions scheduled at the same trading platform.
NER: The New Entrants Reserve in Phase 4 (2021–2030) has been supplied with 200 million from the unallocated NER allowances from Phase 3 (2013–2020).
Flexibility
BANKING AND BORROWING Unlimited banking has been allowed since 2008.
Borrowing is not allowed. However, implicit borrowing within trading periods is allowed, i.e., the use of allowances allo-cated in the current year for compliance in the previous year.
OFFSETS AND CREDITSPHASE ONE (2005–2007): Unlimited use of Clean Develop-ment Mechanism (CDM) credits and Joint Implementation (JI) credits was provided for in the directive. In practice, no credits were used in Phase 1.
PHASE TWO (2008–2012): Qualitative Limits: Most categories of CDM/JI credits were allowed; no credits from LULUCF and nuclear power sectors were allowed. Strict requirements for large hydro projects exceeding 20 MW.
Quantitative Limits: In Phase 2, operators were allowed to use JI and CDM credits up to a certain percentage limit determined in the respective country’s National Allocation Plans. Unused entitlements were transferred to Phase 3 (2013–2020).
5 – The NER 300 is an EU low-carbon technology funding program of approximately EUR 2 billion (USD 2.3 billion) monetized through the sale of 300 million allowances that awarded proposals in 2012 and 2014, the latest of which will enter into operation by June 2021.
← CONTENT

FACT
SHEE
TS –
03
EUrO
pEan
Uni
On
Stat
us R
epor
t 202
1IC
AP
41
PHASE THREE (2013–2020):Qualitative Limits: Newly generated (post-2012) interna-tional credits had to originate from projects in least devel-oped countries. Credits from CDM and JI projects from other countries were eligible only if registered and implemented before 31 December 2012. Projects from industrial gas credits (projects involving the destruction of HFC-23 and N2O) were excluded regardless of the host country. Credits issued for emission reductions that occurred in the first commitment period of the Kyoto Protocol were no longer accepted after 31 March 2015.
Quantitative Limits: The total use of credits for Phase 2 and Phase 3 was capped at 50% of the overall reduction under the EU ETS in that period (~1.6 Gt CO2e).
PHASE FOUR (2021–2030): Based on the current legislation, the use of offsets is not envisaged.
MARKET STABILITY PROVISIONSMARKET STABILITY RESERVE: The MSR started operating in January 2019. Its purpose is to address any supply-demand imbalance of allowances prevailing in the EU carbon market and to improve the EU ETS’s resilience to future shocks. Thresholds: The European Commission publishes the total numbers of allowances in circulation (TNAC) by 15 May each year. • When the TNAC is above 833 million, 24% (12% beyond
2023) of the surplus is withdrawn from future auctions and placed into the reserve over a period of 12 months.
• When the TNAC is fewer than 400 million allowances, 100 million allowances are taken from the reserve and injected into the market through auctions.
From 2023 onwards, the number of allowances held in the reserve will be limited to the auction volume of the previous year. Holdings above that amount will be invalidated. Thresh-olds, withdrawal rates, and cancelation provisions of the MSR will be reviewed in June 2021.
In 2019, a total of 397 million allowances were placed in the reserve. In 2020, the total number of allowances withdrawn amounted to more than 375 million, corresponding to a 35% reduction in auction volumes for that year.
Swiss allowance supply is not taken into account when the annual EU withdrawal amount is calculated, and Swiss auction quotas will not be reduced by the mechanism.
CANCELATIONS: As of Phase 4, a Member State may also cancel allowances from their auction share in the event that they take additional policy measures that result in closure of electricity generation capacity. The quantity of allowances canceled shall not exceed the average verified emissions of the installation from five years preceding the closure.
Compliance
COMPLIANCE PERIODOne year (1 January to 31 December): every year, opera-tors must submit an emissions report. Data for a given year must be verified by an accredited verifier by 31 March of the following year. Once verified, operators must surrender the equivalent number of allowances by 30 April of that year.
MRVREPORTING FREQUENCY: Annual self-reporting based on harmonized electronic templates prepared by the European Commission.
VERIFICATION: Verification by independent accredited veri-fiers is required before 31 March each year.
MRV FRAMEWORK: Since Phase 3, the MRV framework for the EU ETS has been further harmonized. European Commis-sion regulations now apply for emissions monitoring and reporting, as well as for verification and accreditation of veri-fiers. A monitoring plan is required for every installation and aircraft operator (approved by a competent authority). MRV procedures were updated in 2020 in preparation for Phase 4.
ENFORCEMENTRegulated entities must pay an excess emissions penalty of EUR 100/tCO2 (USD 114.22/tCO2) for each tonne of CO2 emitted for which no allowance has been surrendered, in addition to buying and surrendering the equivalent amount of allowances. The name of the non-compliant operator is also made public. Member States may enforce different penalties for other forms of noncompliance.
← CONTENT

FACT
SHEE
TS –
03
EUrO
pEan
Uni
On
Stat
us R
epor
t 202
1IC
AP
42
Linking
LINKS WITH OTHER SYSTEMSFollowing final regulatory changes in the design of the Swiss ETS, a link between the Swiss ETS and the EU ETS took effect on 1 January 2020. The link allows covered entities in both systems to use allowances from either ETS for compliance. A provisional link was implemented in September the same year, enabling the transfer of allowances between registries on pre-announced dates. This system is set to be replaced with an electronic link that would facilitate transfers of emis-sion allowances between both ETS registries on a continuous basis.
The link caps a ten-year process of reaching an agree-ment on regulatory alignment. Formal negotiations began in December 2010, culminating in the conclusion of a linking agreement in late 2017.6 Both sides announced on 12 December 2019 that the link would become operational in January 2020.
Other Information
INSTITUTIONS INVOLVEDThe European Commission and the relevant authorities of all EU Member States as well as Iceland, Liechtenstein, and Norway.
EVALUATION/ETS REVIEWThe European Commission publishes annual reports on the functioning of the European carbon market (2020 report).7
Two major EU ETS reviews—before Phase 3 and before Phase 4—have been conducted to date, introducing changes to the system’s operational framework. The ETS Directive stipulates that the system be kept under review in light of the implementation of the Paris Agreement and the develop-ment of carbon markets in other major economies.
USE OF REVENUESIn the EU ETS, revenues from the auctioning of allowances accrue to Member States. At least 50% of revenues should be used for climate- and energy-related purposes. Member States are obliged to inform the European Commission about how they use the revenues. In 2019, on average, Member States spent ~77% of their revenues on domestic and inter-national climate-related purposes.
PHASE FOUR (2021–2030): The latest revision of the EU ETS set up two new funds to support EU stakeholders in the low-carbon investment challenge.
• Innovation Fund: Supports demonstration of innovative breakthrough technologies in industry, as well as carbon capture and storage/use and renewable energy. The fund is monetized through the sale of at least 450 million allow-ances, and the remaining budget from the NER300. In 2020, the first batch of 50 million allowances was auctioned to capitalize the Fund.
• Modernisation Fund: Supports investments in modern-izing energy systems and improving energy efficiency in ten lower-income Member States, including investments to support a socially just transition to a low-carbon economy (e.g., upskilling/reskilling of affected workers). The Modernisation Fund is capitalized with the auction revenues of 2% of total allowances for Phase 4. Subject to the allowance price, up to EUR 14 billion (USD 16 billion) may be injected into the Fund over 2021–2030.
IMPLEMENTING LEGISLATIONDirective 2003/87/EC of the European Parliament and of the Council establishing a scheme for GHG emission allowance trading within the Community and amending Council Direc-tive 96/61/EC.8
Decision concerning the establishment and operation of a market stability reserve for the Union GHG emission trading scheme and amending Directive 2003/87/EC (6 October 2015).9
Consolidated Auctioning Regulation (25 February 2014): Commission Regulation EU No 176/2014 amending Regu-lation (EU) No 1031/2010 in particular to determine the volumes of GHG emission allowances to be auctioned in 2013–2020 (26 February 2014).10; 11 All other legislation and documentation can be found here.12
6 – Agreement between the European Union and the Swiss Confederation on the linking of their GHG emissions trading systems, OJ L 322, 12 December 2017, p. 3.7 – https://ec.europa.eu/clima/sites/clima/files/news/docs/com_2020_740_en.pdf8 – https://eur-lex.europa.eu/eli/dir/2003/87/2018-04-08 9 – https://eur-lex.europa.eu/legal-content/EN/TXT/?qid=1576247155765&uri=CELEX:02003L0087-2018040810 – https://eur-lex.europa.eu/legal-content/EN/TXT/?uri=CELEX:02010R1031-2014022711 – https://eur-lex.europa.eu/legal-content/EN/TXT/?qid=1547715054952&uri=CELEX:02010R1031-2017110812 – https://ec.europa.eu/clima/policies/ets_en#tab-0-1
← CONTENT

FACT
SHEE
TS –
03
GErM
anY
Stat
us R
epor
t 202
1IC
AP
43
GERMANYGerman National Emissions Trading System
CAPTBd (Cap Setting regulation expected by mid-2021)
GASES CO2 only
ALLOCATIONFixed price until 2025, auctioning thereafter; price corridor foreseen at least for 2026
TRANSPORT
BUILDINGS
SECTORS*:
National ETS introduced in 2021 covering heating and transport fuels upstream
Fixed price per tCO2 from 2021 to 2025
Auctioning starting in 2026 with minimum and maximum price; continuation of a price corridor after 2026 to be decided in 2025
ETS DESCRIPTIONGermany launched its National Emissions Trading System (in German: Nationales Emissionshandelssystem, or nEHS) for heating and transport fuels in 2021. This measure comple-ments the EU ETS and forms part of the ‘Climate Action Programme 2030,’ a package of measures adopted by the German Federal Cabinet to reach Germany’s 2030 climate targets and aim for climate neutrality by 2050. Because GHG emissions from the country’s energy, industry, and domestic aviation sectors are already covered by the EU ETS, the intro-duction of the national ETS leads to most major sectors in Germany facing a CO2 price from 2021 onwards.
After the release of the ‘Cornerstones for the Design of a National ETS’ in October 2019, the implementing legislation for the nEHS—the ‘Fuel Emissions Trading Act’—was adopted in December 2019 and amended in November 2020.
The national ETS will be phased in gradually, with a fixed price per tCO2 from 2021 to 2025. In 2026, auctions with minimum and maximum prices will be introduced. Whether a price corridor will be applied from 2027 onwards has to be decided in 2025. The coverage of fuels will also be gradually expanded.
YEAR IN REVIEWBased on the key design features of the system laid out in the ‘Fuel Emissions Trading Act,’ regulatory efforts in 2020 focused on a first amendment and the further implementa-tion of the law.
The amendments to the ‘Fuel Emissions Trading Act’ adopted by the German legislative bodies in November 2020 increased the initially set fixed-price levels of the nEHS. Prices were set at EUR 25/tCO2 (USD 28.55) in 2021, which will then increase yearly to EUR 55/tCO2 (USD 62.82) in 2025. In 2026, a price corridor between EUR 55/tCO2 (USD 62.82) and EUR 65/tCO2 (USD 74.24) will apply. Whether a price corridor should be applied from 2027 onwards will be decided in 2025.
Additional revenue raised through the increased prices is to be used to reduce electricity rates for consumers (renewable energy levy/surcharge) and additional income tax reliefs for commuters.
Together with the changed price levels, the German Parlia-ment required the establishment of a system to prevent carbon leakage from 2021 onwards.
Further implementation steps of the law included the intro-duction of the ‘Emissions Reporting Regulation 2022’ which regulates monitoring, reporting and verification (MRV) obliga-tions for 2021 and 2022 as well as the ‘Fuel Emissions Trading Regulation’ which regulates, among others, selling (or, later on, auctioning) of allowances and the set-up of the registry. Other regulations such as a Carbon Leakage Regulation and a Cap Setting Regulation are expected by mid-2021.
Background Information
GHG REDUCTION TARGETSBY 2030: 55% below 1990 GHG levels (Climate Change Act)BY 2050: GHG neutrality (Climate Change Act)
OVERALL GHG EMISSIONS (excluding LULUCF) 859.0 MtCO2e (2018) Energy 305.0 (36%)industrial processes 195.0 (23%)Transport 162.0 (19%)Buildings 117.0 (14%)agriculture 70.0 (8%)Waste and others 10.0 (1%)
OVERALL GHG EMISSIONS BY SECTOR (MtCO2e)
In force
Under development
Under consideration
*In general, all sectors not covered by the EU ETS are covered, mainly transport and heating for buildings.
← CONTENT

FACT
SHEE
TS –
03
GErM
anY
Stat
us R
epor
t 202
1IC
AP
44
ETS Size
COVERED EMISSIONS
GHGs COVEREDCO2 only
SECTORS AND THRESHOLDSThe nEHS will cover all fuel distributors and suppliers. It applies to all fuels used in the transport sector and for the production of heat, e.g., fuel oil, LPG, natural gas, coal, gaso-line, and diesel.
Biomass used as fuel in the transport sector and for heating purposes generally also falls under the scope of the nEHS. However, emissions from biogenic fuels that meet the sustainability criteria as set out in national Regulations trans-posing the European Renewable Energy Directives 2029/28/EC and 2018/2001 do not face compliance obligations.
The system starts with a limited scope in 2021 and 2022, including fuel oil, LPG, natural gas, gasoline, and diesel. Other fuels such as coal will be covered from 2023 onwards.
Provisions have been put in place to avoid double compli-ance burdens for installations covered by the EU ETS. Emis-sions that arise from a fuel delivered to and used in an EU ETS installation have to be reported by the EU ETS installa-tion in any case. These emissions may be deducted from the reported emissions of the fuel distributor under the nEHS if: (a) evidence can be provided that the emissions have been reported by the receiving EU ETS installation; and (b) no CO2-price has been passed through. If such evidence cannot be provided and if CO2-costs were passed through from
the supplier under the nEHS to the EU ETS installation, the supplier is obligated to report and to surrender allowances to cover the emissions. In that case, the EU installation receives a full compensation for the CO2-price that has been passed through.
POINT OF REGULATIONUpstream
NUMBER OF ENTITIESN/A
CAPThe cap will be determined annually based on a separate “Cap Regulation” which will be adopted in 2021. The cap will be set in line with Germany’s reduction targets for the non-EU ETS sectors as defined by the ‘European Effort Sharing Regu-lation’ (ESR), and will decline each year. However, if emis-sions (and therefore the demand for allowances) within the nEHS exceed the cap, additional allowances will be available for compliance entities. Such additional allowances will be covered by using the flexibility mechanisms provided for in the ESR, including transfer of additional emission reductions in sectors not covered by the EU ETS, and/or by acquiring annual emission allocations from other EU Member States.
The aforementioned flexibility leads to a flexible cap and will be applied during the fixed-price phase and as long as a price corridor is deemed necessary.
As soon as the price determination will be left to the market solely, the cap will be absolute without using the aforemen-tioned flexibility provisions.
Phases & Allocation
TRADING PERIODSPHASE ONE: 10 years (2021–2030)
ALLOCATIONPHASE ONE (2021–2030)Fixed price phase (2021–2025): Allowances will be sold for an annually increasing fixed price: • 2021: EUR 25 (USD 28.55)• 2022: EUR 30 (USD 34.27)• 2023: EUR 35 (USD 39.98)• 2024: EUR 45 (USD 51.40)• 2025: EUR 55 (USD 62.82)
Generally, the yearly fixed price only applies to allowances acquired in the respective calendar year. However, up to 10% of allowances needed for compliance obligations for a certain year X can be acquired until 30 September of year X+1 at the fixed price of year X.
Auctioning phase (from 2026): Auctioning of allowances starts in 2026, and a price corridor with a minimum price of EUR 55 (USD 62.82) and a maximum price of EUR 65 (USD 74.24) per tCO2 will apply.
Based on a review of the system, it will be decided in 2025 whether a price corridor should also be applied from 2027 onwards.
~40%
← CONTENT

FACT
SHEE
TS –
03
GErM
anY
Stat
us R
epor
t 202
1IC
AP
45
CARBON LEAKAGE RULES: A compensation mechanism to avoid carbon leakage for emissions-intensive trade exposed sectors will come into effect as early as 1 January 2021. Respective regulations will be released by mid-2021 and will have retroactive effect. The carbon leakage rules will apply to
companies from emission-intensive sectors that are in inter-national competition. Industries eligible for compensation are those on the carbon leakage list of the EU ETS Phase 4. Furthermore, it is foreseen that additional sectors/subsec-tors may qualify upon request.
Flexibility
BANKING AND BORROWINGBanking is not allowed during the fixed-price phase, but will be allowed in the auctioning Phase 1.
OFFSETS AND CREDITSNo offsets will be allowed in Phase 1.
MARKET STABILITY PROVISIONSAdditional allowances exceeding the cap can be acquired by entities in the fixed-price phase.
In 2026, auctions of allowances will contain a price corridor of a minimum price per tCO2 of EUR 55 (USD 62.82) and a maximum price of EUR 65 (USD 74.24).
A potential price corridor for the time after 2026 will be decided upon in 2025.
Compliance
COMPLIANCE PERIODFrom 1 January until 31 December each year. Entities have to surrender allowances to cover the reported emissions of the previous year by 30 September every year.
MRVREPORTING FREQUENCY: Annual self-reporting in the form of an emissions report based on electronic templates to be submitted by 31 July.
From 2023 onwards, the emissions report must be based on a previously approved monitoring plan. Due to a high level of standardization of the permitted reporting methods during the first two years, the monitoring plan requirement has been waived for 2021 and 2022.
Emissions data are recorded in a national registry and will be publicly available.
VERIFICATION: Verification of the annual emissions by accredited independent third-party verifiers is mandatory from 2023 onwards. Similarly to the case of the monitoring plan requirement, the verification requirement has been waived for the years 2021 and 2022.
ENFORCEMENTDuring the first phase, when allowances are allocated at a fixed price, entities must pay an excess emissions penalty for each tCO2 emitted for which no allowance has been surrendered, which is two times the fixed price. Mistakes in
the emissions reports also lead to penalty payments in the equivalent amount. Payment of the penalty doesn’t release the entity from the obligation to surrender allowances to cover the emissions: entities remain obliged to purchase and surrender the outstanding allowances.
During the second phase, entities must pay an “excess emissions penalty” of EUR 100/tCO2 (USD 114.22) for each tCO2 emitted for which no allowance was surrendered. This amount will increase annually by the European consumer price index.
For other instances of noncompliance, e.g., misreporting, or late reporting, a fine can be imposed on an entity.
← CONTENT

FACT
SHEE
TS –
03
GErM
anY
Stat
us R
epor
t 202
1IC
AP
46
Linking
LINKS WITH OTHER SYSTEMSThe long-term goal is to establish emissions trading in the transport and heating sectors at the EU level.
Other Information
INSTITUTIONS INVOLVED German Federal Ministry for the Environment, Nature Conser-vation and Nuclear Safety (BMU)German Emissions Trading Authority (DEHSt) at the German Environment Agency (UBA)
EVALUTION/ETS REVIEW The German government will publish evaluation reports on the functioning and implementation of the German national ETS every two years until 2024 (until end of November 2022 and 2024) and every four years from 2024 onwards.
USE OF REVENUES Revenues will be partly used to support measures under the climate protection program such as incentivizing climate-friendly transport and energy-efficient buildings, and partly redistributed to consumers, e.g., in the form of rebates to compensate citizens for higher carbon costs.
IMPLEMENTING LEGISLATION/REGULATION Fuel Emissions Trading Act1
Further government regulations: Emissions Reporting Regulation 20222 and the Fuel Emissions Trading Regulation3
1 – http://www.gesetze-im-internet.de/behg/BJNR272800019.html 2 – http://www.gesetze-im-internet.de/ebev_2022/index.html 3 – http://www.gesetze-im-internet.de/behv/
← CONTENT

FACT
SHEE
TS –
03
KaZa
KhST
anSt
atus
Rep
ort 2
021
ICAP
47
KAZAKHSTANKazakhstan Emissions Trading Scheme
CAP159.9 MtCO2 (2021)
GASES CO2 only
OFFSETS AND CREDITSdomestic
ALLOCATIONFree allocation: Benchmarking
AVERAGE 2020 PRICEKZT 456 (USd 1.10)
ETS DESCRIPTIONKazakhstan launched its ETS (KAZ ETS) in January 2013. The groundwork for the ETS development was laid out in 2011 through amendments and additions to Kazakhstan’s environ-mental legislation. The system was temporarily suspended in 2016–2017 to tackle operational issues and reform allocation rules. MRV obligations applied during the suspension time. Amendments to the ‘Environmental Code’ were passed in 2016 to improve the MRV system, as well as the overall GHG emissions regulation and operation of the KAZ ETS. Further amendments to the Environmental Code in 2017 laid the groundwork for the introduction of benchmarking.
The current ‘National Allocation Plan’ for 2021 sets a cap of 159.9 MtCO2 for the year, with 225 participating installations belonging to 130 operators. According to the new Environ-mental Code, which will come into force in July 2021, the next National Allocation Plan will be developed for five years.
YEAR IN REVIEW2020 was the last year of the third phase of KAZ ETS operation, and the new National Allocation Plan was issued to set the cap for the year 2021. In the third phase, participating operators could choose the allocation method between grandparenting and product-based benchmarking. A full transition to bench-marking has been made for the current phase.
Background Information
GHG REDUCTION TARGETSBY 2030: 15% (unconditional) to 25% (conditional) reduction from 1990 GHG levels (NDC)
BY 2050: 40% CO2 emission reduction in power sector from 2012 levels (2013 Concept of Transition to Green Economy)
ETS Size
COVERED EMISSIONS162.01
(ETS cap 2018)
GHGs COVEREDCO2 only
SECTORS AND THRESHOLDSPHASE ONE (2013): Power sector and centralized heating. Extractive industries and manufacturing: oil and gas mining, metallurgy, chemical industry.
PHASE TWO (2014–2015): Same as Phase 1
(2016–2017: System suspended)
POWEROIL AND GAS
INDUSTRY
Kazakhstan ETS moved into Phase 4
Full transition to benchmarking in 2021
In force
Under development
Under consideration
SECTORS:
OVERALL GHG EMISSIONS (excluding LULUCF) 396.6 MtCO2e (2018)
OVERALL GHG EMISSIONS BY SECTOR (MtCO2e)
Energy (excluding transportation) 305.1 (77%)industrial processes 22.4 (6%)Transport 26.1 (7%)agriculture 36.2 (9%)Waste 6.8 (2%)
41%
1 – The cap displayed here corresponds to the 2018–2020 cap divided by three (the cap was allocated for the overall period of 2018–2020; there was no yearly cap. See “Cap” section.)
← CONTENT

FACT
SHEE
TS –
03
KaZa
KhST
anSt
atus
Rep
ort 2
021
ICAP
48
PHASE THREE (2018–2020): Power sector and centralized heating. Extractive industries and manufacturing: oil and gas mining, metallurgy, chemical and processing industry (production of building materials: cement, lime, gypsum, and brick).
PHASE FOUR (2021): Same as Phase 3
THRESHOLDS: Facilities emitting more than 20,000 tCO2e/year.
POINT OF REGULATIONDownstream
NUMBER OF ENTITIES130 companies (225 installations)
CAPPHASE ONE (2013): 147 MtCO2 (plus new entrants’ reserve of 20.6 MtCO2). This equalled a stabilization of the capped enti-ties’ emissions at 2010 levels.
PHASE TWO (2014–2015): 2014: 154.9 MtCO2 (plus a reserve of 18 MtCO2); 2015: 152.8 MtCO2 (plus a reserve of 20.5 MtCO2). This represented reduction targets of 0% and 1.5% respec-tively, compared to the average CO2 emissions of capped entities in 2011–2012.
(2016–2017: System suspended)
PHASE THREE (2018–2020): 485.9 MtCO2 (plus a reserve of 35.3 MtCO2). The cap was set at a 5% reduction by 2020 from 1990 levels. The cap was allocated for the overall compliance period of 2018–2020; there was no yearly cap.
PHASE FOUR (2021): 159.9 MtCO2 (plus a reserve of 11.5 MtCO2).
Phases & Allocation
TRADING PERIODSPHASE ONE: 1 year (2013)PHASE TWO: 2 years (2014–2015)PHASE THREE: 3 years (2018–2020)PHASE FOUR: 1 year (2021)
(2016–2017: System suspended)
According to the new Environmental Code, which will come into force in July 2021, the next National Allocation Plan will be developed for five years.
ALLOCATIONPHASE ONE (2013): Free allocation (grandparenting). Based on emissions data from 2010.
PHASE TWO (2014–2015): Grandparenting (0% and 1.5% below 2011–2012 average emissions), with a reserve of 18 MtCO2 in 2014 and 20.5 MtCO2 in 2015.
(2016–2017: System suspended)
PHASE THREE (2018–2020): Allocation based on grandpar-enting or product-based benchmarking, chosen by each company (149 installations chose benchmarking and 76 installations chose grandparenting). A reserve contained 35.3 million allowances to accommodate for new entrants, new stationary emission sources, and changes in output in case of the choice of benchmarking.
PHASE FOUR (2021): Benchmarking. A reserve contains 11.5 million allowances.
Flexibility
BANKING AND BORROWING Banking is allowed within each trading period (one phase). Banking between trading periods is not possible.
OFFSETS AND CREDITSQualitative Limits: Domestic offsets in all economic sectors (GHG reduction or absorption activities), except for emissions reductions at the installations covered by the ETS. Project applicants can submit their projects for consideration to the Ministry of Ecology, Geology and Natural Resources in order to obtain approval and gain offset credits. The approval of
carbon offsets and the provision of offset credits are carried out in accordance with IPCC methodologies and the rules developed and approved by the Ministry of Ecology, Geology and Natural Resources.
Quantitative Limits: None
← CONTENT

FACT
SHEE
TS –
03
KaZa
KhST
anSt
atus
Rep
ort 2
021
ICAP
49
2 – http://zan.gov.kz/client/#!/doc/31308/rus3 – http://adilet.zan.kz/rus/docs/K21000004004 – https://legalacts.egov.kz/npa/view?id=53311915 – http://zan.gov.kz/client/#!/doc/112765/rus6 – http://adilet.zan.kz/rus/docs/V1200007711
Compliance
COMPLIANCE PERIODOne year
MRVREPORTING FREQUENCY: Reporting is required annually for businesses or financial facilities above the 20,000 tCO2/year threshold.
Annual reporting also is required for operators of installations with emissions between 10,000 tCO2/year and 20,000 tCO2/year (so-called “subjects to administration”), even though these operators are not required to participate in the ETS or to verify annual emission reports.
Aside from CO2, reporting also is required for CH4, N2O, and PFCs emissions.
VERIFICATION: Emissions data reports and their underlying data require third-party verification by an accredited auditor.
FRAMEWORK: Environmental Code of the Republic of Kazakhstan.
ENFORCEMENTThe non-compliance penalty equals five monthly stan-dard units for each tonne (approximately KZT 14,585/tCO2 (USD 35.32) in 2021). In 2013 and 2014, penalties for noncom-pliance were waived.
Other Information
INSTITUTIONS INVOLVED Ministry of Ecology, Geology and Natural ResourcesMinistry of EnergyJSC Zhasyl Damu, a state-owned joint stock company
IMPLEMENTING LEGISLATION/REGULATIONEnvironmental Code of the Republic of Kazakhstan (2007)2
Environmental Code of the Republic of Kazakhstan (2021)3 National GHG Emission Quota Allocation Plan for 20214
Rules for the allocation of quotas for GHG emissions and formation of reserves of the established number and volume of quotas5
Rules of trading greenhouse gas emission quota and carbon units6
← CONTENT

FACT
SHEE
TS –
03
MO
nTEn
EGrO
Stat
us R
epor
t 202
1IC
AP
50
MONTENEGRO
In December 2019, Montenegro adopted the ‘Law on Protec-tion from the Negative Impacts of Climate Change,’ which entered into force in January 2020. The law mandates the development of a comprehensive set of climate policies including a GHG inventory, a low-carbon development strat-egy, and a national MRV system. It further sets the legal basis for a national ETS for the industry and power sectors.
A bylaw specific to the ETS, the ‘Decree on activities for which a GHG permit is issued,’ was adopted in February 2020. The regulation determines sectoral coverage and inclu-sion thresholds, rules governing trade of permits, allocation rules for auctions, benchmarking and grandfathering, and a market stabilization reserve. It further includes provisions
for banking allowances, a minimum reserve price of EUR 24/tonne (USD 27.41/tonne), and a linear reduction factor that would reduce the emissions cap by 1.5% year-on-year between 2020–2030. Revenue from auction proceeds would go to the Environmental Protection Fund to finance climate innovation, renewable energy, and environmental protection.
Montenegro has been an EU candidate country since 2010 and is required to bring its environmental and climate change policy in line with the EU as part of accession talks under Chapter 27 that began in late 2018. The national ETS would ensure that Montenegro has the climate policy infra-structure in place to take part in the EU ETS should it become a member country of the European Union.
Background Information
GHG REDUCTION TARGETSBY 2030: 30% GHG emissions reduction below 1990 levels (NDC)
Other Information
INSTITUTIONS INVOLVEDMinistry of Sustainable Development and Tourism
IMPLEMENTING LEGISLATION Decree on activities for which a GHG permit is issued (2020)1
Law on Protection from the Negative Impacts of Climate Change (2019)2
OVERALL GHG EMISSIONS (excluding LULUCF) 3.5 MtCO2e (2015)
Energy 2.5 (71%)industrial processes 0.4 (11%)agriculture 0.4 (11%)Waste 0.2 (6%)
OVERALL GHG EMISSIONS BY SECTOR (MtCO2e)
1 – https://epa.org.me/regulativa/ 2 – http://www.gov.me/ResourceManager/FileDownload.aspx?rId=384341&rType=2
In force
Under development
Under consideration
Designing an ETS as part of EU accession process
Announced several ETS design provisions in 2020, including a minimum price of EUR 24/tonne (USD 27.41/tonne)
← CONTENT

FACT
SHEE
TS –
03
SaKh
aLin
Stat
us R
epor
t 202
1IC
AP
51
SAKHALIN
In force
Under development
Under consideration
Mandate for pilot carbon trading system for the Sakhalin region in Russia in place Developed through a cooperation between local authorities and the Russian government
First transfers of carbon units could take place as soon as 2022
In January 2021, the Russian Ministry of Economic Devel-opment in cooperation with the government of the Russian region of Sakhalin approved the ‘Roadmap for the imple-mentation of an experiment to establish special regulation of greenhouse gas emissions in the Sakhalin Region’ to regulate GHG emissions in the region. Among other measures, the roadmap foresees a pilot carbon trading system. The overall aim of the roadmap is to ensure that Sakhalin achieves carbon neutrality by 2025.
The roadmap foresees the creation of a regional inventory of GHG emissions and removals by August 2021, which will clarify the economic activities primarily responsible for emis-sions in the region. By April 2022, an information system–including a carbon registry–is planned to start operating in test mode. The first transfers of carbon units between the participants of the pilot could take place as early as July 2022.
Sakhalin is regarded as a testing ground for identifying GHG regulation measures that can be extended to other Russian regions. Measures proposed by the roadmap still need formal legal approval from the State Duma, Russia’s lower house of parliament, which is expected in June-July 2021.
During the past decade, the Russian government has put in place legal elements for the development of an MRV system in the country. An MRV ‘Concept’ was approved by order of the Government No. 716-r in 2015, and methodolog-ical guidelines for corporate- and regional-level MRV were adopted by the Ministry of Natural Resources and Ecology. According to the Concept on MRV, the target group for moni-toring and reporting is “large industrial and energy organiza-tions and companies with direct GHG emissions of more than 150,000 tCO2e/year, including organizations of aviation and railway transport, carrying out passenger and cargo trans-portation.” Currently, Russian regions are urged to voluntarily develop regional inventories of GHG emissions and removals.
Background Information
GHG REDUCTION TARGETSBY 2030: GHG emissions will not exceed 70% of 1990 GHG levels, including LULUCF (updated Russian NDC)
Other Information
INSTITUTIONS INVOLVEDMinistry of Economic DevelopmentGovernment of Sakhalin RegionOther interested federal ministries
IMPLEMENTING LEGISLATION/REGULATIONRoadmap for the implementation of an experiment to estab-lish special regulation of greenhouse gas emissions in the Sakhalin Region 1
OVERALL GHG EMISSIONS (Russia, excluding LULUCF) 2,220.1 MtCO2e (2018)Energy (excluding transport) 1,498.5 (68%)industrial processes 243.1 (11%)Transport 254.1 (11%)agriculture 126.7 (6%)Waste 97.7 (4%)
OVERALL GHG EMISSIONS BY SECTOR (MtCO2e)
1 – https://economy.gov.ru/material/file/faf1abaae1e3f2be140971c9e934d0ab/dorozhnaya_karta.pdf
← CONTENT

FACT
SHEE
TS –
03
SWiT
ZErL
and
Stat
us R
epor
t 202
1IC
AP
52
POWER
INDUSTRY
AVIATION*
Entered a new 10-year trading phase in 2021 with updated provisions in line with the EU ETS Phase 4
Linked with the EU ETS since January 2020; registry link operational since September 2020
SECTORS:
In force
Under development
Under consideration
SWITZERLANDSwitzerland Emissions Trading System
CAP4.9 MtCO2e (2020, industry), 1.3 MtCO2e (2020, aviation)1
GASES Several gases
OFFSETS AND CREDITSno offsets or international credits can be used for compliance since 2021
ALLOCATIONFree allocation: Benchmarkingauctioning
AVERAGE 2020 PRICE2
EUr 24.9/tCO2e (USd 28.45)TOTAL REVENUE EUr 39.8 million (USd 45.3 million) since beginning of program, EUr 7.3 million (USd 8.3 million) collected in 2020
1 – New caps are calculated in accordance with the revised CO2 Ordinance (Annex 8 and 15), and will be released in Q1 2021. 2 – Average auction price
* domestic and outbound flights to the EEA
ETS DESCRIPTIONThe Switzerland (Swiss) ETS started in 2008 with a five-year voluntary Phase as an alternative option to the CO2 levy on fossil fuels. Revised regulations entered into force in January 2013. The system subsequently became manda-tory for large, energy-intensive entities, while medium-sized entities may join voluntarily. The Swiss ETS linked with the EU ETS in January 2020 and expanded sector coverage to Swiss domestic aviation (including flights to the European Economic Area) and fossil-thermal power plants. The ETS furthermore applies to industrial entities, largely comprising companies from the cement, chemicals, pharmaceuticals, paper, refinery, and steel sectors. It covered about 10% of the country’s total GHG emissions in 2019. Participants in the ETS are exempt from the CO2 levy.
YEAR IN REVIEWIn January 2020, the Swiss ETS officially linked with the EU ETS, thereby sealing a ten-year process of negotiations and regulatory alignment. A provisional registry link became oper-ational in September 2020, allowing for transfers between both registries and enabling covered entities to use European Union Allowances (EUAs) for compliance. Under the provi-sional link, transfers between the EU and Swiss registries were executed on eight pre-announced dates in 2020. Considered
the first phase of the agreement’s implementation, the provi-sional link is set to be replaced with a permanent registry link that will enable transfers of emission allowances between both ETS registries on a continuous basis.
2020 also marked the final year of the system’s second trading period (2013–2020). The revised ‘Ordinance on the Reduction of CO2 Emissions (CO2 Ordinance),’ the implementing legisla-tion of Switzerland’s key climate instruments, was adopted in November 2020 to update provisions in line with Phase 4 of the EU ETS. Notable changes to the system include: a revised linear reduction factor from 1.74% to 2.2%; the implemen-tation of updated EU ETS benchmarks by 2022 at the latest; and an indefinite extension of the system. The new legal base for the Swiss ETS has been embedded in the partially revised ‘CO2 Act’–the core framework of Switzerland’s climate legisla-tion–that entered into force in January 2021.
Alongside new revisions to the ETS, the Swiss Parlia-ment adopted in September 2020 the legal framework for Swiss Climate Policy 2030, which sets out a 50% emissions reduction target and has reinforced measures for the trans-port, buildings, and industry sectors. The updates will be enshrined in a fully revised ‘CO2 Act’ that is planned to enter into force by 2022, subject to a referendum in Q3 2021.
Background Information
OVERALL GHG EMISSIONS (excluding LULUCF) 46.4 MtCO2e (2018)
OVERALL GHG EMISSIONS BY SECTOR (MtCO2e)
Energy (excluding transport) 20.3 (44%)industrial processes 4.4 (9%)Transport 14.9 (32%)agriculture 6.0 (13%)Others (including waste) 0.7 (2%)
← CONTENT
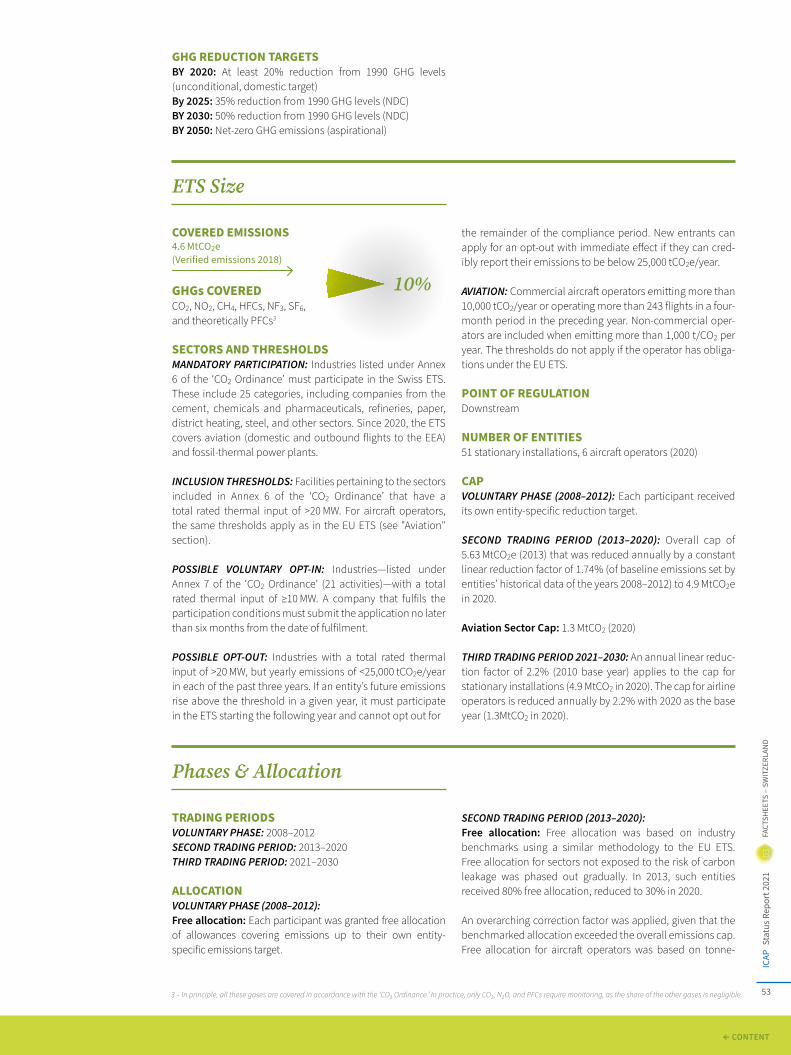
FACT
SHEE
TS –
03
SWiT
ZErL
and
Stat
us R
epor
t 202
1IC
AP
53
GHG REDUCTION TARGETSBY 2020: At least 20% reduction from 1990 GHG levels (unconditional, domestic target) By 2025: 35% reduction from 1990 GHG levels (NDC) BY 2030: 50% reduction from 1990 GHG levels (NDC) BY 2050: Net-zero GHG emissions (aspirational)
ETS Size
COVERED EMISSIONS4.6 MtCO2e(verified emissions 2018)
GHGs COVEREDCO2, NO2, CH4, HFCs, NF3, SF6, and theoretically PFCs3
SECTORS AND THRESHOLDSMANDATORY PARTICIPATION: Industries listed under Annex 6 of the ‘CO2 Ordinance’ must participate in the Swiss ETS. These include 25 categories, including companies from the cement, chemicals and pharmaceuticals, refineries, paper, district heating, steel, and other sectors. Since 2020, the ETS covers aviation (domestic and outbound flights to the EEA) and fossil-thermal power plants.
INCLUSION THRESHOLDS: Facilities pertaining to the sectors included in Annex 6 of the ‘CO2 Ordinance’ that have a total rated thermal input of >20 MW. For aircraft operators, the same thresholds apply as in the EU ETS (see "Aviation" section).
POSSIBLE VOLUNTARY OPT-IN: Industries—listed under Annex 7 of the ‘CO2 Ordinance’ (21 activities)—with a total rated thermal input of ≥10 MW. A company that fulfils the participation conditions must submit the application no later than six months from the date of fulfilment.
POSSIBLE OPT-OUT: Industries with a total rated thermal input of >20 MW, but yearly emissions of <25,000 tCO2e/year in each of the past three years. If an entity’s future emissions rise above the threshold in a given year, it must participate in the ETS starting the following year and cannot opt out for
the remainder of the compliance period. New entrants can apply for an opt-out with immediate effect if they can cred-ibly report their emissions to be below 25,000 tCO2e/year.
AVIATION: Commercial aircraft operators emitting more than 10,000 tCO2/year or operating more than 243 flights in a four-month period in the preceding year. Non-commercial oper-ators are included when emitting more than 1,000 t/CO2 per year. The thresholds do not apply if the operator has obliga-tions under the EU ETS.
POINT OF REGULATION Downstream
NUMBER OF ENTITIES 51 stationary installations, 6 aircraft operators (2020)
CAPVOLUNTARY PHASE (2008–2012): Each participant received its own entity-specific reduction target.
SECOND TRADING PERIOD (2013–2020): Overall cap of 5.63 MtCO2e (2013) that was reduced annually by a constant linear reduction factor of 1.74% (of baseline emissions set by entities’ historical data of the years 2008–2012) to 4.9 MtCO2e in 2020.
Aviation Sector Cap: 1.3 MtCO2 (2020)
THIRD TRADING PERIOD 2021–2030: An annual linear reduc-tion factor of 2.2% (2010 base year) applies to the cap for stationary installations (4.9 MtCO2 in 2020). The cap for airline operators is reduced annually by 2.2% with 2020 as the base year (1.3MtCO2 in 2020).
Phases & Allocation
TRADING PERIODSVOLUNTARY PHASE: 2008–2012SECOND TRADING PERIOD: 2013–2020THIRD TRADING PERIOD: 2021–2030
ALLOCATIONVOLUNTARY PHASE (2008–2012): Free allocation: Each participant was granted free allocation of allowances covering emissions up to their own entity- specific emissions target.
SECOND TRADING PERIOD (2013–2020):Free allocation: Free allocation was based on industry benchmarks using a similar methodology to the EU ETS. Free allocation for sectors not exposed to the risk of carbon leakage was phased out gradually. In 2013, such entities received 80% free allocation, reduced to 30% in 2020.
An overarching correction factor was applied, given that the benchmarked allocation exceeded the overall emissions cap. Free allocation for aircraft operators was based on tonne-
10%
3 – In principle, all these gases are covered in accordance with the ‘CO2 Ordinance.’ In practice, only CO2, N2O, and PFCs require monitoring, as the share of the other gases is negligible.
← CONTENT

FACT
SHEE
TS –
03
SWiT
ZErL
and
Stat
us R
epor
t 202
1IC
AP
54
kilometer data for 2018 reported by individual aircraft opera-tors, multiplied by the benchmark of 0.642 emissions allow-ances per 1,000 tonne-kilometers (same benchmark as in the EU ETS).
Auctioning: Allowances that were not allocated for free were auctioned. Auctions took place two or three times a year, depending on available auction volumes. As of January 2020, auctions were opened to entities covered by the Swiss ETS and the EU ETS, as well as to non-compliance entities allowed to place bids in the EU ETS. In line with EU ETS legislation, the Federal Office of the Environment has the authority to cancel the auction results if the clearing price is significantly below the prevailing secondary market price of the EU ETS. In such a situation, allowances are transferred to subsequent auctions.
5% of the allowances were set aside in a reserve for new entrants and fast-growing operators.
Aviation Sector: In line with EU ETS regulations, starting in 2020, 15% of aviation sector allowances were auctioned. 3% were placed in the reserve dedicated to new and fast-growing operators. The remaining 82% was allocated according to sector-specific benchmarks in line with the EU ETS.
THIRD TRADING PERIOD (2021–2030): Free allocation: Updated EU ETS benchmarks will apply starting 2022 at the latest. Free allocation levels may be updated annually if production levels deviate at least 15 percentage points from the 2014–2018 base years.
Auctioning: The same provisions apply as in the second trading period.
Flexibility
BANKING AND BORROWING Banking within and across phases is allowed without limits. Banked allowances from the EU ETS Phase 3 can equally be used for compliance in the 2021–2030 trading phase.
Valid certificates (CERs, ERUs) from the 2008–2012 phase could be banked into the second trading period and surren-dered until April 2015. Certificates from the 2008–2012 phase that were not requested to be carried over within the dead-line have been canceled.
Borrowing is not allowed. Implicit borrowing is allowed within trading periods, i.e., using allocated allowances from the current trading year for surrender obligations of the prior year.
OFFSETS AND CREDITSQUALITATIVE LIMIT: International offsets were allowed up to 2020, subject to certain criteria. Most categories of credits from CDM projects in least-developed countries were allowed. Credits from CDM and JI projects from other coun-tries were eligible only if registered and implemented before
31 December 2012. Since 2021, offsets can no longer be used to meet compliance obligations.
QUANTITATIVE LIMIT: During 2013–2020, the maximum amount of offsets allowed into the scheme equaled 11% of five times the average emissions allowances allocated in the voluntary phase (2008–2012) minus offset credits used in that same time period.
Industries that entered the Swiss ETS in the second trading period (2013–2020) could surrender offsets to cover up to 4.5% of their emissions. For aircraft operators, the quantita-tive limit was set at 1.5% of verified CO2 emissions.
MARKET STABILITY PROVISIONSAs of January 2020, the Swiss legislation foresees the possi-bility of reducing auction volumes where there is a significant increase of allowances on the market for economic reasons. In this case, unauctioned allowances will lose their validity. The Swiss ETS is not subject to the EU ETS Market Stability Reserve.
Compliance
COMPLIANCE PERIODOne year (1 January to 31 December). Covered entities have until 30 April of the following year to surrender allowances.
MRVMonitoring plans are required for every installation and for every aircraft operator (approved by a competent authority) no later than three months after the registration deadline.
REPORTING FREQUENCY: Annual monitoring report, based on self-reported information (by 31 March).
VERIFICATION: The Federal Office for the Environment may order third-party verification of the monitoring reports from installations and can take random samples to ensure consis-tency.
Aircraft operators must have their monitoring reports verified by an accredited third-party verifier.
← CONTENT

FACT
SHEE
TS –
03
SWiT
ZErL
and
Stat
us R
epor
t 202
1IC
AP
55
4 – https://www.admin.ch/opc/en/classified-compilation/20091310/index.html5 – https://www.admin.ch/opc/en/classified-compilation/20120090/index.html#a56 – https://www.newsd.admin.ch/newsd/message/attachments/63988.pdf
ENFORCEMENTThe penalty for failing to surrender sufficient allowances is set at CHF 125/tCO2 (USD 133.14/tCO2). In addition to the fine, entities must surrender the missing allowances in the following year.
Linking
LINKS WITH OTHER SYSTEMSSwitzerland concluded negotiations with the EU on linking the Swiss ETS to the EU ETS in 2015 and signed the concluded agreement in 2017. Following legislative approval and ratifi-cation in 2019, the link entered into force on 1 January 2020. Prior to that, revisions were made to align with the EU ETS legislative framework.
In March 2019, the Swiss Parliament approved legal changes to the ‘CO2 Act,’ the core framework of Swiss climate legis-
lation. In November 2019, the Federal Council made the necessary amendments to the ‘CO2 Ordinance’ which specifies regulations and implementation; these amend-ments expanded ETS coverage to civil aviation and fossil-thermal power plants. Under the link, covered entities in the Swiss ETS can use allowances from the EU ETS for compliance, and vice versa. The two systems run sepa-rate auctions. Market participants from the EEA need an account at the Swiss Emissions Trading Register in order to participate.
Other Information
INSTITUTIONS INVOLVED Federal Office for the Environment (FOEN)
EVALUATION/ETS REVIEWThe ‘CO2 Act’ (main ETS legislation) and ‘CO2 Ordinance’ (secondary ETS legislation) have been revised to align with the new 2030 climate policy framework and are to be imple-mented by 2022.
Transitional revisions to both documents came into effect on 1 January 2021 in order to ensure continuity on Swiss climate policy and extend the ETS (for an unlimited period).
Next steps towards the implementation of the new legislative framework by 2022 are:• Public consultation for the “full” revision of the ‘CO2 Ordi-
nance’ in spring 2021; and• A referendum in Q3 2021 on the “full” revision of the
‘Federal Act on the Reduction of CO2 Emissions,’ (‘CO2 Act’) (adopted by Parliament in 2020).
USE OF REVENUESRevenues from auctioning allowances are fed into the federal government budget.
IMPLEMENTING LEGISLATIONFederal Act on the Reduction of CO2 Emissions (CO2 Act)4
Ordinance on the Reduction of CO2 Emissions (CO2 Ordinance)5
CO2 Ordinance – Explanatory report6
← CONTENT

FACT
SHEE
TS –
03
TUrK
EYSt
atus
Rep
ort 2
021
ICAP
56
TURKEY
In force
Under development
Under consideration
Second Phase of the PMR completed
Draft framework for a pilot ETS developed
In April 2012, Turkey adopted a new regulatory framework for a comprehensive, mandatory MRV system. Monitoring started in 2015 and reporting (of 2015 emissions) began in 2016. Since 2012, Turkey has:• been studying the possible use of carbon pricing instru-
ments to help achieve its mitigation targets; and• worked with the PMR to enhance the MRV regulation
through pilot studies in the energy, cement, and refinery sectors.
A synthesis report outlining carbon market policy options for Turkey was submitted to the Climate Change and Air Management Coordination Board in November 2018. The PMR First Phase Closure Meeting was held at the end of 2018 and the PMR Second Phase officially began in February 2019.
With additional funding under the PMR Second Phase, Turkey has developed draft legislation as well as improved technical and institutional capacity to prepare the groundwork for piloting a suitable carbon pricing policy. By the end of 2020,
the country had held a series of workshops, conducted tech-nical analyses, and organized stakeholder meetings which culminated in:1
(1) the final draft legal and institutional framework for a pilot ETS, published in December 2020;
(2) the identification of the emission cap and development of the national allocation plan;
(3) the development of Turk-SIM, an ETS simulation with gamification features;
(4) the development of a transaction registry for the pilot ETS; and
(5) the assessment of Article 6 and options for Turkey.
Following the formal end of the PMR Second Phase in February 2020, Turkey is currently considering its partic-ipation in the Partnership for Market Implementation (PMI), the successor to PMR. Turkey is also a candidate to EU accession and thereby aims to complete the envi-ronmental obligations of the EU accession (including the EU ETS directive).
Background Information
GHG REDUCTION TARGETSBY 2030: Up to 21% reduction from the BAU scenario (INDC)
Compliance
MRVThe Turkish MRV legislation establishes an installation-level system for CO2 emissions for ~800 entities. Sector coverage includes the energy sector (total rated thermal input >20MW) and industry sectors (coke production, metals, cement, glass, ceramic products, insulation materials, pulp and paper, and chemicals over specified threshold sizes/production levels).
MONITORING AND REPORTING: Entities had until October 2014 to submit their first monitoring plans. Since then, enti-ties have also submitted monitoring plans and verified emis-sions reports for 2015–2019 to the Ministry of Environment and Urbanization.
1 – See https://pmrturkiye.csb.gov.tr/raporlar/ for the associated documents, some of which are only available in Turkish.
OVERALL GHG EMISSIONS (excluding LULUCF) 520.9 MtCO2e (2018)Energy (excluding transport) 288.6 (55%)industrial processes 65.2 (13%)Transport 84.5 (16%)agriculture 64.9 (12%)Waste 17.8 (3%)
OVERALL GHG EMISSIONS BY SECTOR (MtCO2e)
← CONTENT

FACT
SHEE
TS –
03
TUrK
EYSt
atus
Rep
ort 2
021
ICAP
57
VERIFICATION: Monitoring plans, emission data reports, and their underlying data require independent third-party verifi-cation annually for all entities. Verifiers were accredited by the Turkish Accreditation Organization by 2018.
OTHER: Entities that fail to comply with the Turkish MRV regulation are subject to sanctions under Turkish Environ-mental Law No. 2872.
Other Information
INSTITUTIONS INVOLVED Ministry of Environment and UrbanizationClimate Change and Air Management Coordination Board
← CONTENT

FACT
SHEE
TS –
03
UKra
inE
Stat
us R
epor
t 202
1IC
AP
58
In force
Under development
Under consideration
MRV law applies to installations from 1 January 2021 onwards
Data from the operation of the MRV system will provide the basis for an ETS
ETS legislation to be based on at least three years of MRV data
UKRAINEUkraine plans to establish a national ETS in line with its obligations under the ‘Ukraine-EU Association Agreement,’ which entered into force in September 2017. Issues related to climate change are addressed in Article 365 (c) Title V and in Annex XXX to the agreement, which outlines steps for the implementation of a national ETS, including:• adopting national legislation and designating competent
authority(ies); • establishing a system for identifying relevant installations
and GHGs;• developing a national allocation plan to distribute allow-
ances; • establishing a system for issuing allowances to be traded
domestically among installations in Ukraine; and• establishing MRV and enforcement systems, as well as
public consultations procedures.
The country has developed the main elements of the national MRV system to provide a solid basis for the upcoming ETS. In 2019, Ukraine adopted a framework law on MRV. The MRV law entered into force in 2020 and applies to installations from the start of 2021. By 31 March 2022, covered installations must submit the first monitoring reports for 2021. To estab-lish its ETS, Ukraine plans to develop separate legislation based on at least three years of data from the MRV system. According to a statement made by the Minister of Environ-mental Protection and Natural Resources in January 2021, the ETS launch could take place as early as in 2025. Ukraine is working on its ETS plans with the assistance of the PMR and the German Corporation for International Cooperation (GIZ).
Background Information
GHG REDUCTION TARGETS BY 2030: GHG emissions will not exceed 60% of 1990 GHG levels, including LULUCF (NDC)BY 2035: 20% GHG emissions reduction from final energy consumption from 2010 levels (Energy Strategy 2035)
BY 2050: GHG emissions from energy and industrial processes will not exceed 31–34% of 1990 GHG levels (Low Emission Development Strategy 2050)
Compliance
MRV REPORTING FREQUENCY: Reporting is required annually for: fuel combustion in installations over 20 MW; oil refining; and the production of: coke, metal ores, pig iron, steel, ferrous alloys including ferroalloys (if the total nominal thermal capacity of combustion units exceeds 20 MW), cement clinker, lime or the calcination of dolomite or magnesite (with a production capacity exceeding 50 tonnes per day),
nitric acid, and ammonia. Aside from CO2, reporting is also required for N2O emissions from nitric acid production.
VERIFICATION: Emissions data reports and their underlying data require accredited third-party verification by an accred-ited auditor.
FRAMEWORK: Law on the principles of monitoring, reporting, and verification of GHG emissions.
Other Information
INSTITUTIONS INVOLVED Ministry of Environmental Protection and Natural Resources of UkraineCabinet of Ministers of Ukraine
IMPLEMENTING LEGISLATION/REGULATIONLaw on the principles of monitoring, reporting and verifica-tion of greenhouse gas emissions1
OVERALL GHG EMISSIONS (excluding LULUCF) 339.2 MtCO2e (2018)Energy 191.3 (56%)industrial processes 56.5 (17%)Transport 35.0 (10%)agriculture 44.2 (13%)Waste 12.2 (4%)
OVERALL GHG EMISSIONS BY SECTOR (MtCO2e)
1 – https://zakon.rada.gov.ua/laws/show/377-20
← CONTENT

FACT
SHEE
TS –
03
UniT
Ed K
inGd
OM
Stat
us R
epor
t 202
1IC
AP
59
UNITED KINGDOMUK Emissions Trading Scheme
POWER
INDUSTRY
AVIATION
Launched on 1 January 2021, following the end of the UK’s participation in the EU ETS
Broadly similar in design to the EU ETS
Looking to align the cap with an appropriate net-zero trajectory
Possible expansion beyond power, industry, and aviation in the future; open to linking with other systems
SECTORS:
In force
Under development
Under consideration ETS DESCRIPTIONIn December 2020, the United Kingdom (UK) government confirmed that a UK Emissions Trading Scheme (UK ETS) would be in place from January 2021. Many design elements of the new system mirror those in Phase 4 of the EU ETS, in which the UK had participated since 2005. The UK ETS covers energy-intensive industries, the power sector, and aviation within the UK and European Economic Area (EEA), together making up about one third of the UK’s GHG emissions. The scheme’s cap is 5% below the UK’s notional share of the EU ETS cap (i.e., the EUAs that would have been available to the UK government for allocation) and will decline by 4.2 Mt per year initially. Provisions to ensure market stability include a Supply Adjustment Mechanism (SAM), a Cost Containment Mechanism (CCM), and – quite distinct from the EU ETS – a transitional Allowance Reserve Price of GBP 22 (USD 28.21). Moreover, in the first years, triggers for the UK ETS CCM will be lower than those of the equivalent EU ETS provisions, so as to allow for a smooth transition. To safeguard compet-itiveness and minimize the risk of carbon leakage, a share of allowances will be freely allocated to Emissions Intensive Trade Exposed (EITE) sectors using an approach similar to Phase 4 of the EU ETS. The UK government remains open to the possibility of linking the UK ETS to other systems, but no decision has been made on the preferred linking partners.
The first trading phase of the UK ETS will run until 2030. The entire scheme is due to be reviewed in 2023 and 2028, with ongoing reforms and developments of specific elements in the meantime.
YEAR IN REVIEWThe UK formally exited the EU on 1 January 2020, and the transition period ended on 31 December 2020. The UK no longer participates in the EU ETS, but the covered entities in the country have to surrender allowances under the EU ETS by 30 April 2021 for their 2020 compliance obligations. On 1 January 2021, the UK ETS was launched to ensure the continued contribution of a carbon price to the UK’s decar-bonization efforts. These efforts, described in more detail in the country’s recently announced NDC, include a GHG emis-sion reduction goal of 68% below 1990 levels by 2030 as well as a legislated net-zero emissions target by 2050.
In June 2020, the UK government completed a consultation process on “The Future of UK Carbon Pricing” and published an accompanying impact assessment.1 In November 2020, draft legislation was introduced for the UK ETS; however, the official decision to establish an ETS rather than a carbon tax was not taken until December 2020, after which the draft legislation was made into a statutory instrument.2
Background Information
GHG REDUCTION TARGETSBY 2030: 68% reduction from 1990 GHG levels (updated NDC)BY 2050: Net-zero GHG emissions (2019 amendment to the Climate Change Act 2008)
CAP155.7 MtCO2e (2021)
GASES Several gases
ALLOCATIONFree allocation: Benchmarkingauctioning
1 – https://www.gov.uk/government/consultations/the-future-of-uk-carbon-pricing.; https://assets.publishing.service.gov.uk/government/uploads/system/uploads/attachment_data/file/889038/The_future_of_UK_carbon_pricing_impact_assessment.pdf
2 – https://www.londonstockexchange.com/news-article/market-news/statement-from-hmg-nuclear-emissions-trading/14790837
OVERALL GHG EMISSIONS (excluding LULUCF) 461.7 MtCO2e (2018)
OVERALL GHG EMISSIONS BY SECTOR (MtCO2e)
Energy 104.9 (23%)industrial processes 10.2 (2%)Transport 124.4 (27%)public Sector Buildings 8.0 (2%)Business 79.0 (17%)residential 69.1 (15%)agriculture 45.4 (10%)Waste 20.7 (4%)
← CONTENT

FACT
SHEE
TS –
03
UniT
Ed K
inGd
OM
Stat
us R
epor
t 202
1IC
AP
60
ETS Size
COVERED EMISSIONS141.9 MtCO2e(Verified emissions3 2018)
GHGs COVEREDCO2, N2O, PFCs
SECTORS AND THRESHOLDSPOWER SECTOR & INDUSTRY: The ETS applies to a specified list of activities of installations in the power and industry sector. This includes activities involving combustion of fuels in installations with a total rated thermal input exceeding 20 MW, as well as activities in refining, heavy industry, and manufacturing. Power generators in Northern Ireland still fall under the EU ETS, as they are part of the Isle of Ireland’s Single Electricity Market.
In addition to the power sector’s participation in the UK ETS, the UK’s Carbon Price Support (CPS) policy imposes a minimum carbon price of GBP 18/tCO2 (USD 23.08) for power generators using fossil fuels. The CPS will continue to support the decarbonization of the power sector and will stay in place at least until unabated coal-fired power generation is phased out. The government has committed to end the use of unabated coal by 2024.
Small Emitter and Hospital Opt-Out Scheme: Hospitals and small emitters with emissions lower than 25,000 tCO2e per year and a net-rated thermal input lower than 35 MW can opt out of the ETS and instead monitor and report their emissions and meet annual emission reduction targets. This approach is similar to the UK’s opt-out scheme in Phase 3 of the EU ETS.
Ultra-Small Emitter Exemption: For stationary installations emitting less than 2,500 tCO2e per year, an ultra-small emitter exemption is in place. These installations are exempt from participation in the ETS, except for a requirement to monitor emissions and notify the regulator if emissions exceed the threshold.
AVIATION: Emissions are included from flights within the UK and flights from the UK to and from Gibraltar or to a country within the EEA. Exemptions are made for aircraft operators with less than 243 flights per calendar year for three consec-utive four-month periods or total annual emissions of less than 10,000 tonnes of CO2.
POINT OF REGULATIONDownstream
NUMBER OF ENTITIES~1,000 installations in the UK were subject to the EU ETS in Phase 3 and are now covered under the UK ETS.
CAPFIRST ALLOCATION PERIOD (2021–2025): 736.0 MtCO2e, to be adjusted to reflect the hospital and small emitter opt-outs.
SECOND ALLOCATION PERIOD (2026–2030): 630.1 MtCO2e, to be adjusted to reflect the hospital and small emitter opt-outs.
The cap was set at 5% below the UK’s notional share of the EU ETS cap for Phase 4 of the EU ETS. The annual cap for 2021 is 155.7 MtCO2e and will decline by 4.2 MtCO2e each year, which is equivalent to a reduction of 2.7% in the first year. Allowances for the New Entrants Reserve are part of the overall cap. The government indicated that it will consult on the cap’s trajectory within 9 months of the national Climate Change Committee’s advice on a cost-effective pathway to net-zero emissions. This advice, published in December 2020, included a recommended level of emissions from covered sectors of 106 MtCO2e in 2023, decreasing to 61 MtCO2e in 2030.
Phases & Allocation
TRADING PERIODSFIRST TRADING PERIOD: 2021–2030
ALLOCATIONAUCTIONING: Auctioning is the primary means of allow-ance allocation under the UK ETS. Auctions have a GBP 22 (USD 28.21) transitional Auction Reserve Price, which will be in place until a SAM (if implemented – see “Market Stability Provisions” section) becomes operational. Auctions clear even when not all allowances are sold. Unsold allowances
are carried over to the next four auctions, up to 125% of those originally intended for sale at that auction. If all four subse-quent auctions have reached the 125% limit, the remaining unsold allowances are transferred into a reserve in the Market Stability Mechanism Account.
FREE ALLOCATION: A limited number of allowances are allocated for free to industrial participants at risk of carbon leakage. The number of free allowances that an installation is entitled to is determined using the historical activity level,
31%
3 – The verified emissions of the regulated entities under the EU ETS are provided as an approximation.
← CONTENT

FACT
SHEE
TS –
03
UniT
Ed K
inGd
OM
Stat
us R
epor
t 202
1IC
AP
61
an industry benchmark, and a carbon leakage exposure factor (CLEF). The benchmarks and CLEFs to be used initially are those of the EU ETS during Phase 4. Historical activity levels are also based on data collected under the EU ETS. These parallels will likely result in comparable levels of free allocations for an installation in the UK ETS as it would have received had the UK participated in Phase 4 of the EU ETS.
The maximum number of allowances allocated for free (industry cap) is initially set at the UK’s notional share of the EU ETS industry cap for Phase 4, which is ~58 million allow-ances for 2021 (~37% of the UK ETS cap) and will decline by
1.6 million allowances per year. A review of the free allocation rules is planned to be carried out in 2021. New Entrants Reserve: A reserve of free allowances is set aside for installations that become eligible for participation within the first trading period and for covered installations that significantly increase their activity level. In line with the EU ETS Phase 4 approach, free allowance amounts are adjusted when activity levels of an installation increase or decrease by more than 15%. The number of free allowances for new entrants is determined based on their activity in the first year of operation, industry benchmark, and CLEF.
Flexibility
BANKING AND BORROWINGBanking of allowances is permitted, and allowances remain valid indefinitely.
Limited and implicit borrowing is allowed, i.e., using allow-ances allocated for free in the current year for compliance in the previous year. Covered entities are not allowed to use allowances left over from their participation in the EU ETS for compliance with the UK ETS.
OFFSETS AND CREDITSThe use of offsets for compliance is not permitted at this time, although the UK government has indicated it is open to reviewing this as the scheme evolves, especially in deciding on how to implement obligations under the Carbon Offsetting and Reduction Scheme for International Aviation (CORSIA) alongside the ETS for aviation.
MARKET STABILITY PROVISIONSSUPPLY ADJUSTMENT MECHANISM (SAM): A Supply Adjust-ment Mechanism based on the EU ETS Market Stability Reserve (MSR) may be implemented after the launch of the UK ETS. If the UK government decides to implement a SAM along these lines, it will hold a separate consultation on the design of the mechanism. Given that a SAM similar to the MSR would require a measure of the allowance surplus in the UK ETS (analogous to the Total Number of Allowances in Circulation in the EU ETS), a SAM cannot be operational until mid-2022 at the earliest. To reduce the risks at the early stages of the UK ETS and ensure minimum price continuity, the UK government has put in place a transitional Auction Reserve Price (see “Allocation” section).
COST CONTAINMENT MECHANISM (CCM): The UK ETS has a Cost Containment Mechanism to avoid spikes in allow-ance prices by auctioning additional allowances. If the CCM is triggered, regulators can decide on whether and how to intervene. Additional allowances from within the cap can be introduced from three possible sources: the reserve in the Market Stability Mechanism Account; future auctions; or the auctioning of up to 25% of remaining allowances in the New Entrants Reserve (NER). The CCM is similar to the measures described in paragraph 29a of the EU ETS Directive.
Triggers: In the first two years of the UK ETS, the CCM has lower price and time triggers than the equivalent EU ETS provisions, to ensure its reactiveness. In the first year, the CCM is triggered if, for three consecutive months, the ETS carbon price is two times the average allowance price in effect in the UK in the two preceding years. In the second year, the trigger is increased to two and a half times the carbon price for three months. The CCM will revert to the EU ETS price triggers in the third year. This means it would be triggered if, for six consecu-tive months, the allowance price is more than three times the average market price of allowances during the two preceding years.
TRANSITIONAL AUCTION RESERVE PRICE (ARP): To ensure a minimum level of ambition in the transition from the EU ETS to the UK ETS, a transitional Auction Reserve Price of GBP 22 (USD 28.21) is in place. The transitional ARP will be kept under review and the government will consult on withdrawing it as the system matures or if a SAM becomes operational. An ARP would not be implemented in a UK ETS fully linked to the EU ETS, as price convergence would be expected between the two markets.
Compliance
COMPLIANCE PERIODOne year (1 January to 31 December). Covered entities have until 30 April of the following year to surrender allowances. These provisions are the same as under the EU ETS.
← CONTENT

FACT
SHEE
TS –
03
UniT
Ed K
inGd
OM
Stat
us R
epor
t 202
1IC
AP
62
MRVThe UK ETS has adopted the EU ETS approach to MRV, with some changes.
REPORTING FREQUENCY: Annual self-reporting
VERIFICATION: Verification by independent accredited veri-fiers is required before 31 March each year.
FRAMEWORK: The UK ETS has adopted the MRV framework of Phase 4 of the EU ETS, including discretionary changes regarding reduced frequency of improvement reporting and the simplification of monitoring plans.
ENFORCEMENTRegulated entities must pay an excess emissions penalty for each tonne of CO2 emitted without surrendering a permit. This penalty is equal to GBP 100/tCO2e (USD 128.21) initially, but is adjusted for inflation over time. The names of non-com-pliant operators are published.
Linking
LINKS WITH OTHER SYSTEMSNo link with another system is currently in place. The UK government has indicated it is open to the possibility of inter-nationally linking the scheme in the future, but has not made any decision on preferred linking partners. The post-Brexit
Trade and Cooperation Agreement between the EU and UK stipulates that the jurisdictions “shall give serious consid-eration to linking their respective carbon pricing systems in a way that preserves the integrity of these systems and provides for the possibility to increase their effectiveness.”
Other Information
INSTITUTIONS INVOLVEDUnited Kingdom Department for Business, Energy & Industrial StrategyHM TreasuryUnited Kingdom Department for TransportScottish GovernmentWelsh GovernmentNorthern Ireland ExecutiveEnvironment Agency UKScottish Environment Protection AgencyNatural Resources Body for WalesNorthern Ireland Environment AgencyOffshore Petroleum Regulator for Environment and Decommissioning
EVALUATION/ETS REVIEWThe first trading period (2021–2030) includes two mandatory whole-system reviews. The first review must be carried out by the end of 2023 and the second by the end of 2028. A report will be published on the conclusions of each review round. Changes to the ETS design following the reviews should be implemented by 2026 and 2031, respectively.
In addition to the whole-system reviews, the government will conduct targeted reviews of inter alia free allocation for stationary installations and aviation and changes required to align with CORSIA.
USE OF REVENUESThe UK government is exploring the possibility of estab-lishing a Fund for Industrial Decarbonisation, to which UK ETS auction revenues would contribute.
IMPLEMENTING LEGISLATION/REGULATIONThe Greenhouse Gas Emissions Trading Scheme Order 20204 The Climate Change Act 2008 (2050 Target Amendment) Order 20195
4 – https://www.legislation.gov.uk/uksi/2020/1265/contents/made 5 – https://www.legislation.gov.uk/uksi/2019/1056/contents/made
← CONTENT

NORTH AMERICA

FACT
SHEE
TS –
03
CaLi
FOrn
iaSt
atus
Rep
ort 2
021
ICAP
64
CAP320.8 MtCO2e (2021)
GASES Several gases
OFFSETS AND CREDITSdomestic1
ALLOCATIONFree allocation: Benchmarking Free allocation with consignmentauctioning
AVERAGE 2020 PRICEUSd 17.04 / tCO22
TOTAL REVENUE USd 14.24 billion since beginning of program, USd 1.7 billion3 collected in 2020
1 – California’s Cap-and-Trade Program allows the use of offsets issued by linked jurisdictions (e.g., Québec).2 – Average 2020 auction settlement price.3 – Does not include revenue from auctioning of consigned allowances.
ETS DESCRIPTIONCalifornia’s Cap-and-Trade Program began operation in 2012, with the opening of its tracking system for allocation, auction distribution, and trading of compliance instruments. The first compliance obligations started in January 2013. California has been part of the Western Climate Initiative since 2007 and formally linked its system with Québec’s in January 2014. The California program, which is implemented by the Cali-fornia Air Resources Board (CARB), covers sources respon-sible for approximately 80% of the state’s GHG emissions. Key amendments to the system took effect in 2021, following the passage of legislation clarifying the role of the program after 2020 (Assembly Bill [AB] 398) and regulatory amendments adopted by CARB. Among the major changes to the system that started in 2021 are the addition of a price ceiling, the inclusion of two allowance price containment reserve tiers below the price ceiling, reductions in the use of offset credits (especially for credits generated from projects which do not provide direct environmental benefits in the state), and a steeper allowance cap decline to 2030.
YEAR IN REVIEWIn January 2020, CARB approved the membership of the Compliance Offsets Protocol Task Force, which is required by AB 398 to advise CARB on approving new protocols for the purpose of increasing offset projects with direct environ-mental benefits in the state of California while prioritizing disadvantaged communities, Native American or tribal lands, and rural and agricultural regions. AB 398 defines direct envi-ronmental benefits in the state as offsets that reduce or avoid emissions in California or pollutants that adversely affect the state’s waterways.
In 2020, CARB released an application form that project sponsors may submit if they wish to seek a determination that these projects provide direct environmental benefits in the state. CARB also began making determinations about the direct environmental benefits of offsets. Starting in 2021, no more than half of the offset credits that an entity surrenders for compliance can come from projects that do not provide direct environmental benefits in the state (see "Offsets and Credits" section for more details).
Background Information
GHG REDUCTION TARGETSBY 2020: Return to 1990 GHG levels (AB 32)BY 2030: 40% reduction from 1990 GHG levels (AB 398)BY 2045: Achieve carbon neutrality (Executive Order B-55-18)
POWER
INDUSTRY
TRANSPORT*
BUILDINGS*
* Sectors represent upstream coverage
Broadest carbon pricing system in the US
Continued linkage with Québec
Series of major changes start in 2021, including to cost-containment provisions, offset usage limits, and a steeper cap decline
CALIFORNIACalifornia Cap-and-Trade Program
SECTORS:
In force
Under development
Under consideration
OVERALL GHG EMISSIONS (excluding LULUCF) 425.3 MtCO2e (2018)
OVERALL GHG EMISSIONS BY SECTOR (MtCO2e)
Electricity Generation (in state) 38.6 (9%)(imports) 24.6 (6%)industrial processes 101.3 (24%)Transport 173.8 (41%)Commercial 23.9 (6%)residential 30.5 (7%)agriculture and Forestry 32.6 (8%)
← CONTENT

FACT
SHEE
TS –
03
CaLi
FOrn
iaSt
atus
Rep
ort 2
021
ICAP
654 – Approximately 330 registered covered/opt-in entities. These entities represent approximately 500 registered emitting sources/facilities.
ETS Size
COVERED EMISSIONS319.9 MtCO2e(Verified emissions3 2018)
GHGs COVEREDCO2, CH4, N2O, SF6, HFCs, PFCs, NF3, and other fluorinated GHGs.
SECTORS AND THRESHOLDSFIRST COMPLIANCE PERIOD (2013–2014): Covered sectors include those that have one or more of the following processes or operations: large industrial facilities (including cement, glass, hydrogen, iron and steel, lead, lime manufac-turing, nitric acid, petroleum and natural gas systems, petro-leum refining, and pulp and paper manufacturing, including cogeneration facilities co-owned/operated at any of these facilities); electricity generation; electricity imports; other stationary combustion; and CO2 suppliers.
SINCE THE SECOND COMPLIANCE PERIOD: In addition to the sectors listed above, suppliers of natural gas, suppliers of reformulated blendstock for oxygenate blending (i.e., gasoline blendstock) and distillate fuel oil (i.e., diesel fuel), suppliers of liquid petroleum gas in California, and suppliers of liquefied natural gas.
INCLUSION THRESHOLDS: Facilities ≥25,000 tCO2e/data year. Electricity providers that import 25,000 tCO2e per year or more from specified sources of electricity (those with known emissions factors) are considered to be above the threshold. All imported electricity from unspecified sources
(those without known emissions factors) is considered to be above the threshold, and a default value is applied as an emissions factor.
POINT OF REGULATIONMixed
NUMBER OF ENTITIES~500 facilities4
CAPFIRST COMPLIANCE PERIOD (2013–2014): The system started in 2013 with a cap of 162.8 MtCO2e, declining to 159.7 MtCO2e in 2014.
SECOND COMPLIANCE PERIOD (2015–2017): With the program expanding to include fuel distribution, the cap rose to 394.5 MtCO2e in 2015. The cap decline factor averaged 3.1% per year in the second compliance period (2015–2017), reaching 370.4 MtCO2e.
THIRD COMPLIANCE PERIOD (2018–2020): The cap in the third compliance period started at 358.3 MtCO2e and declined at an average annual rate of 3.3% to 334.2 MtCO2e in 2020.
FOURTH COMPLIANCE PERIOD (2021–2023) AND BEYOND: During the period 2021–2030, the cap declines by about 13.4 MtCO2e each year, averaging about 4% per year and reaching 200.5 MtCO2e in 2030.
The Cap-and-Trade Regulation sets a formula for declining caps after 2030 through 2050.
Phases & Allocation
TRADING PERIODSThe California Cap-and-Trade Program is structured around compliance periods (see “Compliance” section). A cap trajectory has been set through 2030, with a formula for the declining annual caps through 2050 (see “Cap” section).
Allowances are both allocated and auctioned, with each allowance associated with a specific calendar year vintage. Some allowances with a vintage three years in the future are offered at each auction and may be traded, but these future vintage allowances may not be used for compliance until the compliance date for the vintage year.
ALLOCATIONAllowances are distributed via free allocation, free allocation with consignment, and auction.
FREE ALLOCATION: Industrial facilities: Facilities receive free allowances to minimize carbon leakage. For nearly all industrial facilities, the amount is determined by product-specific benchmarks, recent production volumes, a cap adjustment factor, and an assistance factor based on assessment of leakage risk.
Leakage risk is divided into tiers of “low”, “medium”, and “high” based on levels of emissions intensity and trade expo-sure. The Cap-and-Trade Regulation as adopted in 2011 set assistance factors of 100% for the first compliance period regardless of leakage risk. For facilities with medium leakage risk, the original regulation included an assistance factor decline to 75% for the second compliance period and to 50% for the third compliance period. For facilities with low leakage risk, it included an assistance factor decline to 50% for the second compliance period and to 30% for the third compliance period. Amendments to the Cap-and-Trade Regulation in 2013 delayed these assistance factor declines
75%
← CONTENT

FACT
SHEE
TS –
03
CaLi
FOrn
iaSt
atus
Rep
ort 2
021
ICAP
66
by one compliance period, and AB 398 (adopted in 2017) set all assistance factors to 100% for 2021–2030, citing continued vulnerability to carbon leakage. In adjusting these factors pursuant to AB 398, CARB also set all assistance factors in the same manner for the 2018–2020 period.
There is no cap on the total amount of industrial alloca-tion, but the formula for allocation includes a declining cap adjustment factor to gradually reduce allocation in line with the overall cap trajectory.
Free allocation is also provided for transition assistance to public wholesale water entities, legacy contract generators, universities, public service facilities, and, beginning in 2018, waste-to-energy facilities.
CONSIGNMENT: Electrical distribution utilities and natural gas suppliers: Receive free allocation on behalf of their ratepayers. All natural gas and electrical utilities must use the allowance value for ratepayer benefit and for emissions reductions.
All allowances allocated to investor-owned electric utilities and an annually increasing percentage of allowances allo-cated to natural gas suppliers must be consigned for sale at the state’s regular quarterly auctions. Publicly owned elec-trical utilities can choose to consign freely allocated allow-ances to auction or use them for their own compliance needs.
AUCTIONING: In 2020, about 58% of total California-issued vintage 2020 allowances were made available through auction, which included allowances owned by CARB (~ 32%) and allowances consigned to auction by utilities (~ 26%).
Unsold allowances in past auctions are removed from circu-lation and will gradually be released for sale at auction after two consecutive auctions are held in which the sale price is higher than the minimum price. However, if any of these allowances remain unsold after 24 months, they will be placed into CARB’s price ceiling reserve or into the two lower reserve tiers (see “Market Stability Provisions” section). To date, 37 million allowances originally designated for auction have been placed in reserves through those provisions.
Flexibility
BANKING AND BORROWINGBanking is allowed but is subject to the general holding limit on allowances to which all entities in the system are held. The holding limit varies based on the year’s cap. Emitting entities may also be eligible for a limited exemption from the holding limit based on their emissions levels to meet annual compli-ance obligations or obligations at the end of a three-year compliance period.
Borrowing from future vintage allowances is not allowed.
OFFSETS AND CREDITSQUANTITATIVE LIMIT: For compliance obligations related to 2013–2020 emissions, entities are held to a limit of meeting up to 8% of their obligations for a compliance period through offsets. Starting with their 2021 emissions, entities are subject to new limits that were established by AB 398. The share of offsets that can be used to fulfil the compliance obligation will decrease to 4% per year for 2021–2025 emissions and will increase to 6% starting with 2026 emissions.
QUALITATIVE LIMIT: Currently, six domestic offset types are accepted as compliance units originating from projects carried out according to six compliance offset protocols:• US Forest Projects• Urban Forest Projects• Livestock Projects (methane management) • Ozone-Depleting Substances Projects• Mine Methane Capture Projects• Rice Cultivation Projects.
In addition to setting new quantitative limits on the use of offsets, AB 398 set new limits on the types of units that can fulfil compliance obligations. Starting with 2021 compliance obligations, no more than one half of any entity’s offset usage limit can come from offsets that do not provide direct envi-ronmental benefits in the state of California (DEBS). Projects located within California are considered to provide DEBS. Offset projects implemented outside of California may still result in DEBS, based on scientific evidence and project data provided. For example, a forest project outside California has been determined to provide benefits within California by improving the quality of waters flowing through California. Recent regulatory amendments specify the criteria that will be used for determining DEBS.
Offset credits issued by jurisdictions linked with California (e.g., Québec) are eligible to be used to satisfy a California entity’s compliance obligation, subject to the quantitative usage limit.
To ensure environmental integrity, California’s offset program has incorporated the principle of buyer liability. The state may invalidate an offset credit that is later determined to have not met the requirements of an offset protocol because of double counting, over-issuance, or regulatory non-con-formance. The entity that surrendered that offset credit for compliance must then substitute a valid compliance instru-ment for the invalidated offset credit.
← CONTENT

FACT
SHEE
TS –
03
CaLi
FOrn
iaSt
atus
Rep
ort 2
021
ICAP
67
MARKET STABILITY PROVISIONSAUCTION RESERVE PRICE: USD 17.71 per allowance in 2021. The auction reserve price, the minimum price at which allow-ances are available at auction, increases annually by 5% plus inflation, as measured by the Consumer Price Index. RESERVE: Allowances from each annual cap were placed in an Allowance Price Containment Reserve (APCR) (1% from the 2013–2014 compliance period; 4% from the 2015–2017 compliance period; and 7% from the 2018–2020 compliance period). Until the end of 2020, these allowances populated three price tiers in equal quantities. AB 398 replaced the three tiers with a new structure of two tiers and a price ceiling starting in 2021. AB 398 also directed where remaining allow-ances from the earlier APCR would be distributed. Specifi-cally, two-thirds of those allowances are spread evenly across the two new price tiers. The remaining one-third (which had been spread evenly across the original three price tiers), plus unsold allowances that have been transferred into the APCR (about 37 million to date), are placed in the price ceiling reserve. In addition, the Cap-and-Trade Regulation also sets aside portions of annual allowance caps for the two lower price tiers from 2021–2030.
Although no reserve sale has been held to date, CARB will offer a reserve sale when auction settlement prices from the preceding quarter are at least 60% of the lowest price tier. CARB will also offer a reserve sale just before the compliance obligation deadline, if requested by at least one covered entity.
At the price ceiling, a covered entity can purchase allowances (or if no allowances remain, “price ceiling units”) up to the amount of its current unfulfilled emissions obligation. The revenues from the sale of price ceiling units will be used to purchase real, permanent, quantifiable, verifiable, enforce-able, and additional emissions reductions on at least a metric tonne for metric tonne basis. Sales at the price ceiling will only be conducted if no allowances remain at the two lower tiers.
In 2021, the two cost containment reserve tiers and the price ceiling are set at USD 41.40, USD 53.20, and USD 65.00, respectively. Tier prices increase by 5% plus inflation (as measured by the Consumer Price Index).
Compliance
COMPLIANCE PERIODExcept for the year following the last year of a compliance period, compliance instruments equal to 30% of the previous year’s verified emissions must be surrendered annually, by 1 November (or the first business day thereafter). Compliance instruments equal to all remaining emissions must be surren-dered by 1 November (or the first business day thereafter) of the year following the last year of a compliance period.
FIRST COMPLIANCE PERIOD: 2013–2014
SUBSEQUENT COMPLIANCE PERIODS: Three calendar years (2015–2017, 2018–2020, and so forth)
MRV REPORTING FREQUENCY: Annually
VERIFICATION: Emission data reports and their underlying data require independent third-party verification annually for all entities covered by the program.
FRAMEWORK: Reporting is required for most emitters at or above 10,000 tCO2e per year. They must implement internal audits, quality assurance, and control systems for the reporting program and the data reported.
ENFORCEMENTA covered entity that fails to surrender sufficient compliance instruments to cover its verified GHG emissions on either an annual surrender deadline or at the end of a compliance period is automatically assessed as an untimely surrender obligation, requiring it to surrender each missing compliance instrument as well as three additional compliance instru-ments for each compliance instrument it failed to surrender.
Failure to meet the untimely surrender obligation as described above would subject the entity to substan-tial financial penalties for its noncompliance pursuant to California Health and Safety Code Section 38580.
Separate and substantial penalties apply to mis- or non-re-porting under the Regulation for the Mandatory Reporting of Greenhouse Gas Emissions.
← CONTENT

FACT
SHEE
TS –
03
CaLi
FOrn
iaSt
atus
Rep
ort 2
021
ICAP
68
5 – https://leginfo.legislature.ca.gov/faces/billNavClient.xhtml?bill_id=200520060AB326 – http://leginfo.legislature.ca.gov/faces/billTextClient.xhtml?bill_id=201720180AB398 7 – https://ww3.arb.ca.gov/regact/2018/capandtrade18/ct18fro.pdf?_ga=2.68405201.1545648372.1576533466-747824352.1574948884 8 – https://ww2.arb.ca.gov/our-work/programs/cap-and-trade-program
Linking
LINKS WITH OTHER SYSTEMSCalifornia linked with Québec’s ETS on 1 January 2014. The two expanded their joint market by linking with Ontario on 1 January 2018 until the termination of Ontario’s system in mid-2018.
Other Information
INSTITUTIONS INVOLVEDCalifornia Air Resources Board
EVALUATION/ETS REVIEWPursuant to requirements in existing legislation (AB 32, AB 197, and AB 398), CARB must update the California Climate Change Scoping Plan at least every five years and must provide annual reports to various committees of the legisla-ture and the board. The Scoping Plan provides updates on progress toward climate targets and lays out strategies to achieve them, including the role and level of effort accorded different programs in the state’s portfolio approach to climate mitigation.
USE OF REVENUESSINCE BEGINNING OF PROGRAM: USD 14.24 billion
COLLECTED IN 2020: USD 1.70 billion
REVENUE FROM AUCTION OF CALIFORNIA-OWNED ALLOW-ANCES: Most of California’s revenue goes to the Greenhouse Gas Reduction Fund, of which at least 35% must benefit disadvantaged and low-income communities. The fund also invests the proceeds in projects that reduce GHG emissions.
REVENUE FROM AUCTION OF UTILITY-OWNED ALLOW-ANCES: Investor-owned electric utilities and natural gas suppliers are allocated allowances, a portion of which must be consigned to auction. Auction proceeds must be used for ratepayer benefit and for emissions reductions.
IMPLEMENTING LEGISLATIONGlobal Warming Solutions Act of 2006 (AB 32)5
AB 3986
2018 amendments to the 2021–2030 period7
Current regulation can be found on the CARB website8
← CONTENT

FACT
SHEE
TS –
03
Cana
daSt
atus
Rep
ort 2
021
ICAP
69
CANADA
Carbon pricing in place across Canada
Provinces and territories have the flexibility to choose carbon pricing mechanisms that best suit their respective contexts
The Pan-Canadian Approach to Pricing Carbon Pollution has begun a program review, targeting completion by early 2022
In December 2016, Canada’s Prime Minister and Premiers adopted the ‘Pan-Canadian Framework on Clean Growth and Climate Change’ (PCF). The PCF was Canada’s first ever feder-al-provincial-territorial plan to fight climate change, build resilience to the changing climate, and drive clean economic growth. The PCF includes pricing carbon pollution across Canada as a foundational pillar.
The ‘Pan-Canadian Approach to Pricing Carbon Pollution,’ released in October 2016, gives provinces and territories the flexibility to implement their own pricing systems, as long as they meet minimum federal stringency criteria (known as the federal “benchmark”).
To meet the federal benchmark, provinces and territories can choose from several options, including:(1) An explicit price-based system (e.g., a carbon tax like that
in British Columbia);(2) A combination (“hybrid”) of a charge on fossil fuels and an
intensity-based baseline-and-credit system for industrial emitters. For the baseline-and-credit systems, standards can be set based on provincial/territorial circumstances. These standards should be at levels that drive improved performance in carbon intensity and should account for best-in-class performance;
(3) A cap-and-trade system.
For price-based or hybrid systems, the Pan-Canadian Approach set the minimum price stringency at CAD 10 (USD 7.46) in 2018, rising CAD 10 (USD 7.46) per year to reach CAD 50 (USD 37.28) in 2022. For cap-and-trade systems, modeling has to demonstrate that expected emissions reduc-tions are at least equal to those that would have resulted from a carbon tax with the above-described price trajectory.
All systems are required to have common scope by applying pricing to substantively the same sources as British Colum-bia’s carbon tax, i.e., covering fuels combusted for electricity, heating, transport, and industry.
In addition, provincial/territorial emission reduction targets must be set equal to or greater than the federal reduction target (30% below 2005 levels by 2030).
The federal carbon pollution pricing “backstop” system applies in jurisdictions that request it or do not implement systems that meet the federal benchmark.
In December 2020, the federal government announced ‘A Healthy Environment and a Healthy Economy’—Canada’s
strengthened climate plan of federal policies, programs, and CAD 15 billion (USD 11.2 billion) in investments to build a stronger, cleaner, more resilient, and inclusive economy. Once fully implemented, ‘A Healthy Environment and a Healthy Economy’ is expected to enable Canada to exceed its current 2030 GHG reduction target. The plan proposes to continue to put a price on carbon pollution through to 2030, rising at CAD 15 (USD 11.18) per year from 2022–2030 until it reaches CAD 170 (USD 126.76) in 2030. The plan also proposes to review the federal benchmark in order to strengthen the standards against which provincial/territorial systems are assessed.
FEDERAL CARBON POLLUTION PRICING “BACKSTOP” SYSTEM: Under the ‘Greenhouse Gas Pollution Pricing Act,’ the federal backstop system has two parts:• A regulatory charge on fossil fuels such as gasoline and
natural gas, known as the fuel charge. Generally, the fuel charge applies early in the supply chain and is payable by a registered producer or distributor. The fuel charge started at CAD 20 per tCO₂e (USD 14.91) in 2019 and has been increasing annually by CAD 10 (USD 7.46), until it reaches CAD 50 per tCO₂e (USD 37.28) in 2022.
• A performance-based system for industries, known as the federal Output-Based Pricing System (OBPS). The federal OBPS is designed to ensure that there is a price incentive available for industrial emitters to reduce their GHG emis-sions and spur innovation, while maintaining competitive-ness and protecting against carbon leakage. The OBPS applies to companies in the industrial and electricity sectors that emit equal to 50,000 tCO2e or more annually. Smaller installations with annual emissions that equal 10,000 tCO₂e or more per year are able to apply to volun-tarily participate.
The OBPS sets a performance standard (i.e., GHG emissions per unit of output) for different industrial activities. Facili-ties that produce more emissions than the standard have to compensate for the excess. Facilities whose emissions are below the standard get surplus credits they can sell or save to use later. Facilities can comply by: (1) remitting surplus credits purchased from other facilities or retained from previous periods; (2) paying the carbon price; or (3) remitting eligible offset credits. Final regulations for the OBPS were released in June 2019 and a review of the OBPS Regulations is scheduled for 2022. An updated discussion paper was published in July 20201 to seek input on a national carbon offset program. The development of this program is still in progress.
Direct proceeds from the federal carbon pricing system are returned to the jurisdiction of origin.
1 – https://www.canada.ca/content/dam/eccc/documents/pdf/climate-change/pricing-pollution/pricing-pollutionProtocol-Development-GHG-Offset-System-v6.pdf
← CONTENT

FACT
SHEE
TS –
03
Cana
daSt
atus
Rep
ort 2
021
ICAP
70
An annual verification process is carried out to ensure provin-cial/territorial carbon pollution pricing systems continue to meet the federal backstop criteria. The federal government also monitors major changes to provincial/territorial systems on an ongoing basis.
PRICING SYSTEMS ACROSS CANADA: The Government of Canada has confirmed that the carbon pollution pricing systems in the following provinces/territories continue to fully meet federal benchmark stringency requirements:• British Columbia (carbon tax);• Nova Scotia (cap-and-trade system);• Northwest Territories (territorial carbon tax); and• Québec (cap-and-trade system, which is linked to California).
In the following provinces, the federal backstop applies in part:• Alberta: The federal fuel charge took effect in Alberta in
January 2020. The charge will increase every 1 April there-after, beginning in April 2020. Alberta’s TIER (Technology Innovation and Emissions Reductions Regulation) system for large emitters, which also took effect in January 2020, replaced Alberta’s previous approach to pricing carbon pollution for industry. TIER aligns with the federal bench-mark for the emission sources it covers.
• New Brunswick: The federal OBPS has been in place since January 2019. In September 2020, the federal government informed the Government of New Brunswick that its carbon pollution pricing system for industrial facil-ities meets the federal government’s minimum stringency benchmark requirements for pricing carbon pollution for the sources that it covers. As a result, the Government of Canada intends to stand down the OBPS in New Bruns-wick (the date is still to be determined). The province’s fuel charge, approved by the federal government in December
2019, meets the federal stringency requirements for the emission sources that it covers. The fuel charge took effect in April 2020, starting at a rate of CAD 30 per tonne (USD 22.37).
• Prince Edward Island: The federal OBPS applies in the province. The province’s carbon levy on fuels meets the federal benchmark stringency requirements.
• Saskatchewan: Saskatchewan has a provincial OBPS for large industrial emitters, with the exception of the elec-tricity-generating and -transmission pipeline sectors; as a result, these sectors are covered by the federal OBPS. The Saskatchewan OBPS sets a compliance price of CAD 40 per tonne (USD 29.83) in 2021 on emissions from regulated facilities such as oil and gas, mining, manufacturing, and others. The federal fuel charge has been applied in the province since April 2019.
The federal backstop is fully in place in:• Manitoba• Ontario: In September 2020, the federal government
informed the Government of Ontario that its carbon pollu-tion pricing system for industrial facilities meets the federal government’s minimum stringency benchmark require-ments for pricing carbon pollution for the sources that it covers. As a result, the Government of Canada intends to stand down the OBPS in Ontario as of a future date.
• Yukon and Nunavut: In these territories, some exemp-tions apply to fuels for aviation and electricity for remote communities, reflecting their unique circumstance.
Some of the provincial legal challenges to the federal carbon pricing backstop (Alberta, Ontario, and Saskatchewan) were heard by the Supreme Court of Canada in September 2020. The court is expected to issue a decision regarding the consti-tutionality of the federal carbon pricing backstop in 2021.
Background Information
GHG REDUCTION TARGETS
BY 2030: 30% below 2005 levels (NDC)BY 2050: Proposed net-zero target by 2050 (Canadian Net-Zero Accountability Act presented by the Canadian government in the Canadian Parliament in late 20202)
2 – https://www.parl.ca/LegisInfo/BillDetails.aspx?Mode=1&billId=10959361&Language=E
OVERALL GHG EMISSIONS (excluding LULUCF) 729.0 MtCO2e (2018) Oil and Gas 193.0 (26%)Electricity 64.0 (9%)heavy industry 79.0 (11%)Transportation 186.0 (26%)Buildings 92.0 (13%)agriculture 73.0 (10%)Waste and Others 42.0 (6%)
OVERALL GHG EMISSIONS BY SECTOR (MtCO2e)
← CONTENT

FACT
SHEE
TS –
03
Cana
daSt
atus
Rep
ort 2
021
ICAP
71
3 – http://publications.gc.ca/collections/collection_2017/eccc/En4-294-2016-eng.pdf4 – https://laws-lois.justice.gc.ca/PDF/SOR-2019-266.pdf5 – https://laws-lois.justice.gc.ca/PDF/G-11.55.pdf
Other Information
INSTITUTIONS INVOLVED Environment and Climate Change Canada Finance Canada Canadian provinces and territories
IMPLEMENTING LEGISLATIONPan-Canadian Framework on Clean Growth and Climate Change3
Output-Based Pricing System Regulations4 Greenhouse Gas Pollution Pricing Act5
← CONTENT

FACT
SHEE
TS –
03
MaS
SaCh
USET
TSSt
atus
Rep
ort 2
021
ICAP
721 – Prices from the December 2020 auction are not included, as allowances from the auction will be used to satisfy 2021 and 2022 compliance obligations.
MASSACHUSETTSMassachusetts Limits on Emissions from Electricity Generators
CAP8.3 MtCO2 (2021)
GASES CO2 only
ALLOCATIONFree allocation: Grandparentingauctioning
AVERAGE 2020 PRICE1
USd 7.00TOTAL REVENUE USd 27.17 since beginning of program, USd 15.78 collected in 2020
POWER
SECTORS:
In force
Under development
Under consideration
Exists in parallel to, but does not directly interact with, RGGI
Two years of full compliance from all regulated entities
Program review to be conducted in 2021
ETS DESCRIPTIONThe Massachusetts Limits on Emissions from Electricity Generators began operating in 2018 and covers CO2 emis-sions from the power sector. It complements RGGI to help ensure that Massachusetts achieves its mandatory mitiga-tion targets.
In 2016, a ruling by the Massachusetts Supreme Court estab-lished that the Massachusetts government would need to take additional action to guarantee it meets the state’s climate targets–a 45% reduction by 2030 and an 80% reduc-tion by 2050 (compared to 1990). The regulation establishing this system, ‘310 CMR 7.74,’ is one of the responses to this ruling. The regulation is intended to ensure that emission reductions associated with other clean energy programs occur in Massachusetts. In 2020, the Massachusetts Executive Office of Energy and Environmental Affairs signed a determi-nation of statewide emissions limits for 2050, establishing a 2050 statewide net-zero GHG emissions limit.
The ‘Massachusetts Limits on Emissions from Electricity Generators’ system exists in parallel to, but does not directly interact with, RGGI. The electricity generators in Massachu-setts have to comply with both RGGI and the Massachusetts program. A 2016 court decision required Massachusetts to establish a statewide cap-and-trade program to control emis-sions located specifically in Massachusetts. Massachusetts electricity generators must hold and surrender allowances for both programs.
YEAR IN REVIEW2020 saw a reduction of the share of allowances distributed through free allocation from 75% to 50%. The remainder, after an adjustment to account for banked allowances, were distributed via auctions. The system will increase to full auctioning by 2021.
During the course of 2021, Massachusetts will finalize a new climate program establishing climate targets for 2030. The Massachusetts ETS will be revised to align with these targets.
Background Information
GHG REDUCTION TARGETSBY 2050: Net-zero GHG emissions. Positive emissions will be compensated with removals, and positive emissions in 2050 are not to be greater than 85% below the 1990 level (Letter of Determination of Statewide Emissions Limit for 2050)
OVERALL GHG EMISSIONS (excluding LULUCF) 72.9 MtCO2e (2017) Oil and Gas 0.8 (1%)Electricity 13.6 (19%)industrial processes 3.8 (5%)Transportation 30.5 (42%)Buildings 23.3 (32%)agriculture 0.2 (0%)Waste 0.7 (1%)
OVERALL GHG EMISSIONS BY SECTOR (MtCO2e)
← CONTENT

FACT
SHEE
TS –
03
MaS
SaCh
USET
TSSt
atus
Rep
ort 2
021
ICAP
73
ETS Size
COVERED EMISSIONS5.7 MtCO2e(Verified emissions 2019)
GHGs COVEREDCO2 only
SECTORS AND THRESHOLDSLarge electricity generators subject to RGGI (≥25 MWe)
POINT OF REGULATIONDownstream
NUMBER OF ENTITIES23 (2020)
CAPThe cap declines annually by 223,876 tCO2e until it reaches a cap of 1.8 MtCO2e by 2050.
ANNUAL CAPS:2019: 8.7 MtCO2e 2020: 8.5 MtCO2e2021: 8.3 MtCO2e
Phases & Allocation
TRADING PERIODSThe system has an annual compliance deadline of 1 March for the prior year’s emissions.
ALLOCATIONAUCTIONING: From 2019 onwards, allowances were partially auctioned, with 25% auctioned in 2019, 50% in 2020, and 100% from 2021 onwards. At least one auction is held each year. The first auction took place in December 2018, the
second one in December 2019, the third one in September 2020, and the fourth auction in December 2020. Auction results are included in market monitoring reports posted on the program web page.
FREE ALLOCATION: Before 2021, non-auctioned allowances were freely allocated through grandparenting based on historical (2013–2015) generation.
Flexibility
BANKING AND BORROWING Banking is allowed, but restrictions apply to guarantee that emissions in any year cannot exceed the emission limit of the prior year. This is done by adjusting the number of auctioned allowances downward to compensate for banked allowances.
Borrowing is not allowed, but the possibility of emergency deferred compliance exists.
MARKET STABILITY PROVISIONS AUCTION RESERVE PRICE: The auctions have a reserve price of USD 0.50 per allowance.
Compliance
COMPLIANCE PERIOD One year
MRV REPORTING FREQUENCY: Regulated entities are required to submit emission reports (by 1 February) and compliance certification reports (by 1 March) indicating emissions and the holding of sufficient allowances, respectively.
VERIFICATION: Emissions must match reports to RGGI and the US Environmental Protection Agency. Documents (i.e., emissions reports and compliance certification reports) must be certified by a designated representative identified by the facility, and the Massachusetts Department of Environmental Protection (MassDEP) may choose to conduct audits.
~11%
← CONTENT

FACT
SHEE
TS –
03
MaS
SaCh
USET
TSSt
atus
Rep
ort 2
021
ICAP
74
ENFORCEMENTIf the MassDEP establishes that an entity is in violation of compliance, this will be presumed to constitute “a significant impact to public health, welfare, safety or the environment.” In addition to penalties, the regulated entity must submit three allowances for each metric tonne of noncompliance.
Other Information
INSTITUTIONS INVOLVEDThe Executive Office of Energy and Environmental AffairsMassachusetts Department of Environmental Protection
EVALUATION/ETS REVIEWThe first program review will be in 2021, with a review every ten years thereafter.
USE OF REVENUESAuction proceeds are paid to a segregated account and are used to further reduce GHG emissions (e.g., clean energy and vehicle electrification projects) as well as for adaption programs and for projects targeting communities adversely impacted by air pollution.
IMPLEMENTING LEGISLATION/REGULATIONElectricity Generator Emissions Limits (310 CMR 7.74)2
2 – https://www.mass.gov/guides/electricity-generator-emissions-limits-310-cmr-774
← CONTENT

FACT
SHEE
TS –
03
nEW
MEX
iCO
Stat
us R
epor
t 202
1IC
AP
75
New Mexico established an interagency Climate Change Task Force in January 2019 to evaluate strategies and policies to reduce GHG emissions in the state. Potential strategies include adopting a market-based program that would set emissions limits to reduce CO2 and other GHG pollutants in New Mexico. Over the course of 2020, state agencies continued to evaluate options for a future market-based program that would result in the most cost-effective approach, including through cooperating with other states that already operate cap-and-trade programs.
The second annual report of the Climate Change Task Force, released in October 2020, found that although the state made progress on curbing emissions, additional action is
needed to reach New Mexico’s GHG reduction targets. Future recommended objectives include adopting rules for low- and zero-emission technologies, cutting HFC emissions, and further reducing GHGs and other pollution from the oil and gas industry. The report emphasizes the importance of embedding existing emissions targets into legislative statute, rather than establishing them only through execu-tive orders. The report also highlights that the New Mexico Environment Department and the New Mexico Department of Energy, Minerals, and Natural Resources continue to eval-uate options for a comprehensive market-based program. Both departments will make coordinating with other states already implementing such programs a priority area for stakeholder engagement in 2021.
Background Information
GHG REDUCTION TARGETS BY 2030: At least 45% reduction from 2005 GHG levels (Executive Order 2019-003)
Other Information
INSTITUTIONS INVOLVED New Mexico Climate Change Task ForceNew Mexico Energy, Minerals, and Natural Resources DepartmentNew Mexico Environment Department
NEW MEXICO
New Mexico state agencies are evaluating options for a market-based program
Interagency Climate Change Task Force released second annual report in late 2020
In force
Under development
Under consideration
Oil & Gas 16.0 (24%)Electricity Generation 12.0 (18%)Transportation 14.7 (22%)residential/Commercial 4.0 (6%)agriculture 7.3 (11%)Other industry 12.0 (18%)
OVERALL GHG EMISSIONS (excluding LULUCF) 66.7 MtCO2e (2018)
OVERALL GHG EMISSIONS BY SECTOR (MtCO2e)
← CONTENT
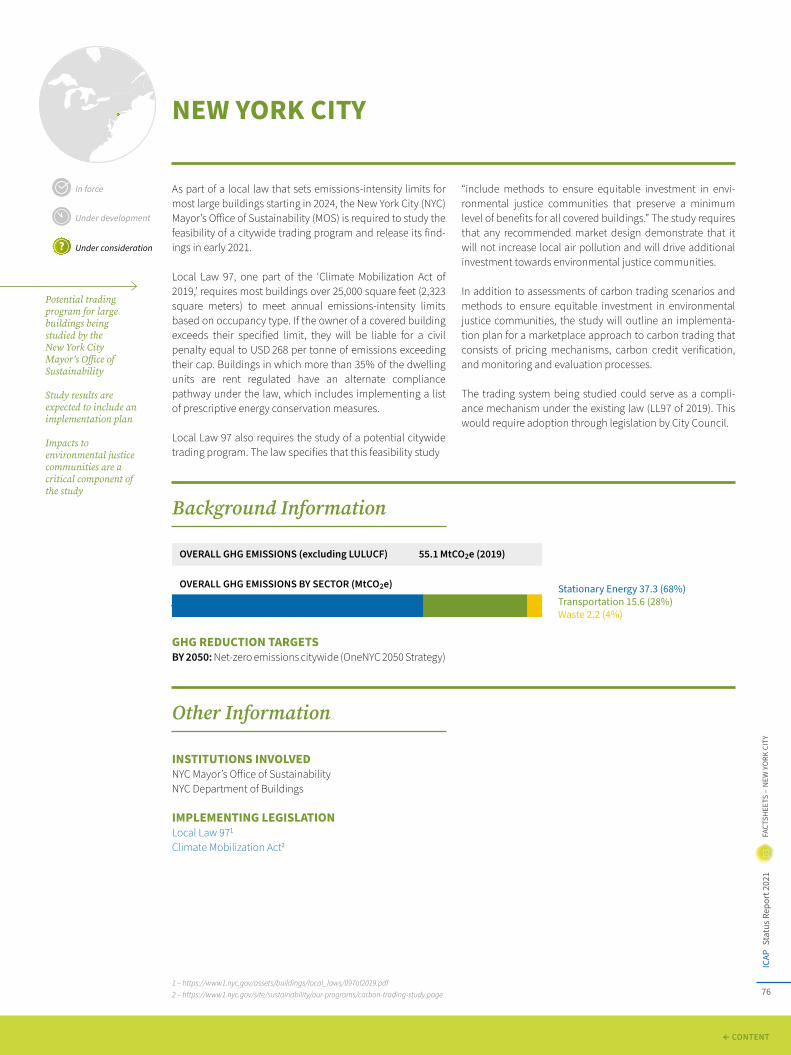
FACT
SHEE
TS –
03
nEW
YO
rK C
iTY
Stat
us R
epor
t 202
1IC
AP
76
NEW YORK CITY
In force
Under development
Under consideration
Potential trading program for large buildings being studied by the New York City Mayor’s Office of Sustainability
Study results are expected to include an implementation plan
Impacts to environmental justice communities are a critical component of the study
As part of a local law that sets emissions-intensity limits for most large buildings starting in 2024, the New York City (NYC) Mayor’s Office of Sustainability (MOS) is required to study the feasibility of a citywide trading program and release its find-ings in early 2021.
Local Law 97, one part of the ‘Climate Mobilization Act of 2019,’ requires most buildings over 25,000 square feet (2,323 square meters) to meet annual emissions-intensity limits based on occupancy type. If the owner of a covered building exceeds their specified limit, they will be liable for a civil penalty equal to USD 268 per tonne of emissions exceeding their cap. Buildings in which more than 35% of the dwelling units are rent regulated have an alternate compliance pathway under the law, which includes implementing a list of prescriptive energy conservation measures.
Local Law 97 also requires the study of a potential citywide trading program. The law specifies that this feasibility study
“include methods to ensure equitable investment in envi-ronmental justice communities that preserve a minimum level of benefits for all covered buildings.” The study requires that any recommended market design demonstrate that it will not increase local air pollution and will drive additional investment towards environmental justice communities.
In addition to assessments of carbon trading scenarios and methods to ensure equitable investment in environmental justice communities, the study will outline an implementa-tion plan for a marketplace approach to carbon trading that consists of pricing mechanisms, carbon credit verification, and monitoring and evaluation processes.
The trading system being studied could serve as a compli-ance mechanism under the existing law (LL97 of 2019). This would require adoption through legislation by City Council.
Background Information
GHG REDUCTION TARGETSBY 2050: Net-zero emissions citywide (OneNYC 2050 Strategy)
Other Information
INSTITUTIONS INVOLVED NYC Mayor’s Office of Sustainability NYC Department of Buildings
IMPLEMENTING LEGISLATIONLocal Law 971
Climate Mobilization Act2
OVERALL GHG EMISSIONS (excluding LULUCF) 55.1 MtCO2e (2019)
Stationary Energy 37.3 (68%)Transportation 15.6 (28%)Waste 2.2 (4%)
OVERALL GHG EMISSIONS BY SECTOR (MtCO2e)
1 – https://www1.nyc.gov/assets/buildings/local_laws/ll97of2019.pdf2 – https://www1.nyc.gov/site/sustainability/our-programs/carbon-trading-study.page
← CONTENT

FACT
SHEE
TS –
03
nOrT
h Ca
rOLi
naSt
atus
Rep
ort 2
021
ICAP
771 – https://files.nc.gov/governor/documents/files/EO80- NC%27s Commitment to Address Climate Change %26 Transition to a Clean Energy Economy.pdf 2 – https://deq.nc.gov/energy-climate/climate-change/nc-climate-change-interagency-council/climate-change-clean-energy-16
In force
Under development
Under consideration
Executive order to develop policy options for reducing emissions in the power sector
Evaluation report on a potential market-based carbon reduction program expected by early 2021
NORTH CAROLINA
In October 2018, North Carolina’s Governor Roy Cooper issued an executive order (EO No. 80) demanding stronger commitment within the state to address climate change and towards a transition to a clean energy economy. The underlying goal is to reduce statewide GHG emissions to 40% below 2005 levels. As directed by the EO, in September 2019, North Carolina’s Department of Environmental Quality (DEQ) released the “Clean Energy Plan” (CEP) to outline policy and action recommendations to reach the announced GHG reduction target. A core component of the CEP is to reduce electric power sector GHG emissions by 70% below 2005 levels by 2030 and attain carbon neutrality by 2050. The list of policy options to reach the GHG reduction targets has not yet been finalized.
To assess the most cost-effective options to achieve CO2 emissions reductions in the power sector, the DEQ has commissioned an academic report that will evaluate policy designs for a market-based carbon reduction program, a coal phase-out, clean energy policies, and hybrid approaches. The report is scheduled to be delivered in early 2021.
According to the CEP, key policy design elements for a market-based carbon reduction program that should be analyzed in the report include levels of emission limits, the scope of covered sources, the distribution of emission allowances, investment of revenue generated from the program, linking the program with similar programs in other states, technical platforms for administering the program, and mechanisms for protecting ratepayers.
Background Information
GHG REDUCTION TARGETS BY 2025: 40% reduction compared to 2005 levels (Executive Order No. 80)
Other Information
INSTITUTIONS INVOLVEDNorth Carolina Department of Environmental Quality
IMPLEMENTING LEGISLATION/REGULATIONExecutive Order No. 801
Clean Energy Plan2
OVERALL GHG EMISSIONS (excluding LULUCF) 150.1 MtCO2e (2017)
OVERALL GHG EMISSIONS BY SECTOR (MtCO2e)
Electricity (direct combustion and imported) 52.6 (35%)industrial processes 18.5 (12%)Transportation 48.7 (32%)Commercial 5.7 (4%)residential 5.3 (4%)agriculture 10.5 (7%)Waste 8.8 (6%)
← CONTENT

FACT
SHEE
TS –
03
nOva
SCO
Tia
Stat
us R
epor
t 202
1IC
AP
78
NOVA SCOTIANova Scotia Cap-and-Trade Program
SECTORS:
In force
Under development
Under consideration
Auctioning started in 2020 with two auctions
In compliance with the Pan-Canadian carbon pricing framework
Has a 2050 net-zero GHG target
POWER
INDUSTRY
TRANSPORT*
BUILDINGS*
* Sectors represent upstream coverage
CAP12.3 MtCO2e (2021)
GASES Several gases
ALLOCATIONFree allocation: BenchmarkingFree allocation: Grandparentingauctioning
AVERAGE 2020 PRICECad 24.35 (USd 18.16) / tCO22
TOTAL REVENUE Cad 28.7 million (USd 21.4 million) since beginning of program in 2020
ETS DESCRIPTIONNova Scotia’s cap-and-trade program sets a cap on the total amount of GHG emissions allowed in covered sectors in the province for the years 2019–2022 (compliance period). Final cap-and-trade program regulations were passed in November 2018. The program regulates the industry, power, heat (buildings), and transportation sectors and covers more than 80% of GHG emissions in Nova Scotia.
The Nova Scotia program was found to meet the federally set benchmark introduced in the ‘Pan-Canadian Framework on Clean Growth and Climate Change’ (see Canada factsheet). This means that the province is not subject to the federal carbon pricing “backstop” measure.
Since May 2018, Nova Scotia has been a member of the Western Climate Initiative, which provides technical services and support for Nova Scotia’s cap-and-trade program.
Nova Scotia is not linked to any jurisdictions.
In October 2019, Nova Scotia introduced the ‘Sustainable Development Goals Act,’ which sets new targets to fight climate change, including a target of reaching 53% below 2005 levels by 2030, as well as net-zero emissions by 2050. The cap-and-trade program, along with other policies and programs, will help Nova Scotia achieve its 2030 and 2050 GHG targets.
YEAR IN REVIEWIn June 2020, the Nova Scotia cap-and-trade program held its first auction, selling all allowances on offer. The minimum price for auctions held in 2020 was set at CAD 20 (USD 14.91), and in each subsequent year the minimum price will increase by 5% plus inflation. Regulated entities have the option to consign allowances to auction. In addition, purchase limits apply in order to secure market functioning.
The most recent auction was held in December 2020, when 542,000 allowances were on offer, 15.3% less than in the program’s first sale in June. The auction settled at CAD 24.70 (USD 18.42).
Background Information
GHG REDUCTION TARGETSBY 2030: 53% below 2005 levels (Sustainable Development Goals Act)BY 2050: Net-zero emissions (Sustainable Development Goals Act)
Electricity and heat Generation 6.9 (41%)industrial processes1 1.3 (8%)Transportation 5.8 (34%)heat (commercial) 0.6 (4%)heat (residential) 1.4 (8%)agriculture and Waste 0.9 (5%)
OVERALL GHG EMISSIONS (excluding LULUCF) 16.9 MtCO2e (2018)
OVERALL GHG EMISSIONS BY SECTOR (MtCO2e)
1 – Includes the oil and gas sector
← CONTENT

FACT
SHEE
TS –
03
nOva
SCO
Tia
Stat
us R
epor
t 202
1IC
AP
79
ETS Size
COVERED EMISSIONS13.8 MtCO2e(Verified emissions 2018)
GHGS COVERED CO2, CH4, N2O, SF6, NF3, HFCs, PFCs
SECTORS AND THRESHOLDSThe program covers the industrial and electricity sectors, as well as fuel suppliers (upstream coverage of transportation and heating).
INCLUSION THRESHOLDS: For the industrial and electricity sectors, facilities generating ≥50,000 tCO2e/year. Electricity importers responsible for >10,000 tCO2e/year are also included. For fuel suppliers, the following thresholds apply: petroleum product suppliers selling ≥200 liters of fuel into the
Nova Scotia market and natural gas distributors producing ≥10,000 tCO2e/year.
There are no provisions for voluntary (“opt-in”) participation.
POINT OF REGULATIONMixed
NUMBER OF ENTITIES27 entities (December 2020)
CAPFIRST COMPLIANCE PERIOD (2019–2022): 2019: 13.7 MtCO2e2020: 12.7 MtCO2e 2021: 12.3 MtCO2e2022: 12.1 MtCO2e
Phases &Allocation
TRADING PERIODSNova Scotia’s cap-and-trade program is structured around four-year compliance periods; trading periods are not defined separately. The first compliance period is 2019–2022.
ALLOCATIONFREE ALLOCATION: Each year within the compliance period, free allowances are transferred to the program participants’ accounts. The amount of free allowances for the partici-pating entities is calculated as follows:
Industrial Facilities (output-based allocation): Facilities receive allowances based on production intensity bench-marks. 75% of eligible emissions allowances are distributed to participating entities on 14 January of each year. The remaining eligible 25% are provided in the following year with production-level adjustments after the submission of a verified emissions report.
The benchmark is based on historical facility emissions intensity, an assistance factor that varies between 1 (100%) for cement and 0.9 (90%) for pulp and paper as well as natural gas processing (these are the only three GHG activ-ities, or components of a GHG activity explicitly specified in the regulatory framework).
A cap adjustment factor is also applied, declining from 1 in 2019 to about 0.88 in 2022. This means that an entity would receive about 12% fewer allowances based on the output in 2022 compared to in 2019.
Fuel Suppliers and Electricity Importers (grandparenting): Facilities receive 80% of free allocation based on verified GHG reports for the previous year’s emissions on 14 April of each year.
Nova Scotia Power Inc. (free allocation based on a reduc-tion of BAU projections): Allowances for the utility are allo-cated equivalent to the amount of approximately 90% of the business-as-usual projections for GHG emissions from the electricity sector for the compliance period. The BAU projec-tions are established by the regulator. ~5.5 million allowances were freely allocated in 2020, and in 2021, ~5.1 million allow-ances will be allocated, declining to just over five million in 2022. Allowances are allocated on 14 January of each year.
AUCTIONING: The province holds two to four auctions per calendar year. Two auctions were held in 2020: the first in June and the second in December. Minimum price: CAD 20 (USD 14.91) for auctions held in 2020; the minimum price increases by 5% plus inflation in each subsequent year.
Purchasing Limits at Auctions (for the 2019–2022 compli-ance period): In order to minimize the risk of one participant manipulating the market by causing shortages and price spikes, purchasing limits restrict how many emission allow-ances each participant can buy at any one auction. The limits for the three types of participants are as follows: • Industrial facilities: 3% of their previous year’s verified GHG
emissions per auction and 5% for the calendar year.• Fuel suppliers: 15% of the previous year’s verified GHG
emissions per auction and 25% for the calendar year.• Nova Scotia Power Inc.: 5% of the allowances available for
sale at each auction.
82%
← CONTENT

FACT
SHEE
TS –
03
nOva
SCO
Tia
Stat
us R
epor
t 202
1IC
AP
80
Auctioning in Nova Scotia has two particularities: (1) Option for regulated entities to consign allowances to
auction: To minimize transaction costs for participants, regulated entities can consign their allowances to the government auctions. Allowances offered for sale through consignment are included in the government auctions and sold first, followed by allowances offered for sale by the province. 100% of the revenue from allowances sold on consignment is returned to the participants.
(2) Purchase limits to secure market functioning: To secure market functioning, bidders are subject to purchasing limits that restrict how many allowances each partic-ipant can buy at any one auction. Purchasing limits are intended to mitigate the risk that one participant can manipulate the market by causing shortages and price spikes.
Flexibility
BANKING AND BORROWING Nova Scotia’s cap-and-trade program does not allow for banking or borrowing across compliance periods.
OFFSETS AND CREDITSNova Scotia’s cap-and-trade legislation includes the possi-bility for an offset system. Further consultations will be undertaken, and a study was completed in 2020 to explore offset potential in the province’s carbon market.
MARKET STABILITY PROVISIONS RESERVE: In the first year of each compliance period, the government places 3% of allowances available under the cap of each year into a reserve. These allowances may be used for:(1) Cost containment: Offering them for sale at set prices to
participants at predetermined times throughout the year to cover their compliance obligations. Up to four reserve
sales can occur in one calendar year. The initial price was set at CAD 50 (USD 37.28) in 2020, and this will rise annu-ally by 5% plus inflation.
(2) New entrants: Accommodating new participants in the cap-and-trade program whose GHG emissions are not currently accounted for and that qualify for free alloca-tion.
(3) Reserve for adjustments in output-based free alloca-tion: Allowances from the reserve can be used as a buffer for uncertainty in output-based allocation for industrial facilities. If initial projections by the regulator on the yearly allocation levels fall short of necessary allocation based on real production levels, then output-based allo-cation according to allocation rules can be fulfilled by using allowances from the reserve.
Compliance
COMPLIANCE PERIODFour years (2019–2022) to provide year-to-year flexibility (see “Phases and Allocation” section).
By December 2023, entities must true up and surrender one allowance for each tonne of GHG emissions that they emitted over the course of the compliance period.
MRV In Nova Scotia, MRV is referred to as “Quantification, Reporting, and Verification.”
REPORTING FREQUENCY: Annually. Reporting and verifica-tion must be submitted by 1 May each year for the previous calendar year.
VERIFICATION: Reports must be verified by an accredited third-party organization.
FRAMEWORK: The rules for reporting GHG emissions are outlined in Nova Scotia’s ‘Quantification, Reporting, and Verification of Greenhouse Gas Emissions Regulations’ and ‘Standards for Quantification, Reporting, and Verification of Greenhouse Gas Emissions.’
ENFORCEMENTParticipants that do not surrender sufficient allowances at the end of the compliance period will be subject to enforce-ment under the ‘Environment Act.’
All revenue from fines issued for not surrendering sufficient allowances will go into the Nova Scotia Green Fund.
← CONTENT

FACT
SHEE
TS –
03
nOva
SCO
Tia
Stat
us R
epor
t 202
1IC
AP
81
Linking
LINKS WITH OTHER SYSTEMSNova Scotia does not plan to link at this time.
Other Information
INSTITUTIONS INVOLVEDNova Scotia Environment, Climate Change Unit
EVALUATION/ETS REVIEWAnnual reports on the program are published by the regu-lator. Nova Scotia must also report annually to Environment and Climate Change Canada as a part of the ‘Pan-Canadian Framework on Clean Growth and Climate Change.’
USE OF REVENUESA Green Fund was established in 2019 to receive and distribute revenues from allowance auctions, sales of reserve emission allowances, and administrative penalties. The Green Fund must be used to support measures that mitigate GHG emissions, promote adaptation, encourage innovative technology, and reduce negative economic and social effects of mitigation action.
Revenue for 2020: CAD 28.7 million (USD 21.4 million).
IMPLEMENTING LEGISLATION/REGULATIONNova Scotia’s Cap and Trade Program Regulatory Frame-work2 Cap-and-Trade Program Regulations, Section 112Q of the Environment Act3
Quantification, Reporting, and Verification of Greenhouse Gas Emissions Regulations4
Standards for Quantification, Reporting, and Verification of Greenhouse Gas Emissions5
Sustainable Development Goals Act6
Environment Act7
2 – https://climatechange.novascotia.ca/sites/default/files/Nova-Scotia-Cap-and-Trade-Regulatory-Framework.pdf3 – https://www.novascotia.ca/just/regulations/regs/envcapandtrade.htm4 – https://www.novascotia.ca/just/regulations/regs/envqrv.htm5 – https://climatechange.novascotia.ca/sites/default/files/uploads/QRV_Standards.pdf6 – https://nslegislature.ca/sites/default/files/legc/PDFs/annual%20statutes/2019%20Fall/c026.pdf7 – https://nslegislature.ca/sites/default/files/legc/PDFs/annual%20statutes/2017%20Fall/c010.pdf
← CONTENT

FACT
SHEE
TS –
03
OrE
GOn
Stat
us R
epor
t 202
1IC
AP
82
OREGON
In force
Under development
Under consideration
Issued an executive order establishing a sector-specific ‘cap and reduce program’
Program options and design elements have been studied and workshopped during 2020
Oregon has pursued a statewide cap-and-trade program through its legislature since 2019 and issued an executive order on cap-based emission reductions in 2020.
The most recent legislative attempt, Senate Bill 1530 (SB1530), was filed during the 2020 legislative session, and built on 2019 draft legislation (House Bill 2020 [HB2020]), but with some notable changes for the industry and trans-port sectors.
Both SB1530 and HB2020 failed to pass during regular legis-lative sessions, which prompted the state’s governor to issue an executive order mandating an emissions cap and reduc-tions for large emitters and transportation fuels, in line with the state’s proposed reduction targets for 2035 and 2050. Executive Order 20-04 directs the state Environmental Quality Commission (EQC) and the Department of Environmental Quality (DEQ) to establish a sector-specific ‘cap and reduce
program’ for large stationary sources of emissions, transpor-tation fuels, and other fossil fuels, including natural gas. The executive order provides little detail on the potential design of the program. It would require a cap as well as emissions reductions for the covered sources that are consistent with the targets set out in previous legislation (45% below 1990 levels by 2035 and 80% by 2050). The executive order makes no refer-ence to trading and does not distinguish whether the program would resemble a baseline-and-credit system, or an ETS.
The DEQ submitted a preliminary report in May 2020 and a final report in June 2020, both of which focused on program options to cap and reduce emissions. The DEQ hosted a series of online technical workshops during August and September of 2020 to discuss specific program design elements, options, and implications to inform program scoping prior to the formal rulemaking process, which will occur over the course of 2021. The intended start date of the program is in 2022.
Background Information
GHG REDUCTION TARGETSBY 2035: 45% reduction from 1990 GHG levels (Executive Order 20-04 covering Oregon state agencies)BY 2050: At least 80% reduction from 1990 GHG levels (Exec-utive Order 20-04 covering Oregon state agencies)
Other Information
INSTITUTIONS INVOLVEDOregon Environmental Quality CommissionOregon Department of Environmental Quality
IMPLEMENTING LEGISLATION/REGULATIONOregon Greenhouse Gas Initiative (SB1530)1
House Bill 2020 (HB2020)2 Executive Order 20-043
Transportation 24.0 (38%)industrial processes 12.0 (19%)residential / Commercial 21.0 (33%)agriculture 7.0 (11%)
OVERALL GHG EMISSIONS (excluding LULUCF) 64.0 MtCO2e (2018)
OVERALL GHG EMISSIONS BY SECTOR (MtCO2e)
1 – https://olis.oregonlegislature.gov/liz/2020R1/Measures/Overview/SB15302 – https://olis.leg.state.or.us/liz/2019R1/Measures/Overview/HB20203 – https://www.oregon.gov/gov/Documents/executive_orders/eo_20-04.pdf
← CONTENT

FACT
SHEE
TS –
03
pEnn
SYLv
ania
Stat
us R
epor
t 202
1IC
AP
83
In October 2019, Pennsylvania’s Governor Tom Wolf signed an executive order directing the Pennsylvania Department of Environmental Protection (DEP) to develop and present to the Environmental Quality Board (EQB) a proposal for an ETS covering CO2 emissions from the electric power sector and its linkage to the Regional Greenhouse Gas Initiative (RGGI).
According to the executive order, the legal basis for devel-oping an ETS is the state’s ‘Air Pollution Control Act,’ which regulates air resources necessary for the protection of public health. In January 2020, the DEP released a first draft proposal for a power sector ETS covering CO2 emissions. An update to the proposal in April 2020 proposed an emissions cap of 78 MtCO2 for 2022 that would decrease annually by 3% to 58.1 MtCO2 in 2030. In September 2020, the DEP released and presented to the EQB a draft ETS regulation based on the draft proposal. As Pennsylvania aims to join RGGI, for which one precondition is to align ETS program design accordingly, the DEP-proposed regulation is largely consistent with the system design features of the RGGI Model Rule. This includes the implementation of an emissions containment reserve and a cost containment reserve, as well as quarterly auctions to allocate allowances. It includes additional features such as a waste-coal set-aside account, a set-aside provision for cogen-
eration units (including combined heat and power systems), and a limited exemption for cogeneration units that supply less than 15% of their total energy to the electricity grid.
The draft regulation went through public consultation between November 2020 and January 2021 and will undergo the state’s regulatory review process, before a final proposal is presented during the course of 2021. The earliest start date for Pennsylvania’s ETS and for it to join RGGI would be 2022.
Joining RGGI would require negotiations between Penn-sylvania and the current RGGI member states to adjust the program’s emissions cap. With Pennsylvania joining RGGI, the initiative’s carbon market would increase significantly, as Pennsylvania’s share of emissions in the 2022 RGGI cap would amount to 40.2%.
Other major emission reduction efforts currently under development in Pennsylvania include:• a memorandum of understanding (MOU) between Penn-
sylvania and six other states to develop an action plan for the buildout of regional CO2 transport infrastructure to enable large-scale carbon management; and
• a rulemaking which would establish a requirement for automobile manufacturers to offer zero emissions vehicles (ZEVs) as a percentage of their fleet.
Background Information
GHG REDUCTION TARGETSBY 2025: 26% below 2005 levels (Executive Order 2019-1)BY 2050: 80% below 2005 levels (Executive Order 2019-1)
Other Information
INSTITUTIONS INVOLVED Pennsylvania Department of Environmental Protection (DEP)
IMPLEMENTING LEGLISLATION/REGULATION Executive Order 2019-071
Draft CO2 Budget Trading Program2
1 – https://www.governor.pa.gov/newsroom/executive-order-2019-07-commonwealth-leadership-in-addressing-climate-change-through-electric-sector-emissions-reductions/2 – http://www.pacodeandbulletin.gov/Display/pabull?file=/secure/pabulletin/data/vol50/50-45/1541.html
PENNSYLVANIA
In force
Under development
Under consideration
Executive order for a power sector ETS and joining RGGI
Draft ETS regulation consistent with RGGI Model Rule released in October 2020
Plan to join RGGI by earliest 2022
Energy 75.2 (29%)industrial processes 81.4 (31%)Transportation 64.3 (24%)Commercial 10.9 (4%)residential 18.5 (7%)agriculture 8.2 (3%)Waste Management 4.3 (2%)
OVERALL GHG EMISSIONS (excluding LULUCF) 262.7 MtCO2e (2017)
OVERALL GHG EMISSIONS BY SECTOR (MtCO2e)
← CONTENT

FACT
SHEE
TS –
03
QUé
BEC
Stat
us R
epor
t 202
1IC
AP
84
ETS DESCRIPTIONQuébec’s Cap-and-Trade System for GHG emissions became operational in 2013. Québec has been a member of the Western Climate Initiative since 2008 and formally linked its system with California’s in January 2014 and with Ontario’s in January 2018 (until the termination of Ontario’s ETS in mid-2018). The system covers fossil fuel combustion and industrial emissions in power, buildings, transport, and industry.
YEAR IN REVIEWIn October 2020, the National Assembly of Québec passed Bill 44, which amends numerous pieces of environmental legislation and impacts the cap-and-trade program. The bill maintains all funding generated by the cap-and-trade program to climate change measures and strengthens the authority of the Ministry of Environment and the Fight against Climate Change over this revenue. It also allows the ministry to implement a major part of its post-2023 allocation plan: a portion of allowances that were previously given to indus-trial emitters free of charge would be sold at auction, with
the revenue reserved for those entities on the condition that they use it to finance mitigation. Regulations on this change and other facets of post-2023 allocation, including updated benchmarks (intensity targets), are expected to be finalized in 2021.
Also in October 2020, Québec accepted to chair the ‘Carbon Pricing in the Americas’ platform, alongside Chile. The plat-form brings governments from all parts of the Americas together to identify and foster opportunities to increase alignment of carbon pricing systems and promote carbon markets in the Americas to maximize climate action.
In November 2020, Québec published its latest climate change action plan (2030 Plan for a Green Economy), in which the government aims to achieve carbon neutrality by 2050.
In December 2020, Québec amended its price tiers for sales of allowances from its reserves to more closely align with those of California (see “Market Stability Provisions” for more).
Background Information
GHG REDUCTION TARGETSBY 2020: 20% reduction from 1990 GHG levels (Order in Council 1187–2009)BY 2030: 37.5% reduction from 1990 GHG levels (Decree 1018–2015)BY 2050: Carbon neutrality (2030 Plan for a Green Economy)
QUÉBECQuébec Cap-and-Trade System
CAP55.3 MtCO2e (2021)
GASES Several gases
OFFSETS AND CREDITSdomestic1
ALLOCATIONFree allocation: Benchmarking auctioning
AVERAGE 2020 PRICE2
Cad 22.76 /tCO2 (USd 16.97)TOTAL REVENUE Cad 4.54 billion (USd 3.39 billion) since beginning of program, Cad 689.9 million (USd 514.4 million collected in 2020)
SECTORS:
POWER
INDUSTRY
TRANSPORT* (excluding maritime and aviation)
BUILDINGS*
* Sectors represent upstream coverage
1 – Also includes offsets from linked jurisdictions (i.e., California).2 – Average 2020 auction settlement price
Covers ~80% of Québec’s overall emissions
Reforms to free allocation beginning 2021, with more expected after 2023
Chair of the Carbon Pricing in the Americas, alongside Chile
Linked with California since 2014
In force
Under development
Under consideration
power 0.3 (0%)industrial processes 24.2 (31%)Transportation 36.1 (46%)Buildings 8.2 (10%)agriculture 7.8 (10%)Waste 4.1 (5%)
OVERALL GHG EMISSIONS (excluding LULUCF) 80.6 MtCO2e (2018)
OVERALL GHG EMISSIONS BY SECTOR (MtCO2e)
← CONTENT

FACT
SHEE
TS –
03
QUé
BEC
Stat
us R
epor
t 202
1IC
AP
85
ETS Size
COVERED EMISSIONS60.3 MtCO2e(Verified emissions 2018)
GHGs COVEREDCO2, CH4, N2O, SF6, HFCs, PFCs, NO3, and other fluorinated GHGs
SECTORS AND THRESHOLDSFIRST COMPLIANCE PERIOD (2013–2014): electricity, industry
SECOND COMPLIANCE PERIOD (2015–2017) AND THIRD COMPLIANCE PERIOD (2018–2020): Sectors from first compliance period as well as distribution and importation of fuels used in the transport and building sectors and in small- and medium-sized businesses
INCLUSION THRESHOLDS: >25,000 tCO2e/year. As of 2016, fuel distributors that distributed 200L or more of fuel (in 2015) are also subject to inclusion, even if the combustion of their fuel resulted in emissions of less than 25,000 tCO2e.
VOLUNTARY EMITTERS (OPT-IN COVERED ENTITIES): Since 2019, emitters from capped sectors that have reported emis-sions between 10,000 tCO2e/year and 25,000 tCO2e/year may voluntarily register with the cap-and-trade system as a covered entity. If their production activity is eligible, they may receive free allocation.
POINT OF REGULATIONMixed
NUMBER OF ENTITIES150 facilities (104 industrial facilities and 46 fuel distributors)4 (2019)
CAPFIRST COMPLIANCE PERIOD (2013–2014): The system started in 2013 with a cap of 23.2 MtCO2e.
SECOND COMPLIANCE PERIOD (2015–2017): With the program expanding to include fuel distribution, the cap rose to 65.3 MtCO2e in 2015. The cap declined to 61 MtCO2e in 2017, an average of 3.2% per year.
THIRD COMPLIANCE PERIOD (2018–2020): The cap in the third compliance period started at 59 MtCO2e and declined at an average annual rate of 3.5% to 54.7 MtCO2e in 2020.
FOURTH COMPLIANCE PERIOD (2021–2023) AND BEYOND: After a slight nominal increase in the cap in 2021 due to an adjustment of the global warming potential of different GHGs, the cap will be reduced annually by about 2.2% on average until 2030. This will result in a cap of 44.14 million tCO2e in 2030.
Phases & Allocation
TRADING PERIODSThe Québec cap-and-trade system is structured around three-year compliance periods, except for the first period (see “Compliance” section). A cap trajectory until 2030 has been set (see “Cap” section). Allowances are allocated and auctioned with calendar vintage years.
ALLOCATIONAllowances—referred to as “emission units” in Québec’s cap-and-trade regulations—are distributed via auction and free allocation.
FREE ALLOCATION: Emission-intensive, trade-exposed (EITE) sectors receive a portion of free allowances because they are considered vulnerable to carbon leakage. Eligible sectors include aluminum, lime, cement, chemical and petrochem-icals, metallurgy, mining and pelletizing, pulp and paper, petroleum refining, and others (manufacturers of glass containers, gypsum products, and some agro-food prod-ucts). Electricity producers with a fixed-price sales contract signed before 2008 that does not allow price adjustments to take into account a carbon cost are also eligible to receive
free allowances. The amount of free allocation issued is generally determined by: recent levels of production or consumption of raw materials (depending on the reference unit for the sector); a declining intensity target based on historic averages, depending on the type of emissions (e.g., fixed process, combustion, and other, mainly fugitive emis-sions); and an assistance factor.
Until 2020, the assistance factors for all EITE sectors were set at 100%. For the 2021–2023 period, assistance factors for industrial activities have been determined based on trade exposure and emissions intensity. These metrics were used to group the industrial sector’s carbon leakage risk into three categories (low, medium, and high), with assistance factors of 90%, 95%, and 100% respectively. An assistance factor of 60% applies for off-site electricity and steam production for producers with fixed-price sales contracts signed before 2008 that were referenced above.
3 – Includes an adjustment to account for differences between verified ETS emissions and the GHG inventory methodology.4 – 115 registered entities, but some entities operate more than one facility. These entities represent 150 emitting facilities.
~78%3
← CONTENT

FACT
SHEE
TS –
03
QUé
BEC
Stat
us R
epor
t 202
1IC
AP
86
The rules on free allocation for entities that voluntarily opt into the cap-and-trade system are the same as those for regu-lated entities.
AUCTIONING: Electricity and fuel distributors must buy 100% of their allowances, with some narrow exceptions (e.g., on contracts prior to 2008 that have not been renewed or extended). Allowances are auctioned quarterly.
Allowances that remain unsold after an auction may be offered for sale again later when the price at two consecutive auctions settles above the minimum price.
In 2019, about 67% of allowances were allocated by auction or directed to reserves. About 33% of allowances were allo-cated for free.
Flexibility
BANKING AND BORROWINGBanking is allowed, but the emitter is subject to the general holding limit on allowances to which all entities in the system are held. The holding limit declines based on the year’s annual allowance budget.
While borrowing is not allowed, some allowances from future vintages are offered at each auction and may be traded but not used for compliance until the compliance date for the vintage year.
OFFSETS AND CREDITSQUANTITATIVE LIMIT: Up to 8% of each entitys compliance obligation.
QUALITATIVE LIMIT: Currently, Québec’s offset program has five offset protocols: • CH4 destruction from covered manure storage facilities;• CH4 destruction from landfill sites;• Destruction of ozone-depleting substances contained in
insulating foam or used as refrigerant gases removed from domestic appliances in Canada;
• CH4 destruction from drainage systems at active coal mines; and
• CH4 destruction from ventilation systems of active under-ground coal mines.
Québec has developed an offset protocol for afforestation and reforestation projects in private lands in the province, which is expected to be finalized and adopted in 2021. In addition, Québec is working to assess or develop other new protocols in order to increase offset supply, some of which may also be adopted in 2021, including biomethanation, fuel switching in the marine transport sector, conversion of refrigeration systems, and improvements in the application of agricultural fertilizers.
Québec offset credits are recognized as compliance instru-ments by jurisdictions linked with Québec, and similarly for offset credits issued by linked jurisdictions.
Québec offset credits are 100% guaranteed. This means that in cases where offset credits issued for a project are later
deemed illegitimate by the regulator, the offset promoter is required to replace them. If credit recovery is not possible, an equivalent number of credits will be retired from the minis-ter’s environmental integrity account. That account is funded by the automatic withholding of 3% of issued offset credits from all offset projects.
MARKET STABILITY PROVISIONS AUCTION RESERVE PRICE: The auction reserve price sets the minimum price at which allowances are available at auction and increases annually by 5% plus inflation. It is set at CAD 17.36 (USD 12.94) for Québec and USD 17.71 for California in 2021. For joint auctions with California in 2021, the highest value in USD between Québec’s or California’s auction reserve prices, based on the exchange rate of the Bank of Canada the day prior to the auction, will be the auction reserve price for that particular auction.
RESERVE ACCOUNT: Québec maintains an allowance reserve to adjust levels of free allocation and sell to entities that do not have enough allowances to cover their obligations (“sales by mutual agreement”). The reserve is filled with set portions of the annual cap (4% for 2021 and beyond).
Sales by mutual agreement are held a maximum of four times per year at three price categories that contain an equal share of allowances on offer. Only covered entities in Québec are eligible to purchase allowances from the reserve, and only if they do not have valid compliance instruments for the current period in their general account.
In December 2020, Québec amended the prices of its three tiers to more closely align with California. For 2021, the prices of the three tiers are CAD 41.40 (USD 30.87), CAD 53.20 (USD 39.67), and CAD 65 (USD 48.47). However, if California has set higher prices per allowance for a corre-sponding category, Québec allowances would be sold at the highest of the prices of both jurisdictions according to the daily average exchange rate of the Bank of Canada published on its website on the day preceding the sale. Unlike California, the highest tier will not act as a price ceiling for Québec. Reserve prices increase annually by 5% plus inflation.
← CONTENT

FACT
SHEE
TS –
03
QUé
BEC
Stat
us R
epor
t 202
1IC
AP
87
5 – http://legisquebec.gouv.qc.ca/en/ShowDoc/cr/Q-2,%20r.%2046.16 – http://www.environnement.gouv.qc.ca/changements/carbone/documentation-en.htm#regulations7 – http://legisquebec.gouv.qc.ca/en/ShowDoc/cs/Q-2/
Compliance
COMPLIANCE PERIODFIRST COMPLIANCE PERIOD: 2013–2014
SUBSEQUENT COMPLIANCE PERIODS: Three calendar years (2015–2017, 2018–2020, 2021–2023, and so forth)
Allowances must be surrendered by 1 November following the end of the compliance period.
MRVREPORTING FREQUENCY: Annually
VERIFICATION: All covered entities in the program require independent third-party verification of emissions reports.
FRAMEWORK: Regulation on the mandatory reporting of certain emissions of contaminants into the atmosphere is outlined in the ‘Environment Quality Act’.
ENFORCEMENTA covered entity that fails to cover its GHG emissions with enough allowances on 1 November following the end of a compliance period must remit each missing allowance and will have to remit three additional allowances for each allow-ance it failed to remit to the Minister of the Environment and the Fight against Climate Change.
The person with legal responsibility for that entity would also be committing an infraction, subject to financial penalties, for each compliance instrument not surrendered as part of the compliance obligation.
For noncompliance, entities can be fined CAD 3,000–500,000 (USD 2,237–372,814) and spend up to 18 months in jail in the case of a natural person, and CAD 10,000–3,000,000 (USD 7,456–2,236,882) in the case of a legal person.
Fines are doubled in the case of a second offence. In addi-tion, the Minister of the Environment and the Fight against Climate Change may suspend allowance allocation to any noncompliant emitter.
Linking
LINKS WITH OTHER SYSTEMSQuébec linked with California’s ETS in January 2014. The two extended their joint market by linking with Ontario in January 2018 until the termination of Ontario’s system in mid-2018.
Other Information
INSTITUTIONS INVOLVED Ministère de l’Environnement et de la Lutte contre les change-ments climatiques (Ministry of the Environment and the Fight against Climate Change), Carbon Market Division
EVALUATION/ETS REVIEWThe regulation is adjusted almost annually to implement changes and, when necessary, maintain harmonization with linked jurisdiction.
USE OF REVENUESSince the beginning of the program: CAD 4.54 billion (USD 3.39 billion).
Collected in 2020: CAD 689.9 million (USD 514.4 million).
All auction revenues go to the Electrification and Climate Change Fund (formerly the Québec Green Fund), which funds mitigation measures that include energy efficiency, electrification (Québec’s electricity is 99.7% renewable), and public transport. Bill 44, passed by the National Assembly of Québec in 2020, renamed the Green Fund the Electrifica-tion and Climate Change Fund, devotes it entirely to climate action, and brings it fully under the direction of the Ministry of the Environment and the Fight against Climate Change.
IMPLEMENTING LEGISLATIONRegulation respecting a cap-and-trade system for green-house gas emission allowances5
Amendments are listed and linked on the site of the Ministry of the Environment and the Fight Against Climate Change6
Environment Quality Act7
← CONTENT

FACT
SHEE
TS –
03
rEGi
Ona
L Gr
EEnh
OUS
E Ga
S in
iTia
TivE
Stat
us R
epor
t 202
1IC
AP
88
REGIONAL GREENHOUSE GAS INITIATIVE
In force
Under development
Under consideration
SECTORS:
POWER
CAP119.8 million short tons CO2/ 108.9 MtCO2 (2021)1
GASES CO2 only
OFFSETS AND CREDITSdomestic (within rGGi states only)
ALLOCATIONauctioning
AVERAGE 2020 PRICEUSd 7.06
TOTAL REVENUE USd 3.8 billion since beginning of pro-gram, USd 416.3 million collected in 2020
Connecticut, Delaware, Maine, Maryland, Massa-chusetts, New Hampshire, New Jersey, New York, Rhode Island, Vermont, Virginia
MEMBER STATES:
First mandatory GHG ETS in the US
Since 2012, two program reviews tightened cap
A third program review will commence in 2021
New Jersey began participation in RGGI again in 2020; Virginia began participation in 2021; Pennsylvania expected to begin participation in 2022
ETS DESCRIPTIONThe Regional Greenhouse Gas Initiative (RGGI) is the first mandatory GHG ETS in the United States and covers emis-sions from the power sector. The system started operating in 2009 with 10 states (Connecticut, Delaware, Maine, Mary-land, Massachusetts, New Hampshire, New Jersey, New York, Rhode Island, and Vermont). Its development was based on the ‘2005 RGGI Memorandum of Understanding’ (MOU) and on the ‘2006 RGGI Model Rule.’ Through statutes or regula-tions based on the Model Rule, each state then established individual CO2 budget trading programs. New Jersey began participation in RGGI again in 2020 and Virginia began partic-ipation in 2021. Currently, Pennsylvania is looking into RGGI participation in 2022.
RGGI has gone through two review processes to date, which resulted in updating of the Model Rule and enshrined tighter caps and adjustments to system design. Between 2021 and 2030, the RGGI cap will reduce by 30% compared to 2020. Furthermore, an emissions containment reserve (ECR) started operating in 2021. The ECR is an automatic adjust-ment mechanism that will adjust the cap downward in the face of lower-than-expected costs.
YEAR IN REVIEWUpon finalization of the ‘2017 Model Rule,’ the proposed post-2020 cap-and-trade regulations were adopted by each RGGI state according to its own regulatory processes over the course of 2019 and 2020.
Virginia began participation in RGGI as of January 2021 after final legislation for establishing an ETS and participating in RGGI was adopted in February 2020. The state had started regulatory processes to participate in RGGI in 2018 and adopted final regulations in April 2019. However, provisions added to the 2019 Budget Act by the Republican legislative majority prevented Virginia from joining RGGI in 2020. After legislative majorities shifted following the November 2019 elections, cap-and-trade legislation was introduced by the new Democratic majority in 2020.
Pennsylvania is also in the process of establishing a power sector ETS and possibly participating in the RGGI program. In January 2020, Pennsylvania released a first draft proposal followed by a final ETS proposal in September 2020. A final proposal could be presented later in 2021, while the earliest start date for Pennsylvania’s ETS and its linkage to RGGI would be 2022 (see Pennsylvania factsheet).
Background Information
GHG REDUCTION TARGETS BY 2030: By adopting the ‘2017 Model Rule,’ RGGI states have committed to implement a reduction of 30% of power sector emissions compared to the 2020 CO2 emissions cap (2017 Model Rule)
Note: The participating states have their own emission targets; economy-wide targets are not defined at the level of RGGI.
1 – The RGGI states will adjust the 2021 through 2025 caps based upon the quantity of privately held allowances (the bank) as of March 15, 2021.2 – GHG emissions reported here are based on energy-related emissions data only and retrieved from the International Energy Agency (IEA). Energy-related CO2 emissions refer to
emissions released at the location where fossil fuels are consumed.
Electric power 104.1 (18%)industrial processes 39.8 (7%)Transportation 275.9 (49%)Commercial 59.7 (11%)residential 84.7 (15%)
OVERALL GHG EMISSIONS (excluding LULUCF) 564.3 MtCO2e (2017)2
OVERALL GHG EMISSIONS BY SECTOR (MtCO2e)
← CONTENT

FACT
SHEE
TS –
03
rEGi
Ona
L Gr
EEnh
OUS
E Ga
S in
iTia
TivE
Stat
us R
epor
t 202
1IC
AP
89
ETS Size
COVERED EMISSIONS58.5 MtCO2e(Verified emissions 2017)
GHGs COVERED CO2 only
SECTORS AND THRESHOLDS Fossil Fuel Electric Generating Units
INCLUSION THRESHOLD: Capacity equal to or greater than 25 MW.
POINT OF REGULATIONDownstream (at installation level)
NUMBER OF ENTITIES203 sources (November 2020)
CAPThe RGGI cap was 188 million short tons CO2 per year in the 2009–2011 period. It was 165 million short tons CO2 per year for the 2012–2014 period (nine states participating), with
a 2.5% annual reduction factor from 2015 through 2018, totaling a 10% reduction between 2015 and 2018. However, by 2012, verified emissions under RGGI were more than 40% below the cap. The states thus tightened the cap to 91 million short tons in 2014. The revised regulations extended the 2.5% annual reduction factor through 2020. Also, the RGGI states had adjusted the caps between 2014 and 2020 to account for banked CO2 allowances accumulated in the first and second control periods.
The resulting 2020 cap was 74.3 million short tons/67.4 MtCO2 including the 18 million short tons/16.3 MtCO2 cap of 2020 RGGI entrant New Jersey.
The 2021 unadjusted cap is 119.8 million short tons/ 108.9 MtCO2 including the 27.2 million short tons/ 24.7 MtCO2 cap of new RGGI entrant Virginia. Following 2017 Model Rule amendments, a third adjustment of banked allowances will be made over a five-year period (2021–2025) based on the size of the bank as of 15 March 2021. The reduc-tion factor between 2021 and 2030 as set out in the ‘2017 Model Rule’ is about 3% of the 2020 cap (2.275 million short tons), resulting in a 2030 regional cap of 86.9 million short tons/70.0 MtCO2.
Phases & Allocation
TRADING PERIODSRGGI is structured around “control” (or compliance) periods. A cap trajectory until 2030 has been set (see “Cap” section). FIRST CONTROL PERIOD: 2009–2011SECOND CONTROL PERIOD: 2012–2014THIRD CONTROL PERIOD: 2015–2017FOURTH CONTROL PERIOD: 2018–2020FIFTH CONTROL PERIOD: 2021–2023
Since the third control period, RGGI operates with interim control periods (see “Compliance Period” section).
ALLOCATIONCO2 allowances issued by each RGGI state are distributed through quarterly regional CO2 allowance auctions. Auctions are open to all parties with financial security, with a maximum bid of 25% of auctioned allowances per quarterly auction.
Flexibility
BANKING AND BORROWINGBanking of allowances is allowed without restrictions, but regulations include adjustments to the cap to address the aggregate bank. This means that the amount of allowances available for auctions in future years is reduced by the amount of allowances not used for compliance in previous control periods (see also “Cap” section).
Borrowing is not allowed.
OFFSETS AND CREDITSQUANTITATIVE LIMIT: 3.3% of an entity’s liability may be covered with offsets. This share will remain the same between 2021 and 2030.
QUALITATIVE LIMIT: Currently, the program allows offset allowances from three offset types located in RGGI states:(1) landfill methane capture and destruction;(2) sequestration of carbon due to reforestation, improved
forest management, or avoided conversion;(3) avoidance of methane emissions from agricultural
manure management operations.
Some states have discontinued specific offset protocols, but all states accept offset allowances issued by any participating state. To date, only one offset project (on landfill methane capture and destruction) has been approved under RGGI.
10%
← CONTENT

FACT
SHEE
TS –
03
rEGi
Ona
L Gr
EEnh
OUS
E Ga
S in
iTia
TivE
Stat
us R
epor
t 202
1IC
AP
90
MARKET STABILITY PROVISIONSAUCTION PRICE FLOOR: USD 2.38 per short ton in 2021, increasing by 2.5% per year (to reflect inflation). RESERVES: Since 2014, RGGI has operated with a cost containment reserve (CCR), consisting of a quantity of allow-ances in addition to the cap which are held in reserve and only released to the market when certain trigger prices are reached. Beginning in 2021, allowances provided within the CCR will be equal to 10% of the regional cap.
Trigger price: USD 13.00 in 2021 (increasing by 7% annually compared to the previous year thereafter; having increased at 2.5% annually starting from USD 10 between 2017 and 2020).
In 2021, RGGI started implementing an emissions contain-ment reserve (ECR). Under the ECR, allowances are withheld from auction if certain trigger prices are reached, up to an annual withholding limit of 10% of the emission budgets (i.e., the share of each state in the regional cap) of participating states. Allowances withheld will not be re-offered for sale, effectively adjusting the cap downward. In 2021, the trigger price is set at USD 6, increasing by 7% compared to the previous year thereafter. Maine and New Hampshire are not participating in the ECR.
Compliance
COMPLIANCE PERIODThree years Compliance is evaluated at the end of each three-year control period. From the third control period, regulated entities must surrender allowances corresponding to 50% of their verified emissions in each of the first two years of a control period. They must cover 100% of the remaining allowances at the end of the three-year control period.
MRV REPORTING FREQUENCY: Quarterly
VERIFICATION: Emission data reports and their underlying data are required to undergo periodic quality assurance and quality control procedures in accordance with US EPA regu-lations.
FRAMEWORK: Emissions data for emitters are recorded in the United States Environmental Protection Agency’s (US EPA) Clean Air Markets Division database in accordance with state CO2 Budget Trading Program regulations and US EPA regulations. Provisions are based on the US EPA moni-toring provisions. Data are then automatically transferred to the electronic platform of the RGGI CO2 Allowance Tracking System (RGGI COATS), which is publicly available.
ENFORCEMENTIn case of excess emissions (i.e., if entities are found to not surrender all required allowances), allowances for three times the amount of excess emissions must be surrendered. Furthermore, covered entities may also be subject to specific penalties imposed by the RGGI state where the entity is located.
Other Information
INSTITUTIONS INVOLVEDStatutory and/or regulatory authority of each RGGI state. Environmental and energy agencies for each state participate. RGGI Inc. (non-profit cooperative supporting RGGI’s develop-ment and implementation)
EVALUATION/ETS REVIEWThe RGGI participating states periodically review the ETS program in order to consider program successes, impacts, and design elements. The first program review process (known as the 2012 Program Review) was completed in early 2013. A second review process was completed in 2017, resulting in the ‘2017 Model Rule.’ Program reviews were accompanied by stakeholder meetings to facilitate stake-holder engagement and the submission of comments from
interested parties. The next program review is scheduled to begin in 2021.
USE OF REVENUESRevenues from the quarterly auctions are returned to the RGGI states and have been primarily invested in the following consumer benefit programs: energy efficiency, renewable energy, direct energy bill assistance, and other GHG reduc-tion programs.
IMPLEMENTING LEGISLATION/REGULATION2017 RGGI Model Rule3
2017 RGGI Model Rule Updates (Summary)4
RGGI States’ Statutes & Regulations5
RGGI Program Design6
3 – https://www.rggi.org/sites/default/files/Uploads/Program-Review/12-19-2017/Model_Rule_2017_12_19.pdf4 – https://www.rggi.org/sites/default/files/Uploads/Program-Review/12-19-2017/Summary_Model_Rule_Updates.pdf 5 – https://www.rggi.org/program-overview-and-design/state-regulations6 – https://www.rggi.org/program-overview-and-design/elements
← CONTENT

FACT
SHEE
TS –
03
Tran
SpO
rTaT
iOn
and
CLiM
aTE
iniT
iaTi
vESt
atus
Rep
ort 2
021
ICAP
91
TRANSPORTATION AND CLIMATE INITIATIVETransportation and Climate Initiative Program (TCI-P)
In force
Under development
Under consideration
Regional collaboration to reduce transportation sector GHG emissions
Final MOU on design elements for ETS finalized in December 2020
ETS compliance obligation starting as early as 2023
Massachusetts; Connecticut; Rhode Island; Washington, D.C.
MEMBER STATES:
The Transportation and Climate Initiative (TCI) is a regional collaboration of northeastern and mid-Atlantic US jurisdic-tions pursuing a goal of reducing GHG emissions from the transportation sector and minimizing the transportation system’s reliance on high-carbon fuels. In December 2018, a subset of the participating TCI jurisdictions announced the future design of a regional low-carbon transportation policy proposal, which aims to establish a carbon pricing mecha-nism in the form of a cap-and-invest program. The announce-ment of such a program is the result of several years of consultations and negotiations amongst TCI members.
Over the course of 2019, TCI jurisdictions engaged in expert and public stakeholder consultations, as well as technical, environmental, and economic analyses of the benefits and costs of a regional transportation carbon pricing mechanism. As a result of this design process, in October 2019 the juris-dictions released a draft framework outlining basic design features of the regional transportation sector cap-and-invest program. In December 2019, the jurisdictions released a draft memorandum of understanding (MOU) consistent with the design features from the draft framework and announced modeling results for different cap reduction factors.
The final MOU, along with an ‘Elements of Program Design’ document, was released in December 2020 and is largely based on the draft MOU. As of February 2021, Massachu-setts, Connecticut, Rhode Island, and Washington D.C. have signed the final MOU and will participate in the established cap-and-invest program, the Transportation and Climate Initiative Program (TCI-P). The TCI-P will consist of individual programs adopted and implemented under the independent legal authority of each signatory jurisdiction. The program implementation schedule of the final MOU foresees that the first three-year compliance period will begin in January 2023, with emissions reporting beginning in 2022.
According to the MOU, the program will cap CO2 emis-sions from the combustion of gasoline and on-road diesel fuel in the participating states. Compliance obligations fall upstream, to firms that supply the covered fuels within these states. The four signatory jurisdictions of the TCI-P MOU will start with a cap of 42.1 MtCO2 in 2023 that would decline by 30% by 2032. The cap will be equal to the sum of the four TCI-P jurisdictions’ CO2 emissions budgets (Connecticut: 13.5 MtCO2; Massachusetts: 24.5 MtCO2; Rhode Island: 3.3 MtCO2; Washington D.C.: 0.9 MtCO2).
The program intends to auction nearly 100% of its allow-ances, with revenues being returned to TCI-P jurisdictions. Each state can invest the revenue as determined appropriate to achieve TCI program goals; however, at least 35% of reve-nues generated are to be invested in equitable, less-pol-luting, and more resilient transportation. Each signatory jurisdiction will establish a representative Equity Advisory Body, specifically designated to ensure that the program impacts are effective and just, and that both the policies and flow of investment are transparent.
The program will also implement a minimum reserve price and include a Cost Containment Reserve (CCR) with a trigger price of USD 12 in 2023 and an Emissions Contain-ment Reserve (ECR) with a trigger price of USD 6.50 in 2023. Banking of allowances will be allowed without restrictions and a limited use of offsets will be permitted.
In addition, the MOU introduced three-year compliance periods and interim compliance obligations, as well as a program evaluation three years after program launch (and regularly thereafter). An administrative organization to provide administrative support and technical assistance will be established. Further program design features such as specifications on eligible offset projects and the price level for the minimum reserve price are yet to be decided upon.
As next steps, the TCI-P jurisdictions will: provide for public review and input; develop a model rule; and conduct rulemaking processes over the course of 2021 to adopt regu-lations on the state level and start implementing the program by the 2022 reporting year.
A joint statement released by 12 jurisdictions (Delaware, Maryland, New Jersey, New York, North Carolina, Pennsyl-vania, Vermont, Virginia, and the four MOU jurisdictions) reit-erates their commitment to collaborating with one another on the further development of the program. Other states will also have the opportunity to join the TCI-P in the future.
← CONTENT

FACT
SHEE
TS –
03
Tran
SpO
rTaT
iOn
and
CLiM
aTE
iniT
iaTi
vESt
atus
Rep
ort 2
021
ICAP
92
Background Information
IMPLEMENTING LEGLISLATION/REGULATIONFinal Memorandum of Understanding2
Elements of Program Design3
OVERALL GHG EMISSIONS (excluding LULUCF) 110.0 MtCO2e (2017)1
OVERALL GHG EMISSIONS BY SECTOR (MtCO2e)
Electric power 19.3 (18%)industrial processes 5.5 (5%)Transportation 50.9 (46%)Commercial 13.1 (12%)residential 21.3 (19%)
1 – GHG emissions reported here are based on energy related emissions data only and retrieved from the IEA. Energy-related CO2 emissions refer to emissions released at the location where fossil fuels are consumed.
2 – https://www.transportationandclimate.org/sites/default/files/TCI%20MOU%2012.2020.pdf3 – https://www.transportationandclimate.org/sites/default/files/TCI-P_EPD_12-21-2020.pdf
← CONTENT

FACT
SHEE
TS –
03
WaS
hinG
TOn
Stat
us R
epor
t 202
1IC
AP
93
WASHINGTON
In force
Under development
Under consideration
Governor introduced a climate policy proposal that includes a cap-and-trade program for industry
Legislator introduced bill aligned with proposal for cap-and-trade program covering industry, energy, and fuel suppliers
Auction proceeds would be invested in mitigation, environmental justice, and climate resilience
The State of Washington continues to pursue carbon pricing policies through its legislature and executive agencies.
In December 2020, Governor Jay Inslee introduced the ‘Climate Commitment Act,’ a bill proposing to create a comprehensive climate program across Washington. Amongst other measures, the bill would establish an econ-omy-wide limit on GHG emissions. It would also authorize the Department of Ecology to administer a cap-and-trade program that ensures industries comply through the sale, tracking, and accounting of emissions allowances.
In January of 2021, Washington state legislators sponsored ‘the Climate Commitment Act’ bill, building on Governor Inslee’s climate program. Titled SB-5126, the bill is modeled on the Western Climate Initiative (WCI) and directs the Department of Ecology to administer an economy-wide cap-and-trade program by January 2023. The bill aligns with Washington’s statutory emissions limits of 50 million tonnes of CO2e in 2030, 27 million tonnes of CO2e in 2040, and 5 million tonnes of CO2e in 2050.
The program would cover transportation fuel suppliers, in-state power generators, and stationary facilities that emit equal to or more than 25,000 tCO2e per year as well as electricity importers and natural gas suppliers whose elec-tricity consumption corresponds to more than 25,000 tCO2e per year. Uncovered entities that wish to participate in the program could do so by registering as an opt-in entity or as a general participant.
The Department of Ecology would adopt annual allow-ance budgets for the program on a calendar year basis. Allowances would be distributed through a combination of auctions and free allocation. A maximum of four auctions would take place annually in addition to any necessary reserve auctions. In the program’s first compliance period, emissions-intensive trade-exposed (EITE) entities would receive 90% of their allowances for free in 2023, declining by five percentage points annually to 75% in 2026. The Department of Ecology would have to adopt EITE alloca-tion rules for the second compliance period by July 2024. Some power generators will receive free allocation during the first compliance period; however, these allowances must be consigned to auction for the benefit of ratepayers. Natural gas utilities would receive full free allocation during the course of the cap-and-trade program; however, these allowances must also be consigned to auction.
The bill also outlines market stability measures, specifi-cally an emissions containment reserve (ECR), an auction floor price with a schedule for the floor price to increase
by a predetermined amount each year, and an allowance containment reserve. Only covered and opt-in entities will be able to participate in the auction of allowances from the allowance containment reserve.
The bill also includes provisions for offset protocols. Offset projects must be located in the US or in a jurisdiction with which the Department of Ecology has entered into a linking agreement; result in GHG reductions or removals; and be certified by a recognized registry. The bill also enables the Department of Ecology to pursue links with other jurisdic-tions that have established an allowance-based GHG reduc-tion programs.
Additionally, SB 5126 states that the Department of Ecology would have to:• complete an evaluation of the program’s performance
by December 2035 to ensure the program is on track to achieve 2040 emissions reductions; and
• complete another evaluation by December 2045 to ensure the program is on track to achieve 2050 emission reductions.
Finally, the bill asserts that proceeds from the sale of emissions allowances would be directed to a new climate investment account. The funds from the account would be put towards clean transportation, natural climate resil-ience solutions, clean energy transition, and assistance and emissions reduction projects. An environmental justice and equity advisory panel would recommend plans and funding proposals for programs to be funded by the climate investment account. Funding proposals would need to undergo an environmental justice analysis to ensure they are being directed towards eliminating envi-ronmental harm as well as economic and health disparities for vulnerable populations.
The bill is being deliberated in the Washington Senate Committee on Environment, Energy, and Technology. The legislative session for 2021 ends on 25 April.
Carbon pricing policies, including a proposed cap-and-trade program, have repeatedly come before the legislature, and failed in two state referenda. Laws establishing steep emis-sions reduction targets successfully passed in the 2019 session, but no carbon pricing measures were approved. The most recent cap-and-trade program proposal, Senate Bill 5981, would have established a cap-and-trade program modeled after WCI. The Senate bill and other carbon pricing measures were debated in the 2020 legislative session but did not pass the legislature.
← CONTENT

FACT
SHEE
TS –
03
WaS
hinG
TOn
Stat
us R
epor
t 202
1IC
AP
94
The ‘Clean Air Rule’ (CAR)—a baseline-and-credit system that reduces emissions from industrial sources, petroleum fuel producers and importers, and natural gas distributors—was
suspended by legal challenges before it could be imple-mented in 2020.
Background Information
GHG REDUCTION TARGETS
BY 2030: 45% reduction from 1990 GHG levels (RCW 70A.45.020)BY 2040: 70% reduction from 1990 GHG levels (RCW 70A.45.020)BY 2050: Reduction of total GHG emissions to 95% below 1990 levels and achievement of net-zero emissions (RCW 70A.45.020)
Other Information
INSTITUTIONS INVOLVED Washington Department of EcologyOffice of Governor Jay Inslee
IMPLEMENTING LEGISLATION/REGULATIONGovernor Inslee’s Climate Commitment Act1
Senate Bill 5126 (SB 5126)2
Senate Bill 5981 (SB 5981)3
Clean Air Rule4
OVERALL GHG EMISSIONS (excluding LULUCF) 99.6 MtCO2e (2018)
OVERALL GHG EMISSIONS BY SECTOR (MtCO2e)
1 – https://www.governor.wa.gov/sites/default/files/ClimateBrief-Dec2020.pdf2 – http://lawfilesext.leg.wa.gov/biennium/2021-22/Pdf/Bills/Senate Bills/5126.pdf?q=202102020819283 – http://lawfilesext.leg.wa.gov/biennium/2017-18/Pdf/Bills/Senate Bills/5981.pdf?q=202102030150114 – https://apps.leg.wa.gov/WAC/default.aspx?cite=173-442&full=true&pdf=true
Electricity 16.2 (16%)residential/Commercial/industrial (rCi) Fuels 23.3 (23%)Fossil Fuel industry 0.8 (1%)industrial processes 5.4 (5%)Transportation 44.7 (45%)agriculture 6.7 (7%)Waste Management 2.4 (2%)
← CONTENT

FACT
SHEE
TS –
03
WES
TErn
CLi
MaT
E in
iTia
TivE
Stat
us R
epor
t 202
1IC
AP
95
WESTERN CLIMATE INITIATIVE
The Western Climate Initiative (WCI) was originally an initia-tive of American state and Canadian provincial governments, aimed at developing a joint regional strategy to reduce GHG emissions via a cap-and-trade program. Eventually, Cali-fornia and Québec independently established cap-and-trade systems using the framework developed through the WCI approach; their first compliance periods started in January 2013. One year later, California and Québec linked their systems, creating the first international cap-and-trade system consisting of sub-national jurisdictions. Ontario later developed a program using the WCI framework and launched its cap-and-trade system in 2017, which was linked to the California-Québec regional carbon market in January 2018 until its termination in mid-2018.
WCI, Inc., created in 2011, is a non-profit organization that provides administrative and technical services to support the member jurisdictions in implementing their respec-tive systems. It provides such services to California and Québec, and did so for Ontario until the termination of its ETS. In 2018, WCI, Inc. began supporting Nova Scotia for the establishment of the province’s own cap-and-trade system, which began operating in 2019. Current participating juris-dictions are California, Québec, and Nova Scotia.
← CONTENT

LATIN AMERICA AND THE CARIBBEAN

FACT
SHEE
TS –
03
BraZ
iLSt
atus
Rep
ort 2
021
ICAP
97
BRAZIL
Background Information
Brazil’s National Climate Change Policy, enacted in December 2009, aims to promote the development of a Brazilian market for emissions reductions, as well as other goals.
As part of its activities under the PMR, the Brazilian govern-ment carried out studies on the possible implementation of market instruments to meet Brazil’s mitigation targets and reduce overall mitigation costs. This included the develop-ment of design options, economic and regulatory impact assessments, as well as an analysis of potential interactions between carbon pricing instruments and existing policies. The country is currently considering adhering to the Partner-ship for Market Implementation.
In addition, the Ministry of Economy is strengthening the understanding of carbon pricing instruments among stake-holders through engagement, communication, and consul-tation. The Market Readiness Project team in Brazil, for example, engaged in talks with representatives of the private sector that support the carbon pricing agenda in Brazil, as well as representatives from civil society organizations.
Work in this area also continues through other international cooperation activities, such as through the Climate Change Policies Program (PoMuC) with the German Corporation for International Cooperation (GIZ).
Since 2013, a group of leading companies has been partici-pating in a voluntary ETS simulation to gain experience and develop proposals for an ETS in Brazil. The ETS simulation is coordinated by the Centro de Estudos em Sustentabilidade da Fundação Getulio Vargas. In 2020, trading was undertaken using the CarbonSim simulation platform.
RenovaBio, the National Policy for Biofuels, was approved in 2017 (Federal Law 13.576), establishing mandatory goals for the purchase of biofuels by fuel distributors. To achieve the targets, distributors must purchase specified volumes of certificates (CBIO), which represent emissions reductions related to the substitution of fossil fuels by biofuels. Trades in CBIOs began in June 2020, and public consultations are ongoing both on annual GHG reduction goals under the program as well as other design features.
OVERALL GHG EMISSIONS (excl. LULUCF) 1,036.3 MtCO2e (2015)
OVERALL GHG EMISSIONS BY SECTOR (MtCO2e)
GHG REDUCTION TARGETSBY 2025: 37% reduction from 2005 GHG levels (updated NDC)BY 2030: 43% reduction from 2005 GHG levels (updated NDC)
Energy 449.4 (43%)industrial processes 95.3 (9%)agriculture 428.9 (41%)Waste 62.7 (6%)
In force
Under development
Under consideration
Other Information
INSTITUTIONS INVOLVED Ministry of Environment Ministry of Economy (previously Ministry of Finance)Ministry of Mines and EnergyMinistry of Science, Technology and Innovation
Considering the design of an ETS
Trades in RenovaBio credits began in June 2020
← CONTENT

FACT
SHEE
TS –
03
ChiL
ESt
atus
Rep
ort 2
021
ICAP
98
Since 2013, Chile has been conducting a series of studies and discussions on the design and implementation of carbon pricing instruments in the country.
The tax reform of 2014 introduced green taxes for some mobile and stationary emission sources. In this context, a carbon tax has been in place in Chile since 2017; the tax was reformed in February 2020. In its updated form, the rate of USD 5 per tCO2 applies to stationary emis-sion sources that emit more than 25,000 tCO2 and/or 100 tonnes of particulate matter due to combustion processes per year. The same reform contemplates the possibility for the regulated entities to offset part or all of their emissions subject to the tax with mitigation projects that reduce the same emissions, subject to that mitiga-tion being additional, measurable, verifiable, and perma-nent. The Chilean government is currently working on developing the offset regulation, which is to be presented to the Council of Ministers of Sustainable Development in 2021. Offsets, their threshold limits, and their transac-tions are expected to be operational in 2023.
The Chilean Ministry of Environment is leading the devel-opment of a ‘Framework Law on Climate Change.’ The draft underwent a public consultation process and high-level approval by the Council of Ministers for Sustain-ability in 2019 and was sent for Congress approval in January of 2020. In August 2020, it was unanimously approved in general terms by the Senate and is currently being discussed in particular terms by the same chamber. The draft bill sets a carbon neutrality goal by 2050, along-side a detailed governance framework to reach it.
Also, the draft Framework Law defines a system in which the Ministry of Environment would establish GHG emis-
sions limits to individual or groups of emitting sources (in tCO2e/year). The surplus in the fulfilment of the emission limits would be certified as an emission reduction by the Ministry of the Environment, and regulated entities would in turn be able to sell this surplus. The specific design of the system of GHG emissions limits is not yet defined, and could be implemented either as an ETS or as a tradable performance standard. The law also would allow regu-lated entities to implement mitigation projects and use the certified reductions to either achieve the standard or transfer those reductions to third parties. A dedicated registry would track the projects and the transfers.
In 2020, an Interministerial Task Force on Article 6 was created. This Task Force is composed of the Ministry of Environment, Ministry of Foreign Affairs, Ministry of Finance, Ministry of Energy, and Ministry of Agriculture. It aims to coordinate the work related to the development of a national policy on the use of Article 6 and interna-tional collaboration on this subject.
Chile is set to continue its cooperation with the World Bank. In the context of the transition period from the Part-nership for Market Readiness (PMR) to the Partnership for Market Implementation (PMI), work is expected to focus on a roadmap for implementing the changes to the carbon tax, as well as on deepening the understanding of the role of carbon pricing in carbon neutrality, including the development of the system contained in the draft climate change law. Chile also joined the Warehouse Initiative of the World Bank with the aim of developing a GHG mitiga-tion portfolio of energy projects, and is engaging in activi-ties as part of the Climate Market Club, an initiative which supports countries in the development of Article 6 pilots to share lessons from a practical experience.
CHILE
In force
Under development
Under consideration
Provisions for a system of GHG emissions limits contained in the draft Framework Law on Climate Change
Updated NDC submitted in April 2020
Offset regulations currently under development
National policy on the use of Article 6 currently under development
Background Information
OVERALL GHG EMISSIONS (excl. LULUCF) 112.31 MtCO2e (2018)
GHG REDUCTION TARGETSBY 2025: Peak GHG emissions (updated NDC)BY 2030: GHG emissions level of 95 MtCO2e. Reduction of at least 25% of total emissions of black carbon, as compared to 2016. Carbon budget 1.100 MtCO2e between 2020 and 2030 (updated NDC)
OVERALL GHG EMISSIONS BY SECTOR (MtCO2e)Energy 87.0 (77%)industrial processes 6.6 (6%)agriculture 11.8 (11%)Waste 7.0 (6%)
← CONTENT

FACT
SHEE
TS –
03
ChiL
ESt
atus
Rep
ort 2
021
ICAP
99
Compliance
MRVThe current GHG MRV system serves primarily the imple-mentation of the carbon tax. Current regulations determine that operators of boilers and turbines of 50 MW or more of thermal capacity are required to monitor and report emis-sions through government-approved methodologies. Partic-ipation thresholds have been changed by the approved tax reform. With these changes, the carbon tax will apply to entities that emit more than 25,000 tCO2 and/or 100 tonnes of particulate matter due to combustion processes per year from 2023 onwards. Current methodologies are expected to be updated in the future to incorporate all possible regulated fixed sources.
The Chilean government has developed a Unified Atmospheric Emissions Report (Reporte Único de Emisiones Atmosféricas) under the Pollutant Release and Transfer Register for entities regulated under the tax and other norms. This has unified various reporting needs and aims to improve the quality of
the information provided. This new system, developed with support from the PMR, is considered as a basis for Chile to advance to the development of a Unified GHG Report, which will help evaluate Chile’s National Climate Policy.
Also, a National Mitigation Actions Registry (Registro Nacional de Acciones de Mitigación–RENAMI) is being developed. This registry will allow the implementation of the offset scheme approved in the carbon tax reform and would constitute a key element for other instruments under consideration, such as the scheme proposed in Framework Law on Climate Change or Article 6 of the Paris Agreement.
VERIFICATION: Verification procedures are administered by the Superintendence of the Environment under the Ministry of the Environment (no third-party verification is currently used).
Other Information
INSTITUTIONS INVOLVED Ministry of EnergyMinistry of EnvironmentMinistry of FinanceMinistry of Foreign AffairsMinistry of AgricultureInter-Ministerial Committee on Climate ChangePMR Chile (Precio al Carbono Chile)
← CONTENT

FACT
SHEE
TS –
03
COLO
MBi
aSt
atus
Rep
ort 2
021
ICAP
100
In 2018, Colombia adopted a law for climate change management, which outlines provisions for the establish-ment of a ‘National Program of Greenhouse Gas Tradable Emission Quotas’ (Programa Nacional de Cupos Transables de Emisión de Gases de Efecto Invernadero [PNCTE]).
The law outlines the basic provisions for the PNCTE. The Ministry of Environment and Sustainable Development (Minambiente) will determine the number of allowances, in line with Colombia’s national mitigation targets. Minam-biente is also in charge of allocation, which will take place primarily via auctions. Noncompliance is to be punish-able by a fine up to two times the auction price. Auction revenues will be directed to the National Environmental Fund and will be used for GHG reductions and mitigation projects, as well as to manage the information needed for the implementation of the law. The bill also includes crediting provisions: voluntary actions of non-regu-lated entities that generate GHG emissions reductions or removals could be issued allowances if they are verified, certified, registered in the National Emission Reductions
Registry (Registro nacional de reducción de emisiones de GEI–Renare), and deemed eligible for the program.
Further regulations required to operationalize the PNCTE are yet to be finalized. With support from the Partnership for Market Readiness, Colombia now has the main inputs to inform the technical design of the ETS. These inputs are currently under internal revision. Public discussions on the policy will then follow, as well as the develop-ment of the system infrastructure, such as an emissions reporting program. The final regulations for the ETS are expected to be concluded, and a pilot phase expected to start between 2023 and 2024.
The PNCTE will complement other mitigation instru-ments, such as the country’s existing USD 5 carbon tax and its offsetting program, both of which have been in place since 2017. The 2018 Climate Change Law states that the government may recognize carbon tax payments as part of the compliance obligation of regulated entities under the PNCTE.
Background Information
GHG REDUCTION TARGETS BY 2022: Accumulated reduction of GHG emissions of 36 MtCO2e, with respect to the national reference scenario, between 2018 and 2022 (aspirational, National Development Plan 2018–2022)BY 2023: Determine a carbon budget for the 2020–2030 period (updated NDC)
BY 2030: Reduce GHG emissions by 51% compared to BAU emissions by 2030. Reduce black carbon emissions by 40% compared to 2014 (updated NDC)
Other Information
INSTITUTIONS INVOLVEDMinistry of Environment and Sustainable DevelopmentDepartment of National PlanningMinistry of Mines and EnergyMinistry of FinanceNational Climate Change System
IMPLEMENTING LEGISLATION/REGULATIONLey 1931 de 20182
COLOMBIA
In force
Under development
Under consideration
Initial work on ETS design conducted in 2020
ETS pilot phase expected to start in 2023–2024
Energy 82.5 (55%)industrial processes 10.5 (7%)agriculture, Forestry, and Other Land Use1 43.2 (29%)Waste 14.4 (10%)
OVERALL GHG EMISSIONS (excluding category "3B Land") 150.6 MtCO2e (2014)
OVERALL GHG EMISSIONS BY SECTOR (MtCO2e)
1 – Colombia uses the sectors defined in the latest IPCC guidelines (2006 IPCC Guidelines for National Greenhouse Gas Inventories) for the preparation of its inventory, in which the Agriculture and the LULUCF sectors are integrated into “Agriculture, Forestry and Other Land Use.” In an effort to make the display of overall GHG emissions comparable with other jurisdictions, the figure shown here excludes the category “3B Land,” but includes the categories “3A Livestock” and “3C Aggregate sources and non-CO2 emissions sources on land.”
2 – https://www.funcionpublica.gov.co/eva/gestornormativo/norma.php?i=87765
← CONTENT

FACT
SHEE
TS –
03
MEX
iCO
Stat
us R
epor
t 202
1IC
AP
101
MEXICOMexican Emissions Trading System Pilot Program
CAP273.1 MtCO2 (2021)
GASES CO2 only
OFFSETS AND CREDITSdomestic1
ALLOCATIONFree allocation: Grandparenting
SECTORS:
POWER
INDUSTRY
ETS DESCRIPTIONThe Mexican Pilot ETS started operating in January 2020. It was mandated by Transitional Article 2 of the ‘General Law on Climate Change’ (as amended in July 2018) and is regu-lated by implementing regulation finalized in 2019. The Pilot ETS will help test system design and will run for two years, plus one year of transition to the full operational ETS. It aims to enhance the quality of emissions data and build capacity in emissions trading for covered entities, ultimately improving the design of the operational phase from 2023 onwards. The rules for the 2022 transitional phase are yet to be announced. Together, the Pilot phase (2020–2021) and the transition phase (2022) constitute the “test program” of the Mexican ETS.
The Pilot covers direct CO2 emissions from entities in the energy and industry sectors generating at least 100,000 tCO2
per year. Approximately 300 entities are covered by the Pilot, corresponding to ~40% of national emissions.
The Mexican Pilot ETS is designed to pose no economic impact on regulated entities; however, in case of noncom-pliance, entities lose the opportunity to bank unused allow-ances into the next compliance periods within the Pilot. More-over, noncompliant entities will receive fewer allowances during the operational period of the national ETS (two fewer allowances for each nondelivered allowance during the Pilot).
YEAR IN REVIEWIn 2020, Mexico developed its ETS Registry (Sistema de Seguimiento de Derechos de Emisión). As of early 2021, the first allowance allocation into accounts in the Registry is underway, after a small delay to the original deadline due to the impact of the COVID-19 pandemic.
In 2020, the country continued the development of offset provisions in priority sectors (forestry, agriculture, livestock, transport). Moreover, the Ministry of Environment and Natural Resources (SEMARNAT) is preparing a registry for
mitigation outcomes from voluntary and regulated sources (such as offsets, early action offsets, Internationally Trans-ferred Mitigation OIutcomes (ITMOs), or voluntary projects, among others), referred to as the “second branch” of the National Emissions Registry (RENE). The eligibility rules for the use of offsets within the ETS are being developed based on a mapping of activities and projects that could be used for this purpose.
In terms of stakeholder engagement, the Consultative Committee of the Pilot ETS has had three sessions as of January 2021 and its rules of operation are being developed. The Consultative Committee is the formal technical forum for consultation, orientation, social participation, and advice for the Pilot ETS. Its members are: representatives from the ministries of Finance, Environment and Natural Resources, Energy and Economy; a representative from the National Institute of Ecology and Climate Change; a representative of the Confederation of Industrial Chambers; a representative from the Coordinating Business Council; five representa-tives of the regulated sectors; a representative from financial institutions or exchanges; and two representatives from civil society and two from universities, with voice but no vote in the Committee. As well, several capacity-building activi-ties also took place during 2020, such as advanced training courses and a number of smaller courses aimed at regulated entities.
Different studies and analyses are also being developed, such as:• an analysis of the interaction of the ETS with other carbon
pricing instruments in the country (at both national and subnational levels);
• an evaluation framework that reviews different methods, criteria, metrics, and international experiences on the evaluation of ETSs; and
• an analysis of the Mexican climate policy framework and its suitability to engage in international cooperation through Article 6 of the Paris Agreement.
First ETS in operation in Latin America
Pilot phase implemented in 2020
Covers energy and industry sectors, which constitute 40% of national emissions
1 – The Ministry of Environment and Natural Resources is in the process of establishing a domestic offsetting program.
In force
Under development
Under consideration
← CONTENT

FACT
SHEE
TS –
03
MEX
iCO
Stat
us R
epor
t 202
1IC
AP
102
Background Information
OVERALL GHG EMISSIONS (excluding category "3B Land") 733.8 MtCO2e (2017)
OVERALL GHG EMISSIONS BY SECTOR (MtCO2e)
GHG REDUCTION TARGETSBY 2030: 22% below BAU GHG emissions baseline (NDC, included in the ‘General Law of Climate Change’)BY 2050: 50% below 2000 GHG levels (aspirational, included in the ‘General Law of Climate Change’)
ETS Size
Energy 522.4 (71%)industrial processes 58.0 (8%)agriculture, Forestry, and Other Land Use2 106.7 (15%)Waste 46.7 (6%)
COVERED EMISSIONS 273.1 MtCO2(ETS cap 2021)
GHGs COVEREDCO2 only
SECTORS AND THRESHOLDSThe Pilot ETS covers the energy and industrial sectors. The energy sector encompasses electricity generation, trans-mission, and distribution, as well as fossil fuel extraction, production, transport, and distribution.
The industry sector includes automobiles, cement, lime, chemical industry, food and beverages, glass, iron and steel, metallurgical, mining, petrochemicals, and pulp and paper, as well as other industrial subsectors generating direct CO2 emissions from stationary sources at or above the threshold.
The Pilot ETS covers installations whose annual direct emis-sions from stationary sources amount to at least 100,000 tCO2.
POINT OF REGULATIONDownstream
NUMBER OF ENTITIES~300
The broader mandatory National Emissions Register (RENE) requires mandatory reporting of direct and indirect GHG emissions for facilities with annual emissions at or above 25,000 tCO₂e (see "MRV" section).
CAP PILOT (2020–2021): Year 2020: 271.3 MtCO2
Year 2021: 273.1 MtCO24
Three reserves will be filled each year with allowances additional to the cap:• auctions reserve (equivalent to 5% of the cap);• new entrants reserve (equivalent to 10% of the cap, for
new entrants as well as increases in production among existing regulated entities); and
• general reserve (equivalent to 5% of the cap, for ex-post adjustment allocation for entities with higher emissions relative to their baselines).
The reserves serve as safeguards to avoid economic impacts on regulated entities during the Pilot phase, as required by the ‘2018 General Law on Climate Change.’
~40%3
2 – Mexico uses the sectors defined in the latest IPCC guidelines (2006 IPCC Guidelines for National Greenhouse Gas Inventories) for the preparation of its inventory, in which the Agriculture and the LULUCF sectors are integrated into “Agriculture, Forestry and Other Land Use.” In an effort to make the display of overall GHG emissions comparable with other jurisdictions, the figure shown here excludes the category “3B Land,” but includes the categories “3A Livestock” and “3C Aggregate sources and non-CO2 emissions sources on land”.
3 – As per information published by SEMARNAT4 – The increase in the cap between 2020 and 2021 is due to an increase in the sectoral allocation for regulated entities categorized as “others.”
← CONTENT

FACT
SHEE
TS –
03
MEX
iCO
Stat
us R
epor
t 202
1IC
AP
103
Flexibility
BANKING AND BORROWING If participants are in compliance with their surrender obli-gations, then their remaining allowances may be banked for use in subsequent compliance periods within the Pilot. Allowances issued in the Pilot will be valid only for the Pilot, although SEMARNAT is tasked to also assess the viability of allowing a share of Pilot allowances to be banked into the national ETS. Although the possibility of borrowing is not explicitly stated, surrender of allowances for a given compliance period is done after allocation of allowances for the subsequent compliance period takes place.
OFFSETS AND CREDITSQUALITATIVE LIMIT: Two types of flexibility instruments are foreseen, both of which will generate “offset credits” eligible for use under the Pilot: offsets and early action.
Offsets: SEMARNAT will establish a domestic program for the generation of credits that can be surrendered for compli-
ance in the national ETS. Eligible mitigation projects or activ-ities are domestic projects that have been validated and verified under internationally or domestically recognized protocols (as yet unspecified). Emission reductions related to all GHGs will be eligible, except for those related to direct CO2 emissions.
Early action: For those projects or mitigation activities operating under recognized protocols that receive offsets before the Pilot comes into force, SEMARNAT may issue offset credits if a certificate of cancellation is presented. These projects will be allowed to continue generating offsets during the Pilot.
QUANTITATIVE LIMITS: Participants will be able to meet up to 10% of their compliance obligations with offset or early action credits.
SEMARNAT is currently working on the regulations to oper-ationalize the offset and early action provisions in the Pilot ETS.
Phases & Allocation
TRADING PERIODSPilot phase (2020–2021); and Transition phase (2022) to the operational period of the ETS, which is scheduled to start in 2023.
The schedule of implementation as contained in Annex I to the ETS Pilot regulation (Acuerdo por el que se esta-blecen las bases preliminares del Programa de Prueba del Sistema de Comercio de Emisiones) contains compliance and allocation dates for the compliance cycle of 2020 and 2021. Emissions for 2022 will be covered by the operational period of the ETS.
SEMARNAT is expected to publish the regulation of the oper-ational period of the ETS in 2022.
ALLOCATIONThe Pilot will use free allocation with the following specifi-cations.
INITIAL ALLOCATION: Entities will receive free allowances based on the most recent verified emissions. New entrants will receive free allowances based on their verified emis-sions in the year in which they first crossed the 100,000 tCO2 threshold.
EX-POST ADJUSTMENT: An adjustment allocation will be carried out from the general reserve for those participants whose verified emissions in that year are higher than the free allocation received. Also, as per the ‘Notice on the rules and criteria for allowance allocation,’ participants may request additional allowances when an expansion in their produc-tion results in additional direct CO2 emissions from stationary sources. As per the same Notice, in the event that demand for additional allowances exceeds reserves, SEMARNAT will make a distribution of additional allowances proportional to the requested amounts.
PLANT CLOSURES: When an installation closes perma-nently, the installation may have to surrender the allow-ances that it has for the compliance period of the year before its closure. As well, it may need to return the free allowances received for the compliance period in which it closes. Whether the installation has to only surrender allow-ances, only return allowances, or both, depends on the date of the year in which it closes. These allowances are then cancelled by SEMARNAT.
AUCTIONS: Starting from the second year of the Pilot and depending on market behavior, SEMARNAT may auction allowances from the auction reserve.
← CONTENT

FACT
SHEE
TS –
03
MEX
iCO
Stat
us R
epor
t 202
1IC
AP
104
Compliance
COMPLIANCE PERIODFrom 1 January to 31 December. Regulated entities have until 1 November of the subsequent year to surrender allow-ances of a compliance period.
MRVREPORTING FREQUENCY: Annual self-reporting based on electronic templates prepared by SEMARNAT.
VERIFICATION: Verification by independent accredited verifiers is required by 30 June each year.
FRAMEWORK: A monitoring plan is required from all regu-lated entities, but noncompliance has no effects on free allo-cation or ex-post adjustments. Verified annual CO2 emissions are reported both to the RENE (in addition to other obliga-tions that regulated entities have to report to the RENE) and to the ETS registry.
Under RENE, emitters with annual emissions at or above 25,000 tCO₂e in the energy, industrial, transport, agricul-tural, waste, commercial, and services sectors are required to report the six GHGs identified by UNFCCC, as well as black carbon, chlorofluorocarbons (CFCs), hydrochloroflu-orocarbons (HCFCs), halogenated ethers, halocarbons, and their mixes.
ENFORCEMENTThe system is designed to pose no economic impact on regulated entities; however, in case of noncompliance, entities lose the opportunity to bank unused allowances for the next compliance periods within the Pilot. More-over, noncompliant entities will receive fewer allowances during the operational period of the national ETS (two fewer allowances for each nondelivered allowance during the Pilot).
Linking
LINKS WITH OTHER SYSTEMS The ‘General Law on Climate Change’ foresees possible linkages between the Mexican ETS and ETSs in other countries. Various cooperation activities have taken place in recent years. Mexico signed a Memorandum of Under-standing with California in 2014 and with Québec in 2015 that includes cooperation on ETS. In August 2016, Mexico,
Québec, and Ontario issued a joint declaration on carbon markets collaboration. Additionally, in December 2017, Mexico—together with four countries and seven subna-tional governments—issued the Paris Declaration on Carbon Pricing in the Americas for carbon pricing imple-mentation, which creates a platform for cooperation among countries in the region.
Other Information
INSTITUTIONS INVOLVED SEMARNAT National Institute for Ecology and Climate Change (INECC)
EVALUATION/ETS REVIEW Article 10 of the Agreement on the establishment of the preliminary basis of the Pilot Program provides that SEMARNAT will annually review the Pilot, publishing reports on topics such as price behavior and emissions reductions achieved. As well, an evaluation of the Pilot, supported by the INECC and by the Consultative Committee, will be conducted to determine if adjustments to the ETS design are necessary before the start of the operational period of the program. This evaluation process may involve consultations with civil society and academia.
A preliminary study on different methods, criteria, metrics, and international experiences on the evaluation of ETSs is being developed, as an input for the evaluation process of the Pilot.
Regulations for the operational period of the Mexican ETS are to be published in 2022.
IMPLEMENTING LEGISLATIONGeneral Law of Climate Change5 Agreement on the establishment of the preliminary basis of the Pilot Program of the Emissions Trading System (imple-menting regulation of the pilot)6 Regulation of the General Law on Climate Change on the National Emissions Register7 Notice on the cap for the years 2020 and 20218 Notice on the reserve and sectoral allocation of allowances for the years 2020 and 20219 Notice on the rules and criteria for allowance allocation10
5 – http://www.diputados.gob.mx/LeyesBiblio/pdf/LGCC_061120.pdf 6 – https://www.dof.gob.mx/nota_detalle.php?codigo=5573934&fecha=01/10/2019 7 – https://biblioteca.semarnat.gob.mx/janium/Documentos/Ciga/agenda/DOFsr/DO3452.pdf 8 – https://www.gob.mx/cms/uploads/attachment/file/513702/Aviso_Tope.pdf 9 – https://www.gob.mx/cms/uploads/attachment/file/513701/Aviso_Asignacion_Sectorial.pdf 10 – https://www.gob.mx/cms/uploads/attachment/file/600718/Aviso-Reglas-Criterios-de-Asignacion-SCE.pdf
← CONTENT

ASIA-PACIFIC

FACT
SHEE
TS –
03
BEiJ
inG
Stat
us R
epor
t 202
1IC
AP
106
BEIJINGBeijing Pilot Emissions Trading System
SECTORS:
CAP~50 MtCO2 (2018)
GASES CO2 only
OFFSETS AND CREDITSdomesticprovincial
ALLOCATIONFree allocation: GrandparentingFree allocation: Benchmarking
AVERAGE 2020 PRICECnY 87.06 (USd 12.62)
TOTAL REVENUEno auctions have been held
ETS DESCRIPTIONThe Beijing Pilot ETS was launched in November 2013; to date, it has completed seven compliance years. Beijing is one of the two Chinese pilots with ETS regulation passed by its regional congress. The ETS covers ~45% of the city’s total emissions, including: both direct and indirect emissions from electricity providers; heat, cement, petrochemicals, and other industrial enterprises; manufacturers; the service sector; and public transport. In 2016, it lowered the inclusion thresholds from the original 10,000 to 5,000 tCO2/year while adding the public transport sector. In 2020, Beijing also included the aviation sector in its mandatory reporting scheme, preparing the sector to be included in the carbon market.
Beijing is the only regional pilot in China that uses a price floor (CNY 20.00 (USD 2.90)) and ceiling (CNY 150.00 (USD 21.74)) as a price stability mechanism. In cases of consecutively high or low average prices, the government can auction or buy back extra allowances. The Beijing pilot has seen a relatively high carbon price level, as compared to other pilots (average price in 2020 was above CNY 80.00 (USD 11.59)). The Beijing pilot is also open to diversified market participants including compliance entities, institu-tional investors, and individuals.
Beijing also has pioneered cross-regional trading with its neighboring provinces. A ‘Framework Agreement for Coop-eration on the Study of Cross-regional Carbon Emissions Trading’ with Tianjin, Hebei, Inner Mongolia, Shaanxi, and Shandong signed in 2013 provided a basis for cooperation. As a consequence of this, several cement companies from the Hebei province as well as companies from both the cement and power generation sectors voluntarily partici-pated in the Beijing ETS in 2014 and 2015. Several compa-nies from the same sectors in Inner Mongolia also voluntarily participated in 2015.
The Beijing Pilot ETS is managed by the Beijing Municipal Ecology and Environment Bureau (EEB), which became the competent authority for the Beijing ETS in 2019. Updated implementing legislation is contained in the ‘2018 Carbon Emission Management and Trading Plan.’
YEAR IN REVIEWIn April 2020, the Beijing EEB released a notice on the ‘Management of Key Carbon Emission Units and the Pilot Work of Carbon Emissions Trading in 2020’; the notice had several documents on MRV, allowance allocation, and offsets as attachments. Most noticeably, the notice included the domestic aviation sector in the mandatory emissions reporting scheme, laying the foundation for covering this sector in its carbon market later. In this context, the Beijing EEB introduced monitoring and reporting guidelines for the aviation sector and updated its existing MRV guidelines for the other sectors.
As part of the revisions to ‘the carbon allowance approval methods of enterprises (units) in Beijing’ which specifies the pilot’s allocation methods, the Beijing EEB adjusted the benchmark values of different unit types of power gener-ation enterprises (combined heat and power), increasing their stringency. It also officially indicated that some sectors currently using grandparenting, such as cement as well as heat production and heat supply, will move to benchmarking soon. It further set the emission reduction factors for all the covered sectors for 2019 and 2020.
In addition, the Beijing EEB published a new voluntary offset methodology for low-carbon transportation attached to the April notice, by modifying and improving the 2017 method-ology focused on motor vehicles.
The Beijing EEB moved the compliance deadline for 2019 emissions from 15 June to 15 November 2020 as a result of the COVID-19 pandemic. The government announced a 100% compliance rate at the end of 2020.
According to the Chinese national ETS rules, regional markets that have already allocated allowances for 2019 and/or 2020 for the power sector will remain under the regional system for those years. As Beijing already announced the emission reduction factors for 2020, this implies that the power sector entities that are overlapping between Beijing and the national ETS will be covered under the regional carbon market in 2020 and moved to the national one from 2021 onwards.
POWER
INDUSTRY
TRANSPORT
BUILDINGS
One of two Chinese pilots with ETS regulation passed by regional congress
Price floor and ceiling are used as price stability mechanism
Expanded sector coverage and lowered inclusion threshold
Cross-regional trading pioneered
In force
Under development
Under consideration
← CONTENT

FACT
SHEE
TS –
03
BEiJ
inG
Stat
us R
epor
t 202
1IC
AP
107
Background Information
GHG REDUCTION TARGETSBY 2020: 20.5% reduction in carbon intensity compared to 2015 levels. Pledge to peak Beijing CO2 emissions by 2020 (Beijing 13th Five-Year Plan on Energy Saving and Climate Change)
ETS Size
COVERED EMISSIONS
GHGs COVEREDCO2 only
SECTORS AND THRESHOLDSIndustrial and non-industrial companies and entities, including electricity providers, heating sector, cement, petrochemicals, other industrial enterprises, manufacturers, service sector, public transport, and domestic aviation.1
INCLUSION THRESHOLDS: Until 2015: 10,000 tCO2/year, considering both direct and indirect emissions.
From 2016 onwards: 5,000 tCO2/year, considering both direct and indirect emissions.
MANDATORY REPORTING: 2,000 tonnes of coal equivalent (tce) energy consumption/year.
POINT OF REGULATIONDownstream
Both direct and indirect emissions from electricity consump-tion are covered.
NUMBER OF ENTITIES831 (2019). In addition, 14 aviation entities and 634 other enti-ties have mandatory reporting but no surrender obligations.
CAP~50 MtCO2e (2018)
Phases & Allocation
TRADING PERIODS2013 and ongoing2
ALLOCATIONFREE ALLOCATION: Free allocation through grandparenting based on historical emissions or emissions intensity in the baseline years, which are the previous three years.
Benchmarking is used for new entrants and entities with expanded capacity, as well for the power sector. Bench-marking will be expanded to sectors such as heat production and cement.
AUCTIONING: Beijing could set aside up to 5% of allowances for regular and irregular auctions (see “Market Stability Provi-sions” section). To date, no auctions have been held.
Flexibility
BANKING AND BORROWING Banking is allowed.
Borrowing is not allowed.
1 – Currently, the domestic aviation sector is only subject to mandatory reporting. 2 – In the short term, the existing Chinese regional carbon markets are expected to operate in parallel with the national Chinese carbon market. Over the medium to long
term, they are expected to be integrated into the national market, once it is fully operational.
OVERALL GHG EMISSIONS (excluding LULUCF) 188.1 MtCO2e (2012)
~45%
← CONTENT

FACT
SHEE
TS –
03
BEiJ
inG
Stat
us R
epor
t 202
1IC
AP
108
3 – Besides this type of trading, the Beijing pilot also allows over-the-counter (OTC) trading. 4 – http://www.tanpaifang.com/zhengcefagui/2013/122927524.html5 – http://www.tanjiaoyi.com/article-1562-1.html 6 – http://sthjj.beijing.gov.cn/bjhrb/index/xxgk69/zfxxgk43/fdzdgknr2/hbjfw/1745093/index.html 7 – http://sthjj.beijing.gov.cn/bjhrb/index/xxgk69/zfxxgk43/fdzdgknr2/hbjfw/1758471/index.html
OFFSETS AND CREDITSQUANTITATIVE LIMIT: Domestic project-based carbon offset credits—Chinese Certified Emission Reduction (CCER) credits—are allowed. In addition, Beijing also has intro-duced its local offset programs focusing on carbon sinks, low-carbon transport, and energy saving. Offset use is limited to 5% of the annual allocation. The limit has been increased to 20% since 2019 only for the local low-carbon transport offsets.
QUALITATIVE LIMIT: CCERs from energy conservation proj-ects and forestry carbon sink projects are allowed, whereas credits from hydropower, HFC, PFC, N2O, and SF6 projects are not eligible. CCERs must come from projects that began operation after the beginning of 2013 (with exceptions for carbon sink projects, for which the date is February 2005).
Out of the 5% limit, at least 50% must come from projects within the jurisdiction of the city of Beijing. Among non-Bei-jing CCERs, priority is given to those with regional climate or pollution control cooperation agreements (e.g., Hebei and Tianjin).
MARKET STABILITY PROVISIONS PRICE FLOOR AND CEILING: The competent authority can auction extra allowances if the weighted average price exceeds CNY 150 (USD 21.74) for 10 consecutive days, and buy-back allowances from the market using a special funding source from the municipal budget if the price is below CNY 20 (USD 2.90).
EXCHANGE: The China Beijing Environment Exchange imple-ments a system of limits on price increases and decreases for trading over the exchange3 which is ±20% of the reference price (the weighted average price of all transactions on the previous trading day) to prevent large price fluctuations. It also sets the maximum position limit for the different market participants: the sum of their annual allocated allowances plus one million tonnes for the compliance entities, one million tonnes for institutional investors, and 50,000 tonnes for natural persons.
RESERVE: The competent authority could set aside up to 5% of allowances for regular and irregular auctions. To date, no auctions have been held.
Compliance
COMPLIANCE PERIODOne year (1 January to 31 December): covered entities have until 15 June of the following year to surrender allowances.
MRVREPORTING FREQUENCY: Annual reporting of CO2 emissions.
VERIFICATION: Third-party verification is required. In addi-tion, the government organizes expert review of all the veri-fication reports; 30% of them are subject to further fourth-party verification.
FRAMEWORK: The Beijing EEB has updated the general rules for monitoring and reporting, as well as for sector-specific guidelines for the following sectors: heat production and supply, thermal power generation, cement, petrochemicals,
public transport, aviation, other industrial enterprises, and the service sector.
OTHER: In addition to the ETS participants, all legal entities with energy consumption of more than 2,000 tce must report their emissions. Verification is not required.
ENFORCEMENTPenalties for failing to submit emissions or verification reports on time can result in fines up to CNY 50,000 (USD 7,245.57). Furthermore, companies failing to surrender enough allow-ances to match their emissions are fined up to five times the average market price over the previous six months for each missing allowance. Other nonfinancial penalties include negative impacts on access to bank loans and subsidy programs.
Other Information
INSTITUTIONS INVOLVED Beijing Ecology and Environment Bureau (competent authority)China Beijing Environment Exchange (trading platform)Beijing Research Center for Climate Change (registry)
IMPLEMENTING LEGISLATIONBeijing Municipal People’s Congress ETS Pilot Bill4
Interim Measures for the Management of Emissions Trading in Beijing5 List of Covered Entities (2019 compliance year)6 Beijing EEB Notice on the Management of Key Carbon Emis-sion Units and the Pilot Work of Carbon Emission Rights Trading in 20207
← CONTENT

FACT
SHEE
TS –
03
Chin
aSt
atus
Rep
ort 2
021
ICAP
109
CHINAChina National Emissions Trading System
SECTORS:
POWER*
In force
Under development
Under consideration
ESTIMATED COVERAGEOver 3,500 MtCO2 (2019)Over 3,700 MtCO2 (2020) Over 4,000 MtCO2 (2021)
GASES CO2 only
OFFSETS AND CREDITSdomestic
ALLOCATIONFree allocation: Benchmarking
Became operational in 2021, as the world’s largest ETS, covering more than four billion tCO2 (about 40% of national emissions)
Operates as an intensity-based ETS
Covers the power sector initially and will roll out to other sectors over time
ETS DESCRIPTIONChina’s national ETS started operating in 2021, bringing the world’s largest ETS online after three years of preparation since the political launch. In early January 2021, the Chinese Ministry of Ecology and Environment (MEE) published key ETS policy documents, along with an announcement that regulated entities will need to surrender allowances pertaining to their 2019–2020 emissions in 2021.
Building on its experience of successfully piloting carbon markets in eight regions, China launched its national ETS politically in December 2017. A step-by-step development roadmap was then outlined in a work plan, which was endorsed by the country’s highest administrative body, the State Council. The launch of the ETS was a goal set in 2015 by China’s highest political level, and the goal was reaffirmed by the country’s Nationally Determined Contribution (NDC) under the Paris Agreement and the ‘13th Five-Year Work Plan (FYP) for Greenhouse Gas Emission Control.’
The objective of the China national ETS is to contribute to the effective control and gradual reduction of carbon emissions in China and to the achievement of green and low-carbon development. The ETS regulates more than 2,200 companies from the power sector (including combined heat and power, as well as captive power plants of other sectors), which emit more than 26,000 tCO2 per year. The Chinese national ETS is estimated to cover more than four billion tCO2, accounting for ~40% of national carbon emissions. The system’s scope is to be further expanded in the future. Currently, it is an inten-sity-based ETS with the cap being adjusted ex-post based on actual production levels. The compliance obligations are also limited.
From the institutional perspective, the National Develop-ment and Reform Commission (NDRC) was responsible for national ETS development until 2018. That year, as part of a broader government restructuring, the climate change policy portfolio (including the development of the ETS) was shifted to the newly established MEE.
Key pillars of the development of the national ETS include: reporting and verification of historical emissions data from eight emission-intensive sectors; development of the national registry, trading system, and national enterprise GHG reporting system; set-up of the legislative and regula-tory framework; and capacity building.
The existing Chinese regional ETS pilots are gradually tran-sitioning into the national ETS. In the short term, the pilots continue to operate in parallel to the national market, covering the sectors and entities not included in the national market. Over the medium to long term, as more sectors are included in the national ETS, overlapping entities are expected to be integrated into the national market.
China’s national ETS is expected to be one of the key policy instruments to realize the country’s climate ambition in both the short and long term. The country’s key mitigation targets include peaking carbon emissions before 2030 and achieving carbon neutrality by 2060.
YEAR IN REVIEWMany technical and political processes for the launch of the national ETS were concluded in 2020. The turning point was President Xi Jinping’s announcement in September 2020, committing China to achieve peak carbon emissions before 2030 and carbon neutrality by 2060. This generated great momentum for the development of the national ETS, leading to the system’s operationalization at the beginning of 2021.
A key milestone for the national ETS was achieved with the finalization and publication of two important policy docu-ments: • ‘The National Measures for the Administration of Carbon
Emission Trading (Trial)’ (short form: the National Measures); and
• the ‘2019–2020 National Carbon Emission Trading Cap Setting and Allowance Allocation Implementation Plan (Power Generation Industry)’ (short form: the Allocation Plan).
*captive power plants of other sectors are also covered
← CONTENT

FACT
SHEE
TS –
03
Chin
aSt
atus
Rep
ort 2
021
ICAP
110
The National Measures, which took effect in February 2021, provide the legal basis for the national ETS and supersede the interim measures published in 2014.1 It is issued in the form of a departmental regulation, which is subject to future review and revision.2 The document includes: general rules and provisions related to allowance allocation and registra-tion; emissions trading; MRV; compliance; offsets; supervi-sion and management; and penalties.
The Allocation Plan adopts benchmarking as the main allow-ance allocation approach and includes processes for pre-al-location and ex-post adjustments. It further clarifies the relationship between regional ETS pilots and the national ETS: the overlapping entities between them that are already covered by regional allocation plans in 2019 and/or 2020 are excluded from the national ETS for those years and remain in the regional systems. However, after the release of the Allo-cation Plan for the national ETS, the regional pilots will no longer issue allowances to them. Together with the Alloca-tion Plan, the MEE also released the list of covered entities, according to which the national ETS covers 2,225 companies. The confirmation of the covered entities builds on an exten-sive historical data collection process that started in 2013 and continued until 2020.
The MEE is also working on the policy documents outlining other key areas of the national ETS design, with some already released for public consultation even though they have not yet been finalized:• ‘The Administrative Measures for the Registration, Trading,
and Settlement of the National Carbon Emission Rights (Trial)’ was released in November 2020. It clarifies the basic elements and oversight system of allowance registration, trading, and settlement, as well as the functions of the agencies responsible for the registry and trading system’s operation.
• Two documents on MRV were released in December 2020. The ‘Guidelines on Enterprise Greenhouse Gas Emissions Accounting and Reporting − Power Generation Facili-ties’ build on two existing technical guidelines and aim to establish the MRV foundation for the national ETS. The ‘Guidelines for Enterprise Greenhouse Gas Verifica-tion (Trial)’ build on a previous document from 2016 and provide further details on verification.
These documents are expected to be finalized after the public consultation process to support the implementation of the national ETS.
A key ongoing technical task is the development of the registry and of the trading platform, which are led by the local governments of Hubei and Shanghai respectively. In May 2020, the MEE organized an expert review meeting on the construction plan of these two systems. They have been further developed and improved, with several rounds of inspections by experts since then.
Following the announcement of the country’s 2030 and 2060 targets, China put forward its enhanced NDC in December 2020, committing to reduce its carbon intensity by more than 65% by 2030 compared to 2005 levels. China is in the process of developing its 14th Five-Year Plan (2021–2025) and 2030 carbon emissions peaking plan. Its national ETS will then be aligned with these targets and plans.
Background Information
GHG REDUCTION TARGETS2016–2020: Reduction in carbon emissions per unit of GDP by 18% compared to 2015 levels (13th FYP)BY 2020: 40–45% reductions in carbon intensity compared to 2005 levels (voluntary commitment under the Copenhagen Accord of 2009)
BY 2030: Peak CO2 emissions before 2030 (announcement by President Xi in September 2020); lowering CO2 emissions per unit of GDP by over 65% from 2005 levels (updated NDC)BY 2060: Carbon neutrality (announcement by President Xi in September 2020)
1 – In December 2014, the NDRC—the former national competent authority for climate change—issued the Interim Measures for the Administration of Carbon Emissions Trading (NDRC Order No. 17) to regulate the construction of carbon markets in China.
2 – This level of regulation (in Chinese: Guanli Banfa) is lower in the legal hierarchy compared to the State Council regulation, with implications for the level of financial fines it could impose. The document itself also leaves space for the further development of higher-level legislation such as national regulation (in Chinese: Zanxing Tiaoli) as the national ETS develops further.
OVERALL GHG EMISSIONS (excluding LULUCF) 12,301 MtCO2e (2014)
OVERALL GHG EMISSIONS BY SECTOR (MtCO2e)Energy 9,559.0 (78%)industrial processes 1,718.0 (14%)agriculture 830.0 (7%)Waste 195.0 (2%)
← CONTENT

FACT
SHEE
TS –
03
Chin
aSt
atus
Rep
ort 2
021
ICAP
111
~40%
ETS Size
COVERED EMISSIONS
GHGs COVEREDCO2
SECTORS AND THRESHOLDS Power sector (including combined heat and power, as well as captive power plants of other sectors). Compliance obliga-tions are currently limited (see “Enforcement” section).
The scope is expected to be gradually expanded to cover seven other sectors in addition to power: petrochemical, chemical, building materials, steel, nonferrous metals, paper, and domestic aviation. There is no specific timeline for this expansion.
INCLUSION THRESHOLDS: Entities with annual emissions of 26,000 tCO2 in any year over the period 2013–2019.
POINT OF REGULATIONDownstream
In the long run, both direct emissions from the power sector and indirect emissions from electricity and heat consump-tion are expected to be included.
NUMBER OF ENTITIESThe Chinese regional ETS pilots covered power sector enti-ties, which may also fall under the national ETS. These enti-ties are transitioning into the national market. Below is an estimation, based on publicly available information, of the number of covered entities under the national ETS: 1,961 (2019)2,070 (2020)2,225 (2021)
CAPThe cap is set bottom-up, i.e., the sum of the total allowance allocation to all covered entities forms the cap. It is also an intensity-based cap, which changes according to the actual production levels. The national ETS is estimated to have a cap of over 4,000 MtCO2/year for 2021.3
Phases & Allocation
TRADING PERIODSThe current regulation does not yet define specific trading periods for the Chinese national ETS.
ALLOCATION FREE ALLOCATION: Benchmarking is used as the main allo-cation method, with four distinct benchmarks: conventional coal plants below 300 MW; conventional coal plants above 300 MW; unconventional coal; and natural gas.
At first, entities will receive allowances at 70% of their 2018 output multiplied by the corresponding bench-mark factor. Allocation will be adjusted later to reflect
actual generation in 2019 and 2020. A unit load (output) adjustment factor distributes more allowances for entities operating at load rates lower than 85%. This may provide more allowances to less efficient power units. A regional adjustment factor that would give regional governments the opportunity to tighten allocation in line with regional climate targets had been proposed during the drafting phase of the Allocation Plan, but was not included in the final version.
AUCTIONING: Currently, allocation is to take place mainly through free allocation, but the National Measures clarify that auctioning may be introduced at a later point in time.
3 – Moreover, according to the National Measures, voluntary allowance cancelation is allowed: covered entities, other institutions and individuals can voluntarily purchase and cancel emission allowances.
← CONTENT
FACT
SHEE
TS –
03
Chin
aSt
atus
Rep
ort 2
021
ICAP
112
Flexibility
BANKING AND BORROWINGRules on banking and borrowing are not yet specified in the published policy documents. The system is expected to allow for banking but not for borrowing.
OFFSETS AND CREDITSThe National Measures allow for the use of China Certified Emissions Reduction (CCER) already from 2021 onwards: covered entities can use offsets for up to 5% of their verified emissions from CCER projects in renewable energy, carbon sinks, methane utilization, and others.
The CCER offset program was developed in China along-side the development of the regional ETS pilots. In 2012,
the NDRC issued the ‘Interim Measures for the Manage-ment of Voluntary GHG Emission Reduction Transactions’ (short form: Interim Measures), which provide guidelines for the issuance of CCERs. Further details on the devel-opment of CCER projects and the acceptance of CCERs in the national ETS are expected to be regulated through a revision of the Interim Measures and/or through the devel-opment of an ‘Administration Measure of Offset Scheme for National ETS.’
MARKET STABILITY PROVISIONSAdjustment mechanisms to prevent abnormal price fluctua-tions, as well as risk prevention and control mechanisms to prevent market manipulations, are under development.
Compliance
COMPLIANCE PERIODOne year (1 January to 31 December). Nevertheless, entities are expected to surrender allowances in 2021 for the years 2019 and 2020.
MRV REPORTING FREQUENCY: Under the national ETS, covered entities submit the previous year’s emission reports by the end of March each year. Entities in the power sector have had MRV obligations since 2013.
VERIFICATION: Provincial-level ecological and environ-mental authorities will organize the verification of GHG reports. They may commission technical service agencies to provide verification services.
The draft verification guidelines outline a six-step verifica-tion process and indicate a strong reliance on document review such that on-site verification in many cases would be deemed unnecessary. The verification entities could be the ecological and environmental units at provincial and subprovincial levels, government-affiliated institutions, and other technical service institutions selected (and paid) by the government.
FRAMEWORK: MRV guidelines, supplementary data sheets, verification guidelines, and other guidance are available for the eight sectors expected to be covered by the ETS. This
MRV framework has evolved continuously since 2013. In 2020, updated technical guidelines on emissions accounting, reporting, and verification were released for public consulta-tion and are yet to be finalized.
OTHER: The MEE will further improve the existing MRV guide-lines and technical specifications for the national ETS, based on the practice.
ENFORCEMENTAccording to the current Allocation Plan, compliance obli-gations are limited. Gas-fired plants only need to surrender allowances up to their level of free allocation as per the benchmarks. The compliance obligation of other covered entities is limited to the level of free allocation as per benchmarks, plus 20% of their verified emissions. This means that no allowances must be surrendered for verified emissions above this threshold. These measures aim to promote gas-fired units and reduce the overall compliance burden.
The National Measures define that failures in reporting are subject to a fine of CNY 10,000 to 30,000 (USD 1,449 to 4,347), while failures in compliance obligations are subject to a fine of CNY 20,000 to 30,000 (USD 2,898 to 4,347). Any gap between the (limited) compliance obligation and allow-ances surrendered also will be deducted from the following year’s allocation.
← CONTENT

FACT
SHEE
TS –
03
Chin
aSt
atus
Rep
ort 2
021
ICAP
113
4 – https://www.ndrc.gov.cn/xxgk/zcfb/ghxwj/201712/W020190905495689305648.pdf5 – http://www.gov.cn/xinwen/2016-01/22/content_5035432.htm6 – http://extwprlegs1.fao.org/docs/pdf/chn163081.pdf7 – http://www.gov.cn/zwgk/2013-11/04/content_2520743.htm8 – http://www.ncsc.org.cn/SY/tpfqjy/202003/t20200319_769745.shtml9 – http://www.ncsc.org.cn/SY/tpfqjy/202003/t20200319_769747.shtml10 – http://www.mee.gov.cn/xxgk2018/xxgk/xxgk02/202101/t20210105_816131.html11 – https://www.mee.gov.cn/xxgk2018/xxgk/xxgk06/202011/t20201102_805822.html12 – http://www.cet.net.cn/html/zl/bg/2020/1116/482.html13 – https://www.mee.gov.cn/xxgk2018/xxgk/xxgk03/202012/t20201230_815546.html14 – https://chinaenergyportal.org/en/implementation-plan-for-the-2019-2020-national-carbon-emission-trading-quota-setting-and-allocation-power-generation-industry/15 – http://www.mee.gov.cn/xxgk2018/xxgk/xxgk06/202011/t20201120_809087.html16 – http://www.cet.net.cn/html/zl/bg/2020/1125/483.html17 – http://www.mee.gov.cn/xxgk2018/xxgk/xxgk06/202012/t20201203_811443.html18 – https://www.mee.gov.cn/xxgk2018/xxgk/xxgk06/202012/t20201216_813413.html
Other Information
INSTITUTIONS INVOLVEDThe China national ETS has a multi-level governance struc-ture involving three levels of government: • the MEE acts as the national competent authority setting
the rules and overseeing the system, with joint oversight of trading activities with other national regulators;
• the MEE subsidiaries at the provincial level oversee the implementation of these rules; and
• the municipal-level authorities take on some manage-ment duties locally.
IMPLEMENTING LEGISLATIONWork Plan for Construction of the National Emissions Trading System (Power Sector)4
Notice on Key Works in Preparation for the Launch of the National ETS5
Interim Administrative Measures on Emissions Trading (2014)6
24 Guidelines for GHG Monitoring and Reporting for various sectors (20137, 20148, and 20159)The National Measures for the Administration of Carbon Emission Trading (Trial), final10 The National Measures for the Administration of Carbon Emission Trading (Trial), draft for comments11 (English trans-lation)12
Allocation Plan for the Power Sector (2019–2020) and list of covered entities, final13 (English translation)14
Allocation Plan for the Power Sector (2019–2020), draft for comments released in November 202015 (English translation)16 Guidelines on enterprises greenhouse gas emissions accounting and reporting − Power generation facilities, draft for comments17
Guidelines for Enterprises Greenhouse Gas Verification (Trial), draft for comments18
← CONTENT

FACT
SHEE
TS –
03
ChO
nGQ
inG
Stat
us R
epor
t 202
1IC
AP
114
CHONGQINGChongqing Pilot Emissions Trading System
CAP97 MtCO2e (2018)
GASES Several gases
OFFSETS AND CREDITSdomestic
ALLOCATIONFree allocation: Grandparenting
AVERAGE 2020 PRICECnY 26.38 (USd 3.82)
POWER
INDUSTRY
The only Chinese pilot to cover non-CO2 gases
Annual cap reduction rate
Allocation based on entities’ self-reported demand and historical highest emissions
In force
Under development
Under consideration
SECTORS: ETS DESCRIPTIONChongqing launched its pilot ETS in June 2014; to date, it has concluded five compliance years.1 The system covers enter-prises from seven sectors: power, electrolytic aluminum, ferroalloys, calcium carbide, cement, caustic soda, and iron and steel. The 180 enterprises covered by the system accounted for ~62% of the city’s total emissions in 2018. Among the eight Chinese pilots, the Chongqing ETS is the only one that covers non-CO2 gases.
One unique feature of the Chongqing Pilot ETS as compared to other Chinese pilot programs is that it has a clear path for cap-setting, in which an annual reduction rate is set and applied to the base-year emission level (i.e., the sum of each covered entity’s highest annual emission of the year from 2008 to 2012). From 2013 to 2015, the annual reduction rate was 4.13% and afterwards 4.85%. The Chongqing Pilot ETS suffered from low liquidity in past years due to a relatively loose cap in its early years.
2019 saw the completion of the transition of ETS-related responsibilities in Chongqing from the Development and Reform Commission (DRC) to the Ecology and Environment Bureau (EEB).
YEAR IN REVIEWIn April 2020, the Chongqing EEB released a notice on its ETS work for compliance year 2019, with a list of covered entities attached. The latest publicly available allocation plan dates from 2019 and is for the compliance year 2018.
The Chongqing allocation plan differed from those of other Chinese pilots in that allowances were allocated based on entities’ self-reported demand. Adjustment is made when an individual entity’s self-reported demand level exceeds its highest historical annual emissions (2008–2012), by using the average of the two numbers. In addition, if the sum of the allocation for all the entities exceeds the top-down cap, a reduction factor is applied across the board.
Following 2017, 2018 was the second year since the launch of the pilot where the cap (97 MtCO2e) was lower than the sum of the allocation based on self-declared demanded amount (106 MtCO2e); hence, downward adjustment to entities’ allo-cation was made, indicating a potential allowance shortage for some companies in the market. However, 2018 saw rela-tively low liquidity of the Chongqing carbon market because some market investors released their holdings and increased the market supply. Since then, no detailed allocation plan has been publicly released.
Background Information
GHG REDUCTION TARGETS BY 2020: 19.5% reduction in carbon intensity compared to 2015 levels (13th Five-Year Plan)
1 – The 2018 compliance cycle is the latest to have been completed. 2019 compliance is expected to be completed in the first half of 2021.
OVERALL GHG EMISSIONS (excluding LULUCF) ~156.0 MtCO2e (2018)
← CONTENT

FACT
SHEE
TS –
03
ChO
nGQ
inG
Stat
us R
epor
t 202
1IC
AP
1152 – In the short term, the existing Chinese regional carbon markets are expected to operate in parallel to the Chinese national carbon market. Over the medium to long term, they are expected to be integrated into the national market, once it is fully operational.
ETS Size
COVERED EMISSIONS
GHGs COVEREDCO2, CH4, N2O, HFCs, PFCs, SF6
SECTORS AND THRESHOLDSPower, electrolytic aluminum, ferroalloys, calcium carbide, cement, caustic soda, and iron and steel.
INCLUSION THRESHOLDS: 20,000 tCO2/year or energy consumption of 10,000 tonnes of coal equivalent (tce)/year.
POINT OF REGULATIONDownstream
Both direct and indirect emissions from electricity and heat consumption are covered.
NUMBER OF ENTITIES180 (2018 and 2019)
CAP 97 MtCO2e (2018)
From 2013 to 2015, the annual reduction rate of the cap was 4.13%. From 2016 onwards, it was revised to 4.85%.
Phases & Allocation
TRADING PERIODS2013 and ongoing2
ALLOCATIONFREE ALLOCATION: Free allocation through grandparenting based on historical emissions (highest number in period 2008–2012). Regulated entities submit their allowance allo-
cation demand on a yearly basis, forming the basis of their free allocation. This value is adjusted if it exceeds the highest historical annual emissions (2008–2012) of the respective entities, by using the average of the two numbers. In addi-tion, if the sum of the allocation for all the entities exceeds the top-down cap (see “Cap” section), a reduction factor is applied to all the covered entities.
Flexibility
BANKING AND BORROWING Banking is allowed.
Borrowing is not allowed.
OFFSETS AND CREDITSQUANTITATIVE LIMIT: Domestic project-based carbon offset credits—CCERs—are allowed up to 8% of the compliance obligation.
QUALITATIVE LIMIT: Reductions must be achieved after 2010 with the exception of carbon sink projects. Credits from hydro projects are not allowed.
MARKET STABILITY PROVISIONS EXCHANGE INTERVENTION: Depending on transaction types, if prices vary more than 10% or 30% in one day, the Chongqing Carbon Emissions Exchange can institute price stabilization measures, such as temporarily suspending trading or imposing a holding limit.
SALE AND TRADE LIMITS: Compliance entities must not sell more than 50% of their annual free allocation.
Compliance
COMPLIANCE PERIODOne year (1 January to 31 December): the exact date for the covered entities to surrender allowances is set by the govern-ment on an annual basis and varies across years.
MRV REPORTING FREQUENCY: Annual reporting of GHG emissions.
VERIFICATION: Third-party verification is required.
62%
← CONTENT

FACT
SHEE
TS –
03
ChO
nGQ
inG
Stat
us R
epor
t 202
1IC
AP
116
FRAMEWORK: The Chongqing DRC released a guiding docu-ment for monitoring and reporting that includes methods for different emissions sources, including combustion, industrial processes, and electricity consumption.
ENFORCEMENTThere are no financial penalties for noncompliance. Nonfinancial penalties may include public reporting, disqual-ification from energy saving and climate subsidies and asso-ciated awards for three years, and a record entered in the State-Owned Enterprise performance assessment system.
Other Information
INSTITUTIONS INVOLVEDChongqing Ecology and Environment Bureau (competent authority)Chongqing Carbon Emissions Trading Center (trading plat-form and registry)
IMPLEMENTING LEGISLATIONInterim Measures for Management of Emissions Trading In Chongqing3 Chongqing Allowance Allocation Management Rules4 Chongqing EEB Notice on Carrying out ETS Work for Compli-ance Year 20195
3 – http://www.tanpaifang.com/tanjiaoyisuo/2014/0504/31858.html 4 – http://www.tanpaifang.com/tanjiaoyi/2014/0530/32965.html 5 – http://sthjj.cq.gov.cn/zwgk_249/fdzdgknr/zdmsxx/hjgl/ydqhbh/202004/t20200414_7047139.html
← CONTENT

FACT
SHEE
TS –
03
FUJi
anSt
atus
Rep
ort 2
021
ICAP
1171 – Fujian pilot has held only one auction, in 2016, which provided 50,000 tonnes allowances, with a floor price of CNY 25 (USD 3.62) per tonne. Nevertheless, the exchange did not disclose the final volume and price. The calculation here assumes that all allowances were sold at the floor price.
FUJIANFujian Pilot Emissions Trading System
CAP~220 MtCO2 (2019)
GASES CO2 only
OFFSETS AND CREDITSdomesticprovincial
ALLOCATIONFree allocation: Grandparenting Free allocation: Benchmarkingauctioning
AVERAGE 2020 PRICECnY 17.24 (USd 2.50)
TOTAL REVENUECnY 1.25 million (USd 0.18 million)1 since beginning of program
SECTORS:
In force
Under development
Under consideration
POWER
INDUSTRY
DOMESTIC AVIATION
Regional Chinese ETS not belonging to seven pilots originally assigned by NDRC
Focus on carbon sinks and forestry in ETS, with own provincial offsets developed
ETS DESCRIPTIONThe province of Fujian launched its ETS in September 2016; it is the eighth regional pilot ETS in China. To date, it has completed four compliance years, achieving 100% compli-ance except in the first year. Unlike other Chinese pilots, which were mandated jointly by the National Development and Reform Commission (NDRC), the mandate for the Fujian ETS came from the State Council with the endorsement of the ‘National Ecological Civilization Pilot Area (Fujian) Implemen-tation Plan.’ The NDRC approved the Haixia Equity Exchange in Fujian as one of nine trading platforms for trading Chinese Certified Emission Reductions (CCERs), demonstrating NDRC’s recognition of the regional market.
The system covers nine sectors: electricity, petrochemical, chemical, building materials, iron and steel, nonferrous metals, paper, aviation, and ceramics. Given the prominence of the forestry sector in Fujian, its ETS pilot has a special focus on carbon sinks. In 2017, the Fujian government outlined a plan to promote forestry offsets projects in the province. By 2020, the selected counties in the province are required to develop forestry projects covering two million acres of forests, achieving an expected one million tonnes of emis-sion reductions annually.
In early 2019, the ETS-related responsibilities in Fujian completed the transition from the Fujian DRC to the Fujian Provincial Department of Ecology and Environment (DEE), as a result of the governance restructuring across China.
YEAR IN REVIEWIn August 2020, the Fujian government amended the ‘Interim Measures for the Administration of Carbon Emissions Trading in Fujian Province,’ fine-tuning its reporting, verification, and market oversight system.
As a province dedicated to promoting its forestry-based offsets, by the end of October 2020 the Fujian ETS had traded 2.6 million tonnes of forestry offset credits, with a total turn-over of over CNY 38 million (USD 5.5 million), overachieving the province’s target of forestry offsets set in 2017.
The Fujian ETS finished its compliance work for 2019 at the end of October 2020, reporting a 100% compliance rate for its 269 covered entities from nine sectors.
The latest publicly available detailed allocation plan, which dates from 2019, covers two years: 2018 and 2019. This plan was released by the Fujian DEE in June 2019. Almost 50% of the regulated entities are architectural ceramics companies. Since then, no detailed allocation plan has been released publicly.
In late November 2020, Fujian published a notice on the pre-allocation of carbon emission allowances for the 2020 compliance year. The notice specifies that 269 covered entities are covered under the Fujian ETS. Following the allocation rules (see “Allocation” section), the entities receive 70% of the number of allowances based on their 2019 production data as pre-allocated allowances for 2020. The actual production data is then used to update alloca-tion ex-post.
According to the Chinese national ETS rules, regional markets that have already allocated allowances for 2019 and/or 2020 for the power sector will remain under the regional system for those years. This implies that the power sector entities that are overlapping between Fujian and the national ETS will be covered under the regional carbon market in 2020 and moved to the national one from 2021 onwards.
Background Information
GHG REDUCTION TARGETS BY 2020: 19.5% reduction in carbon intensity compared to 2015 levels
OVERALL GHG EMISSIONS (excl. LULUCF) 240.0 MtCO2e (2014)
← CONTENT

FACT
SHEE
TS –
03
FUJi
anSt
atus
Rep
ort 2
021
ICAP
118
ETS Size
COVERED EMISSIONS
GHGs COVEREDCO2
SECTORS AND THRESHOLDSElectricity, petrochemical, chemical, building materials, iron and steel, nonferrous metals, paper, aviation, and ceramics.
INCLUSION THRESHOLDS: Energy consumption 10,000 tonnes of coal equivalent (tce)/year for any year between 2013 and 2016.
In the future, the Fujian system may extend its coverage to smaller emitters, i.e., those with energy consumption of 5,000 tce or more.
POINT OF REGULATIONDownstream
Both direct and indirect emissions from electricity and heat consumption are covered.
NUMBER OF ENTITIES255 (2018)269 (2019)269 (2020)
CAP~220 MtCO2 (2019)2
The cap includes three elements: existing entities’ allow-ances, new entrants reserve, and market stability reserve.
Phases & Allocation
TRADING PERIODS2016-ongoing3
ALLOCATION FREE ALLOCATION: Benchmarking is applied to the elec-tricity, cement, aluminum, and plate glass sectors.
The other sectors are allocated allowances based on histor-ical intensity. These entities can also apply for more allow-ances for early mitigation actions.
A pre-allocation method is adopted for the annual allowance allocation. At first, entities receive 70% of the allowances in a given year, which are calculated based on their production levels in the previous year (for example, 2019 pre-allocation is based on 2018 production data). Allocation is then adjusted
ex-post to reflect the actual production in the respective compliance year.
AUCTIONING: Auctioning may take place where considered appropriate by the ETS authorities (see “Market Stability Provisions” section) and may be introduced as a method for allowance allocation over time; up to 10% of the total cap is reserved for market intervention.
In order to increase market liquidity and price discovery, the Fujian DRC organized a discriminatory (nonuniform price) auction of 50,000 allowances in 2016 from the government reserve, with the settlement prices ranging from CNY 26.50 (USD 3.84) to ~CNY 30 (USD 4.35). No further auctions have taken place to date.
Flexibility
BANKING AND BORROWINGBanking is allowed.
Borrowing is not allowed.
OFFSETS AND CREDITSQUANTITATIVE LIMIT: Domestic project-based carbon offset credits (CCERs) and Fujian Forestry Certified Emission Reduc-tion credits (FFCER) are allowed. The use of CCER credits is limited to 5% of the annual compliance obligation. The limit
is increased to 10% for companies that use both FFCER and CCER credits.
QUALITATIVE LIMIT: Eligible offsets are restricted to those generated in Fujian province, from CO2 or CH4 projects. Hydropower-related credits are not eligible. FFCER projects, with three project types (afforestation, forest management, and bamboo management) are eligible if implementation took place after 16 February 2005 and if the project devel-opers have independent legal personality.
~60%
2 – There is no public data on the total cap, or the number of its three elements. This number is based on an estimate developed by experts. 3 – In the short term, the existing Chinese regional carbon markets are expected to operate in parallel with the Chinese national carbon market. Over the medium to long term,
they are expected to be integrated into the national market, once it is fully operational.
← CONTENT

FACT
SHEE
TS –
03
FUJi
anSt
atus
Rep
ort 2
021
ICAP
119
4 – This is according to the ‘Interim Measures of the Fujian ETS.’ In practice, the provincial government releases executive notices to guide the timeline of the annual compliance circle.5 – http://fgw.fuzhou.gov.cn/zz/fgwzwgk/fg/201901/t20190108_2735580.htm6 – http://fjnews.fjsen.com/2020-09/15/content_30478231.htm7 – http://www.fj.msa.gov.cn/fjmsacms/cms/html/fjhsjwwwz/2020-10-21/1168696783.html8 – http://www.tanjiaoyi.com/article-27392-1.html
MARKET STABILITY PROVISIONS RESERVE: 10% of the total cap is kept as a government reserve for market stabilization.
INTERVENTION: According to the (trial) ‘Implementation Rules of Emissions Trading Market Management in Fujian Province,’ the Fujian Economic and Information Center under the guidance of the competent authority—in consultation with an advisory committee—can buy or sell allowances in
order to stabilize the market under certain conditions. These conditions include: market fluctuations (i.e., if the cumulative increase or decrease of allowance prices for ten consecutive trading days reaches a certain percentage); severe imbal-ances between supply and demand; or liquidity issues. More specifically, high prices may trigger allowance auctions from government reserves through the Haixia Equity Exchange. Low prices may trigger authorities to buy allowances from the market through governmental funds.
Compliance
COMPLIANCE PERIODOne year (1 January to 31 December): covered entities have until 30 June of the following year to surrender allowances.4
MRV REPORTING FREQUENCY: Annual reporting of CO2 emissions.
VERIFICATION: Third-party verification is required for all the annual emissions reports. In addition, further validation is carried out by government-assigned experts for ~30% of the reports to further enhance accuracy; this process is also called “fourth-party verification” in China.
FRAMEWORK: The Fujian DRC and the Fujian Statistical Bureau jointly released a guiding document on monitoring and reporting that includes a monitoring plan template, using national measuring and reporting guidelines. In addi-tion, the Fujian DRC and the Fujian Quality and Technical Supervision Bureau jointly released a measure for the admin-istration of third-party verifiers, which specifies criteria for the verifiers and their staff. Both documents are still valid.
ENFORCEMENTPenalties for failing to submit an emission or verification report on time, providing false information, or disturbing the verification process range from CNY 10,000 (USD 1,449) to CNY 30,000 (USD 4,347). Companies failing to surrender enough allowances to match their emissions are fined between one to three times the average market price of the past 12 months per allowance, with a maximum limit of CNY 30,000 (USD 4,347). Additionally, twice the amount of the missing allowances can be withdrawn from the account of the company or deducted from next year’s allocation. Penalties for the misconduct of trading entities and their staff, such as not publishing relevant trading information or leaking commercial secrets, could range from CNY 10,000 (USD 1,449) to CNY 30,000 (USD 4,347).
Other Information
INSTITUTIONS INVOLVED Fujian Provincial Department of Ecology and Environment (competent authority)Fujian Haixia Equity Exchange (trading platform)Fujian Economic and Information Center (registry, market management, and MRV administration)
IMPLEMENTING LEGISLATIONImplementation Plan of Emissions Trading Market Construc-tion in Fujian Province5 Interim Measures for the Management of Emissions Trading in Fujian Province6
2020 Amendments to the Interim Measures7 Fujian Provincial Department of Ecology and Environment–Allocation Plan for Vintage 2018 and 20198
← CONTENT
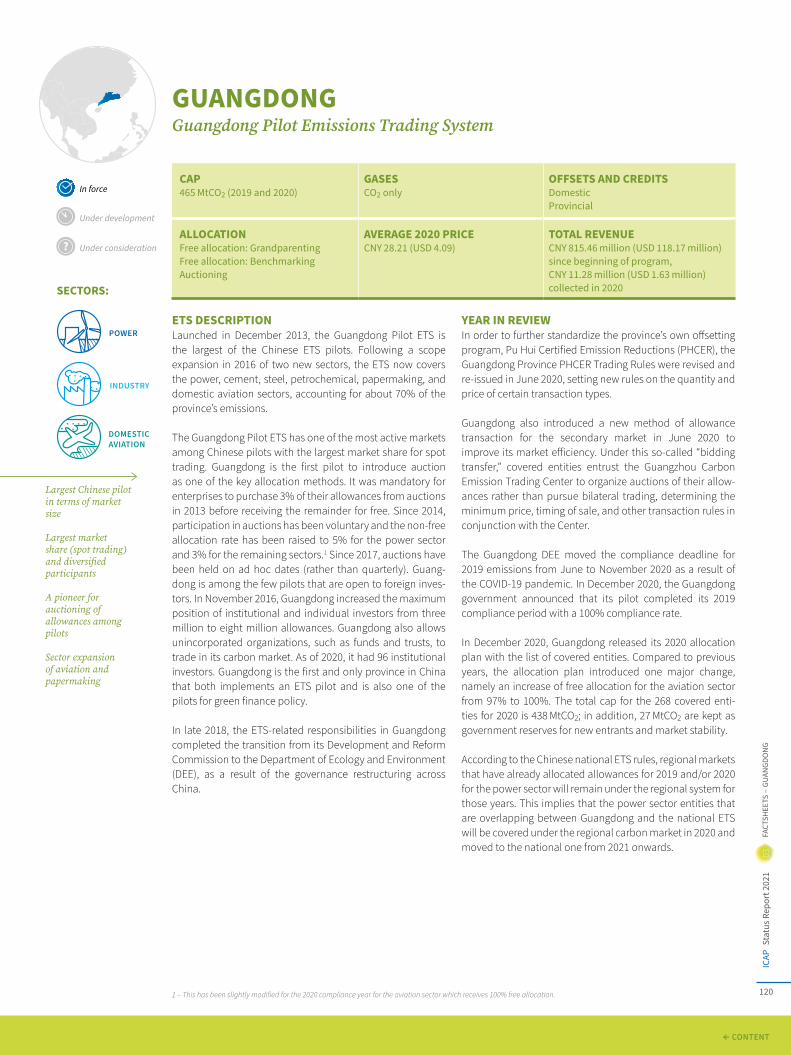
FACT
SHEE
TS –
03
GUan
GdO
nGSt
atus
Rep
ort 2
021
ICAP
120
GUANGDONGGuangdong Pilot Emissions Trading System
CAP465 MtCO2 (2019 and 2020)
GASES CO2 only
OFFSETS AND CREDITSdomestic provincial
ALLOCATIONFree allocation: GrandparentingFree allocation: Benchmarking auctioning
AVERAGE 2020 PRICECnY 28.21 (USd 4.09)
TOTAL REVENUECnY 815.46 million (USd 118.17 million) since beginning of program, CnY 11.28 million (USd 1.63 million) collected in 2020
ETS DESCRIPTIONLaunched in December 2013, the Guangdong Pilot ETS is the largest of the Chinese ETS pilots. Following a scope expansion in 2016 of two new sectors, the ETS now covers the power, cement, steel, petrochemical, papermaking, and domestic aviation sectors, accounting for about 70% of the province’s emissions.
The Guangdong Pilot ETS has one of the most active markets among Chinese pilots with the largest market share for spot trading. Guangdong is the first pilot to introduce auction as one of the key allocation methods. It was mandatory for enterprises to purchase 3% of their allowances from auctions in 2013 before receiving the remainder for free. Since 2014, participation in auctions has been voluntary and the non-free allocation rate has been raised to 5% for the power sector and 3% for the remaining sectors.1 Since 2017, auctions have been held on ad hoc dates (rather than quarterly). Guang-dong is among the few pilots that are open to foreign inves-tors. In November 2016, Guangdong increased the maximum position of institutional and individual investors from three million to eight million allowances. Guangdong also allows unincorporated organizations, such as funds and trusts, to trade in its carbon market. As of 2020, it had 96 institutional investors. Guangdong is the first and only province in China that both implements an ETS pilot and is also one of the pilots for green finance policy.
In late 2018, the ETS-related responsibilities in Guangdong completed the transition from its Development and Reform Commission to the Department of Ecology and Environment (DEE), as a result of the governance restructuring across China.
YEAR IN REVIEWIn order to further standardize the province’s own offsetting program, Pu Hui Certified Emission Reductions (PHCER), the Guangdong Province PHCER Trading Rules were revised and re-issued in June 2020, setting new rules on the quantity and price of certain transaction types.
Guangdong also introduced a new method of allowance transaction for the secondary market in June 2020 to improve its market efficiency. Under this so-called “bidding transfer,” covered entities entrust the Guangzhou Carbon Emission Trading Center to organize auctions of their allow-ances rather than pursue bilateral trading, determining the minimum price, timing of sale, and other transaction rules in conjunction with the Center.
The Guangdong DEE moved the compliance deadline for 2019 emissions from June to November 2020 as a result of the COVID-19 pandemic. In December 2020, the Guangdong government announced that its pilot completed its 2019 compliance period with a 100% compliance rate.
In December 2020, Guangdong released its 2020 allocation plan with the list of covered entities. Compared to previous years, the allocation plan introduced one major change, namely an increase of free allocation for the aviation sector from 97% to 100%. The total cap for the 268 covered enti-ties for 2020 is 438 MtCO2; in addition, 27 MtCO2 are kept as government reserves for new entrants and market stability.
According to the Chinese national ETS rules, regional markets that have already allocated allowances for 2019 and/or 2020 for the power sector will remain under the regional system for those years. This implies that the power sector entities that are overlapping between Guangdong and the national ETS will be covered under the regional carbon market in 2020 and moved to the national one from 2021 onwards.
1 – This has been slightly modified for the 2020 compliance year for the aviation sector which receives 100% free allocation.
DOMESTIC AVIATION
In force
Under development
Under consideration
POWER
INDUSTRY
SECTORS:
Largest Chinese pilot in terms of market size
Largest market share (spot trading) and diversified participants
A pioneer for auctioning of allowances among pilots
Sector expansion of aviation and papermaking
← CONTENT

FACT
SHEE
TS –
03
GUan
GdO
nGSt
atus
Rep
ort 2
021
ICAP
121
Background Information
GHG REDUCTION TARGETSBY 2020: 20.5% reduction in carbon intensity compared to 2015 levels (Guangdong Province Work Plan for Controlling Greenhouse Gas Emission During the 13th Five-Year Plan Period)
BY 2030: CO2 peaking sometime before 2030 (Guangdong Province Work Plan for Controlling Greenhouse Gas Emis-sion During the 13th Five-Year Plan Period). Some cities in the province, such as Guangzhou, have set the target of reaching or approaching the peak by as early as 2020 (Outline of Guang-zhou Ecological Civilization Construction Plan 2016–2020)
ETS Size
COVERED EMISSIONS
GHGs COVEREDCO2 only
SECTORS AND THRESHOLDSPower, iron and steel, cement, papermaking, aviation, and petrochemicals.
INCLUSION THRESHOLDS: 20,000 tCO2/year or energy consumption 10,000 tonnes of coal equivalent (tce)/year.
POINT OF REGULATIONDownstream
Both direct and indirect emissions from electricity and heat consumption are covered.2
NUMBER OF ENTITIES242 existing entities, 37 new entrants (2019) 245 existing entities, 23 new entrants (2020)
CAP465 MtCO2, of which 27 MtCO2 are kept as government reserves for new entrants and market stability (2019 and 2020)
Phases & Allocation
TRADING PERIODS2013 and ongoing3
ALLOCATION FREE ALLOCATION: Mainly free allocation through grandpar-enting based on historical emissions or emissions intensity, or benchmarking.
Benchmarking is applied to coal- and gas-fired electricity generators (including heating, and combined heat and power), as well as to some industrial processes in the avia-tion, cement, paper, and steel sectors.
Grandparenting on the basis of historical emissions is applied to some processes in the cement and steel indus-tries and the whole petrochemical industry. Grandparenting on the basis of historical emissions intensity is applied to the power industry using special fuel generating units and heating boilers, other powder products in cement industry, captive power plants in the steel industry, special paper and paper product manufacturers, enterprises with pulp manu-facturing, and other aviation enterprises.
Ex-post adjustments based on real production data of the respective compliance year are also applied for those sectors that use benchmarks and emissions intensity methods.
Compared to previous years, the 2020 allocation plan has one major change, namely an increase of free allocation for the aviation sector from 97% to 100%.
AUCTIONING: Guangdong auctions a small share of allow-ances as a form of allowance allocation. During the first compliance year (2013), entities were required to purchase allowances in auctions in order to become eligible to receive their freely allocated allowances. This requirement was terminated in 2014. Since 2014, free allocation percentages remain the same, i.e., 95% for the power sector and 97% for the remaining sectors (for 2020, the aviation sector received 100% free allocation). Quarterly auctions were held until 2016; since 2017, they have been held on an ad hoc basis. Auctions are also subject to a reserve price (see “Market Stability Provisions” section). No auctions took place in 2018 or 2019.
2 – The electricity market in Guangdong has undergone some changes following the national power sector reform process. Guangdong’s electricity spot market was officially launched at the end of 2018, and it was planned that in two years, the electricity trading volume in the market would account for no less than 60% of the power generation in Guangdong province. There is no publicly available data on this yet.
3 – In the short term, the existing Chinese regional carbon markets are expected to operate in parallel with the national Chinese carbon market. Over the medium to long term, they are expected to be integrated into the national market once it is fully operational.
OVERALL GHG EMISSIONS (excluding LULUCF) 610.5 MtCO2e (2012)
~70%
← CONTENT

FACT
SHEE
TS –
03
GUan
GdO
nGSt
atus
Rep
ort 2
021
ICAP
122
The allowance volume available for auction was adjusted from two million allowances (as had been the case until year 2018) to five million allowances from 2019 onwards.
One auction took place in April 2020 with a floor price of CNY 25.84 per tCO2e (USD 3.74), selling 400,000 allowances at the price of CNY 28.2 (USD 4.09).
Flexibility
BANKING AND BORROWINGBanking is allowed.
Borrowing is not allowed.
OFFSETS AND CREDITSQUANTITATIVE LIMIT: The use of offsets is limited to 10% of covered entities’ annual emissions. Chinese Certified Emis-sions Reductions (CCERs) are allowed. As a mechanism that encourages the public to reduce carbon emissions, Pu Hui Certified Emission Reductions (PHCER) are also allowed since compliance year 2017. In addition to the quantitative limit applied to individual entities, Guangdong sets an upper limit to the total volume of offsets allowed. In 2019, enti-ties were allowed to use up to 1.5 million offsets (CCER and PHCER) towards compliance obligations, with the priority given to the province’s CCERs and PHCERs first; then, other offsets will be allowed in accordance with the order of enter-prises’ written applications until this limit is reached. The number for 2020 has not yet been announced.
QUALITATIVE LIMIT: At least 70% of offsets used by each regulated entity must come from within Guangdong prov-ince. This rate is adjusted to 60% if offsets are generated in certain priority regions within Guangdong, as identified by the government (e.g., poor and ethnic minority group areas). Pre-CDM credits are not eligible. Credits from hydro and from most fossil fuel projects are also not eligible. Credits gener-ated in other Chinese ETS pilot regions are not eligible. To be eligible, projects must relate primarily (i.e., more than 50%) to the reduction of CO2 and CH4 emissions.
MARKET STABILITY PROVISIONS RESERVES: 5% of allowances are set aside for government reserves for new entrants and market stability. The specific rules for market stability are provided by its ‘Trial Measures for ETS.’4
AUCTION RESERVE PRICE: Auctions under the Guangdong Pilot ETS are subject to an auction reserve price. Initially in 2013, the reserve price was set at CNY 60 (USD 8.69), and it was lowered to CNY 25 (USD 3.62) and increased to CNY 40 (USD 5.80) in steps of CNY 5 (USD 0.72) with each quarterly auction in 2014. In 2015, a so-called “policy reserve price” was set as an effective reserve price, which links the auction reserve price with the secondary market price. The reserve price was set at 80% of the weighted average price for allow-ances over the previous three months in 2015. In 2016, the policy reserve price was set at 100% of the weighted average price for allowances over the previous three months. The policy reserve prices for the four auctions for the 2016 compliance period were as follows: CNY 9.37 (USD 1.36), CNY 11.27 (USD 1.63), CNY 16.09 (USD 2.33), and CNY 15.15 (USD 2.20). When auctions were resumed in April 2020 for the compliance year 2019, the policy reserve price was set at 90% of the weighted average price for allowances over the previous three months considering the COVID impact.
OFFSET AUCTIONS: Guangdong introduced auctioning for PHCERs in addition to the existing secondary market trading modes, with an auction reserve price set by the Emissions Exchange Guangzhou and offset project developers. In the latest two auctions of PHCERs in 2020 (28 December 2020), the reserve price for one offset project was set at CNY 22.25/tonne (USD 3.22) (80% of the weighted average price for allowances over the previous three months). The offered 52,355 tonnes offsets were sold at the price of CNY 35.3/tonne (USD 5.12). For the other one, the reserve price was set as CNY 33/tonne (USD 4.78), with all the 9,789 tonnes offered being sold at the price of CNY 36.06/tonne (USD 5.23).
Compliance
COMPLIANCE PERIODOne year (1 January to 31 December): covered entities have until 20 June of the following year to surrender allowances.5
MRV REPORTING FREQUENCY: Annual reporting of CO2 emissions.
VERIFICATION: Third-party verification is required. In addi-tion, further validation was initially carried out by govern-ment-assigned expert groups in the first three compliance years. Onsite cross reverifications were conducted for the entities with questionable verification reports, as well as for
4 – The auctioning ratio might be adjusted in the future, but no concrete plan is available yet.5 – The 2020 compliance deadline was postponed due to the COVID-19 pandemic.
← CONTENT

FACT
SHEE
TS –
03
GUan
GdO
nGSt
atus
Rep
ort 2
021
ICAP
123
6 – http://www.gd.gov.cn/gkmlpt/content/0/141/post_141049.html#77 – http://www.gd.gov.cn/zwgk/wjk/zcfgk/content/post_2524340.html8 – http://www.cnemission.cn/article/zcfg/201911/20191100001804.shtml9 – http://www.cnemission.com/article/zcfg/202012/20201200002034.shtml
randomly selected entities. A so-called “fourth-party inde-pendent evaluation system” has been in place since the 2016 compliance period. The “technical evaluation organizations” selected by the government carry out technical review and evaluation of the annual emissions reports and verification reports and undertake further onsite review and random inspection tasks. These technical evaluation agencies do not undertake regular third-party verification tasks.
FRAMEWORK: The Department of Ecology and Environment of Guangdong has released guidelines for monitoring and reporting for the compliance and reporting sectors.
OTHER: Industrial enterprises with annual carbon emissions of more than 5,000 tonnes and less than 10,000 tonnes are required to report their emissions. Verification is not required.
ENFORCEMENTPenalties for failing to submit emissions or verification reports on time range from CNY 10,000 (USD 1,449) to CNY 50,000 (USD 7,246). Furthermore, companies failing to surrender enough allowances to match their emissions will be deducted twice the amount of allowances from the following year’s allocation and are fined CNY 50,000 (USD 7,246). Other nonfinancial penalties include negative impacts on access to bank loans and subsidy programs.
Other Information
INSTITUTIONS INVOLVEDGuangdong Ecology and Environment Bureau (competent authority)China Emissions Exchange (Guangzhou) (trading platform) Guangdong Research Center for Climate Change (registry)
USE OF REVENUESGuangdong has been exploring the establishment of a Low Carbon Development Fund that would use auction revenues to promote further mitigation actions, carbon finance, and low-carbon industrial development. However, due to the change of the pilot’s competent authority, further informa-tion regarding this measure has not yet been released.
IMPLEMENTING LEGISLATIONGuangdong Pilot ETS Implementation Plan6 Trial Measures for Carbon Emissions Trading in Guangdong7 Department of Ecology and Environment of Guangdong—Allocation Plan for Vintage 20198 (including list of covered entities)Department of Ecology and Environment of Guangdong—Allocation Plan for Vintage 20209 (including list of covered entities)
← CONTENT

FACT
SHEE
TS –
03
hUBE
iSt
atus
Rep
ort 2
021
ICAP
124
HUBEIHubei Pilot Emissions Trading System
In force
Under development
Under consideration
POWER
INDUSTRY
SECTORS:
CAP270 MtCO2 (2019)
GASES CO2 only
OFFSETS AND CREDITSdomestic
ALLOCATIONFree allocation: GrandparentingFree allocation: Benchmarking auctioning
AVERAGE 2020 PRICECnY 27.21 (USd 3.94)
TOTAL REVENUECnY 212 million (USd 30.7 million) since beginning of program, CnY 49.32 million (USd 7.15 million) collected in 2020
Largest market share (spot and spot forward) among pilots and diversified participants
Market stability reserve in place; government can intervene in cases of low or high prices
Lowered inclusion threshold
Leading in the development of a national ETS registry
ETS DESCRIPTIONLaunched in April 2014, the Hubei Pilot ETS has since concluded six compliance years. Hubei has been one of the most active regional markets in China in terms of trading and has the second-largest market size in terms of spot trading volume, after Guangdong. It is also one of the regional pioneers for allowance spot forward trading in China.1 When spot forward trading is also considered, Hubei has the largest market share as of end 2020, with its total secondary market transaction volume of 347 million tonnes and value of CNY 8.13 billion (USD 1.18 billion). The system initially covered 138 of the most carbon-intensive companies in the province, accounting for ~35% of the province’s total carbon emissions.
Hubei has expanded its scope several times. In 2016, it lowered the thresholds of seven sectors from 60,000 to 10,000 tonnes of coal equivalent (tce). In 2017, it further lowered the thresholds of all the other sectors to 10,000 tce. In 2018, the water supply sector was added. As of 2020, the system covers more than 370 entities which accounts for ~42% of the province’s carbon emissions.
A government reserve with 8% of the total cap is available for market stabilization, and the government can also inter-vene in cases of market fluctuations, severe supply-demand imbalances, or for liquidity reasons. The Hubei ETS pilot is open to diversified market participants, including covered entities as well as institutional and individual (domestic and foreign) investors.
According to the compliance notice by the Hubei Devel-opment and Reform Commission (DRC) in July 2017, the Hubei Pilot ETS will continue to run after the national ETS commences. The transition of Hubei allowances into the
national ETS will be based on rules to be defined by the national competent authority.
In December 2017, Hubei was selected to lead the develop-ment of the registry for the national ETS.
In early 2019, the ETS-related responsibilities in Hubei completed the transition from DRC to the Department of Ecology and Environment (DEE) of Hubei, as a result of the governance restructuring across China.
YEAR IN REVIEWThe Hubei DEE released the 2019 allocation plan in August 2020. Key changes compared to the previous year’s plan include: a cap increase of 14 million tonnes to reach 270 million tonnes; a decline in the market adjustment factor, which is a factor applied to all covered entities to reduce overall allocation; and updating of the base year from 2015 –2017 to 2016–2018. In this plan, Hubei also clarifies how it plans to coordinate its ETS with the upcoming national ETS. According to the plan, if the national ETS had implemented 2019 compliance work, the overlapping companies would have no longer participated in Hubei’s compliance and the regional government would have withdrawn the corre-sponding allowances issued. This cutoff date of September 2019 did not see the operationalization of the national ETS; hence, these entities were covered under the Hubei ETS for compliance year 2019.
The Hubei DEE moved the compliance deadline for 2019 emissions from May to December 2020 as a result of the COVID-19 pandemic. In December 2020, the Hubei pilot completed its 2019 compliance period with a 100% compli-ance rate.
Background Information
BY 2020: 19.5% reduction in carbon intensity compared to 2015 levels (13th Five-Year Plan)
1 – China is still in the exploratory and research stage of carbon futures trading, and according to the “Administrative Regulations on Futures Trading” document, futures can only be traded on approved professional futures exchanges. Therefore, regional ETS pilots cannot introduce futures trading; however, a few of them have developed carbon forward trading products with their own characteristics.
OVERALL GHG EMISSIONS (excluding LULUCF) 463.1 MtCO2e (2012)
← CONTENT

FACT
SHEE
TS –
03
hUBE
iSt
atus
Rep
ort 2
021
ICAP
125
2 – Different from other Chinese pilots, Hubei does not pre-define which sectors are covered under its ETS; rather, it sets a threshold which applies to all power and industrial sectors. Those sectors with entities above the threshold then are covered.
3 – In the short term, the existing Chinese regional carbon markets are expected to operate parallel to the national Chinese carbon market. Over the medium to long term, they are expected to be integrated into the national market, once it is fully operational.
4 – In this case, entities first receive half of the total allowance based on the previous year’s actual emission data or historical emission baseline; the actual production data are then used to update allocation ex-post.
ETS Size
COVERED EMISSIONS
GHGs COVEREDCO2 only
SECTORS AND THRESHOLDS16 sectors:2 power and heat supply, iron and steel, nonfer-rous metals, petrochemicals, chemicals, textile, cement, glass and other building materials, pulp and paper, ceramics, automobile and equipment manufacturing, food, beverage, and medicine producers, and water supply.
INCLUSION THRESHOLDS: Until 2015: Annual energy consumption more than 60,000 tce in any year between 2010 and 2011, applying to all energy and industrial sectors.
From 2016 onwards: Annual energy consumption more than 10,000 tce in any year between 2016 and 2018, applying to all energy and industrial sectors.
POINT OF REGULATIONDownstream
Both direct and indirect emissions from electricity and heat consumption are covered.
NUMBER OF ENTITIES373 (2019) CAP270 MtCO2 (2019), which includes reserves for new entrants and market stability.
Phases & Allocation
TRADING PERIODS2014 and ongoing3
ALLOCATIONFREE ALLOCATION, BENCHMARKING: Free allocation of 2019 vintage allowances through benchmarks for power and cement (except for entities using outsourced clinker).
FREE ALLOCATION, GRANDPARENTING: Historical emissions intensity for heat, co-generation, glass and other building materials, some of the equipment manufacturing, and the pulp and papers sectors; grandparenting based on previous three years’ historic emissions for all other sectors.
Ex-post allocation adjustments are applied, especially for those sectors that use benchmarks and emissions intensity.4
Hubei also introduces the so-called market adjustment factor, a factor that is applied to all covered entities to reduce overall allocation. It is determined based on the previous year’s market stock of the Hubei carbon market, while taking the province’s overall economic development and the achievement of its climate mitigation targets and strategies into consideration. For the 2019 compliance year, it was set at 0.9723.
AUCTIONING: A small share of the annual cap can be auctioned. The main purpose of auctions is to promote price discovery and provide regulated entities with additional
supply to meet their compliance demand. To date, auctions have been held on an ad hoc basis and happened only in 2014, 2019, and 2020. The first auction took place in 2014, with two million allowances sold at the floor price of CNY 20 (USD 2.90).
In November 2019, through two separate auctions, five million allowances were made available from the govern-ment reserve. The auctions operated with a reserve price set at the weighted spot market price from 30 October 2017 to 30 October 2019. The first auction was restricted to compli-ance entities. Two million allowances were offered with 1.49 million sold at an average price of CNY 24.65 (USD 3.57). Remaining allowances were made available to covered enti-ties as well as other market participants for a second auction. The total auction volume was 3.51 million tonnes, including 0.51 million that was left from the first auction. The average price was CNY 24.49 (USD 3.55).
Following an identical structure of two separate rounds of auctions targeting different types of entities, in December 2020 three million allowances were made available from the government reserve, with two-thirds dedicated to compli-ance entities only. The auctions operated with a reserve price set at CNY 27.56 (USD 3.99). 1.1 million and 671,000 tonnes were successfully auctioned respectively, with the average price of CNY 27.57 (USD 4.00).
~42%
← CONTENT

FACT
SHEE
TS –
03
hUBE
iSt
atus
Rep
ort 2
021
ICAP
126
Flexibility
BANKING AND BORROWING Banking is allowed, but only for allowances that were traded at least once.
Borrowing is not allowed.
OFFSETS AND CREDITSQUANTITATIVE LIMIT: The use of domestic project-based carbon offset credits (CCERs) is limited to 10% of the annual initial allocation for each entity.
QUALITATIVE LIMIT: CCERs must come from rural biogas or forestry projects in the key counties under the national or provincial poverty alleviation plan in urban agglomera-tion areas of the middle reaches of the Yangtze River (within Hubei). CCERs must have been generated between 1 January 2013 and 31 December 2015.
MARKET STABILITY PROVISIONS RESERVE: 8% of the total cap is kept as a government reserve for market stabilization.
INTERVENTION: In case of market fluctuations, severe imbal-ances between supply and demand, or liquidity issues, the Hubei EEB—in consultation with an advisory committee consisting of government institutions and other stake-holders—can buy or sell allowances in order to stabilize the market. Specifically, if the allowance price reaches a low or high point six times during a 20-day time span, the Hubei EEB takes action.
EXCHANGE: The exchange limits day-to-day price fluctua-tions to between -10% and +10% respectively.
Compliance
COMPLIANCE PERIODOne year (1 January to 31 December): covered entities have until the last working day of May of the following year to surrender allowances.5
MRV REPORTING FREQUENCY: Annual reporting of CO2 emissions.
VERIFICATION: Third-party verification is required. Third-party verifiers may be involved in mutual evaluation of each other’s verification reports. In addition, further validation is carried out by government-assigned experts to further enhance the accuracy; this process is also called “fourth-party verification” in China.
FRAMEWORK: The Hubei government has released general rules on monitoring and reporting guiding all the sectors as well as sector-specific guidance for the following 11 sectors: power, glass, aluminum, calcium carbide, pulp and paper, automobile manufacturing, iron and steel, ferroalloys, ammonia, cement, and petroleum processing. The nation-
al-level guidelines on MRV, especially for the sectors outside these 11 sectors, are also used as reference for Hubei.
ENFORCEMENTHubei has introduced a capped mechanism for the compli-ance obligations. If the difference between the annual veri-fied emissions and the allocated allowances of an entity exceeds either 20% of the allocation or 200,000 tonnes, the allowances will be added or deducted to cap the surplus or deficit within the 20%/200,000 tonnes limit.6
Penalties for failing to submit an emissions or verifica-tion report on time range from CNY 10,000 (USD 1,449) to CNY 30,000 (USD 4,347). Trade participants that manipulate the market face up to CNY 150,000 (USD 21,737) in fines. Furthermore, companies that fail to surrender enough allow-ances to match their emissions will be deducted twice the amount of allowances from next year’s allocation and are fined one to three times the average market price for every allowance, with a maximum limit of CNY 150,000 (USD 21,737).
Other Information
INSTITUTIONS INVOLVED Department of Ecology Environment of Hubei Province (competent authority)China Hubei Emission Exchange (trading platform and registry)
IMPLEMENTING LEGISLATIONHubei Pilot ETS Implementation Plan7 Interim Measures for Management of Emissions Trading in Hubei Province8 Department of Ecology Environment of Hubei Province- Allo-cation Plan for Vintage 2019 (including list of covered entities)9
5 – For the compliance year 2019, the deadline was postponed in 2020 due to the COVID-19 pandemic.6 – Two limits, as opposed to only one, are set based on the consideration that 20% may suit the smaller entities better while 200,000 tonnes may suit those that are larger. 7 – http://www.hbets.cn/index.php/index-view-aid-1075.html8 – http://www.hbets.cn/index.php/index-view-aid-1072.html 9 – http://www.yidianzixun.com/article/0QP8E8ng?s=&appid=
← CONTENT

FACT
SHEE
TS –
03
indO
nESi
aSt
atus
Rep
ort 2
021
ICAP
1271 – https://sipuu.setkab.go.id/PUUdoc/175354/PP%20Nomor%2046%20Tahun%202017.pdf2 – http://extwprlegs1.fao.org/docs/pdf/ins97643.pdf
INDONESIA
In force
Under development
Under consideration
MRV system in operation for industry and power sectors
Regulation to set a national framework for carbon pricing instruments being finalized
ETS pilot planned for power sector in 2021
ETS DESCRIPTIONIn 2017, Indonesia passed the ‘Government Regulation on Environmental Economic Instruments’ that provides a basis for ETS implementation. This regulation sets a mandate for an emissions and/or waste permit trading system to be implemented by 2024 (within seven years from its passage).
In 2018, Indonesia completed a study outlining the emissions profiles and marginal abatement cost curves of the power and industry sectors, in addition to completing the design and governance framework of an MRV system. The MRV guidelines for the power sector were released in mid-2018. Following this, an online GHG reporting platform for elec-tricity generators and a pilot MRV program for electricity generators in the Java-Madura-Bali grid (covering ~70% of Indonesia’s electricity demand) were launched in late 2018.
The Ministry of Industry has also developed an online GHG emissions reporting system for industries in Indonesia. Pilot MRV programs are being conducted in the cement and fertil-izer sectors.
A study completed in late 2018 examined four market-based instrument options: an ETS for the power and industry sectors; energy efficiency certificates for industry; a cap-and-tax system; and a carbon offset mechanism. Based on the study and stakeholder consultations, an ETS scenario was selected for further development.
A presidential regulation that will provide a national frame-work for carbon pricing instruments, including an ETS, is reaching an advanced stage, to be decided in early 2021. In parallel, a limited ETS pilot in the power sector is planned for implementation in 2021.
Background Information
GHG REDUCTION TARGETSBY 2030: 29% below BAU by 2030 including LULUCF (uncon-ditional NDC); up to 41% below BAU by 2030 including LULUCF (NDC conditional on international support)
Other Information
INSTITUTIONS INVOLVED Coordinating Ministry for Economic Affairs Coordinating Ministry for Maritime and Investment AffairsMinistry of Environment and ForestryMinistry of Energy and Mineral ResourcesMinistry of IndustryMinistry of FinanceEnvironment Fund Agency National Development Planning AgencyPMR Indonesia SecretariatUNDP Indonesia
IMPLEMENTING LEGISLATION/REGULATIONGR 46/2017 on Government Regulation on Environmental Economic Instruments1
Act No. 32/2009 on Environmental Conservation and Management2
Energy 538.0 (37%)industrial processes 55.0 (4%)aFOLU (including peat fire) 752.0 (52%)Waste 112.0 (8%)
OVERALL GHG EMISSIONS (excluding LULUCF) 1,457 MtCO2e (2016)
OVERALL GHG EMISSIONS BY SECTOR (MtCO2e)
← CONTENT

FACT
SHEE
TS –
03
Japa
nSt
atus
Rep
ort 2
021
ICAP
128
JAPAN
In force
Under development
Under consideration
Expert committee discussing carbon pricing options
Operating voluntary ETS
In March 2017, the Global Environment Committee of the Central Environment Council of Japan formulated the coun-try’s ‘Long-term Low-Carbon Vision.’ The document refers to carbon pricing as essential to decarbonizing society. Based on this discussion, in March 2018, an expert committee on carbon pricing released a study assessing how carbon pricing could help Japan achieve long-term, substantial emissions reductions, as well as address economic and social issues. In June 2018, a deliberative council—the Subcommittee on Utilization of Carbon Pricing, Global Environmental Subcom-mittee, Central Environment Council—was established to consider how carbon pricing can encourage Japan to make the transition to a decarbonized society and to achieve economic growth. Both industry groups and academic experts participated in the Council. In August 2019, the subcommittee published an interim summary report of the discussion and is scheduled to resume activities beginning early 2021. Discussions on the shape of a future carbon pricing mechanism, in addition to the existing 2012 carbon tax levied on fossil fuels such as petroleum, natural gas, and coal, are still ongoing within the Ministry of Environment and with various stakeholders. In December 2020, Prime Minister Yoshihide Suga instructed the Minister of the Environment and the Minister of Economy, Trade, and Industry to consider a carbon pricing proposal.
In parallel, Japan operates the Advanced Technologies Promotion Subsidy Scheme with Emission Reduction Targets (ASSET) Program, which functions as a voluntary cap-and-trade program. To receive an ASSET subsidy, entities estab-lish a reduction target based on historical emissions and propose new technologies to reach these targets. Entities that implement such technologies and achieve their target are granted the ASSET subsidy. Entities unable to meet their target on their own are permitted to purchase either credits from other participating entities, or so-called ‘J-Credits.’ The government administers the voluntary J-Credit Scheme, where energy saving, renewable energy, and domestic forest management mitigation activities are verified as tradable J-Credits.
Japan is also implementing the Joint Crediting Mechanism (JCM), a bilateral offset crediting mechanism to incen-tivize low-carbon technologies, in 17 JCM partner countries (Mongolia, Bangladesh, Kenya, Ethiopia, Indonesia, Vietnam, Lao PDR, Cambodia, Maldives, Palau, Costa Rica, Mexico, Chile, Saudi Arabia, Myanmar, Thailand, and the Philippines).
In October 2020, Prime Minister Suga pledged to reduce GHG emissions in Japan to net zero by 2050.
Background Information
GHG REDUCTION TARGETSBY 2030: 26% reduction from FY2013 GHG levels (NDC)BY 2050: Climate net neutrality (October 2020 pledge)
Other Information
INSTITUTIONS INVOLVEDMinistry of the Environment, which manages the Subcom-mittee on Utilization of Carbon PricingGlobal Environmental SubcommitteeCentral Environment Council
Energy 1,085.7 (88%)industrial processes and product Use 100.1 (8%)agriculture 33.3 (3%)Waste 19.3 (2%)indirect CO2 2.1 (0%)
OVERALL GHG EMISSIONS (excluding LULUCF) 1,240.4 MtCO2e (2018)
OVERALL GHG EMISSIONS BY SECTOR (MtCO2e)
← CONTENT

FACT
SHEE
TS –
03
nEW
ZEa
Land
Stat
us R
epor
t 202
1IC
AP
129
NEW ZEALANDThe New Zealand Emissions Trading Scheme
COVERAGE40.3 MtCO2e1
GASES Several gases
OFFSETS AND CREDITSnone2
ALLOCATIONFree allocation for emissions-intensive and trade-exposed (EiTE) activities: Benchmarkingauctioningallowances granted for forestry and other removal activities
AVERAGE 2020 PRICE3
nZd 30.83 (USd 19.99) REVENUE COLLECTED IN 2020nZd 215 million (USd 139 million)4
* Sectors covered through upstream coverage
POWER
INDUSTRY
TRANSPORT*
WASTE
DOMESTICAVIATION*
FORESTRY
AGRICULTURE (reporting obligations only)
BUILDINGS*
SECTORS:
Broad ETS sectoral coverage including forestry
Implementation of auctioning and market stability measures under a new ETS cap
Pricing mechanism for the agricultural sector scheduled
In force
Under development
Under consideration
1 – Emissions reported in activity year 2019, excluding LULUCF and agriculture2 – International (prior to 1 June 2015)3 – Average secondary market price4 – Money paid to meet surrender obligations under the “fixed price option” – 8.6 million fixed price option units were used at NZD 25 (USD 16.21) each5 – Both of these Acts amend the “Climate Change Response Act 2002”
ETS DESCRIPTIONThe New Zealand Emissions Trading Scheme (NZ ETS) was launched in 2008 and is a central policy for climate change mitigation in New Zealand. It has broad sectoral coverage, including forestry having emissions surrender obligations and the opportunity to earn units for emissions removals. Currently, biological emissions from agriculture have reporting obligations without surrender obligations. The ‘Climate Change Response Act 2002’ sets the legisla-tive framework for the NZ ETS and incorporates all of New Zealand’s key climate legislation under one Act.
After an extensive process of review and public consultation, the government has recently enacted sweeping legislative reforms of the NZ ETS to improve its design and operation, and enable it to better support New Zealand’s international and domestic emissions reduction obligations.
The NZ ETS originally operated as a nested system under the Kyoto Protocol, with full links to international carbon markets. Since 2015, however, it has been a domestic-only system. Accessing high-integrity international carbon markets could form part of New Zealand’s strategy for meeting its NDC.
YEAR IN REVIEWIn June 2020, the New Zealand government completed comprehensive legislative reforms with the passing of the ‘Climate Change Response (Emissions Trading Reform) Amendment Act 2020.’ This legislation strengthens the NZ ETS and aligns it with the goals of the Paris Agreement and the new 2050 net-zero targets established under the ‘Climate Change Response (Zero Carbon) Amendment Act 2019.’5
With the legislative framework in place, the government announced the regulatory settings for the 2021–2025 period, which establish a cap on emissions for the first time under the NZ ETS. The cap represents an annual limit on units to be supplied into the NZ ETS under the economy-wide five-yearly emissions budgets, set by the government with advice from the newly established Climate Change Commission.
Auctioning has been introduced to the NZ ETS beginning in March 2021 and price control regulations provide for release of additional units through a cost containment reserve to manage unacceptably high prices; and an auction reserve price as a price floor. In a joint bid, the New Zealand Exchange (NZX) and the European Exchange (EEX) were together selected by the New Zealand government to develop and operate the NZ ETS auctioning service.
The legislation specifies a schedule to phase down free allocation for the industrial sector at a rate of 1% per year between 2021 and 2030, increasing to 2% in 2031–2040, and 3% in 2041–2050. A further review of the free allocation meth-odology will take place over 2021.
The forestry sector is also undergoing a raft of reforms due to come into force in 2023, including simplified accounting measures for new entrants (e.g., a transition from “stock-change” to “averaging” accounting methodology).
Under the new legislation, agricultural GHG emissions will be subject to a carbon price from 2025 onwards. Agricultural emissions, particularly from livestock, are to be covered pref-erably at the farm level by a levy/rebate system – a separate, alternative pricing mechanism to the NZ ETS. A partnership between the government and the agricultural sector, called “He Waka Eke Noa,” has been established to prepare for this pricing mechanism, including the development of on-farm accounting and reporting systems for GHG sources and sinks. However, if this partnership has not made enough progress by 2022 for implementation in 2025, agricultural emissions will be brought directly into the NZ ETS from 2022, with livestock emissions priced at the processor level (e.g., milk processors and abattoirs). GHG emissions from fertilizer would then likely be covered upstream under the NZ ETS at the importer/manufacturer level.
← CONTENT

FACT
SHEE
TS –
03
nEW
ZEa
Land
Stat
us R
epor
t 202
1IC
AP
130
Background Information
GHG REDUCTION TARGETSBY 2030: Reduce emissions 30% below 2005 levels (NDC)BY 2050: Reduce net emissions of all greenhouse gases (except biogenic methane) to zero. Reduce biogenic methane emissions 10% below 2017 levels by 2030, and 24–47% by 2050 (Climate Change Response (Zero Carbon) Amendment Act 2019)
ETS Size
COVERED EMISSIONS40.3 MtCO2e (Verified emissions5 2019)
GHGs COVEREDCO2, CH4, N2O, SF6, HFCs, and PFCs
SECTORS AND THRESHOLDSSectors were gradually phased in between 2008 and 2013. Thresholds for participation are typically low.• Forestry (mandatory: deforesting pre-1990 forest land;
voluntary: post-1989 forest land)• Stationary energy (various thresholds)• Industrial processing (various thresholds)• Liquid fossil fuels (various thresholds)• Waste (except for small and remote landfills)• Synthetic GHGs (various thresholds); synthetic GHGs not in
the NZ ETS are subject to an equivalent levy
Biological emissions from agriculture must be reported at the processor level but face no surrender obligations. By 2025, a carbon price will be levied on agricultural emissions either through the NZ ETS or a separate levy/rebate scheme.
POINT OF REGULATIONThe point of obligation is generally placed upstream. Some large businesses that purchase fossil fuels directly from mandatory NZ ETS participants can choose to opt into the NZ ETS rather than have the costs passed down from their suppliers.
NUMBER OF ENTITIES6
2,398 entities registered, of which 2,321 have surrender obligations:• 218 entities with mandatory reporting and surrender
obligations. • 2,103 entities with voluntary reporting and surrender obli-
gations, most of which are for post-1989 forestry activities.• 77 entities with mandatory reporting without surrender
obligations, all of which are for agricultural processing activities.
CAPThe NZ ETS was originally designed to operate without a specific domestic cap, as this accommodated carbon sequestration from forestry activities and a full link to the international Kyoto Protocol carbon markets. Allowance supply was restricted to New Zealand Units (NZUs) in 2015. Potential future access to international units will be subject to quantitative limits.
The ‘Climate Change Response (Emissions Trading Reform) Amendment Act’ requires the government to set a cap on emissions covered by the NZ ETS, based on the five-yearly emissions budgets mandated by the ‘Zero Carbon Act’ and announced over a rolling five-year period with annual updates. The Climate Change Commission will advise on further emissions budgets in 2021.
In the interim, the government has chosen a provisional emis-sions budget and associated cap for the period 2021 –2025. The cap will limit the number of allowances that can be released to the market from auctioning, industrial allocation, and the new Cost Containment Reserve (CCR), as well as from any international units (not currently foreseen).
There will be no limit on NZUs generated from removal activities.
OVERALL GHG EMISSIONS (excluding LULUCF) 78.9 MtCO2e (2018)
~51%
5 – With surrender obligations6 – All figures as of June 2020
OVERALL GHG EMISSIONS BY SECTOR (MtCO2e)
Energy (transport) 16.6 (21%)Energy (other) 15.3 (19%)industrial processes and product Use 5.2 (7%)agriculture 37.7 (48%)Waste 4.1 (5%)
← CONTENT

FACT
SHEE
TS –
03
nEW
ZEa
Land
Stat
us R
epor
t 202
1IC
AP
1317 – Under the new “averaging” method for post-1989 forests, allowances are granted only up to the long-term average carbon stock, but therefore do not need to be surrendered at harvest.8 – In the case of export, GHGs are considered “removals” according to the accounting rules of the NZ ETS. They are not removed from the atmosphere.
Phases &Allocation
TRADING PERIODSThe NZ ETS has no fixed trading periods or phases.
ALLOCATIONFREE ALLOCATION:Leakage Protection/Industrial Free Allocation: Free allo-cation is provided, based on output and intensity-based benchmarks for 26 eligible industrial activities. Activities are deemed eligible if both emissions-intensive and trade- exposed (EITE) criteria are met. Highly emissions-intensive activities (over 1,600 tCO2e per NZD 1 million of revenue [1,600 tCO2e per USD 648 thousand of revenue]) receive 90% free allocation. Moderately emissions-intensive activ-ities (over 800 tCO2e per NZD 1 million of revenue [USD 648 thousand]) receive 60% free allocation. Trade exposure is deemed if there is transoceanic trade in the good produced. 8.4 million NZUs were allocated for industrial EITE activities in the 2019/2020 financial year (1 July 2019 to 30 June 2020).
As a part of the ‘Climate Change Response (Emissions Trading Reform) Amendment Act,’ the government plans to phase down industrial free allocation from 2021. A minimum annual phase-down rate of 1% across all industrial activities will apply from 2021–2030. That rate will increase to 2% for the years 2031–2040, and to 3% for 2041–2050. The minimum phase-down rate will be complemented by further phase-down rates for activities that are considered at lower risk of carbon leakage.
Forestry and Fisheries Sectors (one-off): Owners of pre- 1990 forest land, as well as owners of fishing quotas, received a one-off free allocation of NZUs when the NZ ETS was imple-mented to partially compensate for the impact of the ETS.
AUCTIONING: Auctioning was introduced in 2021, with the first auction taking place on 17 March.
ALLOWANCES GRANTED FOR REMOVALSPost-1989 Forestry Sector and Other Removal Activities: NZUs are granted to participants that voluntarily register in the scheme for removal activities, as outlined under “Forestry Removal Activities” below.
Forestry Removal Activities: Participants are entitled to receive one NZU per tCO2 removed for registered post-1989 forest land. If the forest is harvested7 or deforested, units must be surrendered to account for the emissions, and if the participant chooses to deregister from the scheme, NZUs equivalent to the number received must be returned. 9.1 million NZUs were issued for forest removal activities for the 2019/2020 financial year.
Other Removal Activities: Participants are entitled to receive one NZU per tonne of removal from the destruction or export of products that embed carbon as well as for the export of HFCs and PFCs.8 3.1 million NZUs were issued for other removal activities for the 2019/2020 financial year.
Flexibility
BANKING AND BORROWINGBanking is allowed except for those units that were purchased under the fixed price option (see “Market Stability Provisions” section).
Borrowing is not allowed.
OFFSETS AND CREDITSUnits from Kyoto Protocol flexible mechanisms were eligible for use in the system with no restrictions until 2015. As of 1 June 2015, international units are not eligible for surrender in the NZ ETS. Access to high-integrity international carbon markets is likely to form part of New Zealand’s strategy for meeting its 2030 target. The government can decide to allow international units as part of the annual unit supply-setting process. However, only units from government-approved sources and those meeting environmental integrity stan-dards would be eligible and would be subject to quantitative limits.
MARKET STABILITY PROVISIONSA Fixed Price Option of NZD 25 (USD 16.21), which acts as a form of price ceiling, was introduced in 2009 and raised to NZD 35 (USD 22.70) for emissions produced in 2020. It will be replaced with a CCR once the transition to auctioning has occurred.
NEW MARKET STABILITY MEASURES: The ‘Climate Change Response (Emissions Trading Reform) Amendment Act’ enables new measures to be implemented via the auctioning mechanism. These include a CCR and an auction reserve price, outlined below.
COST CONTAINMENT RESERVE: The CCR is implemented via auctioning. A specified number of allowances from the CCR will be released for auction if a predetermined trigger price is reached, currently set at NZD 50 (USD 32.42) in 2021 and rising by 2% per year in line with projected inflation.
← CONTENT

FACT
SHEE
TS –
03
nEW
ZEa
Land
Stat
us R
epor
t 202
1IC
AP
132
The volume of the reserve, in the years 2021–2025, will be composed of two sources: (1) units under the ETS cap which are to be withheld from
auctioning in order to reduce the stockpile of units in circulation (~5.5 million per year); and
(2) an additional volume equal to 5% of the total volume of the NZ ETS (~1.6 million per year), which will come from outside the cap and therefore must be “backed” by equiv-alent removals procured by the government, e.g., from international markets or through government funding of other domestic mitigation activities.
PRICE FLOOR: Via auctioning, the government will introduce a price floor of NZD 20 (USD 13.00) for the period 2020–2025.
The price floor will operate through a reserve price below which NZUs will not be sold at auction. The minimum accepted bid at auction will rise by 2% for each subsequent year. In addition to the hard auction reserve price floor, the government plans to introduce a technical reserve price (TRP). The TRP will be set by referencing prices from the secondary market and will use a confidential methodology to determine a reserve price below which units cannot be sold. If the TRP is set higher than the hard auction reserve price, then it becomes the new reserve price floor for that auction. Any unsold units can be carried over to the following auction within the calendar year, but will be cancelled if it is the final auction of the year.
Compliance
COMPLIANCE PERIODOne year
For most sectors, the NZ ETS has annual surrender obliga-tions. For post-1989 forestry participants, annual reporting of emissions and removals is optional, with five-year mandatory reporting periods. As a result, unit allocations and surrenders for these participants occur in the year they choose to report their emissions.
MRVREPORTING FREQUENCY: Most sectors are required to report annually; deadline of 31 March to submit an Annual Emissions Return (emissions report).
VERIFICATION: Self-reporting supplemented by a program of official audits. Participants must seek third-party verification if they apply for the use of a unique emissions factor.
ENFORCEMENTAn entity that fails to surrender or repay emissions units when required must surrender the units and pay a cash penalty of three times the current market price for each unit that was not surrendered by the due date. Entities can be fined up to NZD 24,000 (USD 15,564) on conviction for failure to collect emissions data or other required information, calcu-late emissions and/or removals, keep records, register as a participant, submit an emissions return when required, or notify the administering agency or provide information when required to do so. Entities can also be fined up to NZD 50,000 (USD 32,424) on conviction for knowingly altering, falsifying, or providing incomplete or misleading information about any obligations under the scheme, including in the Annual Emissions Return report. This penalty and/or imprisonment of up to five years also apply to entities that deliberately lie about obligations under the NZ ETS to gain financial benefit or avoid financial loss.
Linking
LINKS WITH OTHER SYSTEMSUntil 1 June 2015, the NZ ETS was indirectly linked to other systems (e.g., the EU ETS) via the international Kyoto Protocol flexible mechanisms. Since then, the NZ ETS has been a domestic-only system.
The recent reforms make the NZ ETS more similar to ETSs in other countries, making it more compatible for international linking in the future.
← CONTENT
FACT
SHEE
TS –
03
nEW
ZEa
Land
Stat
us R
epor
t 202
1IC
AP
133
Other Information
INSTITUTIONS INVOLVEDMinistry for the EnvironmentEnvironmental Protection AuthorityMinistry for Primary Industries
EVALUATION/ETS REVIEWThe ‘Climate Change Response Act 2002’ includes provi-sions for statutory independent reviews of the operation and effectiveness of the NZ ETS. These reviews were originally required every five years, but the timing is now discretionary. The first statutory review took place in 2011–2012, and the second review took place in 2015–2017.
Public consultation on proposed amendments to the ‘Climate Change Response Act’ was undertaken in 2018 following the second review.
USE OF REVENUESCurrently, NZ ETS revenues are assigned to the general budget. There is no earmarking for specific purposes.
IMPLEMENTING LEGISLATION/REGULATION‘Climate Change Response Act 2002—Part 4 New Zealand greenhouse gas emissions trading scheme’9
Note: in order to keep New Zealand’s key climate change legislation under one act, the Act incorporates both the Climate Change Response (Emissions Trading Reform) Amendment Act 2020, and the Climate Change Response (Zero Carbon) Amendment Act 2019. The ‘Zero Carbon Act’ details domestic targets to 2050, establishes the Climate Change Commission, and mandates a process of setting and meeting five-year national emission budgets.
9 – http://www.legislation.govt.nz/act/public/2002/0040/latest/DLM1662481.html.
← CONTENT

FACT
SHEE
TS –
03
paKi
STan
St
atus
Rep
ort 2
021
ICAP
134
PAKISTAN
In force
Under development
Under consideration
Launched a national committee in 2019 to assess the role and scope of an ETS
Work is underway on preparing MRV regulations for an ETS
Pakistan is considering market-based climate policy instru-ments, including an ETS, to tap into low-cost abatement opportunities and leverage low-carbon investments.
The ‘Pakistan Climate Change Act, 2017’ provides the legal and institutional framework for climate policy in Pakistan. It establishes the cross-ministerial Pakistan Climate Change Council responsible for the country’s overall climate strategy as well as the Pakistan Climate Change Authority, which is tasked with coordinating climate policy development and implementation, in addition to designing and establishing a national registry and database on GHG emissions. In 2019, the Pakistani Ministry of Climate Change, in cooperation with the United Nations Framework Convention on Climate Change secretariat and the Institute for Global Environmental Strategies, published a study on carbon pricing underlining the potential for emissions trading in Pakistan in the power and industry sectors.
Following the outcomes of the study, Pakistan launched the National Committee on Establishment of Carbon Markets in December 2019. The committee is tasked with assessing the role and scope of carbon markets in delivering Pakistan’s NDC and identifying opportunities for and chal-lenges to improving emissions data. Among other objectives, it will review existing carbon market designs, deliberate with national stakeholders, draft reports, and coordinate informa-tion-sharing and capacity-building activities.
The ongoing work is focused on developing recommenda-tions for the government on the development of a domestic ETS and of credit-based trading mechanisms linked to inter-national carbon markets, which would enable Pakistan to supply offsets to partner countries. Provisions are being drafted for domestic instruments under Article 6, and work is underway on preparing MRV regulations for an ETS. More-over, Pakistan is developing a carbon pricing communication strategy.
Background Information
GHG REDUCTION TARGETSBY 2030: 20% below BAU including LULUCF (NDC conditional on international support)
Other Information
INSTITUTIONS INVOLVEDMinistry of Climate ChangePakistan Climate Change CouncilPakistan Climate Change AuthorityNational Committee on Establishment of Carbon Markets
IMPLEMENTING LEGISLATION/REGULATIONPakistan Climate Change Act 20171
OVERALL GHG EMISSIONS (excluding LULUCF) 397.5 MtCO2e (2015)
OVERALL GHG EMISSIONS BY SECTOR (MtCO2e)Energy 186.0 (47%)industrial processes 22.0 (6%)agriculture 174.3 (44%)Waste 15.5 (4%)
1 – www.na.gov.pk/uploads/documents/1485513841_966.pdf
← CONTENT

FACT
SHEE
TS –
03
phiL
ippi
nES
Stat
us R
epor
t 202
1IC
AP
135
In early 2020, the Committee on Climate Change of the Philippine House of Representatives conditionally approved the ‘Low Carbon Economy Act’ House Bill (HB) No. 2184, which includes provisions for a domestic cap-and-trade system. A technical working group has since been estab-lished to review the bill, which will be reconsidered based on the group’s input. The bill would establish a cap-and-trade system for the industrial and commercial sectors, admin-istered by the Philippine Department of Environment and Natural Resources (DENR) and the Department of Trade and Industry.
Under the proposed legislation, the cap-and-trade system would cover a variety of GHGs, including carbon dioxide, methane, nitrous oxide, hydrofluorocarbons, and any other gas determined by the DENR to contribute to global warming. The DENR would determine key details regarding setting annual emissions reduction targets, setting a cap, distributing allowances, monitoring, and enforcement. The bill would also establish a ‘Climate Reinvestment Fund’ to be used by the DENR to exclusively address global warming. The bill does not specify a timeline to have the system in place.
Background Information
GHG REDUCTION TARGETSBY 2030: Conditional pledge to keep 2030 emissions 70% below BAU levels (INDC, NDC to be submitted in 2020/2021)
Other Information
INSTITUTIONS INVOLVEDDepartment of Environment and Natural ResourcesDepartment of Trade and IndustryHouse of Representatives Committee on Climate Change
PHILIPPINES
In force
Under development
Under consideration
OVERALL GHG EMISSIONS (excluding LULUCF) 229.0 MtCO2e (2017)
OVERALL GHG EMISSIONS BY SECTOR (MtCO2e)Energy 133.0 (58%)industrial processes 12.0 (5%)agriculture 63.0 (28%)Waste 20.0 (9%)
Legal basis being developed for an ETS in the industrial and commercial sectors
← CONTENT

FACT
SHEE
TS –
03
rEpU
BLiC
OF
KOrE
aSt
atus
Rep
ort 2
021
ICAP
136
POWER
INDUSTRY
WASTE
DOMESTICAVIATION
BUILDINGS
REPUBLIC OF KOREAKorea Emissions Trading System
CAP592 MtCO2e (2020) 609 MtCO2e (2021)
GASES Several gases
OFFSETS AND CREDITSdomestic international
ALLOCATIONFree allocation: BenchmarkingFree allocation: Grandparentingauctioning
AVERAGE 2020 PRICE1
KrW 32,595.83 (USd 27.62)TOTAL REVENUE KrW 480.7 billion (USd 407.3 million2), KrW 248.3 billion (USd 199.4 million) collected in 2020
SECTORS:
Fuel Combustion (including transport) 632.4 (87%)industrial processes 57.0 (8%) agriculture 21.2 (3%)Waste 17.1 (2%)
In force
Under development
Under consideration
1 – Average secondary market price from KRX. 2 – The regular auction schedule began in 2019. Allowances were also auctioned in 2016 and 2018 by the Allocation Committee from the reserve for market stability measures.
Revenues from these auctions totalled USD 99.6 million and are not included in the total auction revenue figure above.
East Asia’s first national ETS
Phase 3 commenced in 2021 with a stricter cap, updated allocation provisions, and third-party participation
2050 net-zero target currently in the legislative process
ETS DESCRIPTIONThe Korea ETS (K-ETS) was launched on 1 January 2015, becoming East Asia’s first nationwide mandatory ETS and, at the time, the second-largest carbon market after the EU ETS. The K-ETS covers 685 of the country’s largest emitters, accounting for ~73.5% of national GHG emissions. It covers direct emissions of six GHGs, as well as indirect emissions from electricity consumption. The K-ETS is meant to play an essential role in meeting Korea’s 2030 updated NDC target of a 24.4% reduction from 2017 emissions.
The first and highest legal base for green growth and imple-mentation of the K-ETS is the ‘Framework Act on Low Carbon, Green Growth’ (2010). The ‘Act on Allocation and Trading of Greenhouse Gas Emissions Allowances’ (‘Emissions Trading Act’) and its Enforcement Decree, passed in 2012, stipulate government actions, institutions, and timelines for the K-ETS. Further details of the K-ETS were outlined in two Master Plans (January 2014 and February 2017). Detailed Allocation Plans are released for each trading phase (January 2014, July 2018, and September 2020).
The K-ETS was preceded by a mandatory GHG and Energy Target Management System (TMS) that was launched in 2012 (following a two-year pilot phase started in 2010). The TMS facilitated the collection of verified emissions data and training in the MRV process and still applies to smaller enti-ties not covered by the K-ETS.
YEAR IN REVIEW2020 was an important year for climate ambition in Korea with the government announcing a Green New Deal and a net-zero target for 2050, tied to a commitment to speed
up investment in clean technologies across the economy. 2020 also saw notable developments in the K-ETS with the adoption of key regulations for the third trading phase which commenced with the start of the new trading year in 2021. The updates include amendments to the ‘Emissions Trading Act’ and the adoption of the Phase 3 Allocation Plan in September 2020—the latter of which forms the main ETS document detailing updated design provisions ahead of the new trading phase.
Starting from Phase 3, financial intermediaries can partici-pate in the secondary market and trade allowances as well as converted carbon offsets on the Korea Exchange (KRX)—complementing the “market maker system” that was intro-duced in Phase 2 to support market liquidity. Furthermore, the system’s scope has been expanded to include construc-tion companies and (large) transport companies. This corre-sponds to a rise in the number of compliance entities from ~610 to 685 and a 3.2% increase in the average annual cap, amounting to 609 million tCO2e during 2021–2025. The inclu-sion of these sectors brings the system’s coverage to 73.5% of national emissions, an increase of more than 2 percentage points. The allocation plan also foresees the introduction of a futures market at a yet-to-be-determined date.
In line with earlier announcements about allocation provi-sions in Phase 3, the share of auctioning increases from 3% to10% in 2021 for a total of 41 out of 69 industries eligible to participate in auctions. The remaining 28 subsectors receive 100% free allocation as determined by a carbon leakage index. The share of benchmarking increases from 50% to 60% and expands to a total of 12 sectors. The share of offsets in Phase 3 is reduced from 10% to 5%.
Background Information
OVERALL GHG EMISSIONS (excluding LULUCF) 727.7 MtCO2e (2018)
OVERALL GHG EMISSIONS BY SECTOR (MtCO2e)
← CONTENT

FACT
SHEE
TS –
03
rEpU
BLiC
OF
KOrE
aSt
atus
Rep
ort 2
021
ICAP
137
3 – This includes international credits through the K-ETS, as well as alternative options, including LULUCF and other international credits (i.e., Article 6 under the Paris Agreement). 4 – Phase 3 Allocation Plan factsheet: http://www.me.go.kr/home/web/board/read.do?pagerOffset=0&maxPageItems=10&maxIndexPages=10&searchKey=&searchValue=&menu-
Id=286&orgCd=&boardId=1401250&boardMasterId=1&boardCategoryId=&decorator=
GHG REDUCTION TARGETSBY 2030: 24.4% below 2017 emissions (i.e., 536 MtCO2e in 2030) (updated NDC); 38 million international credits3 may be used towards achieving this goal (2030 GHG mitigation roadmap) BY 2050: Net-zero emissions (proposed)
ETS Size
COVERED EMISSIONS
GHGs COVEREDCO2, CH4, N2O, PFCs, HFCs, SF6
SECTORS AND THRESHOLDSPHASE ONE (2015–2017): 23 subsectors from the following five sectors: power, industry (e.g., iron and steel, petrochem-ical, cement, oil refinery, nonferrous metals, paper, textile, machinery, mining, glass, and ceramics), buildings, waste, and transportation (domestic aviation).
PHASE TWO (2018–2020): According to the Phase 2 Alloca-tion Plan, the public and waste sectors are disaggregated such that the K-ETS covers the following six sectors: heat and power, industry, buildings, transportation, waste sector, and the public sector. These sectors are disaggregated into 62 subsectors.
PHASE THREE (2021–2025): The K-ETS covers the following six sectors: heat and power, industry, buildings, transpor-tation, waste sector, and the public sector. The transport sector (freight, rail, passenger, and shipping) and construc-tion industries have been brought into the system’s scope, increasing the number of subsectors covered to 69.
INCLUSION THRESHOLDS: company >125,000 tCO2/year, facility >25,000 tCO2/year
Next to direct emissions coverage, the K-ETS covers indirect emissions from electricity consumption. The same inclusion thresholds apply.
POINT OF REGULATIONDownstream
NUMBER OF ENTITIES685 (2021)
CAPPHASE ONE (2015–2017): 1,686.3 MtCO2e, including a reserve of 88 MtCO2e for early action and new entrants. 84.5% of the reserve was used within the phase. 14.3 million allowances were set side in a reserve for market stabilization, bringing the total number of allowances in Phase 1 to 1,700.6 million.
Annual Caps in Phase One 2015: 540.1 MtCO2e2016: 560.7 MtCO2e2017: 585.5 MtCO2e(Yearly caps do not include allowances set aside for market stabilization.)
PHASE TWO (2018–2020): 1,777 MtCO2e, including 134 million for new entrants and other purposes. 14 million allowances were set aside for market stabilization and five million for the market makers (see "Market Stability Provisions" section) bringing the total amount of allowances to 1,796.1 million in Phase 2.
Annual Caps in Phase Two 2018: 601 MtCO2e2019: 587.6 MtCO2e2020: 545.1 MtCO2e Unallocated and withdrawn allowances were transferred to the reserve.
PHASE THREE (2021–2025): 3,048.3 MtCO2e. This corresponds to an average annual cap of 610 MtCO2e, including reserves. Annual caps are higher in Phase 3 due to the expansion in scope, but reflect a 4.7% decrease in emissions compared to the 2017–2019 baseline. In addition, 14 million allowances are set aside for market stability purposes and 20 million for the market makers, bringing the total amount of allowances in Phase 3 to 3,082.3 million.
Annual Caps in Phase Three (excluding reserves)2021: 589.3 MtCO2e2022: 589.3 MtCO2e2023: 589.3 MtCO2e2024: 567.1 MtCO2e2025: 567.1 MtCO2e
Phases &Allocation
TRADING PERIODSPHASE ONE: 3 years (2015–2017)
PHASE TWO: 3 years (2018–2020)PHASE THREE: 5 years (2021–2025)
74%4
← CONTENT

FACT
SHEE
TS –
03
rEpU
BLiC
OF
KOrE
aSt
atus
Rep
ort 2
021
ICAP
138
ALLOCATIONPHASE ONE (2015–2017) Free Allocation: 100% of total allowance supply. Most sectors received free allowances based on the average GHG emissions of the base years (2011–2013). Three sectors (grey clinker, oil refinery, and aviation) were allocated free allow-ances following benchmarks based on previous activity data from the base years (2011–2013).
PHASE TWO (2018–2020) Free Allocation: 97% of allocation to entities in sub-sectorssubject to auctioning; 100% for EITE sectors. Toward the end of Phase 2, the share of sector-specific benchmarking reached 50% of total primary allocation and was expanded to a total of seven sectors: grey clinker, oil refinery, domestic aviation, with the addition of waste, industrial parks, elec-tricity generation, and district heating/cooling.
EITE sectors received 100% of their allowances for free if they met one of the following three criteria:5 • Additional Production Cost of >5% and Trade Intensity of
>10%; or• Additional Production Cost of >30%; or• Trade Intensity of >30%.6
Auctioning: 3% of allocation to entities in sub-sectors subject to auctioning. 26 subsectors were eligible to partic-ipate in auctions, including entities from the electricity, domestic aviation, wooden products, and metal foundry sectors. Regular auctions began in 2019. In 2019, authori-ties auctioned a total of 7.95 million allowances. 9.3 million allowances were auctioned in 2020.
Participation in auctions is subject to some limitations. Only companies that do not receive all their allowances for free are eligible to bid, with a list of eligible bidders published by the Ministry of Environment. No one bidder can purchase more than 30% of the allowances of one auction. The auctions are subject to a minimum price set by the following formula: (average price over the previous three months + average price of last month + average price over the previous three days)/3
PHASE THREE (2021–2025) Free Allocation: Less than 90% of allocation to entities in sub-sectors subject to auctioning; 100% for EITE sectors. The share of sector-specific benchmarking is to reach 60% and has been expanded to a total of 12 sectors: grey clinker, oil refinery, domestic aviation, waste, industrial parks, electricity generation, and district heating/cooling, with the addition of steel, petrochemical, buildings, paper, and wood processing.
Fuel-specific benchmarks apply to electricity generators and will be updated again by the end of 2023. Industry bench-marks are currently undergoing revisions.
EITE sectors receive 100% free allocation when meeting the following criteria: Cost Incidence * Trade Intensity ≥ 0.002
Auctioning: At least 10% of allocation to entities in sub-sec-tors subject to auctioning. Entities from 41 subsectors, which excludes EITE sectors, can participate in auctions. The same auction provisions as for Phase 2 apply.
Financial intermediaries and other third parties can partici-pate in exchange trading since 2021. A futures market will be introduced as a part of Phase 3 reforms at a yet-to-be-deter-mined date.
Flexibility
BANKING AND BORROWING Banking is allowed with restrictions across and within phases.
Borrowing is allowed within a single trading phase.
PHASE ONE (2015–2017) From Phase 1 to Phase 2, banking was limited for each installation to 10% of their annual average allocation at a maximum of 20,000 Korean Allow-ance Units (KAUs). The amount that exceeds the threshold was deducted from the Phase 2 allocation. Borrowing in 2015 was limited to 10% of an entity’s obligation and was increased to 20% in 2016 and 2017.
PHASE TWO (2018–2020) From Phase 2 to Phase 3, banking was initially limited to the higher of two limits: the net annual amount of allowances sold by the entity in Phase 2; or company- and facility-specific limits of 250,000 KAUs and 5,000 KAUs, respectively. Borrowing was limited to 15% of an entity’s obligation in 2018.
Rules on banking and borrowing were adjusted in 2019. The borrowing limit was set by each entity’s past borrowing activity: [Borrowing limit of previous year - (“borrowing ratio” in previous year x 50%)]/entity’s emission volume.
The banking limit for the transition between Phase 2 and Phase 3 has been calculated as follows:• For allowances from the 2018 vintage (KAU18), entities can
bank either three times the net selling amount or 75,000 allowances for companies emitting >125k tCO2e (or 15,000 allowances for companies emitting >25,000 tCO2e) —whichever of the two is higher;
• For KAU19s, the amounts above are reduced by 1/3, i.e., two times the net selling amount or 50,000 for large enti-ties (10,000 for smaller entities) allowances, again which-ever is higher;
• For KAU20s, the amount represents a 2/3 reduction compared to the KAU18 rule.
5 – Additional Production Cost: annual average GHG emissions during base year x average market price of allowances during base year / annual average value-added production during base year
6 – Trade Intensity is calculated relative to the base year: (annual average exports + annual average imports) / (annual average sales + annual average imports)
← CONTENT

FACT
SHEE
TS –
03
rEpU
BLiC
OF
KOrE
aSt
atus
Rep
ort 2
021
ICAP
139
7 – As of December 2017, a total of 35 domestic and 211 CDM methodologies had been approved for use under the K-ETS.8 – The government lends allowances to the market makers that provide services for market stability. Market makers can return allowances in-kind or transfer the proceeds of
allowances sold.
PHASE THREE (2021–2025) In the first trading year, entities can borrow up to 15% of their compliance obligation. From the second to fourth trading years, the same borrowing formula as for 2019 applies.
Banking in Phase 3: • In the first and second compliance years (2021–2023), enti-
ties can bank up to two times their net amount of allow-ances (KAUs) and offsets (Korean Credit Units, KCUs) sold on the secondary market.
• In the third and fourth compliance years (2023–2024), enti-ties’ banking limit is equal to their net amount of allow-ances and offsets sold.
• Phase 3 allowances and offsets can only be carried over to the first compliance year of Phase 4 (2026–2030). The banking limit in the fifth compliance year (2025) is set by an entity’s annual average net sold units (KAU21-KAU25; KCU21-KCU25) on the secondary market during Phase 3.
OFFSETS AND CREDITSDomestic offsets, i.e., Korean Offset Credits (KOCs) were allowed in Phase 1. KOCs and international credits (subject to qualitative criteria) have been allowed since Phase 2. Both domestic and international credits need to be converted to KCUs in order to be used for compliance.
PHASE ONE (2015–2017)Qualitative Limit: Only domestic credits from external reduction activities implemented by non-ETS entities—and that meet international standards—could be used for compliance in this phase. Domestic CDM credits (CERs), and credits from domestically certified projects (Korean Offset Credits) were allowed. Eligible activities included those eligible under the CDM and Carbon Capture and Storage. However, only activities implemented after 14 April 2010 were eligible.7
Quantitative Limit: Up to 10% of each entity’s compliance obligation.
PHASE TWO (2018–2020) Qualitative Limit: In Phase 2, CERs generated after 1 June 2016 from international CDM projects developed by domestic companies are allowed. CDM projects operated by Korean companies were allowed when: • at least 20% of the ownership rights, operating rights, or
the voting stocks are owned by a Korean company;• a Korean company supplies the low-carbon technology
worth at least 20% of the total project cost; or • the projects are funded by a Korean company with a
national or regional government operating in a UN-desig-nated Least Developed Country or a low-income economy as classified by the World Bank.
Quantitative Limit: Up to 10% of each entity’s compliance obligation (of which up to 5% can be international offset credits).
PHASE THREE (2021–2025): Offsets will continue to be allowed according to the qualitative criteria outlined for Phase 2. Quantitative Limit: In Phase 3, the share of offsets has decreased to 5% of an entity’s compliance obligation. No separate limit for international credits applies.
MARKET STABILITY PROVISIONSAUCTION RESERVE PRICE: Regular auctions as well as auctions for market stability are subject to a reserve price determined by a formula (see “Allocation” section).
ALLOCATION COMMITTEE: An Allocation Committee is in place to implement market stabilization measures in partic-ular cases:• the market allowance price of six consecutive months is at
least three times higher than the average price of the two previous years;
• the market allowance price of the last month is at least twice the average price of the two previous years and the average trading volume of the last month is at least twice the volume of the same month of the two previous years;
• the average market allowance price of a given month is lower than 40% of the average price of the two previous years; or
• it is difficult to trade allowances due to an imbalance of supply or demand.
The stabilization measures may include:• additional auctioning of allowances from the reserve (up
to 25%); • establishment of a limit to the number of allowances in an
entity’s account: minimum (70%) or maximum (150%) of the allowance of the compliance year;
• an increase or decrease of the borrowing limit;• an increase or decrease of the offsets limit; and• temporary setup of a price ceiling or price floor.
In 2016, the Allocation Committee doubled the borrowing limit to 20%; as well, an additional 0.9 million allowances were auctioned at a reserve price of KRW 16,200 (USD 13.73) of which almost one-third were sold. In 2018, the Allocation Committee auctioned an additional 5.5 million allowances from the stability reserve to ease the market in the lead-up to the 2017 compliance deadline; 4.7 million allowances were sold.
In June 2019, the Korea Development Bank and the Industrial Bank of Korea were officially designated as “market makers.” These institutions can draw on a government-held reserve of five million allowances in a bid to increase liquidity in the market. Both banks, along with the Korean Export-Import Bank, engaged in market transactions on a daily basis. This has improved market liquidity and reduced bid-ask spreads.8
The reserve for market liquidity increased to 20 million allow-ances for the third trading phase.
← CONTENT

FACT
SHEE
TS –
03
rEpU
BLiC
OF
KOrE
aSt
atus
Rep
ort 2
021
ICAP
140
Compliance
COMPLIANCE PERIODOne year. Entities need to surrender allowances for the previous emissions year by end of June.
MRV REPORTING FREQUENCY: Annual reporting of emissions must be submitted within three months from the end of a given year (by the end of March).
VERIFICATION: Emissions must be verified by a third-party verifier.
OTHER: Emissions reports are reviewed and certified by the Certification Committee of the Ministry of Environment within five months from the end of a given compliance year (by the end of May).
If the liable entity fails to report emissions correctly, the report will be disqualified.
ENFORCEMENTThe penalty shall not exceed three times the average market price of allowances of the given compliance year or KRW 100,000 (USD 84.73)/tonne.
Linking
LINKS WITH OTHER SYSTEMSNo linkage is currently considered.
Other Information
INSTITUTIONS INVOLVEDIn 2016, overall responsibility for the K-ETS moved from the Ministry of Environment (MOE) to the Ministry of Economy and Finance (MOEF). In January 2018, responsibility was transferred back to the MOE, although the MOEF still chairs the Allocation Committee Korea Exchange (Trading Platform)Greenhouse Gas Inventory and Research Center (GIR; Registry and technical implementation)
EVALUATION/ETS REVIEWThe GIR regularly releases summary (evaluation) reports that include key emissions statistics, market performance indica-tors, and survey results from covered entities.
USE OF REVENUESThe government has put forward possible options for the use of the revenues. These options include support for mitigation equipment, low-carbon innovation, and technology devel-opment of ETS-covered entities. Specific rules on the use of revenues are yet to be decided.
IMPLEMENTING LEGISLATION/REGULATIONFramework Act on Low Carbon, Green Growth9 Enforcement Decree of the Act on the Allocation and Trading of Greenhouse Gas Emissions Allowances10 Act on the Allocation and Trading of Greenhouse Gas Emis-sions Allowances11 First Basic Plan for 2015–202412 Second Basic Plan for 2017–202613 Third Basic Plan of the ETS14
First Allocation Plan15 Second Allocation Plan16 Greenhouse Gas Emissions Allocation and Trade Act (amended as of June 2020)17 Third Allocation Plan18
9 – https://www.climate-laws.org/geographies/south-korea/laws/framework-act-on-low-carbon-green-growth-regulated-by-enforcement-decree-of-the-framework-act-on-low-car-bon-green-growth
10 – https://elaw.klri.re.kr/eng_mobile/viewer.do?hseq=46598&type=sogan&key=6011 – http://www.lse.ac.uk/GranthamInstitute/wp-content/uploads/laws/1647.pdf12 – http://www.moef.go.kr/nw/nes/detailNesDtaView.do?menuNo=4010100&searchNttId1=OLD_4020294&searchBbsId1=MOSFBBS_00000000002813 – http://www.moef.go.kr/com/cmm/fms/FileDown.do?atchFileId=ATCH_000000000003839&fileSn=314 – http://me.go.kr/home/file/readDownloadFile.do;jsessionid=bC6XpwGMToJc4qEXWU7x7Pmt.mehome1?fileId=186504&fileSeq=115 – http://www.me.go.kr/home/web/index.do?menuId=1026216 – http://www.me.go.kr/home/web/board/read.do?pagerOffset=10&maxPageItems=10&maxIndexPages=10&searchKey=&searchValue=&menuId=286&orgCd=&boar-
dId=883200&boardMasterId=1&boardCategoryId=&decorator=17 – https://www.law.go.kr/LSW/lsInfoP.do?efYd=20200601&lsiSeq=215913&ancYd=20200324&nwJoYnInfo=N&ancYnChk=0&ancNo=17104&chrClsCd=010202&efGubun=Y#0000 18 – https://ors.gir.go.kr/home/board/read.do?menuId=2&boardMasterId=4&boardId=44
← CONTENT

FACT
SHEE
TS –
03
SaiT
aMa
Stat
us R
epor
t 202
1IC
AP
141
ETS DESCRIPTIONSaitama Prefecture’s ETS was established in April 2011 as part of the ‘Saitama Prefecture Global Warming Strategy Promo-tion Ordinance.’ Large buildings and factories in Saitama Prefecture covered under the program are required to reduce emissions below a facility-specific baseline. They are assigned a higher or lower target, depending on factors such as expected energy efficiency gains and the extent to which they consume energy supplied by other facilities.
Saitama’s ETS is linked to Tokyo’s Cap and Trade Program.
YEAR IN REVIEWIn fiscal year 2018, the Saitama ETS achieved a 29% reduction in emissions below base-year emissions.
In April 2020, the Saitama ETS entered its third compli-ance period (FY2020–2024), which requires facilities to reduce emissions by 20% or 22% below baseline emissions, depending on their category.
The ‘Zero Carbon Saitama’ initiative was announced in 2018 and includes cooperation with the Tokyo 2020 Organizing Committee to fully offset the GHG emissions from the (post-poned) Tokyo 2020 Olympic and Paralympic Games. As part of this initiative, companies may donate excess credits from the ETS. Companies that do not possess credits but still wish to make donations may purchase credits from larger facili-ties within the ETS. Credit donations to the program closed in September 2020.
Background Information
GHG REDUCTION TARGETSBY 2030: 26% reduction from 2013 levels (Saitama Prefecture Global Warming Countermeasures Action Plan Second Phase)
ETS Size
COVERED EMISSIONS7.5 MtCO2 (Verified emissions 2017)
GHGs COVERED CO2 only
SECTORS AND THRESHOLDSConsumption of fuels, heat, and electricity in commercial and industrial buildings
INCLUSION THRESHOLDS: Facilities that consume the energy equivalent of at least 1,500kL of crude oil for three consecutive years.
* The overall emissions figure for Saitama Prefecture is higher than the total of the emissions by sector because the former includes all GHGs in Saitama, whereas the emissions by sector only measures CO2 emissions.
SAITAMATarget Setting Emissions Trading System in Saitama
COVERAGE7.5 MtCO2 (2018)
GASES CO2 only
OFFSETS AND CREDITSdomestic
ALLOCATIONFree allocation: Grandfathering
20%
Covers large buildings and factories
Linked to Tokyo Cap-and-Trade Program since 2011 launch
SECTORS:
In force
Under development
Under consideration
INDUSTRY
BUILDINGS
industrial processes 11.2 (32%)Transport 9.4 (27%)Commercial 4.8 (14%)residential 9.1 (26%)
OVERALL GHG EMISSIONS (excluding LULUCF) 37.2 MtCO2e (2017)*
OVERALL CO2 EMISSIONS BY SECTOR (MtCO2e)
← CONTENT

FACT
SHEE
TS –
03
SaiT
aMa
Stat
us R
epor
t 202
1IC
AP
142
POINT OF REGULATIONDownstream
NUMBER OF ENTITIES~608 facilities (first compliance period): • Office/commercial buildings: ~180• Factories: ~428
CAPThe cap is aggregated from the bottom up, based on facil-ity-level “baselines” which are calculated using base-year emissions and a compliance factor (see “Allocation” section).
The bottom-up cap for the first compliance period (FY2011- FY2014) was 33.3 MtCO2
Phases & Allocation
TRADING PERIODSFIRST TRADING PERIOD: 1 April 2012 to 30 September 2016SECOND TRADING PERIOD: 1 April 2015 to 30 September 2021THIRD TRADING PERIOD: 1 April 2020 to 30 September 2026
The Saitama ETS has both trading periods and compliance periods (see “Compliance” section). The trading period is defined as the compliance period plus an additional 18-month adjustment period, during which time entities may continue to trade credits in order to reach their targets for the corresponding compliance period.
ALLOCATIONUnder the Saitama ETS, each facility has its own cap, which serves as the “baseline” from which it must achieve its reduc-tion target. Baselines for facilities are set according to the following formula: Base-year emissions x (1 – compliance factor) x compliance period (5 years). The compliance factor for each period is determined based on regulations estab-lished by the Governor of Saitama Prefecture.
Base-year emissions are the average emissions of any three consecutive years between FY2002 and FY2007, as chosen by each entity. Credits are issued to facilities whose emissions fall below the baseline.
Baselines for new entrants are based on past emissions (the average of any three consecutive years of emissions from four years prior to the start of the compliance period up until the year before the start of the compliance period) or on emis-sions intensity standards.
COMPLIANCE FACTOR: First period (FY2011-FY2014): 8% or 6% reduction below base-year emissionsSecond period (FY2015-FY2019): 15% or 13% reduction below base-year emissions
Third period (FY2020-FY2024): 22% or 20% reduction below base-year emissions
The higher compliance factor applies to commercial build-ings, as well as to district heating and cooling (DHC) plant facilities. The lower compliance factor applies to other facil-ities, such as commercial buildings that use DHC for more than 20% of the entire energy consumption, and factories.
In the third compliance period, for large facilities owned by small and medium-sized enterprises, the compliance factor is reduced to three quarters of the 22% or 20%, depending on category. Similarly, in medical facilities where electricity is vital to preserve life and health, the compliance factor is two percentage points lower than the 22% or 20% category.
EMISSIONS REDUCTION METHODS:• Renewable energy: When covered facilities generate elec-
tricity from renewable sources for their own use, they can deduct this amount of electricity from the total energy usage of the facility to be reported.
• Low carbon electricity: In order to evaluate energy effi-ciency efforts of the covered facilities, CO2 emissions factors of electricity suppliers are fixed during each compli-ance period. When covered facilities procure electricity from suppliers with lower emissions factors, they can reduce the difference between these emission factors from their emissions to be reported to Saitama Prefecture from the third compliance period.
Facilities demonstrating outstanding performance in emis-sions reduction, as well as in the introduction, use, and management of energy equipment, are certified as top-level facilities that receive lower compliance factors according to their rate of progress, for a period of five years. The certifica-tion standards represent the highest-level energy-efficiency measures currently feasible, stipulating more than 200 different energy-saving measures.
← CONTENT

FACT
SHEE
TS –
03
SaiT
aMa
Stat
us R
epor
t 202
1IC
AP
143
Flexibility
BANKING AND BORROWING Banking is allowed only between two consecutive compli-ance periods.
Borrowing is not allowed.
OFFSETS AND CREDITSCredits from five offset types are allowed in the Saitama ETS.
SMALL AND MID-SIZE FACILITY CREDITS: Emissions reduc-tions from non-covered small and medium-sized facilities in Saitama Prefecture.
Quantitative Limits: None
OUTSIDE SAITAMA CREDITS: Emission reductions achieved from large facilities outside of Saitama Prefecture. Large facilities are those with an energy consumption of 1,500kL of crude oil equivalent or more in a base year, and with base-year emissions of 150,000t or less.
Quantitative Limits: Credits are issued only for the reduc-tion amount that exceeds the compliance factor. These credits can be used for compliance for up to one-third of offices’ reduction obligations. Factories can use up to 50%.
RENEWABLE ENERGY CREDITS: Renewable energy credits generated under the Saitama ETS encompass the following types: Environmental Value Equivalent, Renewable Energy Certificates, and New Energy Electricity, generated under the Renewable Portfolio Standard Law. Credits from solar (heat,
electricity), wind, geothermal, or hydro (under 1,000 kW) electricity production for use under the Saitama ETS were converted to 1.5 times the value of regular credits until the end of the second compliance period. From the third compli-ance period, they are converted on a 1 to 1 basis. Credits from biomass (biomass rate of 95% or more, black liquor is excluded) are also converted with factor 1.
Quantitative Limits: None
TOKYO CREDITS (VIA LINK): • Excess Credits: Emissions reductions from facilities with
base-year emissions of 150,000 tonnes or less. Issuance of credits from FY2015.
• Small and mid-size Facility Credits: Issued by Saitama Prefecture. Issuance of credits from FY2012.
Quantitative Limits: None
FOREST ABSORPTION CREDITS: Credits from forests inside Saitama Prefecture are counted at 1.5 times the value of regular credits. Others are converted with the factor 1.
Quantitative Limits: None
All offsets must be verified by verification agencies.
MARKET STABILITY PROVISIONS In general, Saitama Prefecture does not use market stability provisions.
Compliance
COMPLIANCE PERIODFIRST COMPLIANCE PERIOD: FY2011–2014SECOND COMPLIANCE PERIOD: FY2015–2019THIRD COMPLIANCE PERIOD: FY2020–2024
Covered entities must submit a global warming countermea-sures plan preparation report and implementation status report by 31 July of the first fiscal year of the compliance period. Every year thereafter, operators must submit a new global warming countermeasure plan and emissions report by 31 July.
Compliance instruments must be submitted and the prede-termined target achieved by the end of the 18-month adjust-ment period, 30 September of the second fiscal year after the end of the compliance period.
The next compliance period coincides, then, with the adjust-ment period for 18 months and begins immediately after the preceding period.
MRV REPORTING FREQUENCY: Annual emissions reporting, including emission reduction plans. All seven GHGs must be monitored and reported: CO2, CH4, N2O, PFCs, HFCs, SF6, and NF3.
VERIFICATION: These reports require third-party verification by the end of the adjustment period.
FRAMEWORK: These are based on ‘Saitama Monitoring/Reporting Guidelines’ and ‘Saitama Verification Guidelines.’
ENFORCEMENTIf the reduction target is not achieved, the name of the company is made public and the insufficient reduction amount added to the reduction amount of the following compliance period.
Regardless of whether the target is achieved, the global warming countermeasures plan and implementation status report of each facility are published on Saitama Prefecture’s website every year.
← CONTENT

FACT
SHEE
TS –
03
SaiT
aMa
Stat
us R
epor
t 202
1IC
AP
144
Linking
LINKS WITH OTHER SYSTEMSLinking with the Tokyo Cap and Trade Program started in April 2011. Tokyo and Saitama credits are officially eligible for trade between the two jurisdictions. During the first compliance period, 15 credit transfers took place between the Saitama Prefecture and Tokyo (nine cases from Tokyo to Saitama, six cases from Saitama to Tokyo).
Other Information
INSTITUTIONS INVOLVEDSaitama Prefectural Government
IMPLEMENTING LEGISLATIONSaitama Prefecture Global Warming Strategy Promotion Ordinance1
Regulation on Saitama Prefecture Global Warming Strategy Promotion Ordinance2
1 – http://www3.e-reikinet.jp/saitama-pref/d1w_reiki/42190101000900000000/42190101000900000000/42190101000900000000.html2 – https://en3-jg.d1-law.com/saitama-pref/d1w_reiki/42190210001900000000/42190210001900000000/42190210001900000000.html
← CONTENT

FACT
SHEE
TS –
03
Shan
Ghai
Stat
us R
epor
t 202
1IC
AP
1451 – China is still in the exploratory and research stage of carbon futures trading, and according to the “Administrative Regulations on Futures Trading” document, futures trading
can only be traded on approved professional futures exchanges. Therefore, regional ETS pilots cannot introduce futures trading. However, a few of them have developed carbon forward trading products with their own characteristics.
SHANGHAIShanghai Pilot Emissions Trading System
CAP158 MtCO2 (2019)
GASES CO2 only
OFFSETS AND CREDITSdomestic
ALLOCATIONFree allocation: Grandparenting Free allocation: Benchmarking auctioning
AVERAGE 2020 PRICECnY 40.11 (USd 5.81)
TOTAL REVENUECnY 102.2 million (USd 14.8 million) since beginning of program, CnY 84.4 million (USd 12.2 million) collected in 2020 SECTORS:
In force
Under development
Under consideration
POWER
INDUSTRY
DOMESTIC AVIATION
TRANSPORT
BUILDINGS
Broad sector coverage with 100% compliance rate since launch
Active offset trading market, pioneered allowance spot forward trading
Scope expansion through lowering the threshold (mainly)
Leading the development of a national trading platform
ETS DESCRIPTIONShanghai was the second Chinese region to start its pilot ETS in November 2013 and has concluded seven compliance years to date. The pilot covers more than half of the city’s emissions, including power, industry, and non-industrial sectors such as building, aviation, and shipping. It is the only pilot that has achieved 100% compliance rate continuously since its launch. In 2016, Shanghai expanded its ETS coverage by adding the shipping sector, as well as lowering the partic-ipation threshold of power plants and industries (which were included in the 2013–2015 phase) to 10,000 tCO2/year.
Shanghai is the most active among the Chinese pilots in terms of offset credits trading. It also pioneered allow-ance spot forward trading in China.1 In January 2017, the Shanghai Environmental and Energy Exchange and the Shanghai Clearing House jointly launched the over-the-counter ‘Shanghai Emission Allowance Forward’ contract, with central counterparty clearing, as an innovative finan-cial product that serves a purpose similar to carbon finan-cial derivatives. Shanghai has also carried out various other carbon finance innovations such as repurchases, carbon funds, carbon trusts, CCER pledge loans, green bonds, and carbon margin trading.
In December 2017, Shanghai was selected to lead the devel-opment of the trading platform for the national ETS.
In early 2019, the ETS-related responsibilities in Shanghai completed the transition from the Development and Reform Commission (DRC) to the Ecology and Environment Bureau (EEB), as a result of the governance restructuring across China.
YEAR IN REVIEWThe Shanghai EEB released the 2019 allocation plan in June 2020. No significant changes were implemented compared to the allocation plan of the previous year.
In 2020, the Shanghai pilot also opened its auctions to insti-tutional investors for the first time. Before that, participation in the Shanghai auctions had been limited to the compliance entities. By diversifying the participants in the auctions, the Shanghai pilot further increases its liquidity and promotes price discovery.
The Shanghai ETS completed its compliance work for 2019 in October 2020, after some delay due to the COVID-19 pandemic, reporting its 7th consecutive 100% compliance rate.
Background Information
GHG REDUCTION TARGETSBY 2020: 20.5% reduction in carbon intensity compared to 2015 levels. The total CO2 emissions to be limited within 250 million tonnes (13th Five-Year Plan)
BY 2025: pledged to peak the total and per capita CO2 emis-sions (Shanghai Urban Master Plan 2017–2035)BY 2040: ~15% reduction in CO2 emissions compared to the peak level (Shanghai Urban Master Plan 2017–2035)
OVERALL GHG EMISSIONS (excluding LULUCF) 297.7 MtCO2e (2012)
← CONTENT

FACT
SHEE
TS –
03
Shan
Ghai
Stat
us R
epor
t 202
1IC
AP
146
ETS Size
COVERED EMISSIONS
GHGs COVEREDCO2 only
SECTORS AND THRESHOLDSAirports, domestic aviation, chemical fibers, chemicals, commercial, power and heat, water suppliers, hotels, finan-cial, iron and steel, petrochemicals, ports, shipping, nonfer-rous metals, building materials, paper, railways, rubber, and textiles.
INCLUSION THRESHOLDS:For power and industry: Either 20,000 tCO2/year or 10,000 tonnes of coal equivalent (tce)/year; and those that already participated in the 2013–2015 phase with 10,000 tCO2/year or 5,000 tce/year.
For Transport: Either 10,000 tCO2/year or 5,000 tce/year (aviation and ports), 100,000 tCO2/year or 50,000 tce/year (shipping).
For Buildings: Either 10,000 tCO2/year or 5,000 tce/year.
POINT OF REGULATIONDownstream
Both direct and indirect emissions from electricity and heat consumption are covered.
NUMBER OF ENTITIES313 (2019), including 280 existing and 33 new entities
CAP158 MtCO2 (2019, including reserves)
Phases & Allocation
TRADING PERIODSTwo trading periods: • the first period ran between 2013 and 2015; • the second period started in 2016, with no specific ending
year.2
ALLOCATIONFREE ALLOCATION: Free allocation based on sector-specific benchmarks (for the electricity and heat producers, and elec-tricity grid sector).
Grandfathering based on historic emissions intensity for part of the industrial sectors, aviation, ports, shipping, and water suppliers, generally based on the previous three years’ data.
Grandfathering based on historic emissions for airports, build-ings, commercial sector, and part of the industrial sectors with complex products or considerable change in emission boundary, generally based on the previous three years’ data.
Ex-post allocation adjustments, e.g., on the basis of produc-tion data, are applied for those with historic intensity or benchmarking allocations.
AUCTIONING: A small share of the annual cap could be auctioned. The main purpose of auctions is to provide compliance entities with additional supply to meet their compliance demand. To date, auctions have been held on an ad hoc basis. One auction was held in each of the following years: 2014, 2016, 2018, and 2019.
In 2020, Shanghai held two auctions: one in August and the other in October. The floor prices were set differently: for the first auction, which was open to institutional investors and compliance entities, the floor price was set at the market weighted average price of all trading days in the second quarter of 2020. For the second auction, which was open to the compliance entities only, the floor price was set at 1.1 times the market weighted average price of all trading days from December 1, 2019 to September 30, 2020. The auctions offered 2 million tonnes of allowances each, with 100% and 5.9% of them cleared at the floor price of CNY 39.61 (USD 5.74) and CNY 44.27 (USD 6.42) respectively.
~57%
2 – In the short term, the existing Chinese regional carbon markets are expected to operate parallel to the national Chinese carbon market. Over the medium to long term, they are expected to be integrated into the national market, once it is fully operational.
← CONTENT

FACT
SHEE
TS –
03
Shan
Ghai
Stat
us R
epor
t 202
1IC
AP
147
3 – This region covers Shanghai, Jiangsu, Zhejiang, and Anhui. 4 – In some recent years, the compliance deadlines have been postponed to later dates, for reasons such as the COVID-19 pandemic and other factors. 5 – http://www.tanpaifang.com/tanshui/2012/0307/155.html 6 – http://www.tanpaifang.com/tanjiaoyi/2013/0712/22185.html 7 – https://sthj.sh.gov.cn/hbzhywpt2025/20200630/20348b1adf354c9ab73b7a461c9ec0a9.html
Flexibility
BANKING AND BORROWING Banking is allowed both within and across trading periods, with some restrictions for the latter. For banked allowances from the first trading period (2013–2015), only one-third could be used per year between 2016 and 2018 by compliance enti-ties; allowances are fully bankable for institutional investors.
Borrowing is not allowed.
OFFSETS AND CREDITSQUANTITATIVE LIMIT: Domestic project-based carbon offset credits—CCERs—are allowed. For compliance year 2019, the use of CCER credits was limited to 3% of the verified emis-sions, of which up to 2% was for credits generated outside the Yangtze River Delta region.3 Between 2016 and 2018, the use of CCER credits was limited to 1% of the annual alloca-tion. Between 2013 and 2015, the limit was 5%.
QUALITATIVE LIMIT: Credits for reductions that were realized before January 2013 cannot be used for compliance. Credits from hydro projects are not allowed.
MARKET STABILITY PROVISIONS EXCHANGE: Depending on transaction types, if prices vary more than 10% or 30% in one day, the Shanghai Environment and Energy Exchange can institute price stabilization measures such as temporarily suspending trading or imposing holding limits. RESERVE: A small share of the annual cap can be kept in a reserve for auctioning before the end of the annual compli-ance cycle as a market stability measure (see “Allocation” section).
Compliance
COMPLIANCE PERIODOne year (1 January to 31 December): covered entities have until 30 June of the following year to surrender allowances.4
MRVREPORTING FREQUENCY: Annual reporting of CO2 emissions.
VERIFICATION: Third-party verification is required. In addi-tion, the government also conducts quality checks.
FRAMEWORK: The Shanghai government has released general rules for monitoring and reporting as well as sector-specific guidelines for the following sectors: iron and steel, electricity and heat, chemicals, nonferrous metals, non-metallic mineral products, textiles and paper, aviation, shipping, large buildings (hotels, commercial, and financial), and transport stations.
ENFORCEMENTPenalties for failing to submit an emissions report or verifica-tion report on time or providing fraudulent information range from CNY 10,000 (USD 1,449) to CNY 50,000 (USD 7,245).
Between CNY 50,000 (USD 7,245) and CNY 100,000 (USD 14,491) can be imposed for noncompliance, in addition to surren-dering the adequate amount of allowances. Further sanc-tions may also be imposed, such as entry into the credit record of the company, publication on the internet, cancel-ation of ability to access special funds for energy conserva-tion, and emissions reduction measures.
Other Information
INSTITUTIONS INVOLVEDShanghai Ecology and Environment Bureau (competent authority)Shanghai Environment and Energy Exchange (trading platform) Shanghai Information Center (registry)
USE OF REVENUESThe revenues are submitted to the general municipality budget.
IMPLEMENTING LEGISLATIONShanghai Pilot ETS Implementation Plan Trial5 Measures for Management of Emissions Trading in Shanghai6
Shanghai EEB- Allocation Plan for Vintage 2019 (including list of covered entities)7
← CONTENT

FACT
SHEE
TS –
03
ShEn
ZhEn
Stat
us R
epor
t 202
1IC
AP
148
SHENZHENShenzhen Pilot Emissions Trading System
CAP31.45 MtCO2 (excluding buildings, 2015)1
GASES CO2 only
OFFSETS AND CREDITS domestic
ALLOCATIONFree allocation: GrandparentingFree allocation: Benchmarking
AVERAGE 2020 PRICECnY 23.91 (USd 3.46)
TOTAL REVENUESince beginning of program: CnY 2.6 million in 20142 (USd 380,000), no auctions were held in 2020
ETS DESCRIPTIONThe Shenzhen Pilot ETS began in June 2013 and was the first of the Chinese pilot ETSs to start operation. It is the only Chinese pilot at the sub-province level, and it covers a broad scope across the energy, industry, building, and trans-port sectors. The Shenzhen Pilot ETS covers a total of ~700 entities. A unique feature of this pilot ETS is its legal basis: although the majority of pilots are regulated by subnational government orders by the executive body of the government, the Shenzhen Pilot ETS is regulated by a dedicated ETS bill passed by its municipal legislator, the Shenzhen People’s Congress. This provides more legal stability.
Shenzhen is one of the most active regional markets in China, despite its relatively small size compared to other pilots. As of July 2018, its accumulated transaction amount had reached CNY 1.091 billion (USD 160 million), with total volume of 35.7 million tonnes, which made it one of the few pilots in China to reach CNY one billion (USD 145 million). By end of 2020, Shenzhen’s cumulative trading volume and turnover amounted to 58.06 million tonnes and CNY 1.378 billion (USD 200 million) respectively. Shenzhen ETS pilot is open to diversified market participants, including covered entities and institutional as well as individual (domestic and foreign) investors.
Shenzhen also has pioneered cross-regional cooperation. In 2014, Shenzhen and Baotou signed the ‘Memorandum of Strategic Cooperation on the Construction of Carbon Trading Systems.’ As a consequence of this, six companies in Baotou City of the Inner Mongolia Autonomous Region were covered by the Shenzhen Pilot ETS on a voluntary basis for one compliance year starting in June 2016.
In early 2019, the ETS-related responsibilities in Shenzhen completed the transition from the Development and Reform Commission to the Ecology and Environment Bureau (EEB)3, as a result of the governance restructuring across China.
YEAR IN REVIEW In May 2020, Shenzhen EEB released the ‘Notice on Carrying out ETS Work for Compliance Year 2019’ which included an updated list of covered entities and adjusted the reporting, verification, and compliance schedule. However, Shenzhen’s allocation plans since 2013 have not been made publicly available.
Due to the COVID-19 pandemic, the Shenzhen ETS post-poned the 2019 compliance deadline for its system from the end of June to the end of September 2020. In October 2020, the Shenzhen EEB announced three companies had failed to comply, while announcing that the remaining 704 covered entities had successfully completed their 2019 compliance, achieving another high compliance rate of over 99%.
Background Information
GHG REDUCTION TARGETSBY 2020: 45% reduction in carbon intensity compared to 2005 (13th Five-Year Plan)BY 2022: Pledged to peak its CO2 emissions by 2022 (political pledge made by a Shenzhen government leader in 2015)
1 – No more recent data has been made public by the competent authority. 2 – The auction’s objective was to increase market supply and price stability, with the participation of covered entities being voluntary, and not as a means of allowance
allocation in which covered entities have to purchase a certain percentage of their allocation via auction.3– EEB’s predecessor was the Human Settlements and Environment Commission.
One of two Chinese pilots with ETS bill passed by regional congress
Relatively active market despite small market size
Sectoral expansion to port, airport, subway, and public transportation sectors
Cross-regional trading pioneered
POWER
SECTORS:
In force
Under development
Under consideration
INDUSTRY
TRANSPORT
BUILDINGS
OVERALL GHG EMISSIONS (excluding LULUCF) 83.45 MtCO2e (2010)
← CONTENT

FACT
SHEE
TS –
03
ShEn
ZhEn
Stat
us R
epor
t 202
1IC
AP
1494 – In the short term, the existing Chinese regional carbon markets are expected to operate parallel to the national Chinese carbon market. Over the medium to long term, they are expected to be integrated into the national market, once it is fully operational.
ETS Size
COVERED EMISSIONS
GHGs COVERED CO2 only
SECTORS AND THRESHOLDSPower, water, gas, manufacturing sectors, buildings, port and subway sectors, public buses, and other non-transport sectors.
INCLUSION THRESHOLDS: Annual emissions of 3,000 tCO2/year for enterprises; 10,000m2 for large public buildings and government buildings.
POINT OF REGULATIONDownstream
Both direct and indirect emissions from electricity, heat, cooling, and steam consumption are covered.
NUMBER OF ENTITIES707 (2019)706 (2020)
CAP 31.45 MtCO2 (excluding buildings, 2015) for the existing entities.
In addition, the government sets aside reserves for the new entrants (2%) and market stability measures (2%).
Phases & Allocation
TRADING PERIODS2013 and ongoing4
ALLOCATION Allowances are largely distributed for free and allowance allocation is adjusted ex-post, based on output data.
FREE ALLOCATION, BENCHMARKING: Benchmarking is applied to the water, power, and gas sectors based on sectoral historical emissions intensity.
FREE ALLOCATION, GRANDPARENTING: Grandparenting is applied to port and subway sectors, public buses, and other non-transport sectors based on the entity’s historical emis-sions intensity.
AUCTIONING: Although the ‘Interim Measure for the Admin-istration of Carbon Emission Trading of Shenzhen’ document states that at least 3% of allowances should be auctioned, this has not yet been implemented. So far, only one auction has been held (in June 2014); its purpose was to increase market supply and price stability.
Flexibility
BANKING AND BORROWINGBanking is allowed.
Borrowing is not allowed.
Unlike some other pilots, Shenzhen releases its annual allow-ances before the compliance date of the previous vintage. Nevertheless, entities are not allowed to use allowances of the following year for the purpose of previous vintage compliance.
OFFSETS AND CREDITSQUANTITATIVE LIMIT: Domestic project-based carbon offset credits (CCERs) are allowed. The use of CCER credits is limited to 10% of the annual compliance obligation.
QUALITATIVE LIMIT: Credits from hydro projects are not eligible, and additional geographic restrictions apply to the use of certain CCERs.
MARKET STABILITY PROVISIONS RESERVE: 2% of the total cap is kept as a government reserve for market stabilization.
INTERVENTION: In case of market fluctuations, the Shen-zhen EEB can sell extra allowances from the reserve at a fixed price. Such allowances can be used only for compliance and cannot be traded. The government can also buy back up to 10% of the total cap. Once they are bought back, allowances can be also used for the market stability auctions.
~40%
← CONTENT

FACT
SHEE
TS –
03
ShEn
ZhEn
Stat
us R
epor
t 202
1IC
AP
150
Compliance
COMPLIANCE PERIODOne year (1 January to 31 December): covered entities have until 30 June of the following year to surrender allowances.
MRVREPORTING FREQUENCY: Annual reporting of CO2 emissions to the ETS competent authority, using different tiers of emis-sion factors depending on the size of the company. A quar-terly emissions report is also submitted. In addition, covered industrial entities must annually submit a statistical indicator report covering their production data to the municipality’s statistics department.
VERIFICATION: Third-party verification of the emissions report is required. Covered entities cannot use the same verifiers for three consecutive years. In addition, the govern-ment conducts further random checks of emission reports and verification reports. The proportion of these checks must not be less than 10% of the total number of covered entities. The competent authority may assign this inspection work to a specialized agency.
FRAMEWORK: Shenzhen has released two documents:• a general guiding document in the form of regional stan-
dards on monitoring and reporting; and • a guiding document on monitoring and reporting of the
building sector.
ENFORCEMENTCovered entities providing false information can be fined for the difference between reported and actual emissions at three times the average allowance price of the past six months. Penalties for disturbing the market order can cost up to CNY 100,000 (USD 14,491). Covered entities failing to surrender enough allowances to match their emissions are fined three times the average market price of the past six months. The missing allowances can be withdrawn from the account of the company or deducted from next year’s alloca-tion. Other nonfinancial penalties include public reporting, reporting to relevant credit information of public banks, disqualification from financial subsidies (for five years), and a record entered in the State-Owned Enterprise performance assessment system.
Other Information
INSTITUTIONS INVOLVED Shenzhen Environment and Ecology Bureau (competent authority; registry)China Shenzhen Emissions Exchange (trading platform)
EVALUATION/ETS REVIEWNo formal evaluation has been conducted. Research on improving the Shenzhen ETS has been undertaken every year, funded by the Shenzhen government.
IMPLEMENTING LEGISLATIONShenzhen Special Economic Zone ETS Bill5
Interim Measures for Management of Emissions Trading in Shenzhen6
Shenzhen DRC—Notice of Carrying Out Emissions Trading Work for Vintage 20167 Shenzhen EEB—Notice on Carrying out ETS Work for Compli-ance Year 20198
5 – http://www.cerx.cn/szPolicy/377.htm 6 – http://www.cerx.cn/szPolicy/385.htm7 – http://www.tanpaifang.com/zhengcefagui/2016/091856419.html 8 – http://www.sz.gov.cn/cn/xxgk/zfxxgj/tzgg/content/post_7650474.html
← CONTENT

FACT
SHEE
TS –
03
TaiW
an, C
hina
Stat
us R
epor
t 202
1IC
AP
151
The 2015 ‘GHG Reduction and Management Act’ calls for ETS implementation
The Act is currently being revised
Mandatory GHG reporting program in place
TAIWAN, CHINA
In July 2015, Taiwan, China enacted the ‘Greenhouse Gas Reduction and Management Act’ (the Act) which legis-lates a 50% emissions reduction target for 2050 compared to 2005 GHG levels. The Act also mandates the setting of regulatory mitigation goals in stages. In this context, the Act stipulates that the Taiwanese Environmental Protection Administration (TEPA) will implement a domestic cap-and-trade scheme by considering the UNFCCC and its agree-ments, or relevant decisions by international conventions. This is further referred to in the ‘Climate Change Action Guideline 2017.’ The Act also mandated TEPA to develop the ‘GHG Reduction Action Plan,’ which outlines details on how to implement the mitigation policies. It includes five-year regu-latory goals for both national and sectoral GHG emissions, as well as implementation strategies in the form of eight policy packages. Published in March 2018, the plan proposes to implement a cap-and-trade system, calculate baseline emis-sions, and set up regulations—albeit without a precise timeline.
On this basis, the central industry competent authorities of the six major sectors (energy, manufacturing, transportation, residential and commercial, agriculture, and environment) approved the ‘GHG Emissions Control Action Programs’ in October 2018. A series of subsidiary regulations have been formulated. Mandatory emissions reporting for entities with annual emissions above 25,000 tCO2e from certain sectors has been ongoing since 2014. Subsidiary regulations also include the ‘2018 Regulations Governing GHG Offset Program Management,’ which provide an opportunity for enterprises to acquire carbon offset credits. TEPA is in the process of revising the Act. A carbon fee, carbon tax, and ETS are all under consideration. Regulatory discussions are pending on whether the carbon fee will be implemented first, as well as on how it could be transi-tioned to the ETS in the future and/or co-exist as a complemen-tary mechanism.
GHG REDUCTION TARGETS BY 2020: 2% below 2005 GHG levels (TEPA)BY 2025: 10% below 2005 GHG levels (TEPA)
BY 2030: 20% reduction from BAU levels (TEPA)BY 2050: 50% below 2005 GHG levels (the Act)
Background Information
OVERALL GHG EMISSIONS (excl. LULUCF) 293.1 MtCO2e (2016)
OVERALL GHG EMISSIONS BY SECTOR (MtCO2e)Energy 264.7 (90%)industrial processes 21.7 (7%)agriculture 2.7 (1%)Waste 4.0 (1%)
Other Information
OFFSETS The Act stipulates that the use of offset credits should give priority to domestic efforts.
MRV REPORTING FREQUENCY: Annual reporting of GHGs (CO2, CH4, N2O, SF6, NF3, PFCs, HFCs, and NF3) for entities from certain sectors (power, steel, petrochemical, cement, and manufacturing of semiconductors and flat panel displays) with annual emissions greater than 25,000 tCO2e. Currently, 293 entities are under the mandatory reporting scheme.
VERIFICATION: Third-party verification is required.
FRAMEWORK: GHG reporting under the ‘Air Pollution Control Act’ has been possible on a voluntary basis since 2004 and became mandatory in 2014. Since 2016, GHG reporting and the inventory program is mandatory under the ‘GHG Accounting and Registration Regulations,’ which are authorized by the Act.
INSTITUTIONS INVOLVED Taiwanese Environmental Protection Administration (TEPA)
IMPLEMENTING LEGISLATIONGreenhouse Gas Reduction and Management Act (2015)1 Climate Change Action Guidelines2 2015 GHG Inventory (Executive Summary)3
In force
Under development
Under consideration
1 – https://law.moj.gov.tw/ENG/LawClass/LawAll.aspx?pcode=O00200982 – https://adapt.epa.gov.tw/eng/TCCIP-1-D/TCCIP-1-D-6_en.html 3 – https://unfccc.saveoursky.org.tw/nir/2015nir/uploads/00_abstract_en.pdf
← CONTENT

FACT
SHEE
TS –
03
Thai
Land
Stat
us R
epor
t 202
1IC
AP
152
The ‘12th National Economic and Social Development Plan (2017–2021)’ of Thailand calls for several climate change miti-gation measures, including the development of a domestic carbon market. The ‘National Climate Change Master Plan (2015–2050)’ also refers to carbon markets as a potential mechanism to reduce GHG emissions in the private sector. Most recently, the ‘National Reform Plan (2018)’ mandates the Thai government to develop an economic instrument, such as a cap-and-trade system, to incentivize the private sector to reduce emissions. The specific instrument will be considered as part of the policy and legislative process following the formulation of the framework ‘Climate Change Act,’ which is expected to be proposed for Cabinet consider-ation in 2021.
Since 2013, Thailand Greenhouse Gas Management Organization (Public Organization) (TGO) has developed an MRV system and basic trading infrastructures under the Thailand Voluntary Emissions Trading Scheme (Thailand V-ETS). The first three-year pilot phase (2015–2017) of this voluntary pilot program aimed at: testing the MRV system for four GHG-intensive industrial sectors (cement, pulp and paper, iron and steel, and petrochemical); setting a cap for facilities’ direct and energy-related indirect emissions; and testing allocation methods by granting allowances to covered facilities. The second pilot phase (2018–2020) further tested the MRV system, the registry and trading platform, with
five additional industrial sectors (petroleum refinery, glass, plastic, food and feed, and ceramics). Like in the previous phase, allocation was tested, with allowances granted to each sector according to their GHG reporting and target-set-ting results. Trading was also practiced on the demonstra-tion-version of the trading platform.
In 2020, MRV was developed for another three sectors (beverage and sugar, textiles, and flat glass) and additional sector-specific guidelines were developed and improved. Furthermore, many capacity-building and outreach activ-ities were held, to introduce the ETS concept to various stakeholders.
In 2021, TGO—in collaboration with its partner the Eastern Economic Corridor Initiative (Department of Industrial Promotion, Industrial Estate Authority of Thailand)—is devel-oping a strategic plan for ETS implementation in Thailand’s Eastern Economic Corridor region. Under this plan, a pilot ETS will be implemented, including key ETS features and a trading platform.
In addition, under the Thailand PMR Program, TGO has conducted a study on the appropriate formulation of legisla-tion for a mandatory ETS. In 2020, TGO submitted a proposal for the draft ‘greenhouse gas reporting law for designated factories and buildings’ for consideration at the policy level.
Background Information
THAILAND
GHG REDUCTION TARGETSBY 2030: 20% reduction compared to BAU (unconditional NDC); 25% reduction compared to BAU contingent on adequate and enhanced support (conditional NDC)
Other Information
INSTITUTIONS INVOLVED Thailand Greenhouse Gas Management Organization (Public Organization)
IMPLEMENTING LEGISLATION / REGULATION 12th National Economic and Social Development Plan (2017–2021)1
National Reform Plan2
1 – 1https://www.nesdc.go.th/ewt_w3c/ewt_dl_link.php?filename=EvaluationDriven&nid=96402 – https://plan.rmutr.ac.th/wp-content/uploads/2018/12/Plan_Reform.pdf
In force
National reform plan calls for the exploration of a domestic ETS
Voluntary ETS builds readiness on MRV system, registry, and trading platform
Planning ETS pilot implementation in the Eastern Economic Corridor region
Under development
Under consideration
OVERALL GHG EMISSIONS (excl. LULUCF) 397.27 MtCO2e (2016)
OVERALL GHG EMISSIONS BY SECTOR (MtCO2e)
Energy (excluding transport) 197.8 (51%)Transport 69.1 (18%)industrial processes 45.6 (12%)agriculture 63.9 (16%)Waste 12.6 (3%)
← CONTENT

FACT
SHEE
TS –
03
Tian
Jin
Stat
us R
epor
t 202
1IC
AP
153
TIANJINTianjin Pilot Emissions Trading System
CAP160–170 MtCO2 (2014)
GASES CO2 only
OFFSETS AND CREDITSdomestic
ALLOCATIONFree allocation: Grandparenting Free allocation: Benchmarking auctioning
AVERAGE 2020 PRICECnY 22.64 (USd 3.28)
TOTAL REVENUESince beginning of program: CnY 349.67 million (USd 50.7 million) revenue collected in 2020:CnY 240.88 million (USd 34.9 million)
ETS DESCRIPTIONTianjin launched its pilot ETS in December 2013 and has concluded seven compliance years so far. The system covers: heat and electricity production; iron and steel; petrochem-icals; chemicals; oil and gas exploration; papermaking; aviation; and building materials. Covered entities account for 50–60% of the city’s total emissions. Despite not having any financial penalties in place, Tianjin has achieved full or close to full compliance since its launch. 2019 saw changes to the governance of the Tianjin ETS as well as to the design of the system. With regards to gover-nance, responsibility for the Tianjin ETS was moved from the Tianjin Development and Reform Commission (DRC) to the Ecology and Environment Bureau (EEB). With regards to design, the Tianjin ETS was expanded to also cover enter-prises from the building materials, papermaking, and avia-tion sectors that previously only reported. Furthermore, allowance auctions were also held for the first time in 2019. These changes have indicated the regional EEB’s commit-ment to further improve the effectiveness and robustness of its regional carbon market.
YEAR IN REVIEWThe Tianjin EEB released the 2019 allocation plan at the end of that year. The main allocation methods are historical intensity and total emission-based free allocation through grandparenting. Entities receive 50% of their pre-allocation based on 2018 emissions data and the remaining as ex-post adjustments on the basis of real production data. The plan also states that entities covered by the national Chinese ETS within the compliance period will be excluded from the compliance in the Tianjin Pilot ETS; in this case, the regional government will also withdraw the corresponding allow-ances issued for these entities.
In June 2020, the Tianjin municipal government released the latest version of the ‘Tianjin Interim Measures for the Administration of Carbon Emissions Trading,’ which is the regulative document released every few years providing the legal basis for its regional carbon market. The document extended the Tianjin Pilot ETS until 30 June 2025. As well, the document introduces the following main changes:• relocating the responsibility of the regional ETS from the
Municipal DRC to its EEB; • adding air pollution control as one of the purposes; • explicitly excluding covered entities under the operational
national ETS from the Tianjin Pilot ETS; and • strengthening enforcement measures: companies failing
to surrender enough allowances to match their emissions will face deduction of double the amount of the gap in the next year’s allocation, and third-party verifiers found to not comply with regulations will be banned for three years.
Following the first auction in 2019, the Tianjin pilot held two auctions in 2020. The first auction for the 2019 compli-ance year was held in June, with two million allowances sold at prices between CNY 17.31 (USD 2.51) and CNY 21.55 (USD 3.12). The second, held in August, sold 812,573 allow-ances at CNY 26.24 (USD 3.80). In September 2020, the Tianjin pilot completed its 2019 compliance period with a 100% reported compliance rate, becoming the first Chinese pilot to conclude the 2019 compliance process. In December 2020, Tianjin released its 2020 allocation plan.1 According to the Chinese national ETS rules, regional markets that already have allocated allowances for 2019 and/or 2020 for the power sector will remain under the regional system for those years. This implies that the power sector entities that are overlapping between Tianjin and the national ETS will be covered under the regional carbon market in 2020 and moved to the national one from 2021 onwards.
POWER
INDUSTRY
DOMESTIC AVIATION
SECTORS:
Despite small number of regulated entities, covers more than half of the city’s emissions
High rates of compliance despite no financial penalties in place
Sectoral expansion to building materials, papermaking, and aviation sectors
In force
Under development
Under consideration
1 – This document, however, is not publicly available.
← CONTENT

FACT
SHEE
TS –
03
Tian
Jin
Stat
us R
epor
t 202
1IC
AP
154
Background Information
OVERALL GHG EMISSIONS (excl. LULUCF) 215 MtCO2e (2012)
GHG REDUCTION TARGETSBY 2020: 20.5% reduction in carbon intensity compared to 2015 levels (13th Five-Year Plan)
BY 2025: Pledged to peak its CO2 emissions by about 2025 (Tianjin Work Plan for Controlling Greenhouse Gas Emissions During the 13th Five-Year Plan Period)
ETS Size
COVERED EMISSIONS
GHGs COVEREDCO2
SECTORS AND THRESHOLDSHeat and electricity production, iron and steel, petrochem-icals, chemicals, oil and gas exploration, papermaking, aviation, and building materials.2
INCLUSION THRESHOLDS: 20,000 tCO2/year considering both direct and indirect emissions.
POINT OF REGULATIONDownstream
Both direct and indirect emissions from electricity and heat consumption are covered.
NUMBER OF ENTITIES113 (2019)
CAP160–170 MtCO2 (2014)
50%–60%
Phases & Allocation
TRADING PERIODS2013 and ongoing3
ALLOCATIONFREE ALLOCATION: Mainly free allocation through grandpar-enting based on either base year (for example, 2018 for the allocation of 2019 allowances) total emissions (for iron and steel, petrochemicals, chemicals, exploration for oil and gas, and aviation) or on emissions intensity (for heat and elec-tricity production, papermaking, and building materials). Benchmarking for new entrants and expanded capacity.
Ex-post allocation adjustments are applied, especially for those sectors that use benchmarks and emissions intensity.
AUCTIONING: A small share of the annual cap could be auctioned. Participation is voluntary and the purpose of auctions is mainly to provide compliance entities with additional supply to meet their compliance demand. To date, auctions have been held on an ad hoc basis. The Tianjin EEB held its first allowance auction in June 2019. Two million tonnes were on offer with the auction clearing at CNY 14.63/tonne (USD 2.12). Following the first auction in 2019, the Tianjin pilot held two auctions in 2020. The first auction for the 2019 compliance year was held in June, with two million allowances sold at prices between CNY 17.31 (USD 2.51) and 21.55 (USD 3.12). The second, held in August, sold 812,573 allowances at CNY 26.24 (USD 3.80).
2 – The last three sectors were added in 2019.3 – In the short term, the existing Chinese regional carbon markets are expected to operate parallel to the national Chinese carbon market. Over the medium to long term,
they are expected to be integrated into the national market, once it is fully operational.
← CONTENT

FACT
SHEE
TS –
03
Tian
Jin
Stat
us R
epor
t 202
1IC
AP
155
Flexibility
BANKING AND BORROWING Banking is allowed.
Borrowing is not allowed.
OFFSETS AND CREDITSQUANTITATIVE LIMIT: Domestic project-based China Carbon Offset Credits (CCERs) are allowed as well as Tianjin regional forestry offsets. The use of CCER credits is limited to 10% of the annual compliance obligation. For the 2019 compliance year, at least 50% of the credits must originate from Beijing, Tianjin, or Hubei.
QUALITATIVE LIMIT: Credits must stem from CO2 reduction projects, excluding hydro. They must be realized after 2013.
MARKET STABILITY PROVISIONS INTERVENTION: In case of market fluctuations, the Tianjin EEB can buy or sell allowances (on a fixed price or through auctioning) in order to stabilize the market.
Compliance
COMPLIANCE PERIODOne year (1 January to 31 December): covered entities have until 30 June of the following year to surrender allowances.4
MRVREPORTING FREQUENCY: Annual reporting of CO2 emissions.
VERIFICATION: Third-party verification is required. Covered entities cannot use the same verifiers for three consecutive years.
FRAMEWORK: The Tianjin DRC has released a guiding docu-ment on monitoring and reporting. The document includes sector-specific guidance for the covered sectors, which EEB – as the competent authority since 2019 – is continuing to improve.
ENFORCEMENTThere are no financial penalties for noncompliance. In case of noncompliance, companies are disqualified for three years for preferential financial support and other national supporting policies, e.g., on recycling economy, energy- saving measures, and emission reductions. In addition, since mid-2020, companies and third-party verifiers face further penalties. Companies failing to surrender enough allowances to match their emissions will face deduction of double the amount of the gap in the next year’s alloca-tion. Third-party verifiers found not to comply with regula-tions (e.g., in the case of false verification reports) will be banned from providing verification services for three years in Tianjin.
Other Information
INSTITUTIONS INVOLVED Tianjin Ecology and Environment Bureau (competent authority)Tianjin Climate Exchange (trading platform and registry) IMPLEMENTING LEGISLATIONTianjin Pilot ETS Implementation Plan5
Interim Measure for Management of Emissions Trading in Tianjin6
Interim Measure for Management of Emissions Trading in Tianjin (2020)7
Interim Measure for Management of Emissions Tianjin EEB – Allocation Plan for Vintage 20198
4 – The deadline was postponed in 2020 due to the COVID-19 pandemic.5 – http://www.cdmfund.org/10898.html6 – http://www.carbonmanager.net/media/carbonbutler/images/tianjin05.pdf 7 – https://www.chinatcx.com.cn/view/4253.html8 – https://www.chinatcx.com.cn/view/4127.html
← CONTENT

FACT
SHEE
TS –
03
TOKY
OSt
atus
Rep
ort 2
021
ICAP
156
TOKYOTokyo Cap-and-Trade Program
COVERAGE12.11 MtCO2 (2018)
GASES CO2 only
OFFSETS AND CREDITSdomestic
ALLOCATIONFree allocation: Grandfathering
AVERAGE 2020 PRICE~JpY 540 (USd 5.06)1
ETS DESCRIPTIONLaunched in April 2010, the Cap-and-Trade Program of the Tokyo Metropolitan Government (TMG) is Japan’s first manda-tory ETS and is linked to the Saitama ETS. Under the Tokyo ETS, large buildings, factories, heat suppliers, and other facilities that consume large quantities of fossil fuels are required to reduce emissions below a facility-specific baseline. Entities covered under the program are assigned a higher or lower target, depending on factors such as expected energy efficiency gains and the extent to which they consume energy supplied by other facilities. YEAR IN REVIEWIn March 2020, the TMG released emission data for fiscal year 2018 indicating that, on aggregate, emissions were reduced by 27% overall among covered entities during the second compliance period (FY2015–FY2019) compared to base-year emissions, overachieving the 15–17% target set for the period. The introduction of high-efficiency heat sources,
light fittings, and other equipment has been key to reducing emissions in the buildings sector. Buildings have continued to decrease emissions despite an increase in gross floor space, indicating a decrease in emissions intensity in the sector. In April 2020, the Tokyo ETS began its third compliance period (FY2020–FY2024), which requires facilities to reduce emis-sions by 25% or 27% below base-year emissions, depending on their category. The third compliance period also aims to expand the use and production of low-carbon and renew-able energy through additional incentives for covered enti-ties to reduce their compliance obligations by switching to cleaner electricity. Most facilities thus far have achieved their targets via their own energy efficiency measures.
Due to the COVID-19 pandemic, the Tokyo ETS postponed the deadline for the submission of annual reports by two months. MRV rules were also reformed via the establishment of an online verification process.
Background Information
GHG REDUCTION TARGETSBY 2030: 30% reduction from 2000 GHG levels (Zero Emission Tokyo Strategy)BY 2050: Net-zero CO2 emissions (Zero Emission Tokyo Strategy)
INDUSTRY
BUILDINGS
SECTORS:
1 – Estimated standard transaction price provided by TMG.2 – The overall emissions figure for Tokyo is higher than the total of the emissions by sector because the former includes all GHGs in Tokyo, whereas the emissions by sector only
measures CO2 emissions.
OVERALL GHG EMISSIONS (excl. LULUCF) 63.9 MtCO2e (2018)2
OVERALL CO2 EMISSIONS BY SECTOR (MtCO2e)
industrial processes 4.2 (7%)Transport 9.6 (17%)residential 16.5 (29%)Commercial 25.3 (44%)Waste 1.8 (3%)
First city-wide ETS
Commercial and industrial buildings covered
Energy efficiency improvements key to emissions reductions
In force
Under development
Under consideration
← CONTENT

FACT
SHEE
TS –
03
TOKY
OSt
atus
Rep
ort 2
021
ICAP
157
COVERED EMISSIONS
GHGs COVEREDCO2 only
SECTORS AND THRESHOLDSConsumption of fuels, heat, and electricity in commercial and industrial buildings. Building owners are subject to surrender obligations, but large tenants (floor space above 5,000 m2 or over six million kWh electricity usage per year) can assume obliga-tions jointly or in place of building owners.
INCLUSION THRESHOLDS: Facilities that consume the energy equivalent to at least 1,500 kL of crude oil per year.
POINT OF REGULATIONDownstream
NUMBER OF ENTITIES1,200 facilities: • Office/commercial buildings: ~1,000• Factories: ~200
CAPA Tokyo-wide cap is aggregated from the bottom up from facility-level “baselines,” which are calculated using base-year emissions and a compliance factor (see “Allocation” section).
ETS Size
~20%
Phases & Allocation
TRADING PERIODSFIRST PERIOD: 1 April 2011 to 30 September 2016SECOND PERIOD: 1 April 2015 to 30 September 2021THIRD PERIOD: 1 April 2020 to 30 September 2026
The Tokyo ETS has trading periods as well as compliance periods (see “Compliance” section). The trading period is defined as the compliance period plus an additional 18-month adjustment period, during which time entities may continue to trade credits in order to reach their targets for the corresponding compliance period.
ALLOCATIONUnder the Tokyo ETS, each facility has its own cap, which serves as the “baseline” from which it must achieve its reduction target. Baselines for facilities are set according to the following formula: Base-year emissions x (1 – compliance factor) x compliance period (5 years). The compliance factor for each period is determined based on regulations established by the Governor of Tokyo. Prior to the start of each new compliance period, TMG holds consultation meetings to garner experts’ opinions for determining the compliance factors. Base-year emissions are based on the average emissions of any three consecutive years between FY2002 and FY2007, as chosen by each entity. Credits are issued to facilities whose emissions fall below their baselines. Additional emissions reductions may be issued through use of renewable elec-tricity (see also “Offsets and Credits” section). Baselines for new entrants are based on past emissions or on emissions intensity standards.
COMPLIANCE FACTOR: First period (FY2010–FY2014): 8% or 6% reduction below base-year emissionsSecond period (FY2015–FY2019): 17% or 15% reduction below base-year emissionsThird period (FY2020-FY2024): 27% or 25% reduction below base-year emissions
The higher compliance factor applies to office buildings, as well as to district heating and cooling (DHC) plants (excluding facilities that use a large amount of DHC). The lower compli-ance factor applies to factories and office buildings that use DHC for more than 20% of their entire energy consumption. For new entrant facilities from the third compliance period onward, the 17% and 15% compliance factors from the second period are applied (transitional measures are introduced). In the third compliance period, in medical facilities where electricity is vital to preserve life and health, the compliance factor is two percentage points lower than the 27% or 25% category to which they would otherwise belong. Facilities demonstrating outstanding performance in emis-sions reductions, as well as in the introduction, use, and management of energy equipment, are certified as top-level facilities that receive 50% or 75% lower compliance factors according to their rate of progress. The certification stan-dards represent the highest-level energy efficiency measures currently feasible, stipulating more than 200 different energy- saving measures.
← CONTENT

FACT
SHEE
TS –
03
TOKY
OSt
atus
Rep
ort 2
021
ICAP
158
Flexibility
BANKING AND BORROWING Banking is allowed only between consecutive compliance periods. Borrowing is not allowed.
OFFSETS AND CREDITSCredits from four offset types are permitted, to complement emissions reduction credits issued to facilities covered by the Tokyo ETS whose emissions fall below their baseline.
SMALL AND MID-SIZE FACILITY CREDITS: Emissions reduc-tions from non-covered small and medium-sized facilities in Tokyo.
Quantitative Limits: None
OUTSIDE TOKYO CREDITS: Emissions reductions achieved from large facilities outside of the Tokyo area. Large facilities are those with an energy consumption equivalent to at least 1,500kL of crude oil in a base year and with base-year emis-sions of 150,000 tonnes or less.
Quantitative Limits: Credits are issued only for the reduc-tion amount that exceeds the compliance factor. These credits can be used for compliance for up to one-third of facilities’ reduction obligations.
RENEWABLE ENERGY CREDITS: Renewable energy credits generated under the Tokyo ETS encompass the following types: Environmental Value Equivalent, Renewable Energy Certificates, and New Energy Electricity, generated under the Renewable Portfolio Standard Law. Credits from solar (heat, electricity), wind, geothermal, or hydro (under 1,000 kW) electricity production for use under the Tokyo ETS were converted to 1.5 times the value of regular credits until the end of the second compliance period. From the third compli-ance period, they are converted on a 1 to 1 basis. Credits from biomass (biomass rate of 95% or more, black liquor excluded) are also converted with factor 1.
Quantitative Limits: None
SAITAMA CREDITS (VIA LINK): • Excess Credits: Emissions reductions from facilities in
Saitama with base-year emissions of 150,000 tonnes or less. Issuance of credits from FY2015.
• Small and Mid-Size Facility Credits issued by Saitama Prefecture. Issuance of credits from FY2012.
Quantitative Limits: None
All offsets must be verified by verification agencies.
QUALIFYING FOR ADDITIONAL EMISSIONS REDUCTIONS THROUGH USE OF RENEWABLE ELECTRICITY (1) Low Carbon Electricity: In order to evaluate the energy
efficiency efforts of the covered facilities, CO2 emission factors of the supply side (electricity and others) are fixed during each compliance period. If covered facil-ities procure electricity from TMG-certified suppliers with lower emission factors (0.37 [t-CO2/1,000 kWh] or less), they can reduce the difference between these emission factors from their emissions to be reported to the TMG.
(2) If covered facilities generate electricity from renewable sources for their own use, they can deduct this amount of electricity from the total energy usage of the facility to be reported to the TMG.
(3) During the third compliance period, covered facilities can deduct emissions to be reported to the TMG if elec-tricity with a higher renewable energy source rate (30% or higher) is procured (additional grant).
MARKET STABILITY PROVISIONS In general, covered facilities trade over the counter and the TMG does not control carbon prices. However, as a discre-tionary mechanism, the TMG sells its own offset credits for trading in case of excessive price development.
Compliance
COMPLIANCE PERIODEntities must submit a GHG Emissions Reduction Plan and implementation status report by 30 November every year.3
Compliance instruments must be submitted, and the prede-termined target achieved by the end of the 18-month adjust-ment period, 30 September of the second fiscal year after the end of the compliance period. The next compliance period coincides, then, with the adjust-ment period for 18 months and begins immediately after the preceding period.
FIRST PERIOD: FY2010–2014SECOND PERIOD: FY2015–2019THIRD PERIOD: FY2020–2024
MRVREPORTING FREQUENCY: Annual emissions reporting, including emission reduction plans. All seven GHGs must be monitored and reported: CO2, CH4, N2O, PFCs, HFCs, SF6, and NF3. Large tenants, i.e., those with a floor space above 5,000 m2 or over six million kWh electricity use per year, are required to submit their own emissions reduction plans to the TMG in collaboration with building owners.
3 – Due to the COVID-19 pandemic, the deadline for 2020 only was postponed to 1 February 2021.
← CONTENT

FACT
SHEE
TS –
03
TOKY
OSt
atus
Rep
ort 2
021
ICAP
159
VERIFICATION: These annual reports require third-party verification.
FRAMEWORK: These are based on ‘TMG Monitoring/Reporting Guidelines’ and ‘TMG Verification Guidelines.’
ENFORCEMENTIn the case of noncompliance, the following measures may be taken:
FIRST STAGE: The governor orders the facility to reduce emissions by the amount of the reduction shortfall multi-plied by 1.3.
SECOND STAGE: Any facility that fails to carry out the order will be publicly named and subject to penalties (up to JPY 500,000 [USD 4,683]) and surcharges (1.3 times the shortfall).
Linking
LINKS WITH OTHER SYSTEMS Linking with the Saitama Prefecture ETS started in April 2011 when the Saitama program was launched. Tokyo and Saitama credits are officially eligible for trade between the two jurisdictions. During the first compliance period, 15 credit transfers took place between the Saitama Prefec-ture and Tokyo (nine cases from Tokyo to Saitama, six cases from Saitama to Tokyo).
Other Information
INSTITUTIONS INVOLVED Tokyo Metropolitan Government
EVALUATION/ETS REVIEW The TMG established a committee of experts to analyze the structure of the Tokyo Cap-and-Trade Program post-2020. In FY2020, the program entered a new stage to achieve the 2030 target and transition to a net-zero carbon society, promoting continued energy savings and expanding the utilization of low-carbon (renewable) energy.
IMPLEMENTING LEGISLATIONThe Tokyo Metropolitan Security Ordinance and Regulation for the Enforcement of the Tokyo Metropolitan Environmental Security Ordinance 4 Detailed documents on the Tokyo ETS can be found on the TMG website.5
TMG Zero Emissions Strategy 6
4 – https://www.kankyo.metro.tokyo.lg.jp/basic/guide/security_ordinance/index.html 5 – https://www.kankyo.metro.tokyo.lg.jp/en/climate/cap_and_trade/index.files/TokyoCaT_detailed_documents.pdf 6 – http://www.kankyo.metro.tokyo.jp/en/about_us/zero_emission_tokyo/strategy.html
← CONTENT

FACT
SHEE
TS –
03
viET
naM
Stat
us R
epor
t 202
1IC
AP
160
VIETNAM
In November 2020, Vietnam’s National Assembly adopted the revised Law on Environmental Protection, which estab-lishes a mandate for the Ministry of Natural Resources and Environment (MONRE) and for the Ministry of Finance (MOF) to design a domestic emissions trading scheme and a cred-iting mechanism. The framework legislation gives MONRE a legal mandate to establish an emissions trading scheme, set a cap, and determine the method of allowance allocation, and allows for the inclusion of domestic and international offsets. The Law on Environmental Protection will enter into force on 1 January 2022. MOF and MONRE are considering a timeline for ETS implementation; a pilot system is expected to start by 2025 and to become fully operational by 2027.
Policy developments have been guided by Vietnam’s ‘Green Growth Strategy’ (2012), which sets the objective of a low-carbon economy and cites the use of market-based instruments as an avenue to achieving the strategy. In line with the strategy, ‘National Appropriate Mitigation Actions’ (NAMAs) are being implemented in the agriculture, forestry, waste, industry (steel, cement, chemical), and power sectors. With the support of the PMR, Vietnam has also been developing policy proposals for carbon pricing and market-based instruments in the country, in addition to developing MRV and accreditation systems. These actions are intended to underpin the further development of the national ETS.
GHG REDUCTION TARGETS BY 2030: 9% below BAU and 20% reduction in 2010 emission intensity levels (unconditional NDC). 17% below BAU and 30% reduction in 2010 emission intensity levels (conditional NDC).
Other Information
INSTITUTIONS INVOLVEDMinistry of Natural Resources and Environment Ministry of Finance
Background Information
OVERALL GHG EMISSIONS (excl. LULUCF) 321.5 MtCO2e (2014)
OVERALL GHG EMISSIONS BY SECTOR (MtCO2e)Energy 171.6 (53%)industrial processes 38.6 (12%)agriculture 89.8 (28%)Waste 21.5 (7%)
Established the legal mandate to design a domestic ETS and a crediting mechanism
Pilot system is expected to start by 2025 and to become fully operational by 2027
In force
Under development
Under consideration
← CONTENT

04ABOUT ICAP & NOTES

04St
atus
Rep
ort 2
021
ICAP
162
aBO
UT iC
ap
ABOUT THE INTERNATIONAL CARBON ACTION PARTNERSHIP Founded in 2007, ICAP is an international government forum that brings together policymakers from all levels of govern-ment that have or are interested in introducing an ETS. It provides a unique platform for governments to discuss the latest research and practical experiences with emissions trading. Since its formation, ICAP has established itself as an ETS knowledge hub and its membership has grown to include 32 members and five observers.
Objectives• Share best practices and learn from each other’s ETS experiences • Help policymakers recognize ETS design compatibility issues and opportunities for establishing an ETS at an early stage• Facilitate future linking of trading programs• Highlight emissions trading as a key aspect of an effective climate policy response• Build and strengthen partnerships amongst governments
Members (as of February 2021)Arizona, Australia, British Columbia, California, Denmark, the European Commission, France, Germany, Greece, Ireland, Italy, Maine, Manitoba, Maryland, Massachusetts, the Netherlands, New Jersey, New Mexico, New York, New Zealand, Norway, Nova Scotia, Ontario, Oregon, Portugal, Québec, Spain, Switzerland, the Tokyo Metropolitan Government, the United Kingdom, Vermont and the state of Washington.
ObserversJapan, Kazakhstan, the Republic of Korea, Mexico, and Ukraine
icap members1 City
16 Provinces & States
19 Countries
1 Union
← CONTENT

04St
atus
Rep
ort 2
021
ICAP
163
aBO
UT iC
ap
The three pillars of ICAP’s Work
KNOWLEDGE SHARING, TECHNICAL DIALOGUE, AND CAPACITY BUILDING Through these three pillars, ICAP creates a holistic approach to delivering meaningful ETS support. This encompasses ICAP’s role as a knowledge hub for ETS through our knowledge sharing tools and activities, ICAP’s capacity building courses around the world, and the ongoing technical dialogues on pertinent design topics.
Knowledge Sharing
ETS MAP The ICAP ETS Map provides up to date information on ETSs around the world - including systems that are in force, under development and under consideration. The interactive map features downloadable factsheets and provides detailed information on individual design elements.
ALLOWANCE PRICE EXPLORER The regularly updated Allowance Price Explorer is an interactive tool which lets the user compare price developments across ETS markets. The tool features full data downloads and a deep dive into market stability mechanisms, allowing the user to create individualized charts.
Capacity Building
Technical Dialogue
Knowledge Sharing
← CONTENT
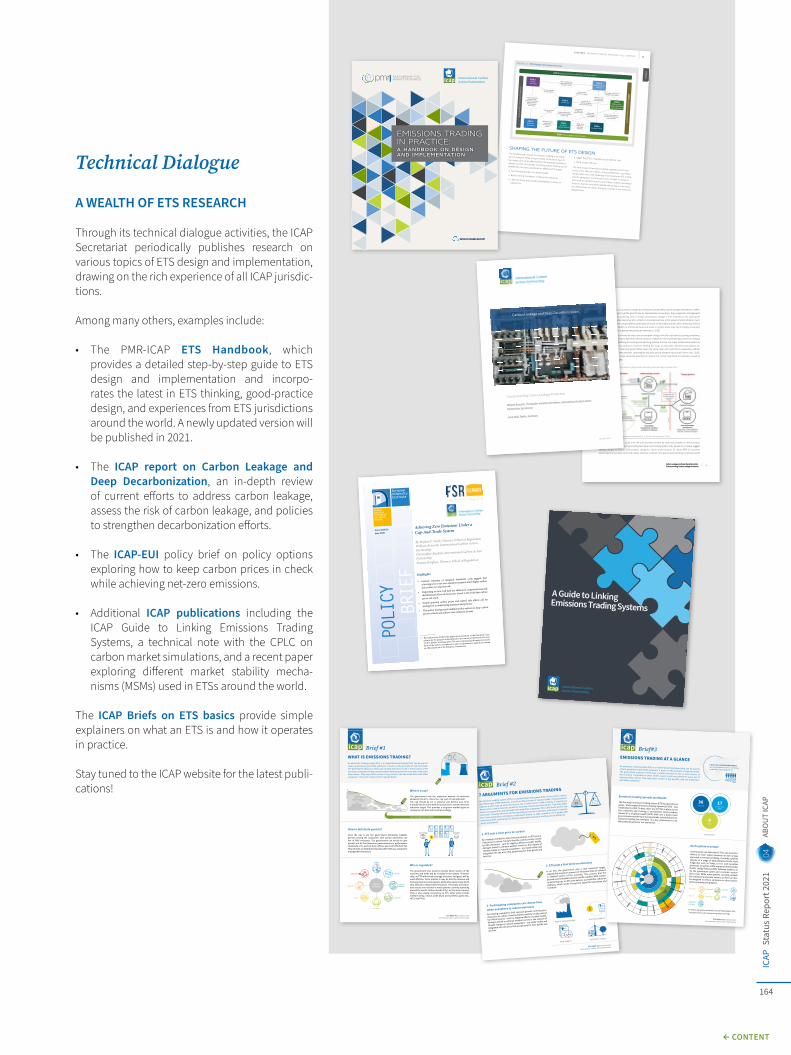
04St
atus
Rep
ort 2
021
ICAP
164
Technical Dialogue
A WEALTH OF ETS RESEARCH
Through its technical dialogue activities, the ICAP Secretariat periodically publishes research on various topics of ETS design and implementation, drawing on the rich experience of all ICAP jurisdic-tions.
Among many others, examples include:
• The PMR-ICAP ETS Handbook, which provides a detailed step-by-step guide to ETS design and implementation and incorpo-rates the latest in ETS thinking, good-practice design, and experiences from ETS jurisdictions around the world. A newly updated version will be published in 2021.
• The ICAP report on Carbon Leakage and Deep Decarbonization, an in-depth review of current efforts to address carbon leakage, assess the risk of carbon leakage, and policies to strengthen decarbonization efforts.
• The ICAP-EUI policy brief on policy options exploring how to keep carbon prices in check while achieving net-zero emissions.
• Additional ICAP publications including the ICAP Guide to Linking Emissions Trading Systems, a technical note with the CPLC on carbon market simulations, and a recent paper exploring different market stability mecha-nisms (MSMs) used in ETSs around the world.
The ICAP Briefs on ETS basics provide simple explainers on what an ETS is and how it operates in practice.
Stay tuned to the ICAP website for the latest publi-cations!
December 2020
International Carbon Action PartnershipETS BRIEF #2
Brief #2
An emissions trading system (ETS) is a market-based instrument that can be used to reduce
greenhouse gas (GHG) emissions. It works on the principle of ‘cap and trade’. The government
imposes a limit (cap) on total emissions in one or more sectors of the economy. Companies in
these sectors need to hold one permit for every ton of emissions they release. They may either
receive or buy permits, and can trade them with other companies. This is the ‘trade’ part of ‘cap
and trade’. Currently, there are 20 ETSs operating across five continents, with major economies
like China preparing to introduce a nationwide system. In 2020, roughly 14 % of global GHG
emissions will be covered by ETS. But just what makes emissions trading such an attractive
policy instrument?
7 ARGUMENTS FOR EMISSIONS TRADING
1t
1. ETS sets a clear price on carbon
By creating a market for GHG emission permits, an ETS puts a
clear price on carbon. It means that the costs to society caused
by GHG emissions – such as negative effects on public health,
damages linked to extreme weather events or the impacts of
climate change on natural ecosystems – are made visible and
integrated into the price that people pay for their goods and
services.
3. Participating companies can choose how,
when and where to reduce emissions
By creating a market for GHG emission permits, an ETS puts a
clear price on carbon. It means that the costs to society caused
by GHG emissions – such as negative effects on public health,
damages linked to extreme weather events or the impacts of
climate change on natural ecosystems – are made visible and
integrated into the price that people pay for their goods and
services.
2. ETS puts a firm limit on emissions
In an ETS, the government sets a clear emissions target,
capping the maximum amount of emissions that are allowed
in selected sectors of the economy. This ensures that the
desired environmental outcome will be reached. With a stead-
ily declining cap, an ETS also delivers a predictable reduction
pathway, which sends a long-term signal for businesses and
investors.
BANK PERMITS
REDUCE THEIR EMISSIONS BUY EXTRA PERMITS
USE OFFSET CREDITS
cap
December 2020International Carbon Action PartnershipETS BRIEF #3
17Provinces/
States
6Cities
36Coutries
Brief#3
An emissions trading system (ETS) is a market-based instrument that can be used to reduce greenhouse gas (GHG) emissions. It works on the principle of ‘cap and trade’. The government imposes a limit (cap) on total emissions in one or more sectors of the economy. Companies in these sectors need to hold one permit for every ton of emissions they release. They may either receive or buy permits, and can trade them with other companies.
EMISSIONS TRADING AT A GLANCE
Emissions trading spreads worldwideThe first major emissions trading system (ETS) for greenhouse gases – the European Emissions Trading System (EU ETS) – was established in 2005. To date, there are 20 ETSs in place across five continents and covering 27 jurisdictions which produce almost 40 % of global wealth (GDP). With over a dozen more governments considering or having already scheduled an ETS, emissions trading has emerged as a key instrument to cost effectively decarbonize our economies.
Each system is uniqueGovernments can tailor their ETS to suit local con-ditions, so each system presents its own unique approach to emissions trading. Currently, systems operate at a range of administrative levels, from megacities such as Tokyo, to U.S. and Canadian provinces, as well as at the supranational level like the EU. Design features differ between systems, as do the greenhouse gases and economic sectors they cover. While most systems currently include the industrial and power sectors, an ETS can also be designed to reduce emissions in other sectors of the economy (see graphic).
5 OUT OF 10 PEOPLE WORLDWIDElive in a jurisdiction either considering, preparing or operating an ETS
ETS IN FORCE
For further explanation and details see ICAP Status Report 2020.* indicates which sector represents upstream coverage
Forestry Transport Industry
Waste Buildings Power
Domestic Aviation
QUÉB
EC
MASSACHUSETTS
EU E
TS →
MEXICO
TOKYO
SWITZERLAND
CALIFORNIA
NOVA SCOTIA
REPUBLIC OF KOREA
KAZAKHSTAN
CHINESE PILOTS
NEW ZEALAND
SAITAMA
RGGI
Beijing,
Shanghai,
Shenzhen
Beijing,
Shanghai,
Shenzhen
Fujia
n, Guangdong,
Shanghai, T
ianjin
SECTOR COVERAGE
*
*
*
*
*
*
*
*
*
13
SYNTHESIS – EMISSIONS TRADING: BRINGING IT ALL TOGETHER
FIGURE S.2 ETS Design interdependencies
STEP 8: Engage stakeholders, communicate, and build capacity
STEP 1: Decide
the scope STEP 4: Consider the use
of offsets
STEP 2: Set the cap
STEP 5: Decide on
temporal flexibility
STEP 6:Address price
predictability andcost containment
STEP 9:Consider linking
STEP 3: Distribute
allowances
Offset mechanism canengage uncovered sectorsin mitigation activity
Offsets provideadditional unit supply
The cap is adjustedas scope changes
The cap constrains allocation
Allowances can bebanked and/or
borrowed acrossperiods
Linking affectsincentives for banking and borrowing
Banking and borrowingprovide temporal flexibilitywithin the cap
Market stabilitymeasures can operateinside or outside the cap
Offset rules must be harmonized
across linked ETS
Offset supply is one lever for managing market stability
Market stability measuresmay need to be harmonizedacross linked ETS
Banking and borrowing supportmarket stability
Linking impactsunit supply and
joint cap ambition
ETS participants holdallowances; these
determine how emissionreduction costs aredistributed across
the economy
STEP 7: Ensure compliance and oversight
Lay
the
goru
ndw
ork:
Def
ine
the
ETS
Obje
ctiv
es
STEP 10: Implem
ent, evaluate, and improve
SHAPING THE FUTURE OF ETS DESIGNThe fundamental concept of emissions trading is as simple as it is powerful. While a large number of decisions have to be made to set up an effective ETS, the practical experience gained over the first decade of GHG emissions trading can be distilled into five basic guidelines for effective ETS design: ▲ Be informed globally, but design locally; ▲ Build a strong foundation of data and institutions; ▲ Learn by doing and provide predictable processes for adjustment;
▲ Adapt the ETS to changing circumstances; and ▲ Bring people with you.
The next decade of emissions trading experience lies in the hands of the decision makers, policy practitioners, and stake-holders who rise to the challenge of developing an ETS in their specific geographic and socioeconomic context. In doing so, learning from existing systems and finding creative new design solutions that can be shared globally will be key to improving the effectiveness of carbon pricing as a driver of low-emissions development.
SYNTHESIS
AEMISSIONS TRADING IN PRACTICE
EMISSIONS TRADING IN PRACTICE: A HANDBOOK ON DESIGN AND IMPLEMENTATION
December 2020International Carbon Action Partnership
ETS BRIEF #1
Brief #1
An emissions trading system (ETS) is a market-based instrument that can be used to reduce greenhouse gas (GHG) emissions. It works on the principle of ‘cap and trade’. The government imposes a limit (cap) on total emissions in one or more sectors of the economy. Companies in these sectors need to hold one permit for every ton of emissions they release. They may either receive or buy permits, and can trade them with other companies. This is the ‘trade’ part of ‘cap and trade’.
What is a cap?
The government sets the maximum amount of emissions allowed in the ETS – this is the ‘cap’ part of ‘cap and trade’. The cap should be set in advance and decline over time. It should also be in line with the jurisdiction’s overall emissions reduction target. This provides a long-term market signal so companies can plan and invest accordingly.
How to distribute permits?
Once the cap is set, the government distributes tradable permits among the companies. One permit represents one ton of GHG emissions. The government can decide to give permits out for free (based on past emissions or performance standards) or to auction them off (see also ICAP ETS Brief #6). How permits are distributed will also affect the way companies manage their emissions.
Who is regulated?
The government also needs to decide which sectors of the economy and GHGs will be included in the system. Theoreti-cally, an ETS with broad coverage of sectors and gases will be most effective. Yet in practice it may be hard to measure and track emissions in some sectors, while other sectors may find it very difficult to reduce their emissions. The power and indus-trial sectors are included in most systems currently operating around the world. Carbon dioxide (CO2), as the most common GHG, is also usually covered by an ETS. Other GHGs include methane (CH4), nitrous oxide (N2O) and synthetic gases (SF6, HFCs and PFCs).
POWER
INDUSTRY
TRANSPORTWASTE
DOMESTICAVIATIONFORESTRY
AGRICULTURE
BUILDINGS
SECTOR COVERAGE
WHAT IS EMISSIONS TRADING?
Emis
sion
s
Time
AUCTIONED FOR FREE
$
CAP = TOTAL AMOUNT OF PERMITS
cap
cap
$
CCaarrbboonn LLeeaakkaaggee aanndd DDeeeepp DDeeccaarrbboonniizzaattiioonn:: FFuuttuurree--pprrooooffiinngg CCaarrbboonn LLeeaakkaaggee PPrrootteeccttiioonn 51
be held liable for the consumption charges due. Producers would either pay the charges themselves or reflect the charges in their pricing at the point of sale for intermediate consumption. Duty-suspension arrangements provide an option for qualifying firms to forego consumption charges if their materials or the subsequent product will be exported (see Ismer et al., 2016 for a more detailed look at this aspect of administration). Such relief for exports would comply with the destination principle of international trade, which holds that indirect taxes such as value-added tax and excise duties are levied on goods where they are ultimately consumed, irrespective of where the goods were produced (Ismer et al., 2016).
The liability for imported materials subject to consumption charges would be equivalent. Ensuring compliance would require integrating the liability for relevant product categories in the implementing jurisdiction’s existing tariff system and establishing accounting and reporting systems that are not overly burdensome relative to obligations for domestic producers. However, limiting the scope to only basic materials would ignore the importation of carbon-intensive goods farther down the value chain and could fail to adequately address carbon leakage given that domestic consumption would be priced along the value chain (Ismer et al., 2016). This suggests that the scope should be extended to imports that contain high levels of materials covered by the consumption charges.
Figure 5.1: Illustration of consumption charges and incentives across the industrial value chain
Source: author’s own illustration based on Neuhoff et al. (2016) and Ismer et al. (2016).
Implementing jurisdictions could limit the administrative burden by restricting charges to select product categories of the Harmonized Commodity Description and Coding System (HS). Pauliuk et al. (2016) suggest limiting charges to around 1,000 product categories, which would account for about 85% of emissions stemming from five major sectors of carbon-intensive materials. The level of administrative complexity would
fsr.eui.eu
POLICY BRIEF
Achieving Zero Emissions Under a
Cap-And-Trade System By Stefano F. Verde, Florence School of Regulation
William Acworth, International Carbon Action
Partnership Christopher Kardish, International Carbon Action
Partnership Simone Borghesi, Florence School of Regulation
Highlights1
• Current estimates of marginal abatement costs suggest that
achieving zero or net-zero emissions requires much higher carbon
prices than ever experienced.
• Depending on how well they are addressed, competitiveness and
distributional effects de facto pose a limit to the levels that carbon
prices can reach.
• Steeply growing carbon prices and related side effects call for
packages of accompanying measures and policies.
• This policy brief presents multiple policy options to keep carbon
prices in check and achieve zero emissions in time.
1. �e authors have dra�ed this paper upon invitation of the European Com-
mission for the purpose of distribution in the context of the Florence Process
Carbon Market Workshop 2020. �e views expressed in this paper are purely
those of the authors and may not in any circumstances be regarded as stating
an o�cial position of the European Commission.
Issue 2020/26June 2020
October 2020
Carbon Leakage and Deep Decarbonization
Future-proofing Carbon Leakage Protection
WWiilllliiaamm AAccwwoorrtthh;; CChhrriissttoopphheerr KKaarrddiisshh;; KKaaii KKeellllnneerr,, IInntteerrnnaattiioonnaall CCaarrbboonn AAccttiioonn
PPaarrttnneerrsshhiipp SSeeccrreettaarriiaatt
JJuunnee 22002200.. BBeerrlliinn,, GGeerrmmaannyy
aBO
UT iC
ap
← CONTENT

04St
atus
Rep
ort 2
021
ICAP
165
aBO
UT iC
ap
Capacity Building
ICAP ETS COURSES
ICAP delivers ETS capacity building courses ranging from a few days to several weeks. Since 2009, ICAP has delivered 22 courses with almost 600 participants from 45 countries. The courses have drawn on the teachings of over 230 speakers from 32 countries. ICAP is consistently expanding its training scope, with an increasing focus on south-south cooperation. Thanks to support from the European Commission, more courses are funded and being planned for 2021.
IN-COUNTRY TRAININGS
In cooperation with various partners, ICAP has delivered training to relevant stakeholders in countries establishing an ETS or in the early stages of their ETS implementation. Past exam-ples include Colombia, Ukraine, Turkey, Chile and China. The most recent in-country training brought together policymakers and private sector participants in Mexico in preparation for the pilot phase of their ETS, which launched in January of last year. ICAP will continue to deliver in-country trainings online until the effects of the COVID-19 pandemic have subsided.
← CONTENT

NOTE
S O
N M
ETHO
DS A
ND S
OUR
CES
04St
atus
Rep
ort 2
021
ICAP
166
NOTES ON METHODS AND SOURCESGENERAL NOTES
1. The report draws on a range of sources, including official ETS information and statements from governments and public authorities, data submitted to the UNFCCC, or where available, other official reporting, and information provided by ICAP members and observers, contributing authors or in-country/native experts from our network. Information on emitting sectors is based on jurisdiction-specific data sources; therefore, categories are not necessarily consistent across jurisdictions.
2. Data in the report represents the current situation as of 31 January 2021.
3. Where 2021 data is not yet available, we use the most recent available data.
4. For the purpose of this report, emissions trading systems (ETS) include mandatory cap-and-trade systems for GHGs. Systems that regulate other gases (e.g., other air pollutants) or trade other units (e.g., energy-efficiency certificates), other market-based instruments (e.g., carbon taxes, baseline-and-crediting systems) and voluntary programs do not fall under the scope of this report.
5. We use metric tonnes throughout the report, unless otherwise indicated.
6. Emissions coverage as reported in the factsheets refers to the verified emissions of entities under the ETS in a jurisdiction as a proportion of that jurisdiction’s inventory. When this value is not available, an equivalent value provided by the jurisdiction, or the cap of the system, is used.
7. Average allowance prices are the mean of the allowance prices between 1 January 2020 and 31 December 2020. Values are taken from the info-graphic Allowance Price Developments (see below).
8. All monetary values in national currency units are converted to USD using the annual average exchange rates provided by the international finan-cial statistics of the IMF. For monetary values that are fixed over multiple years the value reported in USD uses the most recent year’s exchange rates.
9. Overall GHG emissions, the sum of the sectoral emissions, and the corresponding percentages reported in the factsheets may not add up exactly, due to rounding.
10. The following criteria are used to determine the three ETS status categories:
a. In force: ETS is in force with implementation established in the relevant regulation or legislation.
b. Under development: A mandate for ETS is established and ETS rules are currently being drafted.
c. Under consideration: ETS is being considered as a potential mitigation instrument, the government or other relevant authorities have publicly sent signals towards the development of an ETS.
11. The factsheets for Montenegro and New Mexico could not be reviewed by the respective jurisdictions but were reviewed internally within the ICAP Secretariat team.
NOTES ON INFOGRAPHICS
For the infographics “From Supranational to Local”, “Emissions Trading Worldwide” and “Sector Coverage”, we draw on data contained in the fact-sheets, the online version of the ICAP ETS Map (https://icapcarbonaction.com/en/ets-map), as well as news articles from the ICAP Secretariat. For infographics involving quantitative data the following sources and methods were used:
FROM SUPRANATIONAL TO LOCAL
1. Jurisdictions’ shares of global GDP and world population are calculated based on the latest annual data available before the Status Report’s editorial cut-off date in February 2021. They cover 2018 or 2019 data. The population of jurisdictions with an ETS in force and the cumulative GDP of their respective economies are calculated as a share of world population and global GDP. The share of global GHG emis-sions covered by an ETS in force is calculated using the latest available data for the jurisdictions’ official cap. In cases where the 2021 cap data were not available, estimates based on most recent data were used. Specific sources and figures are available upon request from [email protected].
← CONTENT

NOTE
S O
N M
ETHO
DS A
ND S
OUR
CES
04St
atus
Rep
ort 2
021
ICAP
167
nOTE
S O
n M
EThO
dS a
nd S
OUr
CES
SECTOR COVERAGE
1. For the purposes of this infographic, the following sector definitions are used:
2. Agriculture is a major source of biological emissions; however, the sector does not yet face direct compliance obligations under any existing ETS. Currently, in New Zealand, agricultural emissions must be monitored and reported under the ETS, and some offset programs (e.g. California) allow for offset projects in the sector.
3. Emissions coverage of the different systems corresponds to the value that is reported in the corresponding factsheets. In the case of the Chinese pilots, the coverage was calculated by adding the most recent reported caps of all the pilots and dividing that number by the addition of the most recent reported GHG emissions of all the pilots. Note that sector coverage differs across Chinese pilots and this is indicated in the relevant slice of the infographic.
GLOBAL EXPANSION OF ETS
1. Whenever available, we use the official and most recent cap data. When those data are unavailable or when systems operate without a cap, the estimates of covered emissions in the regulated sectors are used instead.
2. EU ETS cap in 2021 has been revised down to reflect the UK leaving the system. It includes emissions covered under the aviation sector cap of the EU ETS, which in 2012 amounted to 210 MtCO2e and from 2013 to 2021 has been around 38 MtCO2e per year. For more details, see the EU ETS factsheet.
3. Chinese National ETS started operating in 2021. In early January 2021, the Ministry of Ecology and Environment (MEE) published key ETS policy documents, along with an announcement that regulated entities will need to surrender allowances pertaining to their 2019–2020 emissions in 2021. The infographic reflects the start date of the Chinese National ETS in 2021, while also indicating the retroactive coverage of the system in 2019 and 2020. The caps for the Chinese National ETS and Pilots are estimated values provided by domestic ETS experts.
4. There are two cases where an existing and a scheduled system regulate the same emissions. In those cases, we made the following assumptions:
a. Massachusetts ETS & RGGI: Massachusetts’ system covers the same emissions as RGGI does, so it is excluded from the infographic to avoid double counting.
b. Chinese National ETS & Pilots: According to the Chinese National ETS rules, Pilots that have already allocated allowances for 2019 and/or 2020 for the power sector will remain under the pilots for those years. This implies the power sector entities that are subject to overlapping regu-lation will be covered under the pilots in 2020 and move to the national ETS starting 2021. Accordingly, the infographic reduces the Chinese Pilots’ cap in 2020 and 2021 by 550 MtCO2e based on estimates provided by domestic ETS experts.
SECTOR DEFINITIONS
Power Emissions from the combustion of fossil fuels for electricity generation, as well as large-scale centralized heat production.
IndustryEmissions from industrial activity, typically covering both energy emissions (e.g. from burning fossil fuels in furnaces), as well as process emissions (e.g. in the case of cement production). In the case of Kazakhstan, this also comprises extractive industries such as oil and gas mining.
Domestic Aviation
Emissions from fossil fuel combustion for flights arriving and departing within the jurisdiction (‘domestic’) which are not regulated by the International Civil Aviation Organization (ICAO).
Transport Emissions from fossil fuel combustion for transport with the exception of aviation (domestic and international) and international maritime transport. Coverage usually is upstream with fuel distributors facing compliance obligations.
Buildings
Emissions originating from buildings. With upstream coverage, distributors of heating fuels face compliance obliga-tions and all consumers are exposed to the carbon price. With downstream coverage, emissions of large buildings are regulated. In this case, emissions originating from other sectors (e.g. power production) may also be attributed to buildings to incentivize demand reduction and shifting towards cleaner sources of supply.
Forestry Emissions and removals resulting from forest land use, including forest management/harvest, deforestation and re/afforestation activities.
Waste Emissions from waste disposal and management (e.g. methane from anaerobic decomposition in landfills).
← CONTENT

NOTE
S O
N M
ETHO
DS A
ND S
OUR
CES
04St
atus
Rep
ort 2
021
ICAP
168
5. Global emissions data refer to GHG emissions in CO2e excluding LULUCF. The values for 2020 and 2021 are calculated based on the observation in 2019 and assuming a constant 1.62% growth rate, which is the average growth rate of global GHG emissions between 2016 and 2019 and likely overestimates the actual growth rate of emissions considering the ongoing COVID-19 pandemic. Global GHG emissions data are from Olivier and Peters (2020): Trends in Global CO2 and Total Greenhouse Gas Emissions; 2020 Report. PBL Netherlands Environmental Assessment Agency, The Hague. URL: https://www.pbl.nl/sites/default/files/downloads/pbl-2020-trends-in-global-co2-and_total-greenhouse-gas-emissions-2020-report_4331.pdf
6. Percentages of global emissions covered are rounded to the nearest full percentage. They are slightly above 5% and 16% in 2005 and 2021, respectively.
7. For the German National ETS, we assume that the cap will approximately equal the sum of emissions from transport, residential and commer-cial/institutional sectors in 2018 from Umweltbundesamt (2020): Nationale Trendtabellen für die deutsche Berichterstattung atmosphärischer Emissionen 1990–2018. URL: https://www.umweltbundesamt.de/themen/klima-energie/treibhausgas-emissionen.
DIFFERENT SHAPES OF ETS
1. Coverage: The figure indicates the percentage of the jurisdiction’s total emissions that is covered by the ETS. The data is taken from the fact-sheets and refers to the latest emissions coverage figures available for each system.
2. Allowance Price: For the EU ETS, the price is the average of all 2020 spot prices (settlement prices) at the European Energy Exchange. The prices for EU and Swiss ETS are depicted as equal due to the link between the two systems becoming active in 2020. For RGGI, Québec and California, the clearing prices of all auctions conducted in 2020 are averaged. The prices for California and Québec systems are depicted as equal due to the link between them. In the case of RGGI where short tons are the standard unit, the price is converted to the price per metric tonne. For the Korean system, the price is based on end-of-day trading prices on the secondary-market exchange, averaged for 2020. Where necessary local currency prices were converted using the yearly exchange rate as published by the IMF Financial Statistics.
3. Auction share: This figure indicates the share of auctioned allowances in the cap. The consignment auctions in California are not included in calculating the auction share. In the case of the Swiss ETS, the figure shows the remainder of the allowances allocated for free as a proportion of the cap, as 2 out of the 4 scheduled auctions in 2020 were cancelled due to the COVID-19 pandemic.
4. The previous editions of ICAP the Status Report featured a fourth metric/axis titled “Cap trajectory”. This aspect is not included in the current edition because geographical scope changes in the EU ETS and RGGI as well as sectoral scope changes in K-ETS make the calculation of this metric in 2021 assumption laden.
AUCTIONING REVENUE
1. Auction revenues for the 15 systems (including the 8 Chinese pilots) were calculated using data from the European Commission; California Air Resources Board; Québec Ministry of Sustainable Development, Environment, and Fight Against Climate Change; Regional Greenhouse Gas Initiative; European Energy Exchange; the Intercontinental Exchange and Swiss Emissions Registry; Massachusetts Department of Environmental Protection; the website of the Korea Exchange (KRX) as well as from the factsheets of the Chinese pilot systems (links available upon request, [email protected]).
2. Auction revenue for the EU ETS includes revenue from the domestic aviation sector.
3. For the California cap-and-trade system, the proceeds from consignment auctions are excluded.
4. For the Québec cap-and-trade system, joint auctions involve currency conversion for part of the proceeds. The rate and transaction fees on the date of conversion can affect the amount deposited to the Green Fund. As a result, the product of the number of permits sold and the settlement price may slightly differ from the actual amount deposited. The estimated percentage of auctioned allowances for the California and Québec cap-and-trade systems are calculated based on the vintage year, not by the year when allowances were or would actually be auctioned.
5. The Massachusetts quarterly reports are published by Potomac Economics, which is the official market monitor for the Massachusetts Depart-ment of Environmental Protection.
DEEP DECARBONIZATION AND ETS
1. Information on the status of net-zero target development (i.e. “in law”, “in proposed legislation” and “in policy document”) is drawn from the Energy & Climate Intelligence Unit’s Net Zero Tracker, accessible at https://eciu.net/netzerotracker. National jurisdictions which are not covered under one of these categories are grouped under the fourth category “no net-zero target”. The categorization is accurate as of 10 March 2021.
2. For simplicity, the EU is treated as a single supranational jurisdiction and is categorized under “in proposed legislation”. It is important to note that there are individual EU Member States with national net-zero targets that are “in law” (e.g. France); “in proposed legislation” (e.g. Spain); “in policy document” (e.g. Finland); or “no net-zero target” (e.g. Bulgaria).
3. Data on national GHG emissions are the most recent available and have been retrieved either from country reports incorporated into the Status Report factsheets, from the UNFCCC National Inventory Submissions 2020 (https://unfccc.int/ghg-inventories-annex-i-parties/2020) as well as the National Communication submissions from Non-Annex I Parties (https://unfccc.int/non-annex-I-NCs). Data on ETS-covered emissions are from the Status Report factsheets.
← CONTENT

NOTE
S O
N M
ETHO
DS A
ND S
OUR
CES
04St
atus
Rep
ort 2
021
ICAP
169
nOTE
S O
n M
EThO
dS a
nd S
OUr
CES
ALLOWANCE PRICE DEVELOPMENTS
1. The top panel of the infographic displays the allowance prices between 1 January 2010 and 31 December 2020.
2. An allowance represents the right to emit one tonne of CO2e in the jurisdiction(s) that accept it for compliance. However, allowances from different systems cannot be treated as a single commodity because of differences in system design. Allowance prices are not directly comparable across systems.
3. In the top panel of the infographic, price series for California, Québec and RGGI are obtained from the primary market and are reported at the same frequency as the respective auctions in these systems. All other price series are obtained from the secondary market and are reported for each trading day for which data are available.
4. All data are in USD and are converted using the average exchange rate of the corresponding month as reported by the IMF.
5. For the infographic covering price developments in 2020, the data underlying the indices, including those for WCI (California/Québec) and RGGI, are obtained from the secondary market and are reported for each trading day for which data are available.
6. For the infographic covering price developments in 2020, the data for WCI (California/Québec) and RGGI allowance prices that underlie the graph were provided by the Independent Commodity Intelligence Services (ICIS), with data from the Intercontinental Exchange (ICE).
7. Where allowance prices reflect auction settlement prices, the observations from two successive auctions are connected linearly.
8. Secondary market prices reflect settlement prices and do not capture intra-day trade variation.
9. RGGI allowance prices are in short tons and have been converted to metric tonnes for the purposes of this infographic.
10. Where allowances have a limited vintage, the time series data compiles these vintages in a way that reflects the compliance cycle.
11. A 90-day moving average was used to smooth out the variability in calculating the price range for the Chinese pilots. Note that the variability may be driven by changes in market fundamentals as well as absence of price data from a given system on a given day.
12. For information on sources for allowance prices and exchange rates see https://icapcarbonaction.com/en/documentation-allowance-price-ex-plorer.
13. Different jurisdictions took a variety of public health measures to address the spread of the SARS-CoV-2 virus during the first months of 2020. Measures obeyed to different domestic circumstances and their scope is not always immediately comparable. For the infographic covering price developments in 2020, the following sources were used for the public health measures taken by the jurisdictions:
a. European Union Members: Hirsch, C. (2020 March 31). Europe’s coronavirus lockdown measures compared. Politico, https://www.politico.eu/article/europes-coronavi-rus-lockdown-measures-compared/
b. New Zealand: New Zealand COVID-19 Alert System. (2020). History of the COVID-19 Alert System. https://covid19.govt.nz/alert-system/history-of-the-covid-19-alert-system/
c. Republic of Korea: Ministry of Health and Welfare (2020 February 23). Briefing on the pan-governmental meeting for COVID-19. https://www.mohw.go.kr/eng/nw/nw0101vw.jsp?PAR_MENU_ID=1007&MENU_ID=100701&page=1&CONT_SEQ=353124
d. Québec: Rowe, D. J. (2020 April 12). COVID-19 in Quebec: A timeline of key dates and events. CTV News. https://montreal.ctvnews.ca/covid-19-in-que-bec-a-timeline-of-key-dates-and-events-1.4892912
e. United States: Centers for Disease Control and Prevention. (2020 September 4). Timing of State and Territorial COVID-19 Stay-at-Home Orders and Changes in Population Movement — United States, March 1–May 31, 2020. https://www.cdc.gov/mmwr/volumes/69/wr/mm6935a2.htm
f. RGGI: Mendelson, L. (2020 May 20). Stay on Top of “Stay At Home” – A List of Statewide Orders. https://www.littler.com/publication-press/publica-tion/stay-top-stay-home-list-statewide
← CONTENT

04St
atus
Rep
ort 2
021
ICAP
170
LiST
OF
aCrO
nYM
S
LIST OF ACRONYMSAB Assembly Bill AFOLU Agriculture, Forestry and other Land UseAIC Allowances in CirculationANSI American National Standards InstituteAPCR Allowance Price Containment Reserve ARP Auction Reserve PriceASSET Advanced Technologies Promotion Subsidy Scheme with
Emission Reduction TargetsBAU Business as UsualBMU Bundesministerium für Umwelt, Naturschutz und nukleare
Sicherheit (German Federal Ministry for the Environment, Nature Conservation and Nuclear Safety)
BPU Board of Public UtilitiesCAD Canadian DollarCAR Clean Air Rule CARB California Air Resources BoardCBAM Carbon Border Adjustment MechanismCBIO Brazilian decarbonization creditsCCC Climate Change CommitteeCCER Chinese Certified Emission ReductionCCM Cost Containment MechanismCCR Cost Containment ReserveCCS Carbon Capture and StorageCDM Clean Development Mechanism CEP Clean Energy PlanCER Certified Emission ReductionCFCs ChlorofluorocarbonsCH4 MethaneCHF Swiss FrancCLEF Carbon Leakage Exposure FactorCNY Chinese Yuan RenminbiCO2 Carbon DioxideCOP26 26th Conference of the PartiesCORSIA Carbon Offsetting and Reduction SchemeCOVID-19 2019 novel coronavirusCPA Carbon Pricing in the AmericasCPS Carbon Price SupportDEBS Direct Environmental BenefitsDEE Department of Ecology and EnvironmentDEMNR Department of Energy, Minerals, and Natural ResourcesDENR Department of Environment and Natural ResourcesDEP Department of Environmental ProtectionDEQ Department of Environmental QualityDHC District Heating and CoolingDRC Development and Reform CommissionEC European CommissionECCC Environment and Climate Change CanadaECR Emissions Containment Reserve EEA European Economic Area
EEB Ecology and Environment BureauEEX European ExchangeEITE Emission-Intensive and Trade-ExposedEO Executive OrderERU Emissions Reduction UnitsEQB Environmental Quality BoardEQC Environmental Quality CommissionERU Emissions Reduction UnitESR European Effort Sharing RegulationETS Emissions Trading System or Emissions Trading SchemeEU European UnionEU ETS European Union Emissions Trading SystemEUR EuroFFCER Fujian Forestry Certified Emission ReductionFPO Fixed Price OptionFY Fiscal YearFYP Five Year PlanGBP British Pound SterlingGDP Gross Domestic ProductGHG Greenhouse GasGIR Greenhouse Gas Inventory and Research Center of KoreaGIZ Deutsche Gesellschaft für Internationale Zusammenarbeit
(German Corporation for International Cooperation)GJ Giga Joule GtCO2e Giga Tonnes of Carbon Dioxide equivalentGVA Gross Value AddedHB House BillHCFCs HydrochlorofluorocarbonsHFCs HydrofluorocarbonsHFC-23 FluoroformICAO International Civil Aviation Organization ICAP International Carbon Action PartnershipIEA International Energy AgencyIMF International Monetary Fund INECC National Institute for Ecology and Climate ChangeINDC Intended Nationally Determined ContributionIPCC Intergovernmental Panel on Climate ChangeITMOs Internationally Transferred Mitigation OutcomesJCM Joint Crediting MechanismJI Joint ImplementationJPY Japanese YenKAZ ETS Kazakhstan Emissions Trading SchemeKAU Korean Allowance UnitKCU Korean Credit UnitK-ETS Korea Emissions Trading SystemKOC Korean Offset CreditKRW South Korean WonKRX Korea ExchangekWh Kilowatt hour
← CONTENT
04St
atus
Rep
ort 2
021
ICAP
171
LiST
OF
aCrO
nYM
S
KZT Kazakhstani TengeLDCs Least Developed CountriesLNG Liquefied Natural GasLPG Liquefied Petroleum GasLULUCF Land Use, Land-Use Change and ForestryMassDEP Massachusetts Department of Environmental ProtectionMBI Market-based InstrumentMEE Ministry of Ecology and EnvironmentMEP Ministry of Environmental ProtectionMMC Mine Methane CaptureMOE Ministry of EnvironmentMOEF Ministry of Economy and FinanceMOF Ministry of FinanceMONRE Ministry of Natural Resources and EnvironmentMOS Mayor’s Office of SustainabilityMOU Memorandum of UnderstandingMOST Ministry of Strategy and FinanceMRV Monitoring, Reporting and VerificationMSR Market Stability ReserveMtCO2e Million Tonnes of Carbon Dioxide equivalent MW MegawattMWe Megawatt equivalentMWh Megawatt hourN2O Nitrous OxideNOx Nitrogen OxideNAMA Nationally Appropriate Mitigation ActionsNDC Nationally Determined ContributionNDRC National Development Reform CommissionnEHS Nationales Emissionshandelssystem (German
National ETS)NER New Entrants ReserveNF3 Nitrogen TrifluorideNMED New Mexico Environment DepartmentNOX Nitrogen DioxideNYC New York CityNZ New ZealandNZ ETS New Zealand Emissions Trading SchemeNZD New Zealand DollarNZU New Zealand UnitNZX New Zealand ExchangeOBPS Output-Based Pricing System
OTC Over-the-CounterPCF Pan-Canadian Framework on Green Growth and
Climate ChangePDR People’s Democratic RepublicPFCs PerfluorocarbonsPHCER Pu Hui Certified Emission ReductionsPMI Partnership for Market ImplementationPMR Partnership for Market ReadinessPNCTE Programa Nacional de Cupos Transables de Emisión de
Gases de Efecto Invernadero (National Program of Green-house Gas Tradable Emission Quotas)
PoMuC Climate Change Policy Program
Q1/Q2/Q3/Q4
Quarter 1/Quarter 2/Quarter 3/Quarter 4
RBOB Reformulated Blendstock for Oxygenate BlendingRCI Residential/Commercial/Industrial emissionsRENAMI Registro Nacional de Acciones de Mitigación (National
Mitigation Actions Registry)Renare Registro nacional de reducción de emisions de GEI
(National Emission Reductions Registry)RENE Registro Nacional de Emisiones (Mexico National
Emissions Register)RGGI Regional Greenhouse Gas InitiativeRGGI COATS
RGGI CO2 Allowance Tracking System
R&D Research and DevelopmentSAM Supply Adjustment MechanismSB Senate BillSCC Standards Council of CanadaSEMARNAT Secretaría del Medio Ambiente y Recursos Naturales
(Ministry of Environment and Natural Resources of Mexico)SF6 Sulfur FluorideSO2 Sulfur DioxideSOE State-owned Enterprisetce Tonne of Coal equivalentTCI Transportation and Climate InitiativeTCI-P Transportation and Climate Initiative ProgramtCO2 Tonne of Carbon DioxidetCO2e Tonne of Carbon Dioxide equivalentTEPA Taiwanese Environmental Protection AdministrationTGO Thailand Greenhouse Gas Management Organization TIER Technology Innovation and Emissions Reduction
RegulationTMG Tokyo Metropolitan GovernmentTMS Target Management SystemTNAC Total Number of Allowances in CirculationTRP Technical Reserve PriceTurk-SIM Turkish ETS simulation gameUK United KingdomUK ETS UK Emissions Trading SchemeUNDP United Nations Development ProgramUNFCCC United Nations Framework Convention on Climate
ChangeUS United StatesUSD US DollarUS EPA US Environment Protection AgencyV-ETS Thailand Voluntary Emissions Trading SchemeWCI Western Climate InitiativeZEV Zero Emissions Vehicle
← CONTENT

Stat
us R
epor
t 202
1IC
AP
172
IMPRINT
Publication DateMarch 2021
DesignSimpelpluswww.simpelplus.de
PrintingDruckhaus Sportflieger
PhotosCover & Back: Dan Fador, Pixabay, content in order of appearance: Iswanto Arif, Unsplash; RDLH, Pixabay; Socialsudo, Unsplash; Free-Photos, Pixabay; Couleur, Pixabay
DisclaimerThis report was prepared by the ICAP Secretariat. The findings and opinions expressed in this report are the sole responsibility of the authors. They do not necessarily reflect the views of ICAP or its members.
The data used in this report reflects the global state of play at the time of writing in early 2021. Although the information contained in the report was assembled with the utmost care, updated and/or addi-tional information may have been released by the time of printing. The ICAP Secretariat cannot be held liable for the timeliness, correctness, or completeness of the information provided. For any corrections, additions, or other comments on the content of this report, including relevant citations, please contact the ICAP Secretariat at [email protected].
Rights and permissionsAll rights reserved. The content of the work created by the ICAP Secretariat and the work itself are subject to German copyright law. Third party contributions are marked as such. Duplication, revision, distribu-tion, and any kind of use beyond the limits of copyright require the written consent of the authors. The duplication of parts of the work is only permitted if the source is mentioned.
AttributionPlease cite the work as follows: ICAP. (2021). Emissions Trading Worldwide: Status Report 2021. Berlin: International Carbon Action Partnership.
All queries on rights and permissions should be addressed to:
International Carbon Action Partnership (ICAP) Köthener Strasse 210963 BerlinGermany
← CONTENT

International Carbon Action Partnership
www.icapcarbonaction.com