statistics xi ipa
TRANSCRIPT

8/6/2019 Statistics Xi Ipa
http://slidepdf.com/reader/full/statistics-xi-ipa 1/21
YPPI 1 Senior High School Of Surabaya Statistics_ 0

8/6/2019 Statistics Xi Ipa
http://slidepdf.com/reader/full/statistics-xi-ipa 2/21
YPPI 1 Senior High School Of Surabaya Statistics_ 1
A. Statistics.
Statistics is the art of solving problems and answering questions by collecting and analysing
data.Statistic are used by government, businesses and sports organizations so that they can make
informed decisions when they are providing services such as health, transport and commerce
or developing new tactics. They also interested in using statistics as a means of analyzing the
effect of certain changes that may have been made, or in predicting what may happen in the
future.
There are two kinds of statistics :
a. Descriptive Statistics : procedures used to organize and present data in a convenient,
useable and communicable form.
b. Inferential Statistics : procedures employed to arrive at broader generalizations or
inferences sample data to populations.
Statistic is a number describing a sample characteristic. Results from the manipulation of
sample data according to certain specified procedures.
The next discussion we will learn about the descriptive statistics.
Populations and sample
a. Populations : a complete set of actual or potential observations
b. Sample : a subset of the population selected according to some scheme.
Data is characteristics or numbers are collected by observations.
There are two groups of data :
a. Quantitative data consists of :- Discrete data ( data cacahan)
- Continue data ( data ukuran )
b. Qualitative data consists of :
- Nominal data
- Ordinal data
B. Descriptive Statistics
Measures of central tendency are known as the mean , median and mode.
1. Mean ( rataan )
The mean is the average of all observations in a set of data
a. Ungrouped data ( data tunggal )
Kompetensi dasar : Kemampuan menyajikan dan
menafsirkan data dalam
bentuk tabel dan diagram;menghitung dan menafsirkan
ukuran pemusatan, ukuran
letak dan ukuran penyebarandata.
Mean = scoreof number
scoresall of sum
8/6/2019 Statistics Xi Ipa
http://slidepdf.com/reader/full/statistics-xi-ipa 3/21
YPPI 1 Senior High School Of Surabaya Statistics_ 2
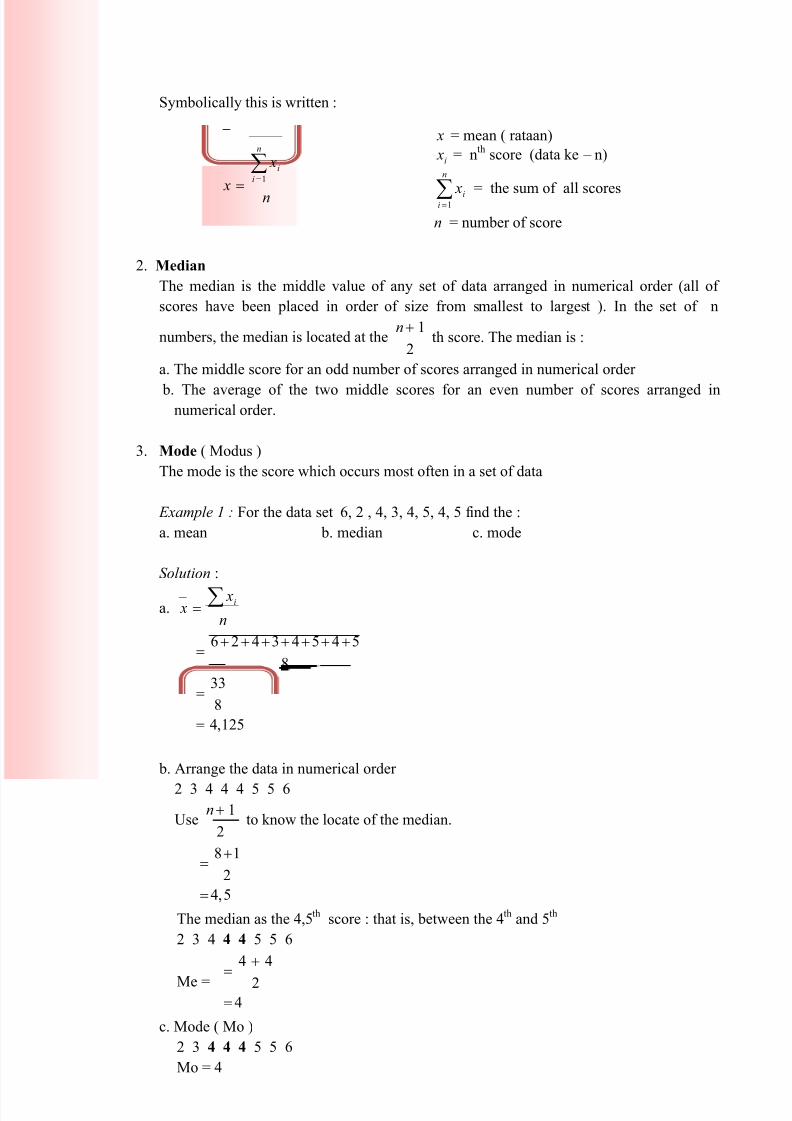
Symbolically this is written :
2. Median
The median is the middle value of any set of data arranged in numerical order (all of
scores have been placed in order of size from smallest to largest ). In the set of n
numbers, the median is located at the2
1+nth score. The median is :
a. The middle score for an odd number of scores arranged in numerical order
b. The average of the two middle scores for an even number of scores arranged innumerical order.
3. Mode ( Modus )
The mode is the score which occurs most often in a set of data
Example 1 : For the data set 6, 2 , 4, 3, 4, 5, 4, 5 find the :
a. mean b. median c. mode
Solution :
a.n
x x
i∑=
125,4
8
33
8
54543426
=
=
+++++++=
b. Arrange the data in numerical order
2 3 4 4 4 5 5 6
Use2
1+nto know the locate of the median.
5,4
2
18
=
+=
The median as the 4,5th
score : that is, between the 4th
and 5th
2 3 4 4 4 5 5 6
Me =4
2
44
=
+=
c. Mode ( Mo )
2 3 4 4 4 5 5 6
Mo = 4
n
x
x
n
i
i∑=
=1
x = mean ( rataan)
i x = nth
score (data ke – n)
∑=
n
ii
x1
= the sum of all scores
n = number of score
8/6/2019 Statistics Xi Ipa
http://slidepdf.com/reader/full/statistics-xi-ipa 4/21
YPPI 1 Senior High School Of Surabaya Statistics_ 3
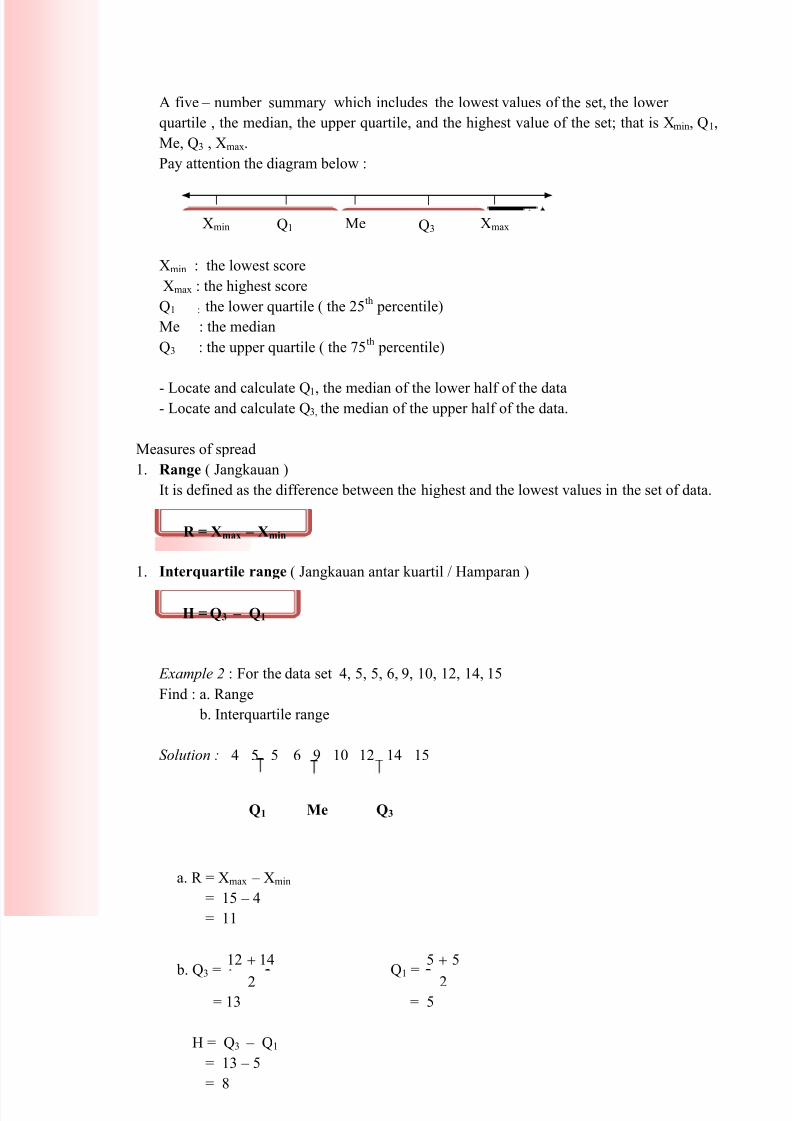
A five – number summary which includes the lowest values of the set, the lower
quartile , the median, the upper quartile, and the highest value of the set; that is Xmin, Q1,
Me, Q3 , Xmax.
Pay attention the diagram below :
Xmin : the lowest score
Xmax : the highest score
Q1 : the lower quartile ( the 25th
percentile)
Me : the median
Q3 : the upper quartile ( the 75th
percentile)
- Locate and calculate Q1, the median of the lower half of the data- Locate and calculate Q3, the median of the upper half of the data.
Measures of spread
1. Range ( Jangkauan )
It is defined as the difference between the highest and the lowest values in the set of data.
1. Interquartile range ( Jangkauan antar kuartil / Hamparan )
Example 2 : For the data set 4, 5, 5, 6, 9, 10, 12, 14, 15
Find : a. Range
b. Interquartile range
Solution : 4 5 5 6 9 10 12 14 15
a. R = Xmax – Xmin
= 15 – 4
= 11
b. Q3 =
2
1412 +Q1 =
2
55 +
= 13 = 5
H = Q3 – Q1
= 13 – 5
= 8
MeXmin Q1 Q3 Xmax
R = Xmax – Xmin
H = Q3 – Q1
Me Q3 Q1
8/6/2019 Statistics Xi Ipa
http://slidepdf.com/reader/full/statistics-xi-ipa 5/21
YPPI 1 Senior High School Of Surabaya Statistics_ 4
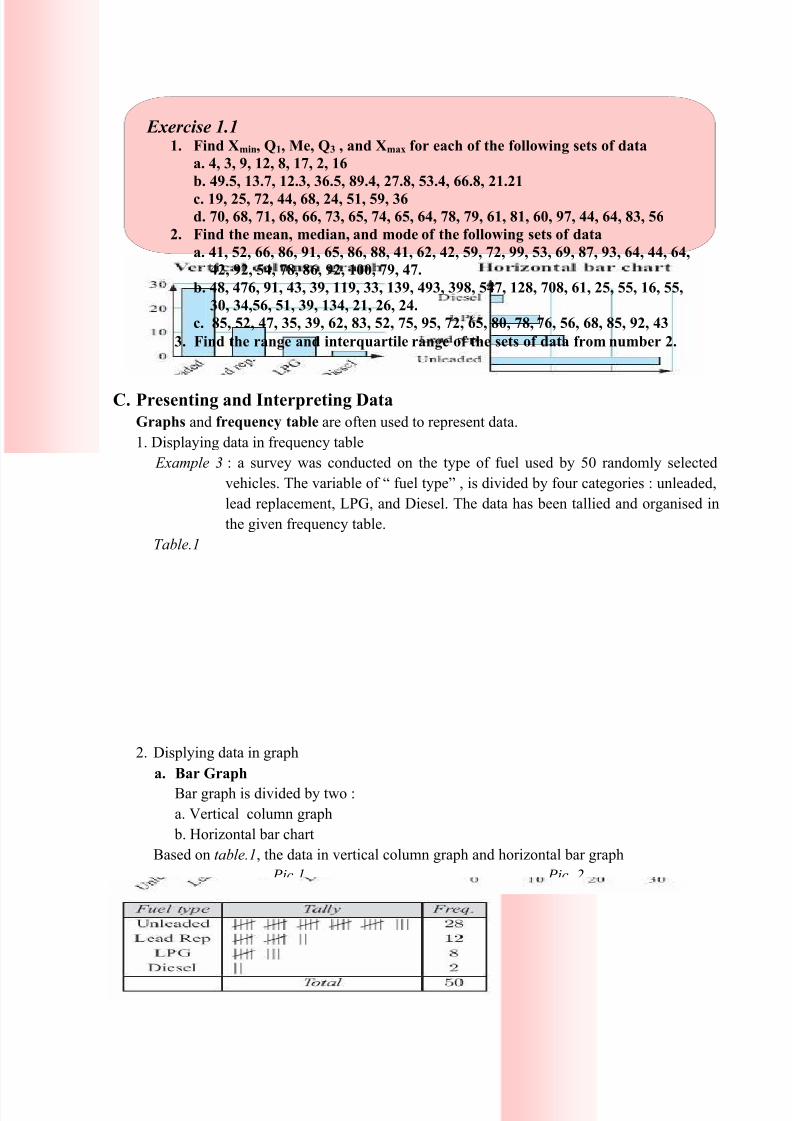
C. Presenting and Interpreting Data
Graphs and frequency table are often used to represent data.
1. Displaying data in frequency table
Example 3 : a survey was conducted on the type of fuel used by 50 randomly selected
vehicles. The variable of “ fuel type” , is divided by four categories : unleaded,
lead replacement, LPG, and Diesel. The data has been tallied and organised in
the given frequency table.
Table.1
2. Displying data in graph
a. Bar Graph
Bar graph is divided by two :
a. Vertical column graph
b. Horizontal bar chart
Based on table.1, the data in vertical column graph and horizontal bar graph
Pic.1 Pic. 2
Exercise 1.11. Find Xmin, Q1, Me, Q3 , and Xmax for each of the following sets of data
a. 4, 3, 9, 12, 8, 17, 2, 16
b. 49.5, 13.7, 12.3, 36.5, 89.4, 27.8, 53.4, 66.8, 21.21
c. 19, 25, 72, 44, 68, 24, 51, 59, 36d. 70, 68, 71, 68, 66, 73, 65, 74, 65, 64, 78, 79, 61, 81, 60, 97, 44, 64, 83, 56
2. Find the mean, median, and mode of the following sets of data
a. 41, 52, 66, 86, 91, 65, 86, 88, 41, 62, 42, 59, 72, 99, 53, 69, 87, 93, 64, 44, 64,
42, 92, 54, 78, 86, 92, 100, 79, 47.
b. 48, 476, 91, 43, 39, 119, 33, 139, 493, 398, 547, 128, 708, 61, 25, 55, 16, 55,
30, 34,56, 51, 39, 134, 21, 26, 24.
c. 85, 52, 47, 35, 39, 62, 83, 52, 75, 95, 72, 65, 80, 78, 76, 56, 68, 85, 92, 43
3. Find the range and interquartile range of the sets of data from number 2.
8/6/2019 Statistics Xi Ipa
http://slidepdf.com/reader/full/statistics-xi-ipa 6/21
YPPI 1 Senior High School Of Surabaya Statistics_ 5
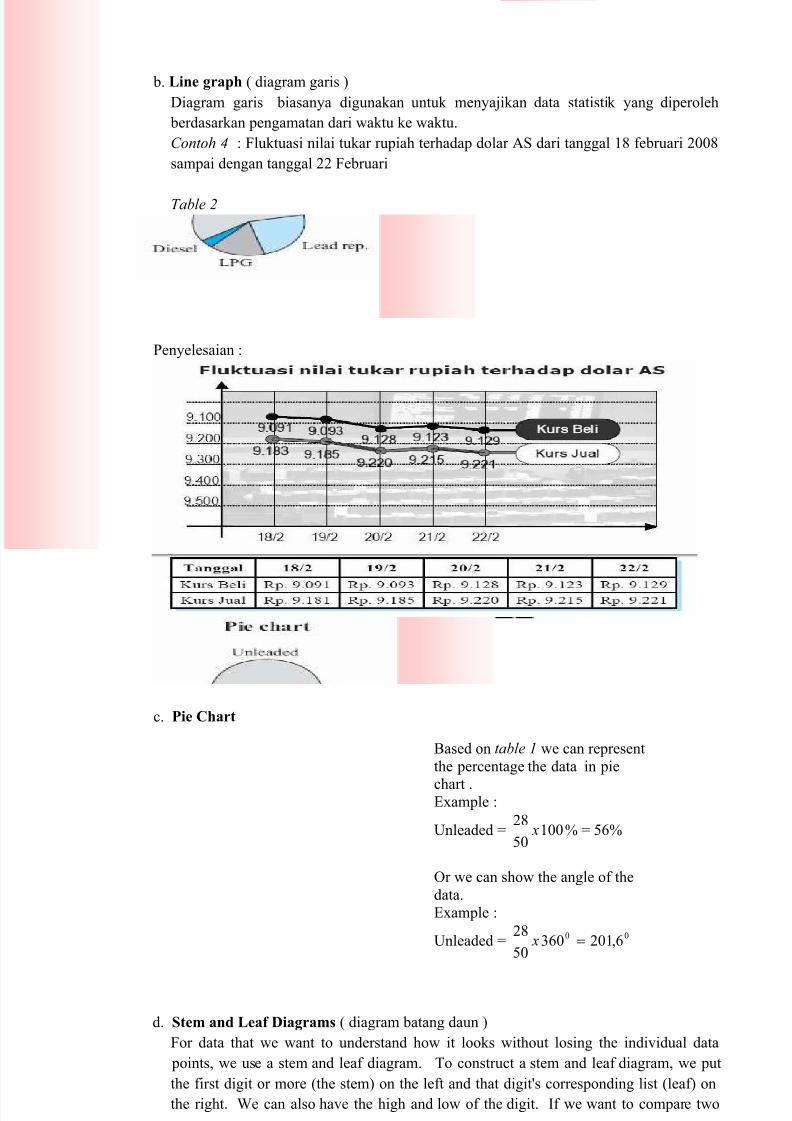
b. Line graph ( diagram garis )
Diagram garis biasanya digunakan untuk menyajikan data statistik yang diperoleh
berdasarkan pengamatan dari waktu ke waktu.
Contoh 4 : Fluktuasi nilai tukar rupiah terhadap dolar AS dari tanggal 18 februari 2008
sampai dengan tanggal 22 Februari
Table 2
Penyelesaian :
c. Pie Chart
d. Stem and Leaf Diagrams ( diagram batang daun )
For data that we want to understand how it looks without losing the individual data
points, we use a stem and leaf diagram. To construct a stem and leaf diagram, we put
the first digit or more (the stem) on the left and that digit's corresponding list (leaf) on
the right. We can also have the high and low of the digit. If we want to compare two
Based on table 1 we can represent
the percentage the data in pie
chart .Example :
Unleaded = 10050
28 x % = 56%
Or we can show the angle of the
data.
Example :
Unleaded =00
6,20136050
28= x
8/6/2019 Statistics Xi Ipa
http://slidepdf.com/reader/full/statistics-xi-ipa 7/21
YPPI 1 Senior High School Of Surabaya Statistics_ 6
data sets we can draw the digits in the middle, the first set of leaves on the right, and the
second set of leaves on the left. This is useful for comparing two data sets.
A comparative stem and leaf diagram is often used. The middle represents the stems,
and the left and right sides are the leaves of each of the two data sets.
Example 5 :
A computer retailer collected data on the number of computers sold during 20
consecutive Saturdays during the year. The results are as follows:
12, 14, 14, 17, 21, 24, 24, 25, 25, 26,
26, 27, 29, 31, 34, 35, 36, 39, 40, 42,
42, 45, 46, 47, 49, 49, 56, 59, 62.
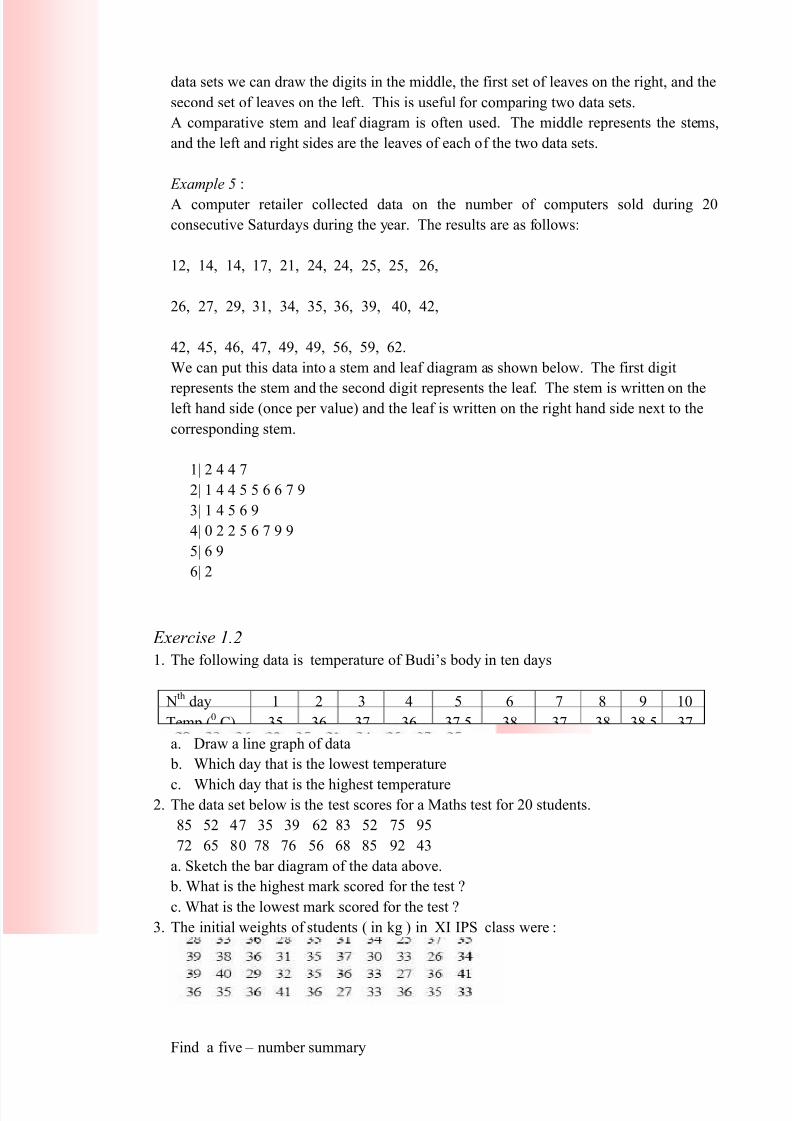
We can put this data into a stem and leaf diagram as shown below. The first digit
represents the stem and the second digit represents the leaf. The stem is written on theleft hand side (once per value) and the leaf is written on the right hand side next to the
corresponding stem.
1| 2 4 4 7
2| 1 4 4 5 5 6 6 7 9
3| 1 4 5 6 9
4| 0 2 2 5 6 7 9 9
5| 6 9
6| 2
Exercise 1.2
1. The following data is temperature of Budi’s body in ten days
Nth
day 1 2 3 4 5 6 7 8 9 10
Temp (0
C) 35 36 37 36 37,5 38 37 38 38,5 37
a. Draw a line graph of data
b. Which day that is the lowest temperature
c. Which day that is the highest temperature2. The data set below is the test scores for a Maths test for 20 students.
85 52 47 35 39 62 83 52 75 95
72 65 80 78 76 56 68 85 92 43
a. Sketch the bar diagram of the data above.
b. What is the highest mark scored for the test ?
c. What is the lowest mark scored for the test ?
3. The initial weights of students ( in kg ) in XI IPS class were :
Find a five – number summary
8/6/2019 Statistics Xi Ipa
http://slidepdf.com/reader/full/statistics-xi-ipa 8/21
YPPI 1 Senior High School Of Surabaya Statistics_ 7
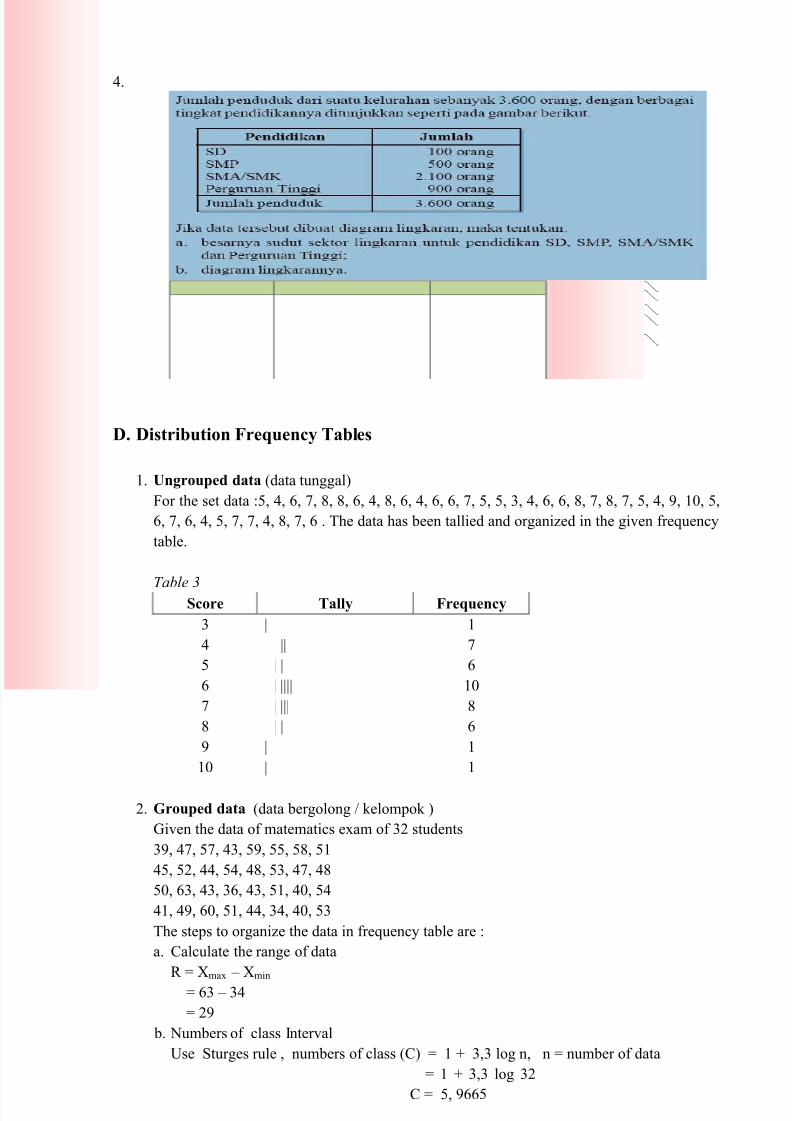
4.
D. Distribution Frequency Tables
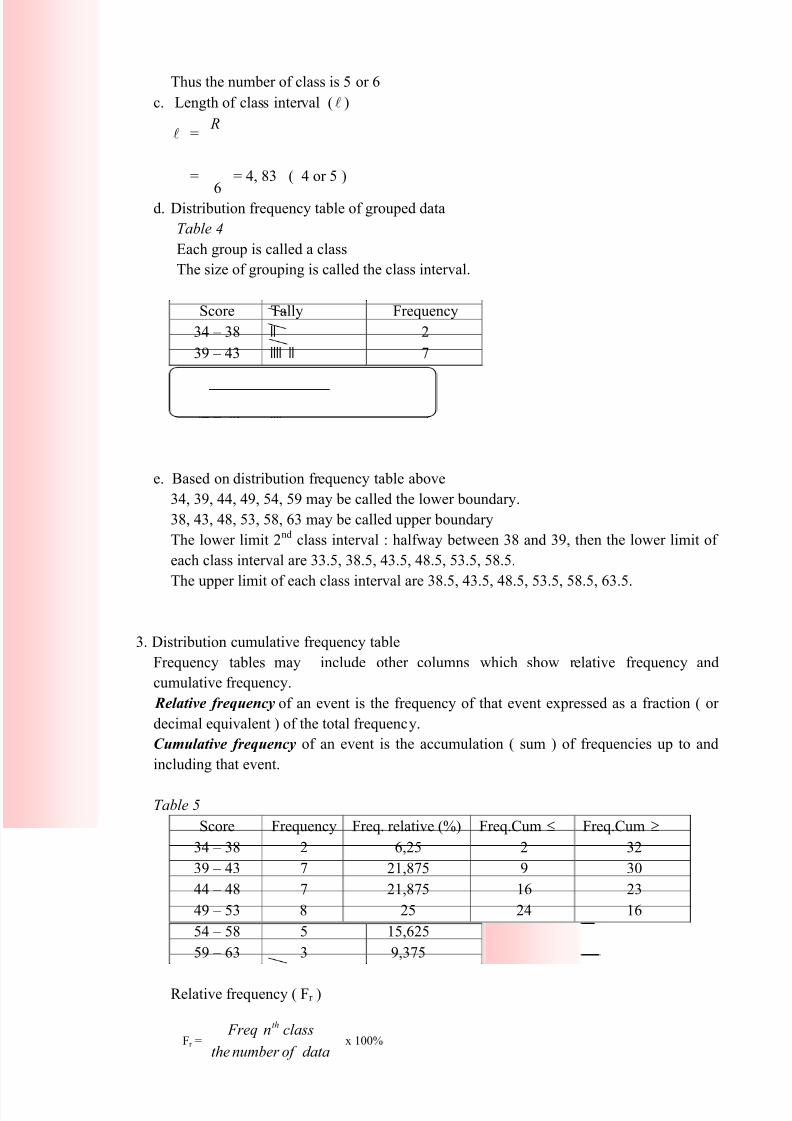
1. Ungrouped data (data tunggal)
For the set data :5, 4, 6, 7, 8, 8, 6, 4, 8, 6, 4, 6, 6, 7, 5, 5, 3, 4, 6, 6, 8, 7, 8, 7, 5, 4, 9, 10, 5,
6, 7, 6, 4, 5, 7, 7, 4, 8, 7, 6 . The data has been tallied and organized in the given frequency
table.
Table 3 Score Tally Frequency
3
4
5
6
7
8
9
10
|
|||| ||
|||| |
|||| ||||
|||| |||
|||| |
|
|
1
7
6
10
8
6
1
1
2. Grouped data (data bergolong / kelompok )
Given the data of matematics exam of 32 students
39, 47, 57, 43, 59, 55, 58, 51
45, 52, 44, 54, 48, 53, 47, 48
50, 63, 43, 36, 43, 51, 40, 54
41, 49, 60, 51, 44, 34, 40, 53
The steps to organize the data in frequency table are :
a. Calculate the range of data
R = Xmax – Xmin
= 63 – 34
= 29
b. Numbers of class Interval
Use Sturges rule , numbers of class (C) = 1 + 3,3 log n, n = number of data
= 1 + 3,3 log 32
C = 5, 9665
8/6/2019 Statistics Xi Ipa
http://slidepdf.com/reader/full/statistics-xi-ipa 9/21
YPPI 1 Senior High School Of Surabaya Statistics_ 8
Thus the number of class is 5 or 6
c. Length of class interval ( l )
l =C
R
=6
29= 4, 83 ( 4 or 5 )
d. Distribution frequency table of grouped data
Table 4
Each group is called a class
The size of grouping is called the class interval.
Score Tally Frequency
34 – 38 ll 2
39 – 43 llll ll 7
44 – 48 llll ll 7
49 – 53 llll lll 854 – 58 llll 5
59 – 63 lll 3
e. Based on distribution frequency table above
34, 39, 44, 49, 54, 59 may be called the lower boundary.
38, 43, 48, 53, 58, 63 may be called upper boundary
The lower limit 2nd
class interval : halfway between 38 and 39, then the lower limit of
each class interval are 33.5, 38.5, 43.5, 48.5, 53.5, 58.5.
The upper limit of each class interval are 38.5, 43.5, 48.5, 53.5, 58.5, 63.5.
3. Distribution cumulative frequency table
Frequency tables may include other columns which show relative frequency and
cumulative frequency.
Relative frequency of an event is the frequency of that event expressed as a fraction ( or
decimal equivalent ) of the total frequency.
Cumulative frequency of an event is the accumulation ( sum ) of frequencies up to and
including that event.
Table 5
Score Frequency Freq. relative (%) Freq.Cum ≤ Freq.Cum ≥
34 – 38 2 6,25 2 32
39 – 43 7 21,875 9 30
44 – 48 7 21,875 16 23
49 – 53 8 25 24 16
54 – 58 5 15,625 29 8
59 – 63 3 9,375 32 3
Relative frequency ( Fr )
Fr =dataof number the
classn Freq th
x 100%
8/6/2019 Statistics Xi Ipa
http://slidepdf.com/reader/full/statistics-xi-ipa 10/21
YPPI 1 Senior High School Of Surabaya Statistics_ 9
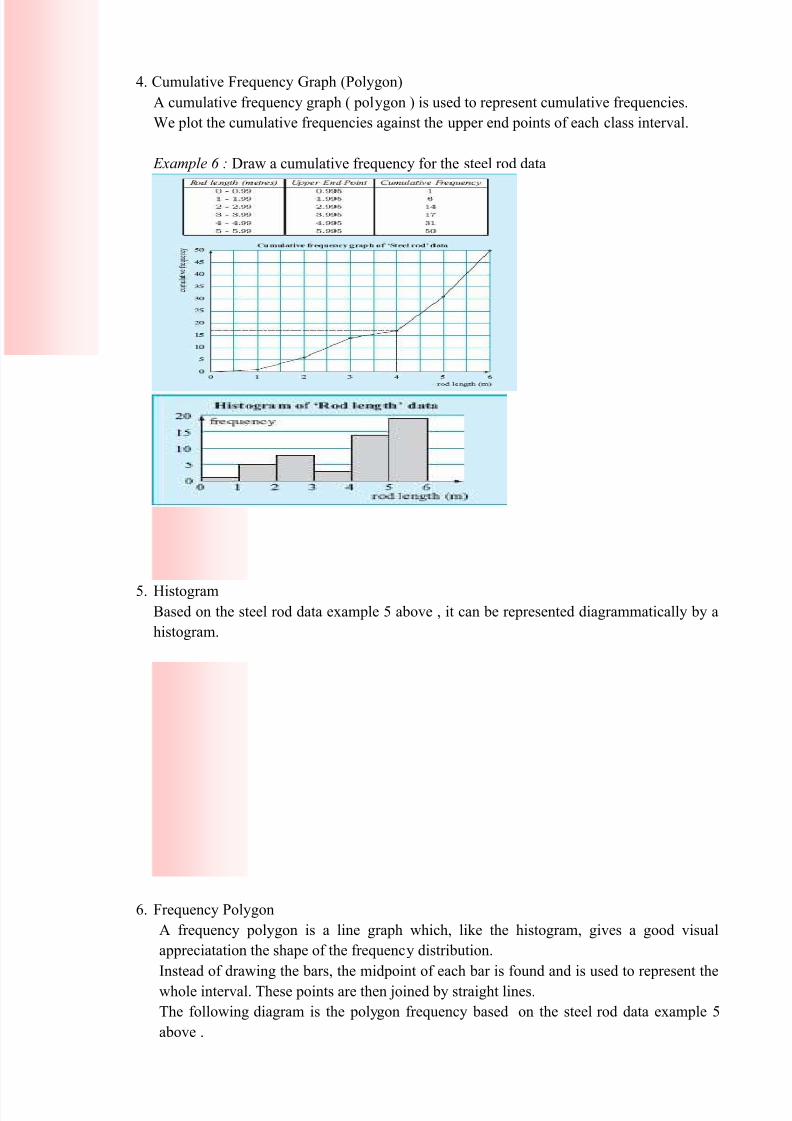
4. Cumulative Frequency Graph (Polygon)
A cumulative frequency graph ( polygon ) is used to represent cumulative frequencies.
We plot the cumulative frequencies against the upper end points of each class interval.
Example 6 : Draw a cumulative frequency for the steel rod data
5. HistogramBased on the steel rod data example 5 above , it can be represented diagrammatically by a
histogram.
6. Frequency Polygon
A frequency polygon is a line graph which, like the histogram, gives a good visual
appreciatation the shape of the frequency distribution.
Instead of drawing the bars, the midpoint of each bar is found and is used to represent the
whole interval. These points are then joined by straight lines.
The following diagram is the polygon frequency based on the steel rod data example 5
above .

8/6/2019 Statistics Xi Ipa
http://slidepdf.com/reader/full/statistics-xi-ipa 11/21
YPPI 1 Senior High School Of Surabaya Statistics_ 10
Exercise 1.3
1. Given the following data :
80 66 74 74 70 71 78 74 72 67
72 73 73 72 75 74 74 74 72 72
66 75 74 73 74 72 79 71 75 75
78 69 71 70 79 80 75 76 68 68
Represent the data into :
a. Ungrouped Frequency Distribution tables
b. Grouped Frequency Distribution tables using classes : 65 – 67 , 68 – 70 , 71 – 73 ,
74 – 76, 77 – 79 , 80 – 82 .
2.
Height (m) Frequency
119 – 127 3
128 – 136 6137 – 145 10
146 – 154 11
155 – 163 5
164 – 172 3
173 – 181 2
3. Given the following data :
a. Organise the data into grouped data
b. How many class interval that happened ?
c. Mentioned the lower and upper limit of each class
d. Mentioned the midpoint
Represent the tables beside into freq
cumulative and relative tables, and then
construct :a. histogram
b. polygon
c. ogive
8/6/2019 Statistics Xi Ipa
http://slidepdf.com/reader/full/statistics-xi-ipa 12/21
YPPI 1 Senior High School Of Surabaya Statistics_ 11
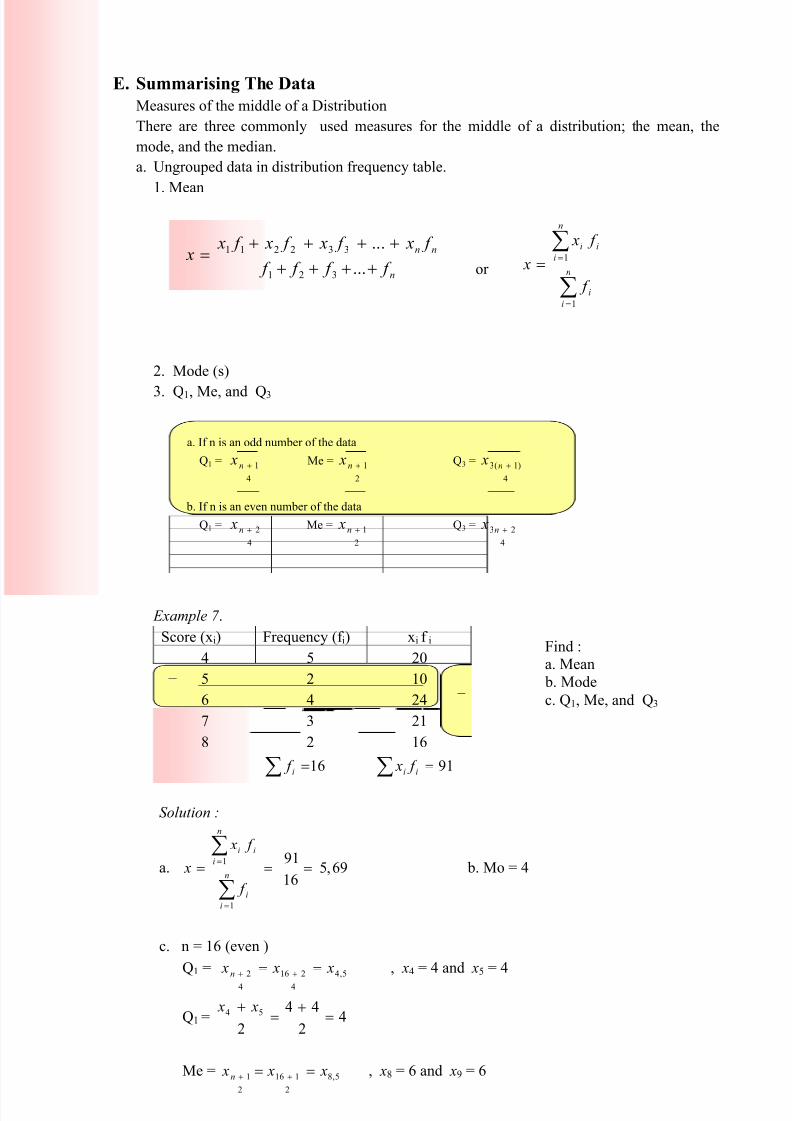
E. Summarising The Data
Measures of the middle of a Distribution
There are three commonly used measures for the middle of a distribution; the mean, the
mode, and the median.
a. Ungrouped data in distribution frequency table.
1. Mean
or
2. Mode (s)
3. Q1, Me, and Q3
Example 7 .
Score (xi) Frequency (f i) xi f i
4 5 20
5 2 10
6 4 24
7 3 21
8 2 16
16=∑ i f ∑ = 91ii f x
Solution :
a. 69,516
91
1
1===
∑
∑
=
=
n
i
i
n
i
ii
f
f x
x b. Mo = 4
c. n = 16 (even )
Q1 = 5,4
4
216
4
2 x x x n == ++ , x4 = 4 and x5 = 4
Q1 = 42
44
2
54 =+
=+ x x
Me = 5,8
2
116
2
1 x x xn == ++ , x8 = 6 and x9 = 6
Find :a. Mean
b. Mode
c. Q1, Me, and Q3
n
nn
f f f f
f x f x f x f x x
++++
++++=
...
...
321
332211
∑
∑
=
==
n
i
i
n
i
ii
f
f x
x
1
1
a. If n is an odd number of the data
Q1 =
4
1+n x Me =
2
1+n x Q3 =
4
)1(3 +n x
b. If n is an even number of the data
Q1 =
4
2+n x Me =
2
1+n x Q3 =
4
23 +n x

8/6/2019 Statistics Xi Ipa
http://slidepdf.com/reader/full/statistics-xi-ipa 13/21
YPPI 1 Senior High School Of Surabaya Statistics_ 12
Me = 62
66
2
98 =+
=+ x x
Q3 = 5,12
4
216.3
4
23 x x x n == ++ , x12 = 7 and x13 = 7
Q3 = 72
77
2
1312 =+
=+ x x
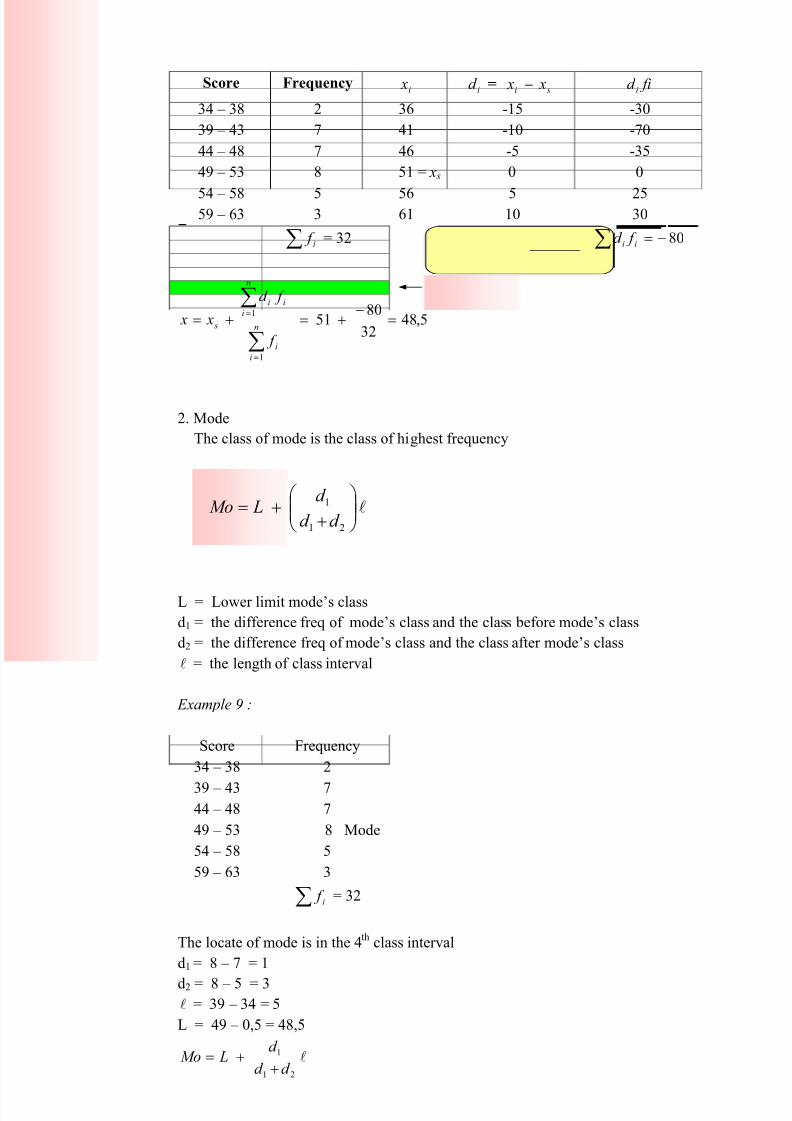
b. Grouped data
1. Mean
i x : midpoint
The midpoint of a class interval is the average of its endpoints
Example 8:
Score Frequencyi x fi xi
34 – 38 2 36 72
39 – 43 7 41 287
44 – 48 7 46 322
49 – 53 8 51 408
54 – 58 5 56 280
59 – 63 3 61 183
∑i
f = 32
∑= 1552
ii f x
5,4832
1552
1
1===
∑
∑
=
=
n
i
i
n
i
ii
f
f x
x or
, Take any i x as s x and calculate id = i x – s x
∑
∑
=
==n
i
i
n
i
ii
f
f x
x
1
1
∑
∑
=
=+=
n
i
i
n
i
ii
s
f
f d
x x
1
1
8/6/2019 Statistics Xi Ipa
http://slidepdf.com/reader/full/statistics-xi-ipa 14/21
YPPI 1 Senior High School Of Surabaya Statistics_ 13
Score Frequencyi x id = i x – s x fid i
34 – 38 2 36 -15 -30
39 – 43 7 41 -10 -70
44 – 48 7 46 -5 -35
49 – 53 8 51 = x s 0 0
54 – 58 5 56 5 2559 – 63 3 61 10 30
∑ i f = 32 ∑ −= 80ii f d
5,4832
8051
1
1=
−+=+=
∑
∑
=
=
n
i
i
n
i
ii
s
f
f d
x x
2. Mode
The class of mode is the class of highest frequency
L = Lower limit mode’s class
d1 = the difference freq of mode’s class and the class before mode’s class
d2 = the difference freq of mode’s class and the class after mode’s class
l = the length of class interval
Example 9 :
Score Frequency
34 – 38 2
39 – 43 744 – 48 7
49 – 53 8 Mode
54 – 58 5
59 – 63 3
∑ i f = 32
The locate of mode is in the 4th
class interval
d1 = 8 – 7 = 1
d2 = 8 – 5 = 3l = 39 – 34 = 5
L = 49 – 0,5 = 48,5
l
21
1
d d
d LMo
++=
l
++=
21
1
d d
d LMo
8/6/2019 Statistics Xi Ipa
http://slidepdf.com/reader/full/statistics-xi-ipa 15/21
YPPI 1 Senior High School Of Surabaya Statistics_ 14
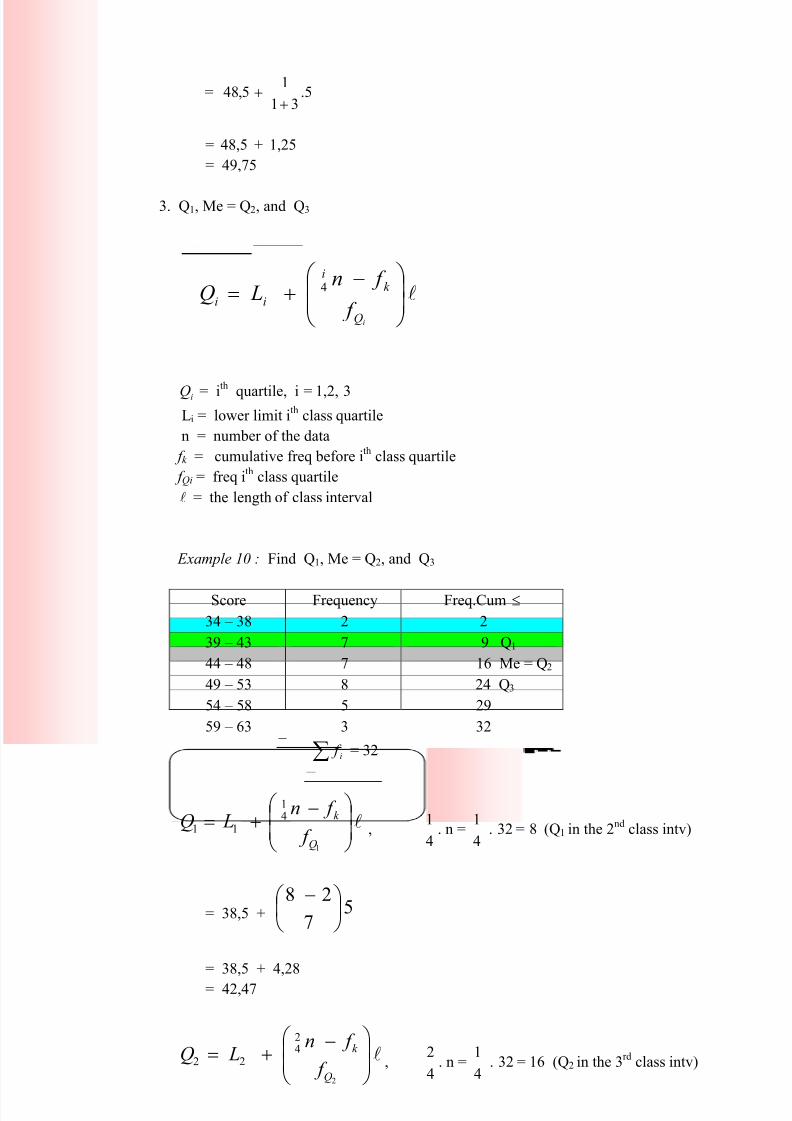
= 5.31
15,48
++
= 48,5 + 1,25
= 49,75
3. Q1, Me = Q2, and Q3
iQ = ith
quartile, i = 1,2, 3Li = lower limit i
thclass quartile
n = number of the data
f k = cumulative freq before ith
class quartile
f Qi = freq ith
class quartile
l = the length of class interval
Example 10 : Find Q1, Me = Q2, and Q3
Score Frequency Freq.Cum ≤
34 – 38 2 2
39 – 43 7 9 Q1
44 – 48 7 16 Me = Q2
49 – 53 8 24 Q3
54 – 58 5 29
59 – 63 3 32
∑ i f = 32
l
−+=
1
41
11
Q
k
f
f n LQ ,
4
1. n =
4
1. 32 = 8 (Q1 in the 2
ndclass intv)
= 38,5 + 57
28
−
= 38,5 + 4,28
= 42,47
l
−+=
2
42
22
Q
k
f
f n LQ ,
4
2. n =
4
1. 32 = 16 (Q2 in the 3
rdclass intv)
l
−+=
iQ
k i
ii f
f n LQ 4
8/6/2019 Statistics Xi Ipa
http://slidepdf.com/reader/full/statistics-xi-ipa 16/21
YPPI 1 Senior High School Of Surabaya Statistics_ 15
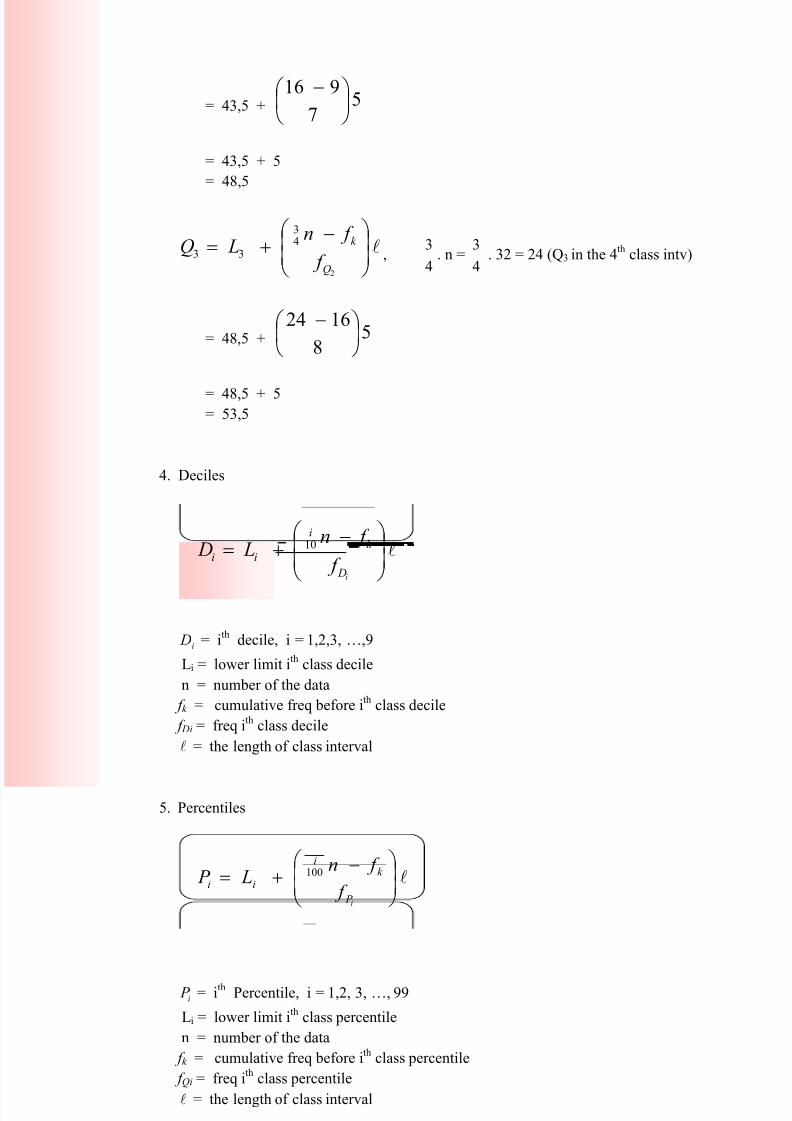
= 43,5 + 57
916
−
= 43,5 + 5
= 48,5
l
−+=
2
43
33
Q
k
f
f n LQ ,
4
3. n =
4
3. 32 = 24 (Q3 in the 4
thclass intv)
= 48,5 + 58
1624
−
= 48,5 + 5= 53,5
4. Deciles
i D = ith
decile, i = 1,2,3, …,9
Li = lower limit ith
class decile
n = number of the data
f k = cumulative freq before ith
class decile
f Di = freq ith
class decile
l = the length of class interval
5. Percentiles
i P = ith
Percentile, i = 1,2, 3, …, 99
Li = lower limit ith
class percentile
n = number of the data
f k = cumulative freq before ith
class percentile
f Qi = freq ith
class percentile
l = the length of class interval
l
−+=
i D
k i
ii f
f n L D 10
l
−+=
i P
k i
ii f
f n L P 100
8/6/2019 Statistics Xi Ipa
http://slidepdf.com/reader/full/statistics-xi-ipa 17/21
YPPI 1 Senior High School Of Surabaya Statistics_ 16
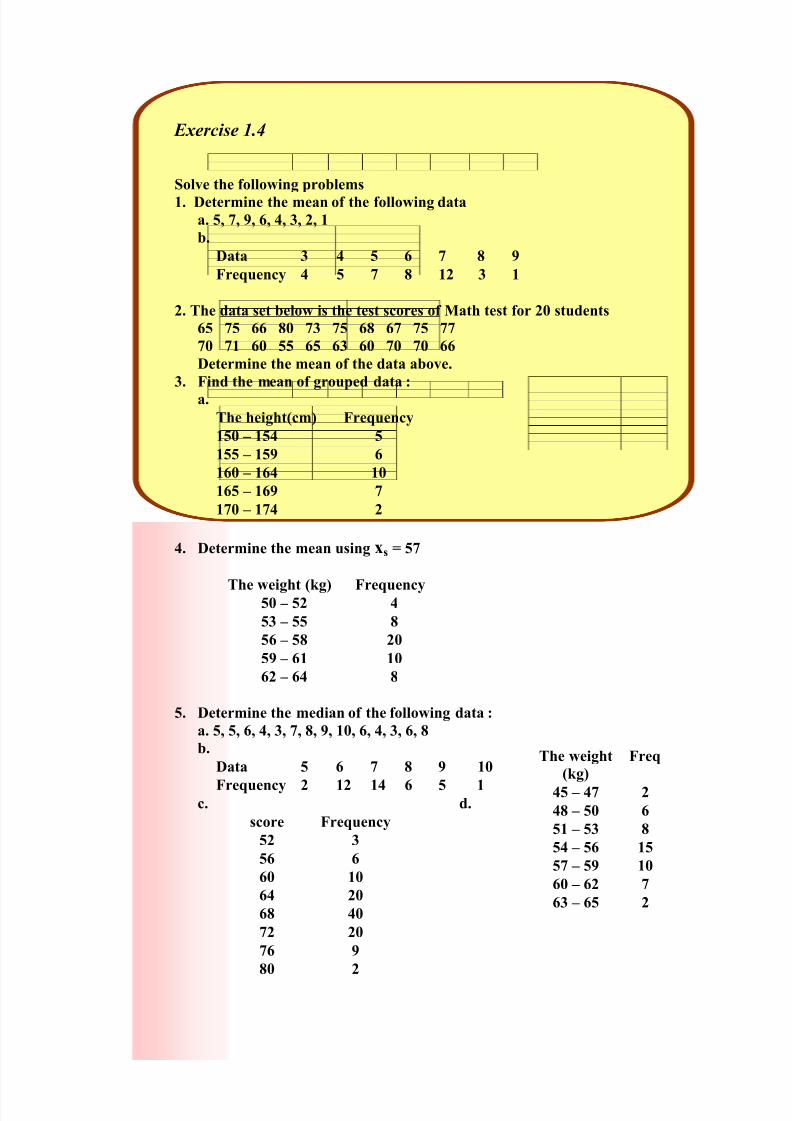
Exercise 1.4
Solve the following problems
1. Determine the mean of the following data
a. 5, 7, 9, 6, 4, 3, 2, 1
b.
Data 3 4 5 6 7 8 9
Frequency 4 5 7 8 12 3 1
2. The data set below is the test scores of Math test for 20 students
65 75 66 80 73 75 68 67 75 77
70 71 60 55 65 63 60 70 70 66
Determine the mean of the data above.
3. Find the mean of grouped data :
a.
The height(cm) Frequency
150 – 154 5
155 – 159 6
160 – 164 10
165 – 169 7
170 – 174 2
4. Determine the mean using xs = 57
The weight (kg) Frequency50 – 52 4
53 – 55 8
56 – 58 20
59 – 61 10
62 – 64 8
5. Determine the median of the following data :
a. 5, 5, 6, 4, 3, 7, 8, 9, 10, 6, 4, 3, 6, 8
b.
Data 5 6 7 8 9 10
Frequency 2 12 14 6 5 1c. d.
score Frequency
52 3
56 6
60 10
64 20
68 40
72 20
76 9
80 2
The weight
(kg)
Freq
45 – 47 2
48 – 50 6
51 – 53 8
54 – 56 15
57 – 59 10
60 – 62 7
63 – 65 2
8/6/2019 Statistics Xi Ipa
http://slidepdf.com/reader/full/statistics-xi-ipa 18/21
YPPI 1 Senior High School Of Surabaya Statistics_ 17
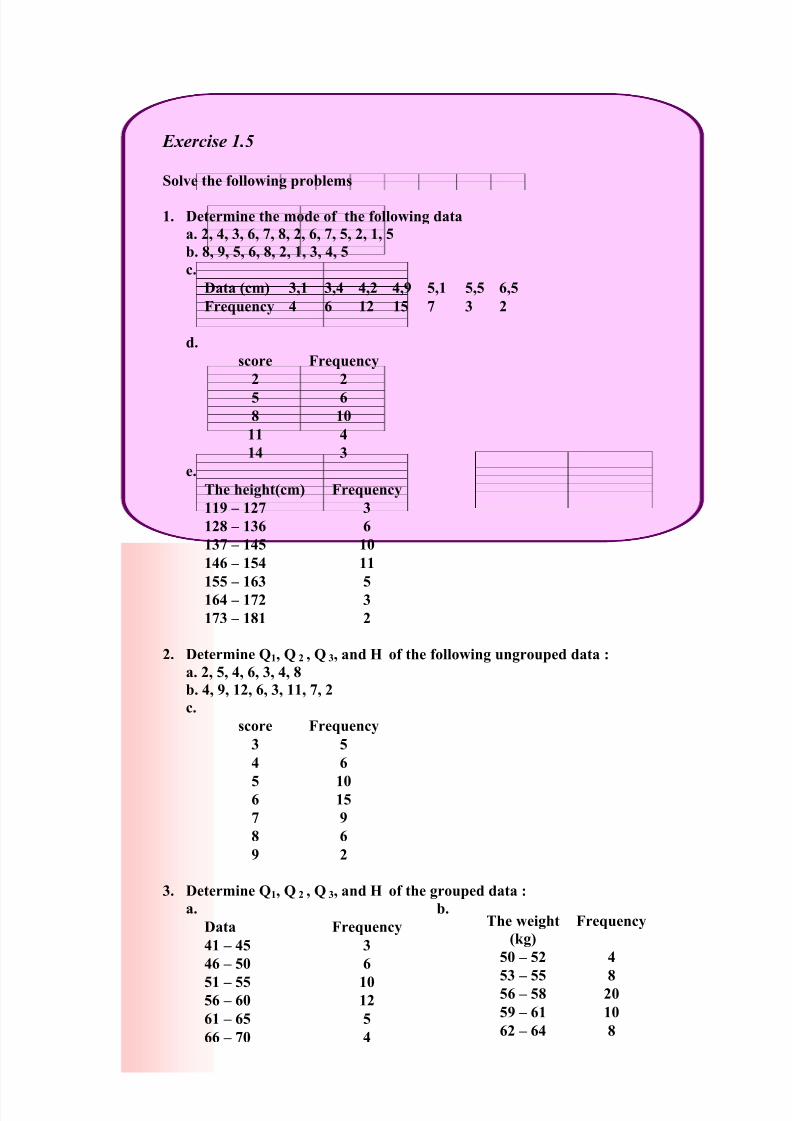
Exercise 1.5
Solve the following problems
1. Determine the mode of the following data
a. 2, 4, 3, 6, 7, 8, 2, 6, 7, 5, 2, 1, 5
b. 8, 9, 5, 6, 8, 2, 1, 3, 4, 5
c.
Data (cm) 3,1 3,4 4,2 4,9 5,1 5,5 6,5
Frequency 4 6 12 15 7 3 2
d.
score Frequency
2 2
5 6
8 10
11 4
14 3
e.
The height(cm) Frequency
119 – 127 3
128 – 136 6
137 – 145 10
146 – 154 11
155 – 163 5164 – 172 3
173 – 181 2
2. Determine Q1, Q 2 , Q 3, and H of the following ungrouped data :
a. 2, 5, 4, 6, 3, 4, 8
b. 4, 9, 12, 6, 3, 11, 7, 2
c.
score Frequency
3 5
4 6
5 106 15
7 9
8 6
9 2
3. Determine Q1, Q 2 , Q 3, and H of the grouped data :
a. b.
Data Frequency
41 – 45 3
46 – 50 6
51 – 55 1056 – 60 12
61 – 65 5
66 – 70 4
The weight
(kg)
Frequency
50 – 52 4
53 – 55 856 – 58 20
59 – 61 10
62 – 64 8
8/6/2019 Statistics Xi Ipa
http://slidepdf.com/reader/full/statistics-xi-ipa 19/21
YPPI 1 Senior High School Of Surabaya Statistics_ 18
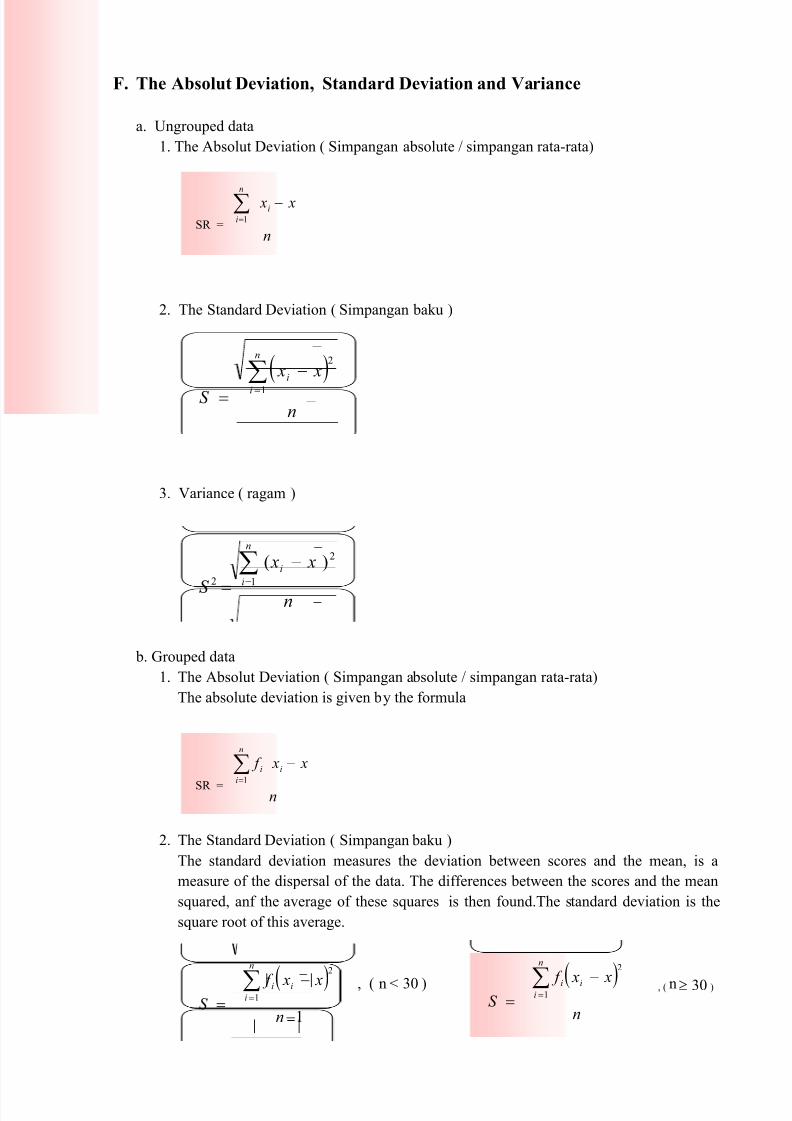
F. The Absolut Deviation, Standard Deviation and Variance
a. Ungrouped data
1. The Absolut Deviation ( Simpangan absolute / simpangan rata-rata)
2. The Standard Deviation ( Simpangan baku )
3. Variance ( ragam )
b. Grouped data
1. The Absolut Deviation ( Simpangan absolute / simpangan rata-rata)
The absolute deviation is given by the formula
2. The Standard Deviation ( Simpangan baku )
The standard deviation measures the deviation between scores and the mean, is a
measure of the dispersal of the data. The differences between the scores and the mean
squared, anf the average of these squares is then found.The standard deviation is the
square root of this average.
, ( n < 30 ) , ( n 30≥ )( )n
x x f S
n
iii
∑= −=
1
2
( )
1
1
2
−
−= ∑=
n
x x f S
n
i
ii
SR = n
x x f n
i
ii∑=
−1
n
x x
S
n
i
i∑=
−
=1
2
2
)(
( )
n
x x
S
n
i
i∑=
−
=1
2
SR =n
x xn
i
i∑= −1

8/6/2019 Statistics Xi Ipa
http://slidepdf.com/reader/full/statistics-xi-ipa 20/21
YPPI 1 Senior High School Of Surabaya Statistics_ 19
3. Variance ( ragam )
, ( n < 30 ) , ( n 30≥ )
4. Quartile deviation ( Simpangan Kuartil / Qd )
)(2
113 QQQd −=
Example 11 :
a. For the data 3, 4, 6, 8, 9, then find SR, S, S2.
Solution :
x = 6530
598643 ==++++
SR =n
x xn
i
i∑=
−1 =
5
6968666463 −+−+−+−+−
= 25
10
5
32023==
++++
n
x x
S
n
i
i∑=
−
= 1
2
2
)(
=( )
5
)69()68()66()64(63 22222−+−+−+−+−
= 2,55
26
5
94049==
++++
( )
n
x x
S
n
i
i∑=
−
=1
2
= 2S = =2,5 2,28
Example 12: Find SR, S, S2, x = 48,5
Score Frequencyi x l i x – x l ( i x – x )
2i f l i x – x l i f ( i x – x )
2
34 – 38 2 36 12,5 156,25 25 312,5
39 – 43 7 41 7,5 56,25 52,5 393,75
44 – 48 7 46 2,5 6,25 17,5 43,75
49 – 53 8 51 2,5 6,25 20 50
54 – 58 5 56 7,5 56,25 37,5 281,25
59 – 63 3 61 12,5 156,25 37,5 468,75
∑ i f = 32 ∑ − x x f ii
=190
∑ − 2)( x x f ii
= 1550
n
x x f
S
n
i
ii∑=
−
= 1
2
2
)(
1
)(1
2
2
−
−
=∑=
n
x x f
S
n
i
ii

8/6/2019 Statistics Xi Ipa
http://slidepdf.com/reader/full/statistics-xi-ipa 21/21
YPPI 1 Senior High School Of Surabaya Statistics_ 20
a. c. S = 2S
= 50 = 7,07
=32
190
= 5,9375
b.
=31
1550= 50
Exercise 1.6
1. Determine SR of the following data
a. 6, 8, 11, 3, 2
b. 2, 4, 6, 2, 1
2. Determine S and S2
of the following data
a. 3, 11, 2, 8, 6
b. 4, 6, 5, 7, 3
3. Determine SR, S, and S2
of the following grouped data :
a.
Age Frequency
1 – 5 2
6 – 10 7
11 – 15 5
16 – 20 9
21 – 25 6
b.
Data Frequency
41 – 45 3
46 – 50 6
51 – 55 10
56 – 60 12
61 – 65 5
66 – 70 4
SR =n
x x f n
i
ii∑=
−1
n
x x f
S
n
i
ii∑=
−
= 1
2
2
)(