statistics troubleshooting · statistics events and alarms statistics events and alarms this...
TRANSCRIPT

Cisco BTS 102OL-25016-02
C H A P T E R 11
Statistics TroubleshootingRevised: May 14, 2012, OL-25016-02
IntroductionThis chapter provides the information needed for monitoring and troubleshooting statistics events and alarms. This chapter is divided into the following sections:
• Statistics Events and Alarms—Provides a brief overview of each statistics event and alarm
• Monitoring Statistics Events—Provides the information needed for monitoring and correcting the statistics events
• Troubleshooting Statistics Alarms—Provides the information needed for troubleshooting and correcting the statistics alarms
11-100 Softswitch Troubleshooting Guide, Release 6.0.4

Chapter 11 Statistics TroubleshootingStatistics Events and Alarms
Statistics Events and AlarmsThis section provides a brief overview of all of the statistics events and alarms for the Cisco BTS 10200 Softswitch; the event and alarms are arranged in numerical order. Table 11-1 lists all of the statistics events and alarms by severity.
Note Refer to the “Obtaining Documentation and Submitting a Service Request” section on page l for detailed instructions on contacting Cisco TAC and opening a service request.
Note Click the statistics message number in Table 11-1 to display information about the event or alarm.
Statistics (1)Table 11-2 lists the details of the Statistics (1) informational event. For additional information, refer to the “Test Report—Statistics (1)” section on page 11-15.
Table 11-1 Statistics Events and Alarms by Severity
Critical Major Minor Warning Information Not Used
Statistics (12) Statistics (15) Statistics (8) Statistics (1)
Statistics (13) Statistics (9) Statistics (2)
Statistics (10) Statistics (3)
Statistics (11) Statistics (4)
Statistics (14) Statistics (5)
Statistics (16) Statistics (6)
Statistics (7)
Table 11-2 Statistics (1) Details
Description Test Report
Severity Information
Threshold 10000
Throttle 0
11-2Cisco BTS 10200 Softswitch Troubleshooting Guide, Release 6.0.4
OL-25016-02

Chapter 11 Statistics TroubleshootingStatistics Events and Alarms
Statistics (2)Table 11-3 lists the details of the Statistics (2) informational event. For additional information, refer to the “Call Agent Measurement Collection Started—Statistics (2)” section on page 11-15.
Statistics (3)Table 11-3 lists the details of the Statistics (3) informational event. For additional information, refer to the “Call Agent Measurement Collection Finished—Statistics (3)” section on page 11-15.
Table 11-3 Statistics (2) Details
Description Call Agent Measurement Collection Started
Severity Information
Threshold 100
Throttle 0
Datawords Start Time—STRING [40]
PrimaryCause
Indicates that the 15-minute traffic measurement collection process has started on the Call Agent.
PrimaryAction
No action is necessary.
Table 11-4 Statistics (3) Details
Description Call Agent Measurement Collection Finished
Severity Information
Threshold 100
Throttle 0
Datawords End Time—STRING [40]
PrimaryCause
Indicates that the 15-minute traffic measurement collection process has completed on the Call Agent.
PrimaryAction
No action is necessary.
11-3Cisco BTS 10200 Softswitch Troubleshooting Guide, Release 6.0.4
OL-25016-02

Chapter 11 Statistics TroubleshootingStatistics Events and Alarms
Statistics (4)Table 11-5 lists the details of the Statistics (4) informational event. For additional information, refer to the “Plain Old Telephone Service/Centrex/Telecommunications Data Link Monitor Feature Server Measurement Collection Started—Statistics (4)” section on page 11-15.
Statistics (5)Table 11-6 lists the details of the Statistics (5) informational event. For additional information, refer to the “Plain Old Telephone Service/Centrex/Telecommunications Data Link Monitor Feature Server Measurement Collection Finished—Statistics (5)” section on page 11-15.
Table 11-5 Statistics (4) Details
Description Plain Old Telephone Service/Centrex/Telecommunications Data Link Monitor Feature Server Measurement Collection Started (POTS/CTX/TDM Feature Server Measurement Collection Started)
Severity Information
Threshold 100
Throttle 0
Datawords Start Time—STRING [40]
PrimaryCause
Indicates that the 15-minute traffic measurement collection process has started on the plain old telephone service (POTS)/Centrex/Tandem Feature Server.
PrimaryAction
No action is necessary.
Table 11-6 Statistics (5) Details
Description Plain Old Telephone Service/Centrex/Telecommunications Data Link Monitor Feature Server Measurement Collection Finished (POTS/CTX/TDM Feature Server Measurement Collection Finished)
Severity Information
Threshold 100
Throttle 0
Datawords End Time—STRING [40]
PrimaryCause
Indicates that the 15-minute traffic measurement collection process has finished on the POTS/Centrex/Tandem Feature Server.
PrimaryAction
No action is necessary.
11-4Cisco BTS 10200 Softswitch Troubleshooting Guide, Release 6.0.4
OL-25016-02

Chapter 11 Statistics TroubleshootingStatistics Events and Alarms
Statistics (6)Table 11-7 lists the details of the Statistics (6) informational event. For additional information, refer to the “Advanced Intelligent Network Feature Server Measurement Collection Started—Statistics (6)” section on page 11-15.
Statistics (7)Table 11-8 lists the details of the Statistics (7) informational event. For additional information, refer to the “Advanced Intelligent Network Feature Server Measurement Collection Finished—Statistics (7)” section on page 11-16.
Table 11-7 Statistics (6) Details
Description Advanced Intelligent Network Feature Server Measurement Collection Started (AIN Feature Server Measurement Collection Started)
Severity Information
Threshold 100
Throttle 0
Datawords Start Time—STRING [40]
PrimaryCause
Indicates that the 15-minute traffic measurement collection process has started on the Advanced Intelligent Network (AIN) feature server.
PrimaryAction
No action is necessary.
Table 11-8 Statistics (7) Details
Description Advanced Intelligent Network Feature Server Measurement Collection Finished (AIN Feature Server Measurement Collection Finished)
Severity Information
Threshold 100
Throttle 0
Datawords End Time—STRING [40]
PrimaryCause
Indicates that the 15-minute traffic measurement collection process has completed on the AIN feature server.
PrimaryAction
No action is necessary.
11-5Cisco BTS 10200 Softswitch Troubleshooting Guide, Release 6.0.4
OL-25016-02

Chapter 11 Statistics TroubleshootingStatistics Events and Alarms
Statistics (8)Table 11-9 lists the details of the Statistics (8) warning event. To monitor and correct the cause of the event, refer to the “Message Send Failure—Statistics (8)” section on page 11-16.
Table 11-9 Statistics (8) Details
Description Message Send Failure
Severity Warning
Threshold 100
Throttle 0
Datawords Originating Process—STRING [40]Traffic Mgr Msg Type—STRING [40]Traffic Agent Msg Type—STRING [30]
PrimaryCause
The originating process (for Call Agent (CA), Feature Server (FS) or Element Management System (EMS)) is not in active state, or is shut down.
PrimaryAction
Check for other alarms and events generated from this component (CA, FS, or EMS).
SecondaryCause
The hub is down.
SecondaryAction
If the originating process is down, try to bring the process back into the normal state.
TernaryCause
The platform is currently shutting down a process.
TernaryAction
If the hub process is down, try to bring it into a normal state. (Contact Cisco Technical Assistance Center (TAC).)
11-6Cisco BTS 10200 Softswitch Troubleshooting Guide, Release 6.0.4
OL-25016-02

Chapter 11 Statistics TroubleshootingStatistics Events and Alarms
Statistics (9)Table 11-10 lists the details of the Statistics (9) warning event. To monitor and correct the cause of the event, refer to the “Measurement Table Structured Query Language Read Error—Statistics (9)” section on page 11-16.
Table 11-10 Statistics (9) Details
Description Measurement Table Structured Query Language Read Error (Measurement Table SQL Read Error)
Severity Warning
Threshold 100
Throttle 0
Datawords Measurement Table Na—STRING [40]
PrimaryCause
There is no database connection or the connection is faulty.
PrimaryAction
Check to see if there are any other events generated that indicate there is a database problem.
SecondaryCause
The traffic measurement table(s) are corrupted.
SecondaryAction
Correct any database-related problems.
TernaryCause
Two processors or more are attempting to access the table at the same time.
TernaryAction
If all of the database-related problems are cleared, and this warning event report still occurs, contact Cisco TAC for technical support.
11-7Cisco BTS 10200 Softswitch Troubleshooting Guide, Release 6.0.4
OL-25016-02

Chapter 11 Statistics TroubleshootingStatistics Events and Alarms
Statistics (10)Table 11-11 lists the details of the Statistics (11) warning event. To monitor and correct the cause of the event, refer to the “Measurement Table Structured Query Language Write Error—Statistics (10)” section on page 11-17.
Table 11-11 Statistics (10) Details
Description Measurement Table Structured Query Language Write Error (Measurement Table SQL Write Error)
Severity Warning
Threshold 100
Throttle 0
Datawords Measurement Table Na—STRING [40]
PrimaryCause
There is no database connection or the connection is faulty.
PrimaryAction
Check to see if any other events are generated that indicate there is a database problem.
SecondaryCause
The traffic measurement table(s) are corrupted.
SecondaryAction
Correct any database-related problems.
TernaryCause
Two processors or more are attempting to access the table at the same time.
TernaryAction
If all of the database-related problems are cleared, and this warning event report still occurs, contact Cisco TAC for technical support.
11-8Cisco BTS 10200 Softswitch Troubleshooting Guide, Release 6.0.4
OL-25016-02
Chapter 11 Statistics TroubleshootingStatistics Events and Alarms
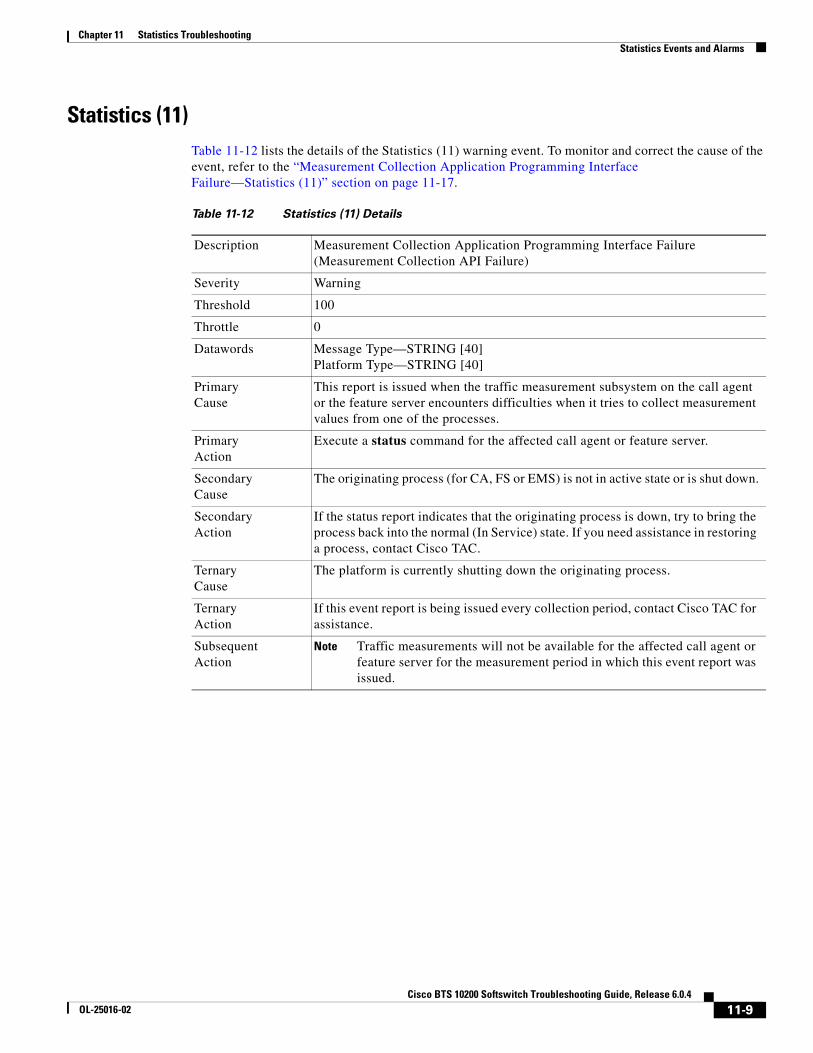
Statistics (11)Table 11-12 lists the details of the Statistics (11) warning event. To monitor and correct the cause of the event, refer to the “Measurement Collection Application Programming Interface Failure—Statistics (11)” section on page 11-17.
Table 11-12 Statistics (11) Details
Description Measurement Collection Application Programming Interface Failure (Measurement Collection API Failure)
Severity Warning
Threshold 100
Throttle 0
Datawords Message Type—STRING [40]Platform Type—STRING [40]
PrimaryCause
This report is issued when the traffic measurement subsystem on the call agent or the feature server encounters difficulties when it tries to collect measurement values from one of the processes.
PrimaryAction
Execute a status command for the affected call agent or feature server.
SecondaryCause
The originating process (for CA, FS or EMS) is not in active state or is shut down.
SecondaryAction
If the status report indicates that the originating process is down, try to bring the process back into the normal (In Service) state. If you need assistance in restoring a process, contact Cisco TAC.
TernaryCause
The platform is currently shutting down the originating process.
TernaryAction
If this event report is being issued every collection period, contact Cisco TAC for assistance.
SubsequentAction
Note Traffic measurements will not be available for the affected call agent or feature server for the measurement period in which this event report was issued.
11-9Cisco BTS 10200 Softswitch Troubleshooting Guide, Release 6.0.4
OL-25016-02

Chapter 11 Statistics TroubleshootingStatistics Events and Alarms
Statistics (12)Table 11-13 lists the details of the Statistics (12) major alarm. To troubleshoot and correct the cause of the alarm, refer to the “Measurement Handshake Error—Schema Inconsistency—Statistics (12)” section on page 11-19.
Table 11-13 Statistics (12) Details
Description Measurement Handshake Error—Schema Inconsistency
Severity Major
Threshold 5
Throttle 0
Datawords Schemas Out of Synchronization—STRING [64]
PrimaryCause
Counters were added or deleted from the schema in Oracle but not in the call agent.
PrimaryAction
Add or delete the counters on the CA.
SecondaryCause
Load is installed incorrectly.
SecondaryAction
Reinstall the load.
11-10Cisco BTS 10200 Softswitch Troubleshooting Guide, Release 6.0.4
OL-25016-02

Chapter 11 Statistics TroubleshootingStatistics Events and Alarms
Statistics (13)Table 11-14 lists the details of the Statistics (13) major alarm. To troubleshoot and correct the cause of the alarm, refer to the “Traffic and Measurements Module Application Programming Interface Failure—Statistics (13)” section on page 11-19.
Table 11-14 Statistics (13) Details
Description Traffic and Measurements Module Application Programming Interface Failure (TMM API Failure)
Severity Major
Threshold 1
Throttle 10
Datawords TMM Error—FOUR_BYTES
PrimaryCause
Unable to initialize shared memory.
PrimaryAction
Reconfigure and restart system.
SecondaryCause
Unable to attach to shared memory.
SecondaryAction
Restart offending process.
TernaryCause
Shared memory table overflow.
TernaryAction
Reconfigure/restart or fix problematic application.
SubsequentCause
Shared memory exhaustion.
SubsequentAction
Reconfigure and restart system.
11-11Cisco BTS 10200 Softswitch Troubleshooting Guide, Release 6.0.4
OL-25016-02

Chapter 11 Statistics TroubleshootingStatistics Events and Alarms
Statistics (14)Table 11-15 lists the details of the Statistics (14) warning event. To monitor and correct the cause of the event, refer to the “MDII Trunk—Statistics (14)” section on page 11-18.
Statistics (15)Table 11-16 lists the details of the Statistics (15) minor alarm. To troubleshoot and correct the cause of the alarm, refer to the “Threshold Crossing Alert—Statistics (15)” section on page 11-19.
Table 11-15 Statistics (14) Details
Description MDII Trunk
Severity Warning
Threshold 100
Throttle 0
Datawords Trunk Group—FOUR_BYTESCIC—FOUR_BYTES
PrimaryCause
Calls on the MDII trunk termination are not being successfully completed.
PrimaryAction
The Cisco BTS 10200 system may take this trunk out of service if it does not take the full trunk group out of service.
Table 11-16 Statistics (15) Details
Description Threshold Crossing Alert
Severity Minor
Threshold 100
Throttle 0
Datawords Description—STRING [256]
PrimaryCause
A threshold crossing has occurred.
PrimaryAction
Reduce the provisioning workload.
11-12Cisco BTS 10200 Softswitch Troubleshooting Guide, Release 6.0.4
OL-25016-02

Chapter 11 Statistics TroubleshootingStatistics Events and Alarms
Statistics (16)Table 11-17 lists the details of the Statistics (16) warning event. To monitor and correct the cause of the event, refer to the “Trunk Group Has Reached the MDII Alarm Threshold—Statistics (16)” section on page 18.
Table 11-17 Statistics (16) Details
Description Trunk Group has Reached the MDII Alarm Threshold
Severity Warning
Threshold 100
Throttle 0
Datawords Trunk Group - FOUR_BYTES
PrimaryCause
The trunk group has reached the MDII alarm threshold.
PrimaryAction
Check the performance status of trunk group.
11-13Cisco BTS 10200 Softswitch Troubleshooting Guide, Release 6.0.4
OL-25016-02

Chapter 11 Statistics TroubleshootingMonitoring Statistics Events
Monitoring Statistics EventsThis section provides the information you need for monitoring and correcting statistics events. Table 11-18 lists all of the statistics events in numerical order and provides cross-references to each subsection.
Note Refer to the “Obtaining Documentation and Submitting a Service Request” section on page l for detailed instructions on contacting Cisco TAC and opening a service request.
Table 11-18 Cisco BTS 10200 Statistics Events
Event Type Event Name Event Severity
Statistics (1) Test Report—Statistics (1) Information
Statistics (2) Call Agent Measurement Collection Started—Statistics (2) Information
Statistics (3) Call Agent Measurement Collection Finished—Statistics (3) Information
Statistics (4) Plain Old Telephone Service/Centrex/Telecommunications Data Link Monitor Feature Server Measurement Collection Started—Statistics (4)
Information
Statistics (5) Plain Old Telephone Service/Centrex/Telecommunications Data Link Monitor Feature Server Measurement Collection Finished—Statistics (5)
Information
Statistics (6) Advanced Intelligent Network Feature Server Measurement Collection Started—Statistics (6)
Information
Statistics (7) Advanced Intelligent Network Feature Server Measurement Collection Finished—Statistics (7)
Information
Statistics (8) Message Send Failure—Statistics (8) Warning
Statistics (9) Measurement Table Structured Query Language Read Error—Statistics (9)
Warning
Statistics (10) Measurement Table Structured Query Language Write Error—Statistics (10)
Warning
Statistics (11) Measurement Collection Application Programming Interface Failure—Statistics (11)
Warning
Statistics (12) Measurement Handshake Error—Schema Inconsistency—Statistics (12)
Major
Statistics (13) Traffic and Measurements Module Application Programming Interface Failure—Statistics (13)
Major
Statistics (14) MDII Trunk—Statistics (14) Warning
Statistics (15) Threshold Crossing Alert—Statistics (15) Minor
Statistics (16) Trunk Group Has Reached the MDII Alarm Threshold—Statistics (16)
Warning
11-14Cisco BTS 10200 Softswitch Troubleshooting Guide, Release 6.0.4
OL-25016-02

Chapter 11 Statistics TroubleshootingMonitoring Statistics Events
Test Report—Statistics (1)The Test Report event is for testing the statistics event category. The event is informational and no further action is required.
Call Agent Measurement Collection Started—Statistics (2)The Call Agent Measurement Collection Started event functions as an informational alert that the call agent measurement collection has started. The event is informational and no further action is required.
Call Agent Measurement Collection Finished—Statistics (3)The Call Agent Measurement Collection Finished event functions as an informational alert that the call agent measurement collection is finished. The event is informational and no further action is required.
Plain Old Telephone Service/Centrex/Telecommunications Data Link Monitor Feature Server Measurement Collection Started—Statistics (4)
The Plain Old Telephone Service/Centrex/Telecommunications Data Link Monitor Feature Server Measurement Collection Started event functions as an informational alert that the POTS/Centrex (CTX)/telecommunications data link monitor (TDM) feature server measurement collection has started. The event is informational and no further action is required.
Plain Old Telephone Service/Centrex/Telecommunications Data Link Monitor Feature Server Measurement Collection Finished—Statistics (5)
The Plain Old Telephone Service/Centrex/Telecommunications Data Link Monitor Feature Server Measurement Collection Finished event functions as an informational alert that the POTS/CTX/TDM feature server measurement collection has finished. The event is informational and no further action is required.
Advanced Intelligent Network Feature Server Measurement Collection Started—Statistics (6)
The Advanced Intelligent Network Feature Server Measurement Collection Started event functions as an informational alert that the AIN feature server measurement collection has started. The event is informational and no further action is required.
11-15Cisco BTS 10200 Softswitch Troubleshooting Guide, Release 6.0.4
OL-25016-02

Chapter 11 Statistics TroubleshootingMonitoring Statistics Events
Advanced Intelligent Network Feature Server Measurement Collection Finished—Statistics (7)
The Advanced Intelligent Network Feature Server Measurement Collection Finished event functions as an informational alert that the AIN feature server measurement collection has finished. The event is informational and no further action is required.
Message Send Failure—Statistics (8)The Message Send Failure event serves as a warning that a message send has failed. The primary cause of the event is that the originating process (for CA, FS, or EMS) is not in active state, or is shut down. To correct the primary cause of the event, check for other alarms and events generated from this component (CA, FS, or EMS). The secondary cause of the event is that the hub is down. To correct the secondary cause of the event, is if the hub process is down, try to bring it into a normal state. The ternary cause of the event is that the platform is currently shutting down a process. To correct the ternary cause of the event, if the originating process is down, try to bring the process back into the normal state. If this event report is being issued on every collection interval and there are no other event reports being issued, contact the Cisco TAC to resolve the communication issue.
Issued when the traffic measurement subsystem in the CA fails to send messages to the EMS due to
• Originating process (for CA, FS, or EMS) is not in active state, or is shut down.
• Hub is down.
• Platform is currently shutting down a process.
If this event is being issued frequently (every collection interval), then there are communication difficulties between the Call Agent and the EMS, and there will be additional events being issued. These other events will indicate the nature of the communication difficulties. The repair procedures for the other event reports should be followed to correct the Call Agent/EMS communication issue:
• Check for other alarms and events generated from this component (CA, FS, or EMS).
• If the originating process is down, try to bring the process back into the normal state.
• If the hub process is down, try to bring it into a normal state.
If this event report is being issued on every collection interval and there are no other event reports being issued, contact the Cisco TAC to resolve the communication issue.
Measurement Table Structured Query Language Read Error—Statistics (9)The Measurement Table Structured Query Language Read Error event serves as a warning that the measurement table had a Structured Query Language (SQL) read error. The primary cause of the event is that there is no database connection, or the connection is faulty. To correct the primary cause of the event, check to see if there are any other events generated that indicate there is a database problem. The secondary cause of the event is that the traffic measurement tables are corrupted. To correct the secondary cause of the event, correct any database-related problems. The ternary cause of the event is that two processors or more are attempting to access the table at the same time. To correct the ternary cause of the event, check to see if all of the database-related problems are cleared, and this warning event report still occurs, contact Cisco TAC for technical support.
11-16Cisco BTS 10200 Softswitch Troubleshooting Guide, Release 6.0.4
OL-25016-02

Chapter 11 Statistics TroubleshootingMonitoring Statistics Events
Measurement Table Structured Query Language Write Error—Statistics (10)The Measurement Table Structured Query Language Write Error event serves as a warning that the measurement table has had a SQL write error. The primary cause of the event is that there is no database connection, or the connection is faulty. To correct the primary cause of the event, check to see if there are any other events generated that indicate there is a database problem. The secondary cause of the event is that the traffic measurement tables are corrupted. To correct the secondary cause of the event, correct any database-related problems. The ternary cause of the event is that two processors or more are attempting to access the table at the same time. To correct the ternary cause of the event, check to see if all of the database-related problems are cleared. If this warning event still occurs, contact Cisco TAC for technical support.
Measurement Collection Application Programming Interface Failure—Statistics (11)
The Measurement Collection Application Programming Interface Failure event serves as a warning that the measurement of application programming interface (API) statistics has failed. The primary cause of the event is that the report is issued when the traffic measurement subsystem on the call agent or feature server encounters difficulties when it tries to collect measurements from one of the processes. To correct the primary cause of the event, execute a status command for the affected call agent or feature server. The secondary cause of the event is that the originating process (for CA, FS, or EMS) is not in active state, or is shut down. To correct the secondary cause of the event, check and see if the status report indicates that the originating process is down, and try to bring the process back into the normal (In Service) state. If you need assistance in restoring a process, contact Cisco TAC. The ternary cause of the event is that the platform is currently shutting down the originating process. To correct the ternary cause of the event, check and see if this event report is being issued every collection period. Contact Cisco TAC for assistance.
Note Traffic measurements will not be available for the affected call agent or feature server for the measurement period in which this event report was issued.
Measurement Handshake Error—Schema Inconsistency—Statistics (12)The Measurement Handshake Error—Schema Inconsistency alarm (major) indicates that a measurement handshake error has occurred. To troubleshoot and correct the cause of the Measurement Handshake Error—Schema Inconsistency alarm, refer to the “Measurement Handshake Error—Schema Inconsistency—Statistics (12)” section on page 11-19.
Traffic and Measurements Module Application Programming Interface Failure—Statistics (13)
The Traffic and Measurements Module Application Programming Interface Failure alarm (major) indicates that the Traffic and Measurements module (TMM) API failed. To troubleshoot and correct the cause of the Traffic and Measurements Module Application Programming Interface Failure alarm, refer to the “Traffic and Measurements Module Application Programming Interface Failure—Statistics (13)” section on page 11-19.
11-17Cisco BTS 10200 Softswitch Troubleshooting Guide, Release 6.0.4
OL-25016-02

Chapter 11 Statistics TroubleshootingMonitoring Statistics Events
MDII Trunk—Statistics (14)The MDII Trunk event serves as a warning that the calls on the MDII trunk termination are not being successfully completed. The Cisco BTS 10200 system might take the MDII trunk out of service if it does not take the full trunk group out of service.
Threshold Crossing Alert—Statistics (15)The Threshold Crossing Alert alarm (minor) indicates that a threshold crossing has occurred. To troubleshoot and correct the cause of the Threshold Crossing Alert alarm, refer to the “Threshold Crossing Alert—Statistics (15)” section on page 11-19.
Trunk Group Has Reached the MDII Alarm Threshold—Statistics (16)The Trunk Group Has Reached the MDII Alarm Threshold event serves as a warning that the trunk group has reached the MDII alarm threshold. To correct the cause of the event, check the performance status of the trunk group.
11-18Cisco BTS 10200 Softswitch Troubleshooting Guide, Release 6.0.4
OL-25016-02

Chapter 11 Statistics TroubleshootingTroubleshooting Statistics Alarms
Troubleshooting Statistics AlarmsThis section provides the information you need for monitoring and correcting statistics alarms. Table 11-19 lists all of the statistics alarms in numerical order and provides cross-references to each subsection.
Note Refer to the “Obtaining Documentation and Submitting a Service Request” section on page l for detailed instructions on contacting Cisco TAC and opening a service request.
Measurement Handshake Error—Schema Inconsistency—Statistics (12)The Measurement Handshake Error—Schema Inconsistency alarm (major) indicates that a measurement handshake error has occurred. The primary cause of the alarm is that counters have been added or deleted from the schema in Oracle but not in the Call Agent. To correct the primary cause of the alarm, add or delete the counters on the CA. The secondary cause of the alarm is that the software load has been installed incorrectly. To correct the secondary cause of the alarm, reinstall the software load.
Traffic and Measurements Module Application Programming Interface Failure—Statistics (13)
The Traffic and Measurements Module Application Programming Interface Failure alarm (major) indicates that the TMM API failed. The primary cause of the alarm is that the system is unable to initialize the shared memory. To correct the primary cause of the alarm, reconfigure and restart the system. The secondary cause of the alarm is that a process is unable to attach to the shared memory. To correct the secondary cause of the alarm, restart the offending process. The ternary cause of the alarm is that the shared memory table has overflowed. To correct the ternary cause of the alarm, reconfigure/restart or fix problematic application. The subsequent cause of the alarm is that the shared memory is exhausted. To correct the subsequent cause of the alarm, reconfigure and restart the system.
Threshold Crossing Alert—Statistics (15)The Threshold Crossing Alert alarm (minor) indicates that a threshold crossing has occurred. To correct the cause of the alarm, reduce the provisioning workload.
Table 11-19 Cisco BTS 10200 Statistics Alarms
Alarm Type Alarm Name Alarm Severity
Statistics (12) Measurement Handshake Error—Schema Inconsistency—Statistics (12)
Major
Statistics (13) Traffic and Measurements Module Application Programming Interface Failure—Statistics (13)
Major
Statistics (15) Threshold Crossing Alert—Statistics (15) Minor
11-19Cisco BTS 10200 Softswitch Troubleshooting Guide, Release 6.0.4
OL-25016-02

Chapter 11 Statistics TroubleshootingTroubleshooting Statistics Alarms
11-20Cisco BTS 10200 Softswitch Troubleshooting Guide, Release 6.0.4
OL-25016-02