statistics on obesity, physical activity and diet · obesity related hospital admissions – notes...
TRANSCRIPT

Statistics on Obesity, Physical Activity and Diet England: 2017
Published 30 March 2017

2
Key findings
• In 2015, 58% of women and 68% of men were overweight or obese. Obesity prevalence increased from 15% in 1993 to 27% in 2015.
• In 2015/16, over 1 in 5 children in Reception,
and over 1 in 3 children in Year 6 were measured as obese or overweight.
• In 2015/16 there were 525 thousand admissions
in NHS hospitals where obesity was recorded as a factor.
• In 2015/16, there were 6,438 Finished
Consultant Episodes (FCE’s) in NHS hospitals with a primary diagnosis of obesity and a main or secondary procedure of bariatric surgery.
• Over three quarters of bariatric surgery patients were aged between 35 and 54, and over three quarters of patients were female.
• 26% of adults ate the recommended 5 or more
portions of fruit and vegetables a day in 2015. Women (27%) were more likely to do so than men (24%).
• In 2014, 52% of 15 year olds reported they consumed 5 or more portions of fruit and vegetables a day.
• In 2015/16, 26% of adults were classified as
inactive (fewer than 30 minutes physical activity a week).

3
This is a National Statistics publication
National Statistics status means that official statistics meet the highest standards of trustworthiness, quality and public value. All official statistics should comply with all aspects of the Code of Practice for Official Statistics. They are awarded National Statistics status following an assessment by the Authority’s regulatory arm. The Authority considers whether the statistics meet the highest standards of Code compliance, including the value they add to public decisions and debate. It is NHS Digital’s responsibility to maintain compliance with the standards expected of National Statistics. If we become concerned about whether these statistics are still meeting the appropriate standards, we will discuss any concerns with the Authority promptly.
National Statistics status can be removed at any point when the highest standards are not maintained, and reinstated when standards are restored. Find out more about the Code of Practice for Official Statistics at: www.statisticsauthority.gov.uk/assessment/code-of-practice ISBN 978-1-78386-982-4 This report may be of interest to members of the public, policy officials and other stakeholders to make local and national comparisons and to monitor the quality and effectiveness of services.

*Section contains newly published data 4
Contents
Part 1: Introduction 5 Part 2: Obesity related hospital admissions* 6 Part 3: Prescription items for the treatment of obesity* 11 Part 4: Adult obesity 14 Part 5: Childhood obesity 19 Part 6: Physical activity 27 Part 7: Diet 33

5
Part 1: Introduction
This statistical report presents a range of information on obesity, physical activity and diet drawn together from a variety of sources for England1. More information can be found in the source publications which contain a wider range of data and analysis.
1. Most figures quoted in this report have been rounded to the nearest whole number. Unrounded data may be found in related data sources.
Newly published data includes: • Analyses from NHS Digital Hospital Episode
Statistics (HES). • Analyses from NHS Digital prescribing data.
The latest information from already published sources includes data from: • NHS Digital: The Health Survey for England
(HSE). • NHS Digital: National Child Measurement
Programme (NCMP). • NHS Digital: What About YOUth Survey
(WAY). • Organisation for Economic Co-operation and
Development (OECD) • European Health Interview Survey (EHIS) • Sport England: Active Lives Survey (ALS)

6
Part 2: Obesity hospital admissions: background
• This chapter focuses on hospital admissions relating to being obese. Data is taken from the Hospital Episode Statistics (HES) databank produced by NHS Digital.
• The association between obesity and increased risk of many serious diseases and mortality is well documented and has led to the National Institute for Health and Clinical Excellence (NICE) developing guidelines on identifying and treating obesity1.
1) Link to NICE guidelines
Three measures are presented for the number of obesity related hospital admissions: • NHS hospital finished admission episodes
with a primary diagnosis of obesity (admissions directly attributed to obesity).
• NHS hospital finished admission episodes with a primary or secondary diagnosis of obesity (admissions where obesity was a factor).
• NHS hospital finished consultant episodes with a primary diagnosis of obesity, and a primary or secondary procedure for bariatric surgery (obesity related bariatric surgery).

7
Obesity related hospital admissions – notes
1) Data on FAEs and FCEs are available from the NHS Digital Hospital Episode Statistics (HES) databank : http://content.digital.nhs.uk/hes
• This section presents recorded Finished Admission Episodes (FAEs)1 in England where there was a primary or secondary diagnosis of obesity, and recorded Finished Consultant Episodes (FCEs) in England where there was a primary diagnosis of obesity and a main or secondary procedure of bariatric surgery.
• An FAE is the first period of inpatient care under one consultant within one provider. Admissions do not represent the number of inpatients, as a person may have more than one admission within the year. In this section an FAE is referred to as a ‘hospital admission’. The same applies to FCEs where one person may have more than one episode within the year.
Bariatric Surgery • Bariatric surgery encompasses a group of procedures
that can be performed to facilitate weight loss, although these procedures can also be performed for other conditions. It includes stomach stapling, gastric bypasses, sleeve gastrectomy and gastric band
maintenance. In general, such surgery is used in the treatment of obesity for people with a BMI above 40, or for those with a BMI between 35 and 40 who have health problems such as type 2 diabetes or heart disease.
Caveats • The analysis presented here uses HES inpatient activity
only although it is known that there has been a recent move to carry out some minor procedures in an outpatient setting such as gastric band maintenance. However, the quality of diagnosis codes collected in an outpatient setting is not sufficient to be sure the procedure was carried out for obesity reasons so they are excluded. This switch in commissioning practices may explain the recent changes over time.
• By contrast, the data quality of secondary procedures has increased over time so some of the increases compared to 10 years ago may partly reflect an improvement in data quality as well as an increase in activity.

Obesity related hospital admissions1 In 2015/16 there were 9,929 Finished Admission Episodes (FAEs) in NHS hospitals with a primary diagnosis of obesity2.
1) In inpatient settings only. 2) The majority of these admissions involved bariatric surgery procedures (see slide 9 for further details). 3) Some of this increase may be due to hospitals being more likely to record obesity as a secondary diagnosis than they were previously (see table 5 for further details). For more information: Tables 1 & 5 of Tables 1 & 5, Statistics on Obesity, Physical Activity and Diet - England 2017 8
Admissions where obesity was a factor
Admissions directly attributed to obesity
In 2015/16 there were 525 thousand admissions in NHS hospitals where obesity was recorded as the primary or secondary diagnosis. This is an increase of 19% on 2014/153.
30 20 10 0 10 20 30
Under 1616 to 2425 to 3435 to 4445 to 5455 to 6465 to 74
75 and overDirectly attributed to obesity | Obesity a factor
Percent
Admissions by age group
For admissions directly attributed to obesity the majority of patients were aged between 35 and 64 (69%). For admissions where obesity was a factor, the age distribution was more uniform.
Around 3 in every 4 patients were female (74%).
Around 2 in every 3 patients were female (67%).

Obesity related hospital admissions for bariatric surgery1 In 2015/16 there were 6,438 Finished Consultant Episodes (FCEs) in NHS hospitals with a primary diagnosis of obesity and a main or secondary procedure of bariatric surgery. This is 27% less than the peak in 2011/12, but 7% more than in 2014/152.
1) Data includes procedures carried out in inpatient settings only. 2) Some of the changes over time are due to changes in practice as to whether bariatric procedures are recorded as being carried out in outpatient or inpatient settings. e.g. over two-thirds of the increase in 2015/16 is due to one provider recording the majority of their gastric band maintenance procedures as inpatient activity compared to outpatient activity in 2014/15. For more information: Tables 9 & 10 of Statistics on Obesity, Physical Activity and Diet - England 2017 9
Bariatric surgery by age
Over three quarters of patients were aged between 35 and 64.
Bariatric surgery by sex Over three quarters of patients were female
Male Female
02468
10Thousands
0 500 1,000 1,500 2,000 2,500
Under 1616 to 2425 to 3435 to 4445 to 5455 to 6465 to 74
75 and over
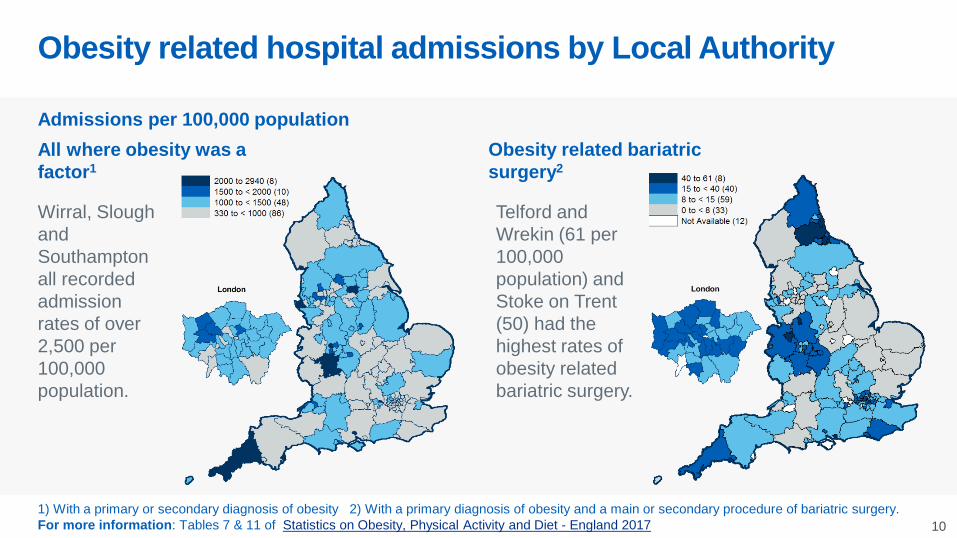
Obesity related hospital admissions by Local Authority
1) With a primary or secondary diagnosis of obesity 2) With a primary diagnosis of obesity and a main or secondary procedure of bariatric surgery. For more information: Tables 7 & 11 of Statistics on Obesity, Physical Activity and Diet - England 2017 10
Admissions per 100,000 population
Wirral, Slough and Southampton all recorded admission rates of over 2,500 per 100,000 population.
All where obesity was a factor1
Obesity related bariatric surgery2
Telford and Wrekin (61 per 100,000 population) and Stoke on Trent (50) had the highest rates of obesity related bariatric surgery.

11
Part 3: Prescription items for the treatment of obesity: background • This section presents information on the
number of prescriptions for drugs used to treat obesity and the Net Ingredient Cost (NIC) of these prescriptions. The data source is Prescription Analysis and Cost (PACT) data from NHS Prescription Services.
• The NIC is the basic cost of a drug as listed in the Drug Tariff or price lists; it does not include discounts, dispensing costs, prescription charges or fees.
• Orlistat (Xenical®) is the main prescription item for treatment of obesity by General Practices in England. Orlistat is a capsule that prevents the absorption of fat in the intestine.
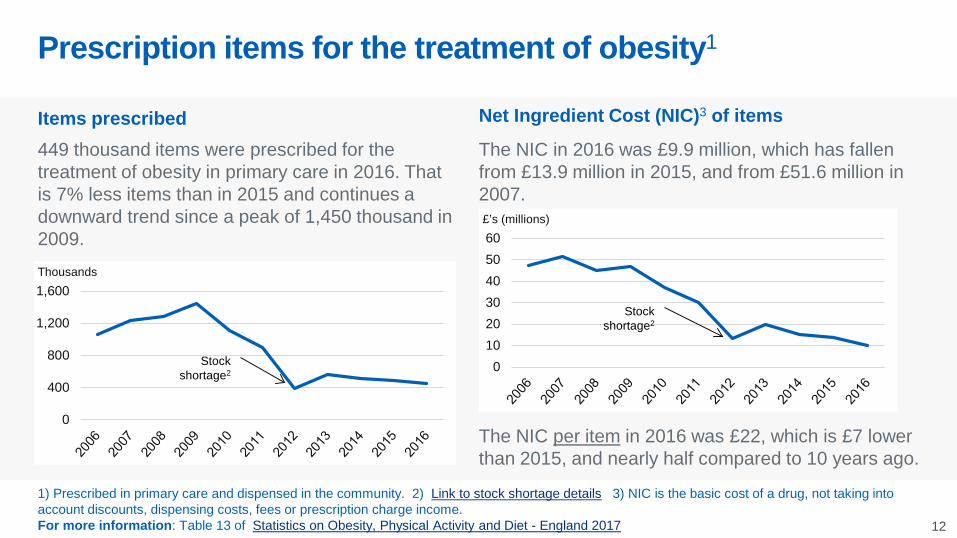
449 thousand items were prescribed for the treatment of obesity in primary care in 2016. That is 7% less items than in 2015 and continues a downward trend since a peak of 1,450 thousand in 2009.
Prescription items for the treatment of obesity1
1) Prescribed in primary care and dispensed in the community. 2) Link to stock shortage details 3) NIC is the basic cost of a drug, not taking into account discounts, dispensing costs, fees or prescription charge income. For more information: Table 13 of Statistics on Obesity, Physical Activity and Diet - England 2017 12
0
400
800
1,200
1,600Thousands
Stock shortage2
Items prescribed Net Ingredient Cost (NIC)3 of items
The NIC in 2016 was £9.9 million, which has fallen from £13.9 million in 2015, and from £51.6 million in 2007.
0102030405060£’s (millions)
Stock shortage2
The NIC per item in 2016 was £22, which is £7 lower than 2015, and nearly half compared to 10 years ago.

1) Prescribed in primary care and dispensed in the community. For more information: Table 14 of Statistics on Obesity, Physical Activity and Diet - England 2017 13
Prescriptions per 1,000 population
NHS Stoke on Trent and NHS Knowsley had the highest prescription rates with 20 items per 1,000 population. NHS Nene and NHS Corby recorded almost zero rates.
By Clinical Commissioning Group (CCG) By NHS Commissioning Region North of England had the highest prescription rate with 11 items per 1,000 population, and South of England the lowest rate with 6.
0 5 10 15
North of England
London
Midlands and East ofEngland
South of England
Prescription items per 1000 population
Prescription items for the treatment of obesity1

14
Part 4: Adult obesity: background
• Main source of the data on overweight and obesity prevalence is the Health Survey for England (HSE), the latest published being HSE 2015.
• Overweight and obesity are terms that refer to an excess of body fat and they usually relate to increased weight-for-height. The most common method of measuring obesity is the Body Mass Index (BMI)1.
• In adults, a BMI of 25kg/m² to 29.9kg/m² means that person is considered to be overweight, a BMI of 30kg/m² or higher means that person is considered to be obese.
• The National Institute for Health and Clinical Excellence (NICE) recommends the use of BMI in conjunction with waist circumference as the method of measuring overweight and obesity and determining health risks.
• BMI does not distinguish between mass due to body fat and mass due to muscular physique, nor the distribution of fat. In order to measure abdominal obesity, waist circumference is measured, and categorised into desirable, high and very high, by sex-specific thresholds (cm): Men: Desirable = Less than 94, High = 94-102, Very high = More than 102 Women: Desirable = Less than 80, High = 80-88, Very high = More than 88
1) BMI = Person’s weight (kg) / Person’s height (in metres)2

Adult obesity: Prevalence1 Obesity prevalence increased from 15% in 1993 to 27% in 2015.
1) Prevalence is for obesity only (so excluding overweight) unless otherwise stated 2) BMI 40kg/m2 or higher 3) Data has been age standardised For more information: Tables 2 & 3, Adult overweight and obesity: Health Survey for England, 2015 15
Prevalence over time
0
10
20
30
40
50Percent
Obese
Overweight
Prevalence of morbid obesity2 has more than tripled since 1993, and reached 2% of men and 4% of women in 2015.
Prevalence by region3
0 10 20 30 40
South WestLondon
South EastEast of England
East MidlandsYorkshire & the Humber
North WestWest Midlands
North East
Percent
Obesity varied by region but was generally more prevalent in the North of England and Midlands than in the South of England.
Prevalence by sex (overweight or obese)
68% 58%

1) The HSE uses the measure of equivalised household income, which takes into account the number of adults and dependent children in the household as well as overall household income. Households are divided into quintiles (fifths) based on this measure. For more information: Tables 2 & 4, Adult overweight and obesity: Health Survey for England, 2015 16
Prevalence by sex and age Obesity prevalence varies with age for both males and females, with the highest obesity levels in the 55-64 age group.
40 20 0 20 40
16-24
25-34
35-44
45-54
55-64
65-74
75-84
85+
Male | Female Percent
Prevalence by sex and household income1
Obesity prevalence varied with household income in women but not in men: 39% of women in the 2nd lowest household income quintile were obese, compared with 17% of women in the highest income quintile.
40 30 20 10 0 10 20 30 40 50Percent Male | Female
Highest income
Lowest income
Adult obesity: Prevalence

Adult obesity: UK Comparison with other OECD (Organisation for Economic Co-operation and Development) countries1
1) 2014 or latest available data since 2010. Measured data is included where available 2) Persons aged 15 and over. For more information: Organisation for Economic Co-operation and Development, Health Statistics 2016 17
The UK reports an adult2 obesity level of 26%. This is 13 percentage points lower than the USA which reports the highest adult obesity level. Japan and Korea both report an adult obesity level of less than 5%.
0
10
20
30
40
United S
tates
Mexico
Hungary
New
Zealand
Australia
Canada
United K
ingdom
Finland
Germ
any
Ireland
Luxembourg
Turkey
Iceland
Latvia
Czech R
epublic
Estonia
Slovenia
Belgium
Israel
Greece
Poland
Spain
Portugal
Slovak R
epublic
France
Denm
ark
Austria
Sw
eden
Netherlands
Italy
Sw
itzerland
Norw
ay
Korea
Japan
Percent Measured data | Self-reported data |
UK (measured data)

Adult obesity: Health conditions associated with obesity, overweight and waist circumference
18
Hypertension1 by BMI group
0
10
20
30
40
50
Normal Overweight Obese Normal Overweight Obese
Men Women
Percent Hypertensive controlled Hypertensive uncontrolled Hypertensive untreated
Hypertension was twice as common among obese adults as among those of a normal weight (43% of obese men and 37% of obese women, compared with 21% of men and 18% of women with BMI within the normal range).
1) See the Health Survey for England, 2015 report at the link below for definitions of hypertension and diabetes. For more information: Tables 8 to 11, Adult overweight and obesity: Health Survey for England, 2015
Diabetes by waist circumference1
0
2
4
6
8
10
12
14
Desirable High Very high Desirable High Very high
Men Women
Percent Undiagnosed diabetes Diagnosed diabetes
Prevalence of diabetes (diagnosed and undiagnosed) among adults with desirable and very high waist circumference was 2% and 11% respectively.

19
Part 5: Childhood obesity: background
• The main source for this section is the National Child Measurement Programme for England (NCMP) which includes nearly all children in reception year (aged 4-5) and year 6 (aged 10-11) 1.
• Health Survey for England also collects data on childhood obesity; covering all children aged 2-15, although as a sample it has much lower coverage than NCMP and therefore the estimates are less precise.
• The NCMP and HSE collect height and weight measurements to calculate BMI2 for each child. BMI (adjusted for age and gender) is recommended as a practical estimate of overweight and obesity in children as it takes into account different growth patterns in boys and girls at different ages. Each age and gender group needs its own level of classification and this section uses the British 1990 growth reference (UK90) to describe childhood overweight and obesity.
1) 95% of eligible children were measured in 2015/16. 2) BMI = Person’s weight (kg) / Person’s height (in metres)2

Childhood obesity: Prevalence Over 1 in 5 were measured as obese or overweight in 2015/16. 9% of children were obese in 2015/16, compared to 10% in 2006/07.
1) It is likely that year 6 obesity prevalence in the first years of the NCMP (2006/07 to 2008/09) were underestimates due to low participation. For more information see Annex B of the 2015-16 NCMP report at the link below. For more information: Table 1b, National Child Measurement Programme (NCMP) 2015-16 20
Reception year Year 6
0
10
20
30
40Percent
Overweight or Obese
Obese
0
10
20
30
40Percent
Overweight or Obese
Obese
Over 1 in 3 children were measured as obese or overweight in 2015/16. 20% of children were obese in 2015/16, compared to 17% in 2006/071.

Childhood obesity: Prevalence by level of deprivation1 13% of children living in the most deprived areas were obese compared to 5% of those living in the least deprived areas.
21
Children living in the most deprived areas are twice as likely to be obese than those in the least deprived areas. Reception year Year 6
26% of children living in the most deprived areas were obese compared to 12% of those living in the least deprived areas.
05
1015202530354045
Percent
Least deprived
Most deprived
Overweight or Obese
Obese
1) Based on the Department of Communities and Local Government Index of Multiple Deprivation deciles: Link for more details For more information: Table 6a, National Child Measurement Programme (NCMP) 2015-16
05
1015202530354045
Percent
Least deprived
Most deprived
Overweight or Obese
Obese

Childhood obesity: Prevalence by level of deprivation1 Between 2007/08 and 2015/16, the difference between obesity prevalence in the most and least deprived areas has increased from 4.6 to 6.2 percentage points.
22
The difference in obesity prevalence between children attending schools in the most and least deprived areas has increased over time. Reception year Year 6
Between 2007/08 and 2015/16, the difference between the most and least deprived areas has increased from 8.9 to 12.4 percentage points.
1) Based on the Department of Communities and Local Government Index of Multiple Deprivation deciles: Link for more details For more information: Table 6b, National Child Measurement Programme (NCMP) 2015-16
02468
101214Percent
4.6 6.2
Most Deprived
Least Deprived
0
5
10
15
20
25
30Percent
8.9 12.4
Most Deprived
Least Deprived

Childhood obesity: Prevalence by ethnicity Obesity prevalence rates ranged from 7% for Chinese children to 15% for Black/Black British children. 29% of Black/Black British children were either overweight or obese.
23
Reception year Year 6 Obesity prevalence rates ranged from 17% for Chinese children to 29% for Black/Black British children. 45% of Black/Black British children were either overweight or obese.
For more information: Table 4, National Child Measurement Programme (NCMP) 2015-16
0 10 20 30 40
White
Mixed
Asian or Asian British
Black or Black British
Chinese
Other
Obese | Overweight Percent 0 10 20 30 40 50
White
Mixed
Asian or Asian British
Black or Black British
Chinese
Other
Obese | Overweight Percent

Childhood obesity: Prevalence by Local Authority
24
Obesity prevalence ranged from 11% in Richmond upon Thames, to 28% in Barking & Dagenham.
Obesity prevalence ranged from 5% in Richmond upon Thames, to 15% in Middlesbrough.
Reception year Year 6
For more information: Table 3b, National Child Measurement Programme (NCMP) 2015-16

Childhood obesity: Parents perception of child’s weight by BMI status For obese children, 48% of mothers said their child was about the right weight, with 51% describing their child as too heavy.
25 For more information: Table 7, Children’s body mass index, overweight and obesity: Health Survey for England, 2015
Mothers perception Fathers perception Parents of overweight and obese children often thought their child was the right weight.
For obese children, 43% of fathers said their child was about the right weight, with 56% describing their child as too heavy.
0 20 40 60 80 100
Obese
Overweight
Neither overweight norobese
Percent
Too light | About the right weight | Too heavy
0 20 40 60 80 100
Obese
Overweight
Neither overweight norobese
Percent
Too light | About the right weight | Too heavy
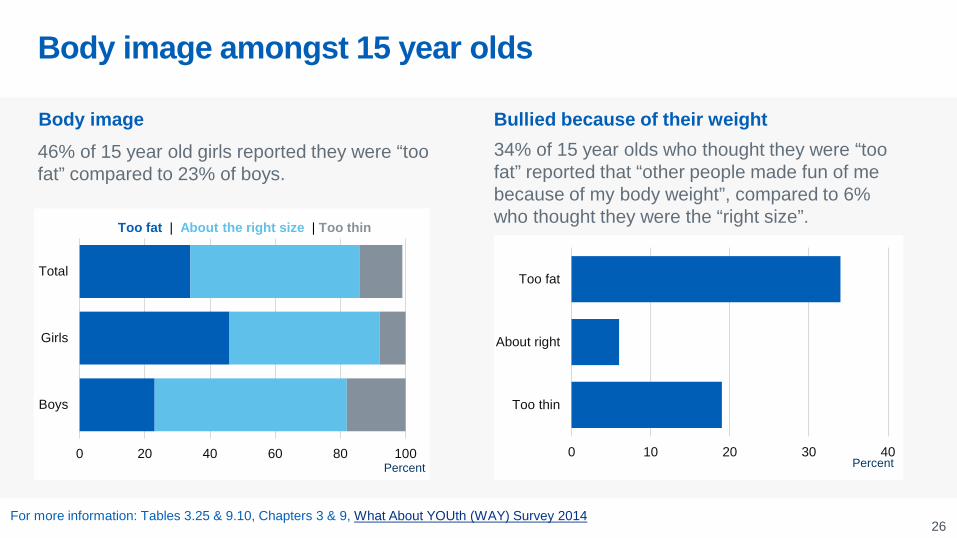
Body image amongst 15 year olds 46% of 15 year old girls reported they were “too fat” compared to 23% of boys.
26
Body image Bullied because of their weight 34% of 15 year olds who thought they were “too fat” reported that “other people made fun of me because of my body weight”, compared to 6% who thought they were the “right size”.
For more information: Tables 3.25 & 9.10, Chapters 3 & 9, What About YOUth (WAY) Survey 2014
0 20 40 60 80 100
Boys
Girls
Total
Percent
Too fat | About the right size | Too thin
0 10 20 30 40
Too thin
About right
Too fat
Percent

27
Part 6: Physical activity: background
• The health benefits of a physically active lifestyle are well documented and there is a large amount of evidence to suggest that regular activity is related to reduced incidence of many chronic conditions. Physical activity contributes to a wide range of health benefits and regular physical activity can improve health outcomes irrespective of whether individuals achieve weight loss.
• In 2011 new guidelines on the amount of activity recommended for health were published by the Chief Medical Officers of the four UK countries1.
• In 2015 the UK government published ‘Sporting Future’2, a new strategy for sport and physical activity, which includes 23 new key performance indicators to monitor outputs.
• The main data sources used in this section are:
- The Active Lives Survey (ALS) published by Sport England provides information on participation in sport and recreation. It was conducted for the first time in 2015/16 and replaces the Active People Survey. The survey classifies activity level into active, fairly active and inactive based on the number of minutes of moderate intensity equivalent (MIE) physical activity3.
- The Health Survey for England (HSE) 2015 gathered information on self-reported participation in physical activities by children.
1) Government physical activity guidelines 2) 'Sporting Future' strategy 3) Sport England - Guidelines on measuring activity

Adult physical activity 26% of adults were classified as inactive (fewer than 30 minutes physical activity a week). 61% of adults were classified as active (150 minutes or more a week).
28
All adults (16+)
Inactivity levels increase with age. Those aged 16-24 were least likely to be inactive (15% ) whilst those aged 75+ were most likely to be inactive (54%).
For more information: Sport England, Active Lives Survey 2015/16
0 10 20 30 40 50 60 70
Inactive
Fairly active
Active
Percent
Age group
0 20 40 60 80 100
16-24
25-34
35-44
45-54
55-64
65-74
75+
Percent
Inactive | Fairly active | Active

Adult physical activity There is a difference in inactivity levels between men and women, with females (27%) more likely to be inactive than males (24%).
29
Gender People from Asian, Black and Chinese ethnic groups were more likely to be inactive than those from White and Mixed ethnic groups.
For more information: Sport England, Active Lives Survey 2015/16
Ethnicity
0 50 100
White British
White Other
Asian
Black
Chinese
Mixed
Other ethnic group
Percent
Inactive | Fairly active | Active
0 20 40 60 80 100
Male
Female
Percent
Inactive | Fairly active | Active
Adult physical activity
30
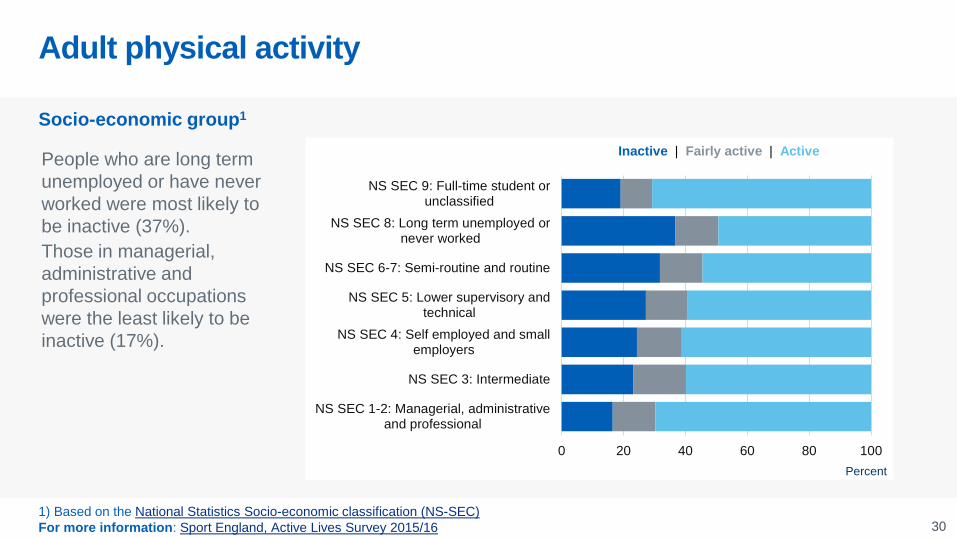
People who are long term unemployed or have never worked were most likely to be inactive (37%). Those in managerial, administrative and professional occupations were the least likely to be inactive (17%).
1) Based on the National Statistics Socio-economic classification (NS-SEC) For more information: Sport England, Active Lives Survey 2015/16
Socio-economic group1
0 20 40 60 80 100
NS SEC 1-2: Managerial, administrativeand professional
NS SEC 3: Intermediate
NS SEC 4: Self employed and smallemployers
NS SEC 5: Lower supervisory andtechnical
NS SEC 6-7: Semi-routine and routine
NS SEC 8: Long term unemployed ornever worked
NS SEC 9: Full-time student orunclassified
Percent
Inactive | Fairly active | Active

Adult physical activity
31 1) Only upper tier LAs are shown. LA data includes gardening activity within the definition of physical activity. For more information: Sport England, Active Lives Survey 2015/16
Inactivity levels by Local Authority1
The Local Authorities with the highest inactivity levels were South Tyneside, Leicester, Barking & Dagenham and Rochdale (all 31%). The Local Authorities with the lowest inactivity levels were Wokingham (13%) and Brighton and Hove (14%).

The proportion of boys who met the guidelines increased from 21% in 2012, to 23% in 2015. The proportion of girls who met the guidelines increased from 16% in 2012 to 20% in 2015.
32
1) Excludes activity in school 2) Meets recommendations = 60 minutes or more on all 7 days 3) Sedentary behaviour is defined as activity with very low energy expenditure, undertaken primarily sitting or lying down. For more information: Tables 8 and 18, Child and Physical Activity: Health Survey for England, 2015
Time spent being sedentary during the week and at weekends increased with age.
Proportion who were sedentary3 for 6 hours or more by age
0
5
10
15
20
25
30
Boys Girls
2008 | 2012 | 2015 Percent
Childhood physical activity1 Met physical activity guidlines2
0
10
20
30
40
2-4 5-7 8-10 11-12 13-15Age group
Weekdays | Weekends Percent

33
Part 7: Diet: background
• Poor diet and nutrition are recognised as major contributory risk factors for ill health and premature death.
• The information for this section comes from three major national surveys: - Living Costs and Food Survey (LCF) (as
reported in Family Food 2014). - Health Survey for England (HSE). - What About YOUth (WAY) Survey.
• The LCF collects information on the type and quantity of food and drink purchased in households.
• Data on fruit and vegetable consumption are taken from the HSE, and the WAY Survey, which is a postal survey of 15 year olds.
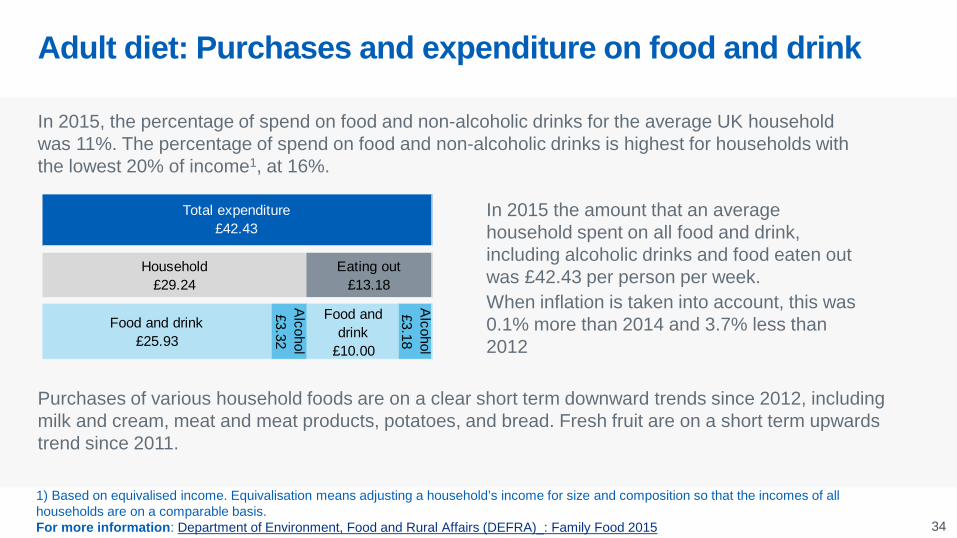
Adult diet: Purchases and expenditure on food and drink In 2015, the percentage of spend on food and non-alcoholic drinks for the average UK household was 11%. The percentage of spend on food and non-alcoholic drinks is highest for households with the lowest 20% of income1, at 16%.
34
1) Based on equivalised income. Equivalisation means adjusting a household’s income for size and composition so that the incomes of all households are on a comparable basis. For more information: Department of Environment, Food and Rural Affairs (DEFRA)_: Family Food 2015
In 2015 the amount that an average household spent on all food and drink, including alcoholic drinks and food eaten out was £42.43 per person per week. When inflation is taken into account, this was 0.1% more than 2014 and 3.7% less than 2012
Purchases of various household foods are on a clear short term downward trends since 2012, including milk and cream, meat and meat products, potatoes, and bread. Fresh fruit are on a short term upwards trend since 2011.
Food and drink £25.93
Alcohol£3.32
Food and drink
£10.00
Alcohol£3.18
Total expenditure£42.43
Household£29.24
Eating out£13.18
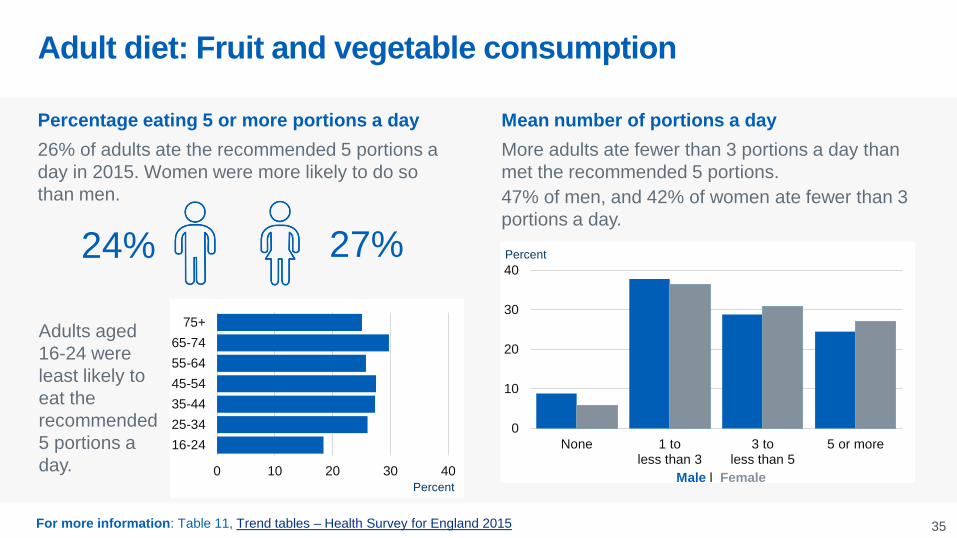
Adult diet: Fruit and vegetable consumption 26% of adults ate the recommended 5 portions a day in 2015. Women were more likely to do so than men.
35
Percentage eating 5 or more portions a day
For more information: Table 11, Trend tables – Health Survey for England 2015
More adults ate fewer than 3 portions a day than met the recommended 5 portions. 47% of men, and 42% of women ate fewer than 3 portions a day.
Mean number of portions a day
24% 27%
Adults aged 16-24 were least likely to eat the recommended 5 portions a day. 0 10 20 30 40
16-2425-3435-4445-5455-6465-74
75+
Percent
0
10
20
30
40
None 1 toless than 3
3 toless than 5
5 or more
Percent
Male | Female

Results from the European Health Interview Survey 2014 showed the UK as having the highest proportion of the population eating 5 or more portions of fruit and vegetables per day (33%). This compared to an EU average of 14%.
36 1) Based on persons aged 15+. Please note that the source of UK data differs from the statistics quoted for England on page 35. For more information: Eurostat, European Health Interview Survey (EHIS), 2014
0
10
20
30
40
United K
ingdom
Denm
ark
Netherlands
Portugal
Estonia
Malta
Cyprus
Luxembourg
France
EU
Lithuania
Finland
Belgium
Spain
Italy
Latvia
Slovakia
Hungary
Poland
Germ
any
Czech R
epublic
Sw
eden
Greece
Slovenia
Austria
Croatia
Norw
ay
Bulgaria
Rom
ania
Percent
Percentage eating 5 or more portions a day: UK comparison with other European Union countries 1
Data not available for Ireland
Adult diet: Fruit and vegetable consumption
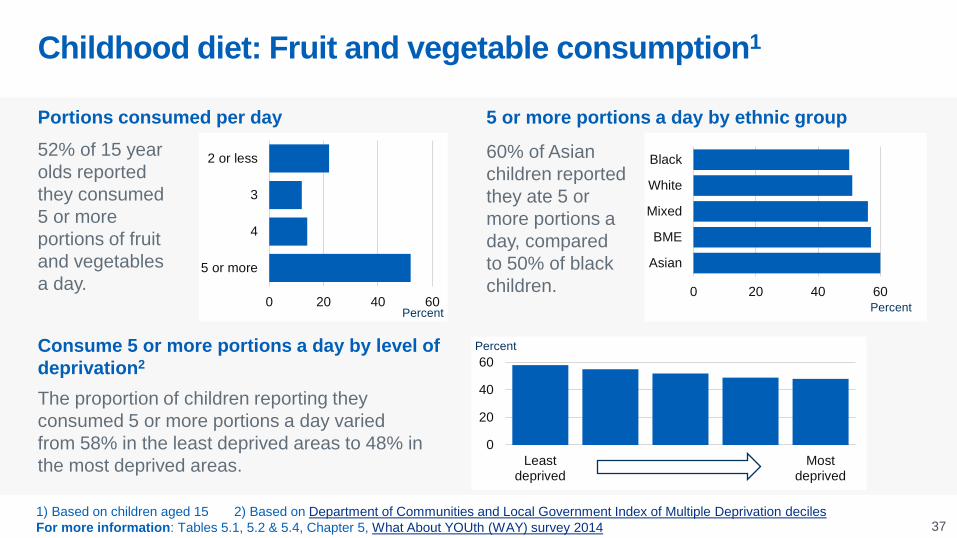
Childhood diet: Fruit and vegetable consumption1 52% of 15 year olds reported they consumed 5 or more portions of fruit and vegetables a day.
37
Portions consumed per day
1) Based on children aged 15 2) Based on Department of Communities and Local Government Index of Multiple Deprivation deciles For more information: Tables 5.1, 5.2 & 5.4, Chapter 5, What About YOUth (WAY) survey 2014
60% of Asian children reported they ate 5 or more portions a day, compared to 50% of black children.
5 or more portions a day by ethnic group
The proportion of children reporting they consumed 5 or more portions a day varied from 58% in the least deprived areas to 48% in the most deprived areas.
0 20 40 60
5 or more
4
3
2 or less
Percent
0 20 40 60
Asian
BME
Mixed
White
Black
Percent
Consume 5 or more portions a day by level of deprivation2
0
20
40
60
Leastdeprived
Mostdeprived
Percent

This publication may be requested in large print or other formats. Published by NHS Digital, part of the Government Statistical Service Copyright © 2016 Health and Social Care Information Centre. The Health and Social Care Information Centre is a non-departmental body created by statute, also known as NHS Digital. You may re-use this document/publication (not including logos) free of charge in any format or medium, under the terms of the Open Government Licence v3.0. To view this licence visit www.nationalarchives.gov.uk/doc/open-government-licence or write to the Information Policy Team, The National Archives, Kew, Richmond, Surrey, TW9 4DU; or email: [email protected]
Author: Statistics Team, NHS Digital Responsible Statistician: Paul Niblett
38

www.digital.nhs.uk @nhsdigital [email protected] 0300 303 5678