syndrome age- and diet-associated obesity and metabolic · a small-molecule inhibitor of ship1...
TRANSCRIPT
A small-molecule inhibitor of SHIP1 reversesage- and diet-associated obesity and metabolicsyndrome
Neetu Srivastava, … , John D. Chisholm, William G. Kerr
JCI Insight. 2016;1(11):e88544. https://doi.org/10.1172/jci.insight.88544.
Low-grade chronic inflammation is a key etiological phenomenon responsible for theinitiation and perpetuation of obesity and diabetes. Novel therapeutic approaches that canspecifically target inflammatory pathways are needed to avert this looming epidemic ofmetabolic disorders. Genetic and chemical inhibition of SH2-containing inositol 5¢phosphatase 1 (SHIP1) has been associated with systemic expansion of immunoregulatorycells that promote a lean-body state; however, SHIP1 function in immunometabolism hasnever been assessed. This led us to investigate the role of SHIP1 in metabolic disordersduring excess caloric intake in mice. Using a small-molecule inhibitor of SHIP1 (SHIPi),here we show that SHIPi treatment in mice significantly reduces body weight and fatcontent, improves control of blood glucose and insulin sensitivity, and increases energyexpenditure, despite continued consumption of a high-fat diet. Additionally, SHIPi reducesage-associated fat in mice. We found that SHIPi treatment reverses diet-associated obesityby attenuating inflammation in the visceral adipose tissue (VAT). SHIPi treatment increasesIL-4–producing eosinophils in VAT and consequently increases both alternatively activatedmacrophages and myeloid-derived suppressor cells. In addition, SHIPi decreases thenumber of IFN-g–producing T cells and NK cells in VAT. Thus, SHIPi represents anapproach that permits control of obesity and diet-induced metabolic syndrome withoutapparent toxicity.
Research Article Immunology Metabolism
Find the latest version:
http://jci.me/88544-pdf

1insight.jci.org doi:10.1172/jci.insight.88544
R E S E A R C H A R T I C L E
Authorship note: N. Srivastava and S. Iyer contributed equally to this work.
Conflict of interest: W.G. Kerr and S. Iyer have a patent pending (PCT/US2014/045146) concerning the use of K118, and other SHIP1 inhibitors, to treat obesity and metabolic syndromes, like diabetes.
Submitted: May 12, 2016 Accepted: June 20, 2016 Published: July 21, 2016
Reference information: JCI Insight. 2016;1(11):e88544. doi:10.1172/jci.insight.88544.
A small-molecule inhibitor of SHIP1 reverses age- and diet-associated obesity and metabolic syndromeNeetu Srivastava,1 Sonia Iyer,1 Raki Sudan,1 Christie Youngs,1 Robert W. Engelman,2 Kyle T. Howard,3 Christopher M. Russo,3 John D. Chisholm,3 and William G. Kerr1,3,4
1Department of Microbiology and Immunology, SUNY Upstate Medical University, Syracuse, New York, USA. 2Departments of Pathology and Cell Biology and Pediatrics, H. Lee Moffitt Comprehensive Cancer Center and Research
Institute, University of South Florida, Florida, USA. 3Department of Chemistry, Syracuse University, Syracuse, New York,
USA. 4Department of Pediatrics, SUNY Upstate Medical University, Syracuse, New York, USA.
IntroductionObesity and its associated metabolic disorders has become a global epidemic affecting millions of people worldwide. It is now well recognized that metabolism and immunity are closely integrated, and recent evi-dence suggests that low-grade chronic inflammation within the visceral adipose tissue (VAT) promotes the onset of obesity and insulin resistance (1). Infiltration of inflammatory macrophages and their subsequent production of the proinflammatory cytokines TNF-α and IL-1β in adipose tissue are primarily responsible for the initiation of inflammatory response in the metabolic tissue. Subsequently chronic inflammation in the VAT is maintained by IFN-γ–producing CD4 and CD8 T cells (2). Immunoregulatory cells, both T lymphoid (Treg) and myeloid (alternatively activated macrophages [AAM] and myeloid suppressor cells), play a pivotal role in opposing these inflammatory stressors in VAT to limit inflammation and maintain the lean state and proper control of blood glucose concentration (2–6). Group 2 innate lymphoid cells (ILC2), via production of the Th2 cytokines IL-5 and IL-13, promote increased numbers of IL-4–producing eosino-phils, which, in turn, via IL-4 –production promote increased numbers of immunoregulatory AAM in VAT that consequently maintain the lean state and metabolic control (7–10).
SH2-containing inositol 5′ phosphatase 1 (SHIP1) is an inositol phosphatase that negatively regulates PI3K signaling by hydrolyzing the 5′ phosphate on its product PI(4, 5, 6)P3 in hematolymphoid cells and mesenchymal stem cells (11, 12). Genetic studies have implicated SHIP1 in limiting IL-5 production and the number of Tregs and myeloid-derived suppressor cells (MDSC) in peripheral lymphoid tissues (12–15). In addition, SHIP1–/– T cells produce increased levels of Th2 cytokines IL-4 and IL-13. SHIP1–/– peritoneal and alveolar macrophages express high levels of Arg1 and exhibit M2 phenotype (15, 16). SHIP1 is also
Low-grade chronic inflammation is a key etiological phenomenon responsible for the initiation and perpetuation of obesity and diabetes. Novel therapeutic approaches that can specifically target inflammatory pathways are needed to avert this looming epidemic of metabolic disorders. Genetic and chemical inhibition of SH2-containing inositol 5′ phosphatase 1 (SHIP1) has been associated with systemic expansion of immunoregulatory cells that promote a lean-body state; however, SHIP1 function in immunometabolism has never been assessed. This led us to investigate the role of SHIP1 in metabolic disorders during excess caloric intake in mice. Using a small-molecule inhibitor of SHIP1 (SHIPi), here we show that SHIPi treatment in mice significantly reduces body weight and fat content, improves control of blood glucose and insulin sensitivity, and increases energy expenditure, despite continued consumption of a high-fat diet. Additionally, SHIPi reduces age-associated fat in mice. We found that SHIPi treatment reverses diet-associated obesity by attenuating inflammation in the visceral adipose tissue (VAT). SHIPi treatment increases IL-4–producing eosinophils in VAT and consequently increases both alternatively activated macrophages and myeloid-derived suppressor cells. In addition, SHIPi decreases the number of IFN-γ–producing T cells and NK cells in VAT. Thus, SHIPi represents an approach that permits control of obesity and diet-induced metabolic syndrome without apparent toxicity.
2insight.jci.org doi:10.1172/jci.insight.88544
R E S E A R C H A R T I C L E
essential for production of the inflammatory cytokine IFN-γ by NK cells responding to stress ligands rec-ognized by the NCR1/NKp46 activating receptor (17, 18). Stressed cells in adipose tissue promote IFN-γ production by NK cells via the NCR1/NKp46 receptor, and their local production of IFN-γ in VAT has recently been shown to be pivotal in the inflammatory cascade that promotes loss of systemic metabolic control (19). Recently, small-molecule SHIP1 inhibitors have been developed (20, 21) and have been shown to promote in vivo increases of immunoregulatory cells, including Tregs and MDSC/AAM, comparable to those seen in SHIP1 mutant mice (20, 22). We hypothesized then that treatment of mice with a SHIP1 inhibitor (SHIPi) would promote Th2 cytokine production and increase immunoregulatory cell numbers in VAT. This immunoregulatory environment would then antagonize inflammatory cell function in VAT associated with high caloric intake and thereby promote maintenance of lean body mass and normal glu-cose control.
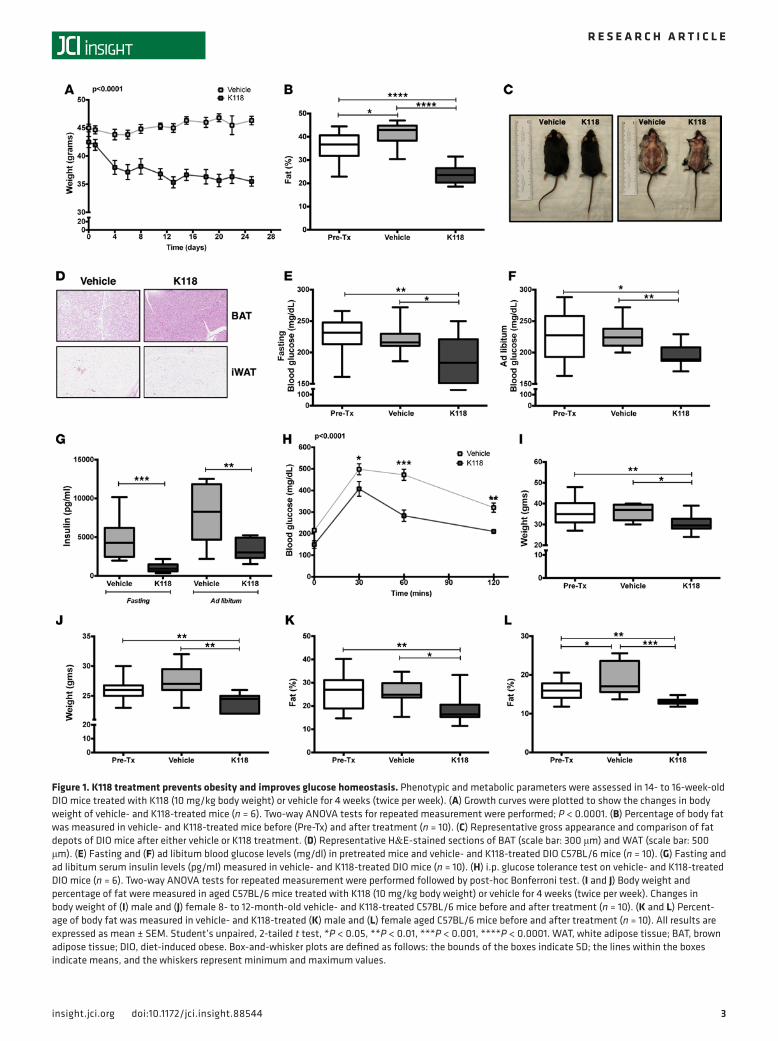
ResultsSHIPi treatment prevents obesity and improves glucose homeostasis. To investigate the role of SHIP1 in obesity and metabolic disorders, we initially tested our recently developed water-soluble SHIPi, K118, on diet-induced obese (DIO) mice (21). DIO mice (12–16 weeks old) maintained on a high-fat diet (HFD) were treated with K118 or vehicle for 4 weeks (2 times/week; 10 mg/kg), and the kinetics of their weight change over the course of the treatment was examined. DIO mice treated with K118 had significant (P < 0.0001) loss of both body weight (Figure 1A) and fat (Figure 1, B and C) as compared with mice before treatment and vehicle-treated mice. Histological analysis revealed that the cellularity of brown adipose tissue (BAT) from K118-treated mice was increased based on enumeration of nuclei and the presence of smaller, mul-tiple lipid droplets observed in individual BAT adipocytes (Figure 1D). No significant differences in overall adipose cellularity were observed in the inguinal white adipose tissue (iWAT) of vehicle-treated mice and K118-treated mice (Figure 1D).
Because K118 treatment substantially reduces fat accumulation and weight gain in HFD-fed DIO mice, we further investigated whether K118 treatment improves impaired control of blood glucose levels that occurs in DIO mice. K118-treated DIO mice showed significantly reduced blood glucose levels (fasting and ad libitum) in comparison to mice before treatment and vehicle-treated mice following 1 month of K118 treatment (Figure 1, E and F). In addition, K118-treated mice had significantly lower serum insulin levels (Figure 1G). Importantly, we observed improved glucose tolerance in K118-treated mice in comparison to vehicle-treated mice, as demonstrated by their response in the intraperitoneal glucose tolerance test (Figure 1H). Thus, K118 treatment also significantly improves control of blood sugar and improves insulin sensitiv-ity in obese hosts despite their continued consumption of a high caloric diet.
In addition to diet, there are many other factors that induce obesity, and aging is one of them. We thus extended our study to test the therapeutic potential of K118 on aged C57BL/6 mice. Corroborating our findings with the DIO mice, K118 treatment considerably reduced body weight and percentage of body fat (Figure 1, I–L) in both male and female 8- to 12-month-old mice, indicating that, irrespective of gender, K118 is also effective at reducing age-associated body fat accumulation.
A short-term SHIPi treatment is sufficient enough to reduce adiposity, increase energy expenditure, and promote lean physiology in DIO mice. Because long-term treatment of K118 dramatically improved metabolic param-eters, we then tested if a short-term SHIPi regimen is sufficient enough to improve energy expenditure and lean physiology in DIO mice. Within 2 weeks of initiation of K118 treatment, we found significant reduction in body weight of DIO mice treated with K118, while vehicle-treated mice continued to increase body mass (Figure 2A). In addition, K118-treated mice had significantly lower adiposity and increased lean mass as compared with vehicle-treated controls (Figure 2, B and C). Young chow-fed lean mice treated with K118 did not show significant difference in weight (Figure 2D). However, there was a reduction in body fat in these mice (Figure 2E), and, as with obese mice, we also observed an increase in lean mass of the K118-treated chow-fed mice (Figure 2F). Notably, the epidydimal white adipose tissue (eWAT) mass was also significantly decreased in the K118-treated mice maintained on a HFD (Figure 2, G and H). We also found that K118 increased UCP1 expression in the iWAT (Figure 2I) and increased cellularity and UCP1 expression in thermogenic BAT (Figure 2J) of mice maintained on a HFD. To further characterize the effect of K118 on metabolism, after 2 weeks of K118 or vehicle treatment, HFD-fed obese mice and chow-fed lean young mice were placed in metabolic cages and energy expenditure was determined. Oxy-gen consumption (V02), carbon dioxide release (C02), and energy utilization were significantly enhanced
3insight.jci.org doi:10.1172/jci.insight.88544
R E S E A R C H A R T I C L E
Figure 1. K118 treatment prevents obesity and improves glucose homeostasis. Phenotypic and metabolic parameters were assessed in 14- to 16-week-old DIO mice treated with K118 (10 mg/kg body weight) or vehicle for 4 weeks (twice per week). (A) Growth curves were plotted to show the changes in body weight of vehicle- and K118-treated mice (n = 6). Two-way ANOVA tests for repeated measurement were performed; P < 0.0001. (B) Percentage of body fat was measured in vehicle- and K118-treated mice before (Pre-Tx) and after treatment (n = 10). (C) Representative gross appearance and comparison of fat depots of DIO mice after either vehicle or K118 treatment. (D) Representative H&E-stained sections of BAT (scale bar: 300 μm) and WAT (scale bar: 500 μm). (E) Fasting and (F) ad libitum blood glucose levels (mg/dl) in pretreated mice and vehicle- and K118-treated DIO C57BL/6 mice (n = 10). (G) Fasting and ad libitum serum insulin levels (pg/ml) measured in vehicle- and K118-treated DIO mice (n = 10). (H) i.p. glucose tolerance test on vehicle- and K118-treated DIO mice (n = 6). Two-way ANOVA tests for repeated measurement were performed followed by post-hoc Bonferroni test. (I and J) Body weight and percentage of fat were measured in aged C57BL/6 mice treated with K118 (10 mg/kg body weight) or vehicle for 4 weeks (twice per week). Changes in body weight of (I) male and (J) female 8- to 12-month-old vehicle- and K118-treated C57BL/6 mice before and after treatment (n = 10). (K and L) Percent-age of body fat was measured in vehicle- and K118-treated (K) male and (L) female aged C57BL/6 mice before and after treatment (n = 10). All results are expressed as mean ± SEM. Student’s unpaired, 2-tailed t test, *P < 0.05, **P < 0.01, ***P < 0.001, ****P < 0.0001. WAT, white adipose tissue; BAT, brown adipose tissue; DIO, diet-induced obese. Box-and-whisker plots are defined as follows: the bounds of the boxes indicate SD; the lines within the boxes indicate means, and the whiskers represent minimum and maximum values.

4insight.jci.org doi:10.1172/jci.insight.88544
R E S E A R C H A R T I C L E

5insight.jci.org doi:10.1172/jci.insight.88544
R E S E A R C H A R T I C L E
in K118-treated mice as compared with the controls (Figure 2, K–M and Supplemental Figure 1, A–C; supplemental material available online with this article; doi:10.1172/jci.insight.88544DS1). Interestingly, food intake in K118-treated mice was increased (Figure 2N); however, their total physical activity (Figure 2O) was not significantly increased or decreased relative to vehicle controls. These data suggest that the increased caloric expenditure by K118 treatment is not due to appetite suppression or enhanced physical activity; instead, K118 acts physiologically in metabolically relevant tissues to improve oxidative metabo-lism to promote leanness.
SHIP inhibition increases eosinophils in VAT of HFD-induced obese mice. As type 2 cytokines play a pivotal role in metabolic homeostasis in mice (7, 9), we initially investigated whether SHIPi promotes type 2 cyto-kine production in the DIO mouse model. Mice administered K118 (SHIPi) exhibited significantly increased circulating levels of IL-5 and IL-13 as compared with vehicle-treated control mice (Figure 3, A and B). ILC2 and eosinophils are major producers of type 2 cytokines within WAT (7, 9, 10, 23). We then examined the frequencies of these cells in eWAT. Although the frequencies of IL-5– and IL-13–expressing ILC2 were not significantly changed by SHIPi (Supplemental Figure 2A), the frequency and number of eosinophils were significantly increased in the eWAT of K118-treated mice (Figure 3C and Supplemental Figure 2B). How-ever, we also found increased numbers of IL-4–expressing eosinophils in the eWAT of K118-treated mice (Figure 3D), indicating that K118 not only increases eosinophil numbers in WAT, but also promotes their production of IL-4. Consistent with this hypothesis, K118 decreased SHIP1 expression in eosinophils found in eWAT (Figure 3E), confirming that K118 directly targets SHIP1 in eosinophils present in a target tissue.
SHIP inhibition increases MDSC and promotes polarization of macrophages toward M2 phenotype. Consistent with increased numbers of IL-4–producing eosinophils in the eWAT, treatment with K118 led to a large expansion of CD11b+Gr1+ myeloid cells in WAT (Figure 4A). These cells were confirmed to be MDSC, as they express both Arginase1 and IL4Rα (Figure 4B). K118 treatment also significantly decreased SHIP1 expression in MDSC (Figure 4C), suggesting that, similar to eosinophils, K118 directly targets SHIP1 in MDSC of VAT. MDSC have also been shown to suppress adipose inflammation and to promote insulin sensitivity in a diet-induced mouse model of obesity (24). In addition to this, K118-treated VAT eosinophils and MDSC showed increased activation of AKT based on analysis of its phosphorylation (pAKT) (Supple-mental Figure 2, C and D). Both eosinophils and MDSC are associated with promoting polarization of macrophages toward AAM or M2 cells in WAT. AAM or M2 cells have been implicated in the mainte-nance of a lean state and normal glucose homeostasis (6, 7, 24, 25). We thus examined the status of macro-phages in the eWAT of K118-treated mice. Indeed, macrophages were skewed toward M2 macrophages or AAM in K118-treated mice maintained on a HFD, as we found a significant decrease in the M1/M2 ratio in WAT (Figure 4D and Supplemental Figure 2E). Also, AAM/M2 macrophages present in the WAT of K118-treated mice on a HFD showed a significantly increased density of IL4Rα and Arginase1 expression when compared with vehicle-treated controls (Figure 4, E and F). Altogether, these data demonstrate that K118 treatment promotes an immunosuppressive environment in the VAT of obese mice by increasing Th2 cytokine expression, expanding the number of IL-4–producing eosinophils and MDSC, and thereby polar-izing macrophage differentiation toward an AAM/M2 phenotype.
SHIP inhibition reduces inflammatory effector functions of T cells and NK cells within VAT. During obesity progression, M1 macrophages initiate the inflammatory process, but chronic inflammation is maintained by
Figure 2. K118 limits adiposity and increase energy expenditure in DIO mice. (A) Metabolic parameters were assessed in diet-induced obese (DIO) mice treated with K118 (10 mg/kg body weight) or vehicle for 2 weeks (twice per week). Body weight measurements before treatment and after K118 or vehicle treatment of DIO mice (n = 26). (B and C) Body composition measurement showing (B) percentage of body fat and (C) percentage of lean mass after 2 weeks of K118 treatment (n = 7–8). (D–F) Body composition analysis of chow-fed lean young mice treated with K118 or vehicle for 2 weeks (n = 8). (G) Rep-resentative image and (H) weight of epidydimal white adipose tissue (eWAT) of K118- and vehicle-treated DIO mice (n = 13–15). Student’s t test. Data are represented as mean ± SEM. (I) Representative H&E-stained sections of iWAT of vehicle- and K118-administered mice (top) and UCP1 (bottom) (original magnification, ×200). (J) Representative H&E-stained sections (scale bar: 300 μm) and UCP1-stained sections (scale bar: 200 μm) of brown adipose tissue (BAT) of vehicle- and K118-administered mice. (K–M) CLAMS analysis using individually housed groups of K118- and vehicle-administered mice after 2 weeks of treatment. Plots represent variations in (K) oxygen consumption, (L) CO2 release, and (M) energy expenditure over time in vehicle- vs. K118-treat-ed mice (n = 7–8) as indicated. Statistical analysis was performed using 2-way repeated-measures ANOVA for energy expenditure experiments. Error bars represent the mean ± SEM. White and black rectangular lines on the X-axis represent light and dark cycles respectively. (N) Cumulative food intake and (O) total physical activity in K118- and vehicle-treated DIO mice (n = 7–8). Student’s t test, *P < 0.05, **P < 0.01, ***P < 0.001, ****P < 0.0001. Data are represented as mean ± SEM. Sample sizes are biological replicates. Experiments in B–F and K–O were performed independently by the Mouse Metabolic Phenotyping Center at the University of Cincinnati. CLAMS, Comprehensive Laboratory Animals Monitoring System. Box-and-whisker plots are defined as follows: the bounds of the boxes indicate SD; the lines within the boxes indicate means, and the whiskers represent minimum and maximum values.

6insight.jci.org doi:10.1172/jci.insight.88544
R E S E A R C H A R T I C L E
Figure 3. K118 treatment increases eosinophils in the visceral adipose tissue of DIO mice. (A and B) 14- to 16-week-old diet-induced obese (DIO) mice treated with K118 (10 mg/kg body weight) or water (vehicle) for 2 weeks (twice per week), followed by determination of IL-5 and IL-13 cytokines serum levels (pg/ml) by ELISA (n = 13–15). (C) Flow cytometry plots showing gating for eosinophils and frequency (total viable epidydimal white adipose tissue [eWAT]) and number of eosinophils in the eWAT of K118- and vehicle-treated mice (n = 15). (D) Flow cytometry plots showing analysis IL-4–expressing SiglecF+ eosinophils, their frequencies (percentage of eosinophils), and numbers in the eWAT (n = 10). (E) Expression of SHIP1 in the eosinophils of eWAT of DIO mice (n = 5) treated for 2 weeks with K118 (red) or vehicle (blue). Student’s t test,*P < 0.05,**P < 0.01. Data are represented as mean ± SEM. Sample sizes are biological replicates. Box-and-whisker plots are defined as follows: the bounds of the boxes indicate SD; the lines within the boxes indicate means, and the whiskers represent minimum and maximum values.

7insight.jci.org doi:10.1172/jci.insight.88544
R E S E A R C H A R T I C L E
Figure 4. K118 treatment expands myeloid suppressor cells and promotes M2 polarization of visceral adipose tissue macrophages. (A) Flow cytometry plots showing CD11b+Gr1+ cells (MDSC) in vehicle- and K118-treated mice, with box-and-whisker plots indicating their frequencies and numbers (n = 14–15). (B) Histo-gram showing expression of Arginase1 and IL4Rα (red) compared to fluorescence minus one (FMO, gray) control stain on CD11b+Gr1+ cells of K118-treated eWAT. (C) Expression of SHIP1 in the CD11b+Gr1+ cells of eWAT of DIO mice treated for 2 weeks with K118 (red) or vehicle (blue); FMO control is shown in gray (n = 5). (D) Flow cytometry plot showing M1 and M2 macrophages after first gating for live CD11b+F4/80+ cells (n = 14–15). (E) Expression of IL4Rα (n = 14–15) and (F) Argi-nase1 (n = 10) in M2 macrophages of K118-treated (red) and vehicle-treated (blue) eWAT. Student’s t test,*P < 0.05, **P < 0.001, ***P < 0.001, ****P<0.0001. Data are represented as mean ± SEM. Sample sizes are biological replicates. eWAT, epidydimal white adipose tissue. Box-and-whisker plots are defined as follows: the bounds of the boxes indicate SD; the lines within the boxes indicate means, and the whiskers represent minimum and maximum values.
8insight.jci.org doi:10.1172/jci.insight.88544
R E S E A R C H A R T I C L E
the adaptive immune system (26, 27); thus, we subsequently compared T cells in the eWAT of K118- and vehicle-treated mice on a HFD. The frequency and number of both CD3+CD4+ and CD3+CD8+ T cells were significantly decreased in the eWAT of K118-treated mice (Figure 5, A and B). In addition, IFN-γ–express-ing CD4 and CD8 T cells were also significantly reduced in the eWAT of K118-treated mice (Figure 5, C and D). Previous work has linked Tregs to the maintenance of immunosuppression in WAT and prevention of obesity (3, 28) Despite a reduction in the frequency of total CD4+ T cells in eWAT of K118-treated mice (Figure 5A), the frequency of Tregs, CD4+CD25+FoxP3+ cells (nTreg), and CD4+CD25–FoxP+ cells (iTreg) was not significantly altered relative to vehicle-treated controls (Figure 5E). Thus, K118 sustains the immu-nosuppressive Treg compartment during high caloric stress in WAT.
Inflammation caused by IFN-γ produced from NK cells has recently been associated with exacerbat-ing diet-induced obesity (DIO) in mice (19). Given the crucial requirement of SHIP1 in NK cell effector function, (17, 18, 29), we next examined the effect of K118 treatment on NK cell frequency and production of IFN-γ in the VAT of DIO mice. Our analysis revealed that K118 treatment in DIO mice considerably decreased the frequency and number of NK cells in the eWAT (Figure 5F). Frequencies of NK1.1+CD3+ NKT cells were also reduced in the K118-treated mice; however, the absolute numbers remain unchanged (Figure 5G). In addition, IFN-γ–producing NK cells and NKT cells were also considerably reduced in the K118-treated eWAT (Figure 5, H and I). Taken together, our findings demonstrate that K118 treatment attenuates inflammatory cell components triggered by high caloric stress, while simultaneously expanding immunoregulatory cell components within the VAT of mice on a HFD.
DiscussionThese data demonstrate that SHIP1 inhibition promotes immunocalming in VAT and can do so even under adipose tissue stress associated with consumption of a high caloric diet. SHIPi appears to do this by target-ing SHIP1 expression in eosinophils and MDSC to expanded numbers of IL-4–producing eosinophils and MDSC, respectively, and consequently polarization of macrophages to the AAM/M2 type. Interestingly, SHIPi can mediate this effect without directly affecting ILC2 homeostasis and their production of Th2 cytokines. Consistent with the increased immunoregulatory environment promoted by SHIPi in VAT, we saw significant reductions in IFN-γ–producing T cells and NK cells. However, SHIPi could also act directly on NK cells in VAT to mediate the latter effect, as SHIP1 is required in an NK cell autonomous fashion for production of IFN-γ in response to NCR1/NKp46 stimulation (18). Although the effects that we have documented show that K118 can target SHIP1 in vivo in cell types that control inflammation in the VAT, we cannot exclude the possibility that K118 also inhibits the SHIP1 paralog, SHIP2, and that this activity of K118 may also contribute to weight loss in obese mice.
Genetic mutation of SHIP1 is associated with severe inflammation of the lungs (30, 31) and small intestine (32, 33) and osteoporosis (34, 35, 36). However, the pulsatile K118 dosing utilized in the above experiments for a 1-month period in DIO mice did not result in any of these pathologies. K118-treated mice lacked any evidence of inflammation in the lungs or small intestine or other organs, such as the kid-ney, spleen, and liver (Supplemental Figure 3, A–F). In addition, extended dosing with K118 did not nega-tively affect bone density and mineral content (Supplemental Figure 3, G and H). Moreover, no significant morbidity or mortality was observed in K118-treated mice. Thus, K118 can prevent or reduce diet-induced as well as age-associated weight gain and obesity without adversely affecting the health and viability of the host. These studies reveal that SHIP1 can be targeted to modulate the immune milieu in VAT and impor-tantly demonstrate that SHIP1 inhibitory compounds like K118 offer a nontoxic, therapeutic intervention for obesity and its associated metabolic disorders.
MethodsMice. For studies of aged mice, male and female mice were 8- to 12-month-old C57BL6/J retired breeders purchased from Charles River. DIO C57BL6/J mice were 4- to 5-month-old males purchased from Jackson Labs. DIO C57BL6/J mice were fed a high-fat 60 kcal% diet (Research Diets D12492) ad libitum.
K118 treatment of mice. K118 was dissolved in water and was injected at 10 mg/kg. The vehicle groups were injected with pure H2O. Mice were injected i.p. with the drug or vehicle twice a week for 2 weeks for short-term treatment and for 4 weeks for long-term treatment.
Isolation of immune cells from adipose tissue and flow cytometry. eWAT was digested in 6 ml of Collage-nase II buffer (Collagenase II, 2 mg/ml; Sigma-Aldrich, 0.5 % BSA in 1X PBS) at 37°C with shaking

9insight.jci.org doi:10.1172/jci.insight.88544
R E S E A R C H A R T I C L E
at 200 rpm in an orbital shaker for 20 minutes. Digested tissue was filtered through a 100-μm filter and centrifuged at 500 g for 10 minutes. Floating adipocytes were removed, and the pellet containing stromal vascular fraction (SVF) was resuspended in 2 ml of rbc lysis buffer (eBioscience). Cells were washed and Fc blocked for 20 minutes, followed by standard flow cytometry surface staining using fluorochrome-conjugated antibodies for 30 minutes on ice. Cells were washed twice and stained with the live/dead aqua dead stain kit for 30 minutes on ice (Life Technologies). The following combination of antibodies was used for staining: anti-mouse CD11c-PEcy7 (N418), CD3-PEcy7 (145-2C11), CD4-FITC (RM4-5), CD45-PerCPcy5.5 (30-F11) FoxP3-PE (FJK-16s), CD25-APC (PC61.5), NK1.1-PerCPcy5,5 (PK136), F4/80-Alexa fluor488 (BM8), CD19-PerCPcy5.5 (eBio1D3, 1D3), IL7Rα-Alexa fluor 700 (A7R34), ST2-Alexa fluor 488 (RMST2-2) from eBioscience; Siglec F-PE (E50-2440), CD45-APCcy7 (30-F11) Gr1-BV605 (RB6-8C5), CD11b- APC cy7 (M1/70), IL4Rα-BV421 (mIL-1R-M1), CD86-PE (GL1), CD8-APCH7 (53-6.7), and lineage cocktail- PerCPcy5.5 (catalog 561317) from BD Bioscience; SHIP1-Alexa fluor 488 (catalog 656604) from Biolegend; and Arginase1-APC (catalog IC5868A) from R&D Systems. Stained cells were acquired on a BD LSR Fortessa flow cytometer (BD Biosciences), and data were analyzed using FlowJo software version 9.6.4 (Tree Star Inc.)
Figure 5. K118 treatment abrogates formation of inflammatory T and NK cells in the WAT of HFD mice. (A and B) DIO mice were treated with K118 or water (vehicle) for 2 weeks, and the eWAT was analyzed for the indicated immune cell populations. (A) Frequency and (B) number of CD3+CD4+ and CD3+CD8+ T cells in eWAT (n = 9–11). Plots were pregated on live CD45+ cells. (C and D) Representative flow cytometry plots showing IFN-γ–expressing CD4 and CD8 T cells after in vitro stimulation of stromal vascular fraction (SVF) cells with PMA and ionomycin for 4 hours, with box-and-whisker plots indicating frequencies of CD4 and CD8 IFN-γ–producing T cells pregated on live CD45+CD3+CD4+ and CD4+CD3+CD8+ cells, respectively, and their numbers in the eWAT (n = 10–11). (E) Percentage of CD25–FoxP3+ cells (iTreg) and CD25+FoxP3+ cells (nTreg) pregated on live CD45+CD3+CD4+ cells (n = 8–10). (F and G) Flow plots showing live CD45+CD3–NK1.1+ cells (NK cells) and CD45+CD3+NK1.1+ NKT cells, with box-and-whisker plots indicating frequencies and numbers of (F) NK cells and (G) NKT cells (n = 9–11). (H and I) Flow cytometry of IFN-γ–expressing (H) NK cells and (I) NKT cells in the eWAT of K118- and vehicle-treated HFD mice after in vitro stimulation with PMA and ionomycin for 4 hours. Cells were pregated on live CD45+CD3–NK1.1+ cells (n = 10–11). Student’s t test, *P < 0.05, **P < 0.01, ***P < 0.001, ****P < 0.0001. Data are represented as mean ± SEM. Sample sizes are biological rep-licates. Box-and-whisker plots are defined as follows: the bounds of the boxes indicate SD; the lines within the boxes indicate means, and the whiskers represent minimum and maximum values.

1 0insight.jci.org doi:10.1172/jci.insight.88544
R E S E A R C H A R T I C L E
Intracellular cytokine analysis. To examine effector cytokine production, single-cell suspension of SVF was stimulated with following concentrations of PMA and Ionomycin (Sigma-Aldrich) in the presence of 1 μg/ml brefeldin A (BD Bioscience) for 4 hours at 37°C in a CO2 incubator. For IFN-γ production from T cells and NK cells, PMA (10 ng/ml) and Ionomycin (1μg/ml) were used. For IL-5, IL-13 production from ILC2, and IL4 from eosinophils, PMA (40ng/ml) and Ionomycin (500ng/ml) were used. Cells were then washed, surface stained, fixed, and permeabilized using fix perm buffer (eBioscience), followed by intracellular staining with IFN-γ-APC, IL-5-APC, IL-13-PE, and IL4–FITC antibodies from eBioscience.
DEXA analysis. Body composition was measured before and after treatment with a PIXImus2 densi-tometer (GE) and analyzed with software version 1.46 and 2.10, due to system upgrade. Results from both versions were essentially the same, and all results are reported using version 2.10. Mice were anesthetized with isoflurane throughout body scan.
Blood glucose and glucose tolerance test. Peripheral blood glucose levels were assessed using an Accu-Chek Compact Plus meter. Control solution was used to verify the validity of the meter prior to data collection for each treatment group. Glucose was measured both ad libitum and after the mice had fasted for 8 to 15 hours. Anesthesia was not used during sample collection. To test for impairment of glucose disposal, glucose tolerance tests were performed using the same Accu-Chek meter and control solution protocol as above. Mice were fasted for 15 hours and then monitored for 120 minutes after i.p. injection of 2 g glucose/kg body weight. Anesthesia was not used when collecting samples.
Metabolic analysis. Whole-animal metabolic analysis was performed using Comprehensive Labo-ratory Animals Monitoring System (CLAMS) cages as per the manufacturer’s instructions (Colum-bus Instruments). For total body composition, live and unanaesthetized mice were measured using a quantitative magnetic resonance instrument, EchoMRI, (Echo Medical Systems, LLC). For energy expenditure, food intake, and activity, mice were placed in a CLAMS cage (Columbus Instruments) for assessment. This 16-chamber indirect calorimeter measured the exchange of oxygen for carbon dioxide. In addition, the center feeders allowed for food intake to be measured. These chambers are configured with dual-axis detection of animal motion for animal activity monitoring. The Mouse Metabolic Phe-notyping Center at the University of Cincinnati, Ohio, USA, performed all the metabolic analysis.
Cytokine analysis. Ad libitum peripheral blood and peripheral blood after fasting (8 hours) were col-lected into Sarstedt serum tubes. Blood was processed as per the manufacturer’s recommendations, and sera were collected and frozen at –20°C. Serum samples were diluted 1:4 for the insulin assays following protocol guidelines. Samples were processed according to the Bio-Rad Bio-Plex Diabetes Assay Manual and were read on a Bio-Rad Bio-Plex 200 instrument. The SUNY Upstate Microarray Core Facility pro-cessed samples.
Histological analysis. Tissues were fixed in 10% neutral buffered formalin and embedded in paraffin. Four-micron-thick sections were stained with H&E or rabbit anti-UCP1 antibody (Abcam, ab10983) for immunohistochemistry. Histological images were captured using an Aperio Scanscope (AT2) Digital Pathology Slide Scanner (Leica Biosystems). The Koch Institute Swanson Biotechnology Center pro-cessed the brown and white fat tissue samples after fixation. The Department of Pathology at H. Lee Moffitt Comprehensive Cancer Center and Research Institute, University of South Florida, processed all other tissues.
Statistics. All statistical analyses were performed using Prism 5.0 and 6.0 statistical software (Graph-Pad) and are presented as mean ± SEM. Statistical significance was determined by using 2-tailed Student’s t test for single variables and 2-way ANOVA followed by Bonferroni post test for multiple variables. P values of less than 0.05 were considered statistically significant.
Study approval. Animal experiments were approved by the Institutional Animal Care and Use Committee of SUNY Upstate Medical University. Metabolic studies performed at the Mouse Meta-bolic Phenotyping Center at the University of Cincinnati and were approved by IACUC of University of Cincinnati.
Author contributionsNS, SI, and WGK designed the study, analyzed data, and wrote the manuscript. NS, SI, and RS, performed all experiments, analyzed data, and generated all the figures. CY performed weight analysis. KTH, CMR, and JDC synthesized K118. JDC edited the manuscript RWE analyzed H&E-stained sections.
1 1insight.jci.org doi:10.1172/jci.insight.88544
R E S E A R C H A R T I C L E
AcknowledgmentsThis work was supported in part by grants from the NIH (RO1 HL72523, R01 HL085580, R01 HL107127) and the Paige Arnold Butterfly Run. WGK is the Murphy Family Professor of Children’s Oncology Research and an Empire Scholar of State University of New York and was a Senior Scholar of the Crohn’s and Colitis Foundation of America during this study. We thank the Koch Institute Swanson Biotechnology Center for technical support. We thank Bingbing Yuan and George W. Bell from the Whitehead Institute for Biomedical Research for assistance with statistical analysis of energy expenditure of DIO mice.
Address correspondence to: William G. Kerr, Departments of Pediatrics and Microbiology and Immunol-ogy, SUNY Upstate Medical University, 750 East Adams Street, 2204 Weiskotten Hall, Syracuse, New York 13210, USA. Phone: 315.464.5850; E-mail: [email protected].
1. Mathis D. Immunological goings-on in visceral adipose tissue. Cell Metab. 2013;17(6):851–859. 2. Chawla A, Nguyen KD, Goh YP. Macrophage-mediated inflammation in metabolic disease. Nat Rev Immunol. 2011;11(11):738–749. 3. Feuerer M, et al. Lean, but not obese, fat is enriched for a unique population of regulatory T cells that affect metabolic param-
eters. Nat Med. 2009;15(8):930–939. 4. Weisberg SP, McCann D, Desai M, Rosenbaum M, Leibel RL, Ferrante AW. Obesity is associated with macrophage accumula-
tion in adipose tissue. J Clin Invest. 2003;112(12):1796–1808. 5. Lumeng CN, Bodzin JL, Saltiel AR. Obesity induces a phenotypic switch in adipose tissue macrophage polarization. J Clin
Invest. 2007;117(1):175–184. 6. Odegaard JI, Chawla A. Alternative macrophage activation and metabolism. Annu Rev Pathol. 2011;6:275–297. 7. Wu D, et al. Eosinophils sustain adipose alternatively activated macrophages associated with glucose homeostasis. Science.
2011;332(6026):243–247. 8. Nguyen KD, et al. Alternatively activated macrophages produce catecholamines to sustain adaptive thermogenesis. Nature.
2011;480(7375):104–108. 9. Molofsky AB, et al. Innate lymphoid type 2 cells sustain visceral adipose tissue eosinophils and alternatively activated macro-
phages. J Exp Med. 2013;210(3):535–549. 10. Brestoff JR, et al. Group 2 innate lymphoid cells promote beiging of white adipose tissue and limit obesity. Nature.
2015;519(7542):242–246. 11. Srivastava N, Sudan R, Kerr WG. Role of inositol poly-phosphatases and their targets in T cell biology. Front Immunol.
2013;4:288. 12. Hazen AL, Smith MJ, Desponts C, Winter O, Moser K, Kerr WG. SHIP is required for a functional hematopoietic stem cell
niche. Blood. 2009;113(13):2924–2933. 13. Ghansah T, et al. Expansion of myeloid suppressor cells in SHIP-deficient mice represses allogeneic T cell responses. J Immunol.
2004;173(12):7324–7330. 14. Collazo MM, et al. SHIP limits immunoregulatory capacity in the T-cell compartment. Blood. 2009;113(13):2934–2944. 15. Rauh MJ, et al. SHIP represses the generation of alternatively activated macrophages. Immunity. 2005;23(4):361–374. 16. Kuroda E, et al. SHIP represses the generation of IL-3-induced M2 macrophages by inhibiting IL-4 production from basophils.
J Immunol. 2009;183(6):3652–3660. 17. Fortenbery NR, Paraiso KH, Taniguchi M, Brooks C, Ibrahim L, Kerr WG. SHIP influences signals from CD48 and MHC class
I ligands that regulate NK cell homeostasis, effector function, and repertoire formation. J Immunol. 2010;184(9):5065–5074. 18. Gumbleton M, Vivier E, Kerr WG. SHIP1 intrinsically regulates NK cell signaling and education, resulting in tolerance of an
MHC class I-mismatched bone marrow graft in mice. J Immunol. 2015;194(6):2847–2854. 19. Wensveen FM, et al. NK cells link obesity-induced adipose stress to inflammation and insulin resistance. Nat Immunol.
2015;16(4):376–385. 20. Brooks R, et al. SHIP1 inhibition increases immunoregulatory capacity and triggers apoptosis of hematopoietic cancer cells. J
Immunol. 2010;184(7):3582–3589. 21. Brooks R, et al. Coordinate expansion of murine hematopoietic and mesenchymal stem cell compartments by SHIPi. Stem Cells.
2015;33(3):848–858. 22. Fernandes S, et al. SHIPi enhances autologous and allogeneic hematolymphoid stem cell transplantation. EBioMedicine.
2015;2(3):205–213. 23. Lee MW, et al. Activated type 2 innate lymphoid cells regulate beige fat biogenesis. Cell. 2015;160(1–2):74–87. 24. Xia S, Sha H, Yang L, Ji Y, Ostrand-Rosenberg S, Qi L. Gr-1+ CD11b+ myeloid-derived suppressor cells suppress inflammation
and promote insulin sensitivity in obesity. J Biol Chem. 2011;286(26):23591–23599. 25. Lumeng CN, Bodzin JL, Saltiel AR. Obesity induces a phenotypic switch in adipose tissue macrophage polarization. J Clin
Invest. 2007;117(1):175–184. 26. Winer S, et al. Normalization of obesity-associated insulin resistance through immunotherapy. Nat Med. 2009;15(8):921–929. 27. Nishimura S, et al. CD8+ effector T cells contribute to macrophage recruitment and adipose tissue inflammation in obesity. Nat
Med. 2009;15(8):914–920. 28. Eller K, et al. Potential role of regulatory T cells in reversing obesity-linked insulin resistance and diabetic nephropathy. Diabetes.
2011;60(11):2954–2962. 29. Wang JW, et al. Influence of SHIP on the NK repertoire and allogeneic bone marrow transplantation. Science.
2002;295(5562):2094–2097.
1 2insight.jci.org doi:10.1172/jci.insight.88544
R E S E A R C H A R T I C L E
30. Helgason CD, et al. Targeted disruption of SHIP leads to hemopoietic perturbations, lung pathology, and a shortened life span. Genes Dev. 1998;12(11):1610–1620.
31. Kanazawa I, et al. Serum osteocalcin level is associated with glucose metabolism and atherosclerosis parameters in type 2 diabe-tes mellitus. J Clin Endocrinol Metab. 2009;94(1):45–49.
32. Kerr WG, Park MY, Maubert M, Engelman RW. SHIP deficiency causes Crohn’s disease-like ileitis. Gut. 2011;60(2):177–188. 33. Park MY, et al. Impaired T-cell survival promotes mucosal inflammatory disease in SHIP1-deficient mice. Mucosal Immunol.
2014;7(6):1429–1439. 34. Takeshita S, et al. SHIP-deficient mice are severely osteoporotic due to increased numbers of hyper-resorptive osteoclasts. Nat
Med. 2002;8(9):943–949. 35. Iyer S, Brooks R, Gumbleton M, Kerr WG. SHIP1-expressing mesenchymal stem cells regulate hematopoietic stem cell homeo-
stasis and lineage commitment during aging. Stem Cells Dev. 2015;24(9):1073–1081. 36. Iyer S, Viernes DR, Chisholm JD, Margulies BS, Kerr WG. SHIP1 regulates MSC numbers and their osteolineage commitment
by limiting induction of the PI3K/Akt/β-catenin/Id2 axis. Stem Cells Dev. 2014;23(19):2336–2351.