statistical forecasting of daily precipitation
TRANSCRIPT

IL NUOVO CIMENTO VOL. 12 C, N. 2 Marzo-Aprile 1989
Statistical Forecasting of Daily Precipitation.
S. MORELLI and R. SANTANGEL0
Osservatorio Geofisico dell'Universit~ - Via Campi 213/A, 41100 Modena
(ricevuto il 22 Febbraio 1988)
Summary. - - From the time series of daily precipitation observed in Modena (Italy) since 1830, a model for the daily statistical forecasting has been built. The main tool of the model is an urn which contains balls labelled by ,,wet>, and ,,dry,. The daily extraction from the urn determines whether, on that day, there will be a precipitation, i.e. if that day will be ,<wet,, or ~dry,,. If the day is dry, the content of the urn is changed by adding other balls some labelled by dry and some other labelled by wet. The numbers of added balls depend on the day of the year (seasonal dependence). If the day is wet, the urn is reset to an initial condition, which depends on the day of the year (seasonal dependence). Moreover, if the day was wet, the likely quantity of precipitation is deduced from a gamma distribution with parameters which are seasonally dependent. All the seasonally dependent parameters in the statistical processes previously discussed can be expressed by Fourier expansions, having one year as fundamental period. The observed distributions are adequately fitted by expansions which do not exceed the second harmonic. Although the model has been tuned on the observations in Modena, it can presumably be extended to the entire region having same climate, i.e. the Po Plain.
PACS 92.60 - Meteorology.
1 . - I n t r o d u c t i o n .
I t is ve ry useful to build a model capable of integrat ing both the determinist ic and the stochastic variabili ty of a t ime series. I f adequate, a stochastic model summarizes all the information contained in the t ime series with only few paramete rs and allows a fairly simple comprehension of the principal features of
10 - II Nuovo Cimento C. 139

140 S. MORELLI and R. SANTANGELO
the phenomenon. The time series on daily precipitations are multivariate since each piece of information is given by several statistical variables: day labelled by presence or absence of precipitation, type of precipitation (rain, snow, hail, etc); quantity of precipitated water per unit surface area. A first simplification is to reduce the variables to the following: day labelled by presence or absence of precipitation and height of precipitated water.
Another simplification is to assume that the time series is cyclostationary with a fundamental period of one year. This assumption is a good approximation at least for the data observed in Modena and considered in this paper. The daily temperatures in Modena have shown that a long-term trend is present due to an urban greenhouse effect(i). However this effect is small and should be less important for the precipitation. Rain clouds actually come from distant regions and precipitate mainly on account of effects exceeding the urban scale. In any case a seasonal behaviour can be considered quite reasonable for a first- generation model, and a further small trend can be easily added to the model presented in this paper.
The models reported in the literature are univariate models. They study the marginal probabilities, as a function of the day of the year, of: height of precipitated water, presence or absence of precipitation, number of consecutive days with or without precipitation (2 ~). For the data observed in Modena a bivariate model has been presented (~). The statistical variables of the model are: height of precipitated water and number of consecutive dry days just preceeding the wet day. The two variables appeared to be independent (~). However this statistical model, although accurate, has drawbacks. On a rainy day it forecasts the next rainy day, which may come several days later. Therefore the model is not capable to include some further information that has arrived on a day between the two rainy days, such as an updated forecast from a general circulation model.
The model presented in this paper improves the bivariate model quoted above, since it gives, for each day, the probability of precipitation for the next day, with the same or even better accuracy. The model can be combined with other models such as a general circulation model.
0) M. MARSEGUERRA, S. MORELLI, G. SALTINI and R. SANTANGELO: Nuovo Cimento C, 2, 499 (1979). (2) D. A. WOOLHISER and G. G. S. PEGRAM: J. Appl. Meteorol., 18, 34 (1979). (a) A. BERGER and C. H. R. GOOSSENS: J. Climatol., 3, 21 (1983). (') J. ROLDAN and D. A. WOOLHISER: Water Resour. Res., 18, 1451 (1982). (3) D. A. WOOLHISER and J. ROLDAN: Water Resour. Res., 18, 1461 (1982). (8) S. MORELLI and R. SANTANGELO: Statistical model for daily precipitation, in New Perspectives in Climate Modelting, edited by A. L. BERGER and C. NICOLIS (Elsevier, Amsterdam, 1984), p. 69. (7) S. MORELLI and R. SANTANGELO: Nuovo Cimento C, 8, 743 (1985).

STATISTICAL FORECASTING OF DAILY PRECIPITATION 141
2. - D a t a .
Precipitation has been observed daffy and accurately in Modena by the Osservatorio Geofisico of the University since March 1st, 1830. The minimum height of water measurable during the long period of observations was not always the same. However a careful analysis has shown that rain measurements are homogeneous provided the height of the precipitated water was not smaller than 0.1 mm. Therefore, for precipitation amounts smaller than 0.1 mm the precipitation is considered as absent. Old observations on snow, haft, etc. may have some systematic error since the equivalent height of precipitated water was not always obtained during the same day of precipitation. Therefore, in the development of the model, data on rain only have been used. However the conclusions obtained by the rain precipitations can be extended to all the hydric precipitations with some minor adjustment of the parameters, this was confirmed by a comparison with recent observations.
The reliability of the model can be estimated by comparing the expected and the observed distributions. For a ~ test the number of observations in each interval must be greater than a certain value, say 5 or 10, in order to have acceptable statistical errors. Therefore it is useful to lump the data of consecutive days together to have a better statistics. However integrating over a too long interval implies a loss of time resolution, i.e. a worse capability of the model to explain time variations. As reasonable compromise between these two conflicting requirements, the period of integration has been chosen to be 14 consecutive days. One year is given approximately by 26 groups of lumped data (26 x 14 = 364 = one year). Moreover in the assumption of cyclo-stationarity data of corresponding days in different years can be grouped together. Such grouping could be performed also if cyclo-stationarity is broken by a small trend.
In conclusion each day is labelled by: the number t' (1 ~< t ' <~ 365) which orders the day within the year; an alphabetic flag with two positions: a, for days without precipitation; and b, for days with precipitation; the equivalent height h (in ram) of precipitated water.
The data have been further grouped for 14 consecutive days in 26 groups, by assigning to all t' of the same group a new number t (1 ~< t ~< 26)(*).
3. - P r e s e n c e o r a b s e n c e o f p r e c i p i t a t i o n : m o d e l .
As discussed previously the statistical variables concerning presence or absence of precipitation and the equivalent height of precipitated water
(*) Data on February 29th in leap years and December 31th in each year have been ignored.

142 S. MORELLI and R. SANTANGELO
appeared independent, at least in the time series of the observations performed in Modena.
Therefore the overall probability is given by the product of the probabilities of the two processes which can be considered separately.
In this section the evaluation of the probability of presence or absence of hydric precipitation is discussed.
The position of the alphabetic flag, a, or b is obtained for each day by ex- traction of one ball from an urn, containing A balls of type a and B balls of type b.
The extraction of a ball of type b means that there will be precipitation in the day. In this case the content of the urn is reset so that
A (1) A + B=q,
where q is a periodic function of time with fundamental period of one year (cyclostationarity).
The extraction of a ball of type a means that there will be no precipitation on the day. In this case the content of the urn is changed by adding A' balls of type a and B' balls of type b to the urn, so that
A ' B p (2) A + B =~, A + B = f l ,
where a and fl are periodic functions of time with fundamental period of one year. Assuming that the harmonics of the periodic functions q, a,/~ do not exceed
the second, they are:
(3)
c t 2 7 : ~ 3 q(t)=qo + qicos27:-~6 + q~sin27:t + q2cos2r:-~+ q~sin ,
a 1Sln 2 ~ ~- a2 COS Zrc ]-~ + a2 sm
fl(t)=flo+ fl~ cos 2r:~6 + fl~ s in2r~6 + fl~ cos 2r:~3 + fl~sin 2 r~3 .
Clearly this process contains 15 unknown parameters to be determined (*).
(*) The number 26 is due to the grouping described in the previous section. In general the expressions of (3) should read:
t r t q r
y(t') = 1"0 + r~ cos 2r:~ + r~ " t sm 2n~ + c t ~ . t ~,2 cos 2z~--~ + V2sln2r~ T/-2'
where T is the fundamental period of one year.

STATISTICAL FORECASTING OF DAILY PRECIPITATION 143
In conclusion the probability of a sequence of n - 1 dry days, just following a wet day and ending with a wet day is:
q(t) + ~(t) q(t) + 2~(t) 1 - q(t) + (n - 1)fl(t) (4) p = q(t) 1 + [a(t) + ~(t)] 1 + 2[a(t) +/~(t)] "'" i-+-(~ -Z 1--~(~ -T- fl-~]"
4. - P r e s e n c e or a b s e n c e o f prec ipi tat ion: e s t i m a t i o n o f the p a r a m e t e r s o f t h e mode l .
All the sequences of days beginning by a day of type b (wet) and ending with a day of type b (wet) with only days of type a (dry) in between have been considered: e.g., bb, bab, baab, baaab, . . . , baa ... ab, . . . .
According to the number t' of the last day of the sequence (final b), any sequence is assigned to the appropriate group labelled by t. A short remark: the last day t' of the sequence must satisfy the requirements of note of sect. 2, that is a sequence with a final b as February 29th or December 31st is ignored, whereas a sequence having a day of type a on February 29th or December 31st is accepted. Any sequence is further characterized by the number d (I> 1), which counts the number of the days of type a in the sequence, increased by one.
Therefore for any group t, a distribution is obtained which gives the number n~ of observed sequences vs. d. The model described in the previous section allows one to evaluate the number nm~ of expected sequences vs. d, by normalizing to the total number of observed sequences belonging to the same group t.
The evaluation through the model implies, however, that the parameters of eqs. (3) are known. The parameters are estimated by fitting all the distributions of the 26 groups, i.e. by minimizing the ~ defined as follows:
(5) ( The variance of each bin d has been assumed to be given by n~ as expected
if the observations in bin d follow a Poisson distribution having mean (and variance) n~ However such estimate of the variance may have a low confidence level when n~ is low. This implies an understimation of the true variance. As a partial attenuation of such effect a lumping procedure has been adopted. Especially for high values of d, n~ is often smaller than 5. In these cases several close bins have been lumped to a unique bin, which therefore has a number of observed sequences greater or equal to 5. The total number of bins depends on t: N(t) .
Since it appears that q is not correlated with ~ and ~, whereas a and/~ are

144 S. MORELLI and R. SANTANGELO
correlated, the minimization was per formed by i terat ion in the p a r a m e t e r s of q
and then in the p a r a m e t e r s of a and 3. Initially the second harmonic was neglected. In a second s tep it was included
and re ta ined only if the X 2 was significantly improved. The es t imated values are:
q0 = 0.503, q~ = - 0.097, q] = - 0.019, q~ = 0.048, q~ = 0.037,
ao = 1.871, :r - 0.875, a~ = - 0.278, a~ = 0.438, aS = 0.214,
30 =0.353 , 3~ = - 0 . 2 1 0 , 3~ = - 0 . 0 1 0 , /~ = 0.111, 32= - 0 . 0 6 7 .
However , due to the m a n y independent variables (e.g., 10 for the two p a r a m e t e r s a and 3) the solution found mus t not be considered as the t rue min imum but only a re la t ive minimum which gives a plausible solution.
Using the quoted values, the functions q(t), a(t), 3(t) never become negat ive
and q(t) never exceeds 1 as expected by the i r definitions (1), (2).
TABLE I. - Initial and final date of t, values of x2(t) and N(t) as (5).
t z2(t) N(t)
1 (1/1-1/14) 6.3 16 2 (1/15-1/28) 17.5 16 3 (1/29-2/11) 12.9 17 4 (2/12- 2/25) 16.6 18 5 (2/26- 3/11) 15.4 16 6 (3/12- 3/25) 20.3 18 7 (3/26- 4/8) 17.7 17 8 (4/9-4/22) 18.2 16 9 (4/23- 5/6) 26.8 16
10 (5/7- 5/20) 13.8 16 11 (5/21- 6/3) 10.0 14 12 (6/4- 6/17) 23.2 17 13 (6/18- 7/1) 10.9 16 14 (7/2- 7/15) 35.7 17 15 (7/16- 7/29) 42.7 20 16 (7/30- 8/12) 21.6 19 17 (8/13- 8/26) 21.8 20 18 (8/27- 9/9) 9.8 19 19 (9/10- 9/23) 15.6 19 20 (9/24-10/7) 11.2 18 21 (10/8- 10/21) 16.3 18 22 (10/22-11/4) 13.0 17 23 (11/5- 11/18) 10.1 14 24 (11/19- 12/2) 15.0 16 25 (12/3- 12/16) 8.5 I4 26 (12/17- 12/30) 14.0 17

STATISTICAL FORECASTING OF DAILY PRECIPITATION 145
With the parameters previously quoted the value of Z 2 is 444.9 to be compared with the expected mean of 426, obtained by the number of degrees of freedom. The result appears satisfactory.
In any case in table I are given the partial values of the z2(t) pertaining to the group t and the corresponding number of bins: N(t).
It would be useful to show the 26 distributions observed and expected. However this would require too much space. Therefore only three typical distributions will be shown: in fig. la) the best case, corresponding to the lowest
340
310
~lOC Cb
50
a)
320
300
100
5( o
b)
- 100
b
50
o c)
�9 o
0 0 �9 O o
�9 0 0 "
C p O 0 �9 . �9 , , , , , ~ , ~ 5 '~0 15 20 25 30
O" O O
. . . . I . . . . I , , ~ A , , , O f , , , , T , , , , I 5 10 15 20 25 30
O" 0
i i , I . . . . I i I ~ l i IOi + i , T i i I I , ' ' , ' ' : ' : ' ' , , i , , , , i 5 10 15 20 25 30 35 40 ~ry elcLys
35
Fig. 1. - Observed distributions (e) and expected distributions ([]) for the dry sequences: a) the best case, b) an average case, c) the worst case.
value of z2(t); in fig. lb) an average case corresponding to a value of z2(t) as expected; in fig. lc) the worst case corresponding to the highest value of z2(t). In any case the distribution of partial z2(t) as given in table I appears consistent and could even improve if the variances used in formula (5) were the true variances.
5. - Height o f precipitated water. Model and es t imat ion of the parameters�9
When the previous model declares that the day is of type a (dry), the height of precipitated water is immediately set equal to zero. If the day happens to be of type b (wet), an independent statistical process is activated, which extracts from an urn the height of the precipitated water according to the model distribution.

146 s. MORELLI and R. SANTANGELO
The distribution of the height of precipitated wa te r appeared to follow a gamma distribution (~)
1 h>O, (6) Q(h) = h l-1 exp [ - h/m] F(1) . m - - - ' ' ' - ~ '
where l and m are assumed to be periodic functions of t ime with fundamental period of one year (cyclostationarity). The model distribution is given by a slight modification of formula (6) in order to take into account the minimum resolution of the equipment which measures the height of precipitated water:
Q(h) (7) Q'(h)= ~n , h~hm~n, hmin = 0.1 mm.
1 - f q(h)dh 0
F o r the 14 days of the group t, a distribution of the number of observed heights be tween h and (h + Ah): n~ h + Ah) is obtained. A corresponding
TABLE II. - Initial and final date of t, values of x2(t) and N (t) as (9).
t ~(t) N(t)
1 (1/1-1/14) 5.8 16 2 (1/15- 1/28) 7.3 15 3 (1/29-2/11) 29.1 15 4 (2/12-2/25) 23.8 16 5 (2/26-3/11) 13.4 16 6 (3/12- 3/25) 4.8 15 7 (3/26- 4/8) 19.2 17 8 (4/9- 4/22) 9.1 16 9 (4/23- 5/6) 8.8 16
10 (5/7- 5/20) 15.1 18 11 (5/21- 6/3) 23.1 18 12 (6/4- 6/17) 13.5 17 13 (6/18- 7/1) 17.1 17 14 (7/2- 7/15) 12.8 16 15 (7/16- 7/29) 21.9 15 16 (7/30- 8/12) 14.7 16 17 (8/13-8/26) 15.6 16 18 (8/27- 9/9) 27.2 16 19 (9/10- 9/23) 24.1 19 20 (9/24-10/7) 14.2 18 21 (10/8-10/21) 28.3 21 22 (10/22-11/4) 20.0 22 23 (11/5-11/18) 17.4 19 24 (11/19- 12/2) 12.9 17 25 (12/3- 12/16) 25.0 17 26 (12/17- 12/30) 18.3 16
STATISTICAL FORECASTING OF DAILY PRECIPITATION 147
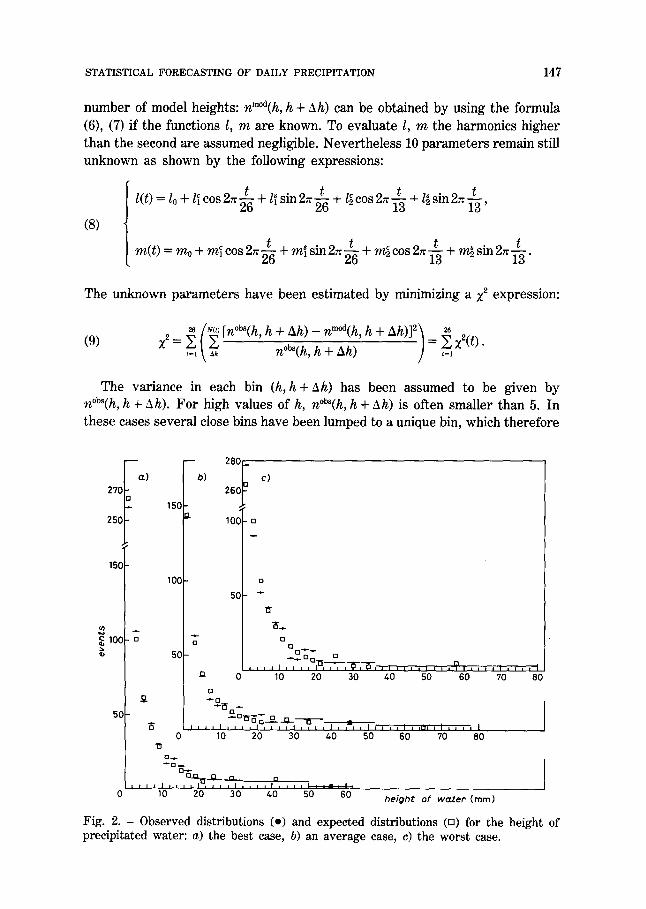
number of model heights: nm~ h + hh) can be obtained by using the formula (6), (7) ff the functions l, m are known. To evaluate l, m the harmonics higher than the second are assumed negligible. Nevertheless 10 parameters remain still unknown as shown by the following expressions:
(8)
t ~ t /~ cos 27:~3 + / i sin 2~:~3 ' l(t) = lo + l~ cos 2= ~--~ + l~ s in 2=~-~ +
t , - t ~ ~ t , �9 ,, t m ( t ) = mo + m~ cos 2n~-~ + m l sin 2n ~-~ + m~ cos ~ 7 : - ~ + m~ s m z n T3"
The unknown parameters have been estimated by minimizing a X 2 expression:
~(~ [n~176 ) ~ Z2(,) .
(9) X2 = ,=, \ ~h n~ h + h h ) = ,=]
The variance in each bin (h, h + Ah) has been assumed to be given by n~ h + Ah). For high values of h, n~ h + Ah) is often smaller than 5. In these cases several close bins have been lumped to a unique bin, which therefore
2 5 0 [
15(1
~ 100 o
5C
28C
b) 26C
150
100
lOG
5C
C)
50
= 0 o
i i i i i i i i i i i i i i J i 'l i i i i o l i I ~ I I I
10 20 30 40 50 60 70 80
D ~
Q ~
t i l l , l : L , J I , t l l l l l l ! : : ~ : ! I
10 20 30 40 50 60
[ ]
o
~ 0 []
. . . . , . . . . � 9 ,-O-,~5~, , , . . . . . . . . =, . . . . . I . . . . I 10 20 30 40 50 60 70 80
h e i g h t o f w a t e r (ram)
Fig. 2. - Observed distributions (o) and expected distributions (o) for the height of precipi tated water: a) the best case, b) an average case, c) the worst case.
148 s. MORELLI and R. SANTANGELO
has a number of observed sequences greater or equal to 5. The total number of bins depends on t: N(t).
The minimization procedure was initially on the parameters lo, mo only. A successive minimization was performed starting from the previous values and adding l~, l~. No significant improvement of z 2 was obtained. Therefore they have been neglected. A further successive minimization was performed by adding the parameters m~, m~. The Z 2 was somehow improved. No further improvement was obtained by adding the second harmonic. In conclusion the final parameters are:
l0 = 0.41, mo = 12.94, m~ -- - 1.81, m~ = - 1.83.
The fit is good as it appears from the comparison between the value of Z2: 442.8 and its expected value obtained by the degrees of freedom: 436.0. Also the partial values of z2: ~(t) show a good agreement, as appears from table II.
Also in this case three distributions are shown: in fig. 2a), the best case corresponding to the lowest value of z2(t); in fig. 2b) an average case corresponding to a value of z~(t) a s expected; in fig. 2c) the worst case corresponding to the highest value of z2(t).
6 . - C o n c l u s i o n .
The time series of precipitation in Modena (Italy) can be expressed by a stochastic process involving two urns. An extraction from the first urn every day gives the statistical forecast about the type of the day: i.e. if that day is wet or dry. The extraction from the second urn is performed only if the day happened to be wet, and gives the statistical forecast of the amount of hydric precipitation.
The results appear satisfactory for a first-generation model. How well the quoted mode] forecasts the occurrence and the amount of rain will be presented in a next paper.
The mode] has been tuned on the time series of observations in one town situated within the Po Plain. Since the Plain can be considered a unique structure from a climatic point of view (coherence of observations), the model is likely to be valid for all the Plain.
The model gives statistical forecasts every day. Therefore it is suited to be combined with other models giving forecasts every day, in particular: general circulation models.
�9 RIASSUNTO
]~ presentato un modello per la previsione statistica giornaliera di precipitazione, messo a punto mediante la serie temporale del]e osservazioni giornaliere a Modena (Italia) che
STATISTICAL FORECASTING OF DAILY PRECIPITATION 149
inizia dal 1830. Si t r a t t a di un modello ad ,,urna, la quale contiene palline et iehet ta te ,,pioggia, e ,,secco)). L'estrazione giornaliera dall 'urna determina se in quel giorno ci sara preeipitazione, ossia se il giorno ~ di pioggia>> o ,,secco,. Se il giorno ~ secco, il eontenuto dell 'urna ~ variato con l 'aggiunta di al tre palline et iehet tate da , ,secco, e ~,pioggia~. I1 numero di palline aggiunte dipende dal giorno dell'anno (dipendenza stagionale). Se il giorno ~ piovoso, il contenuto dell 'urna e r iportato ad una condizione iniziale, che dipende dal giorno dell 'anno (dipendenza stagionate). Inoltre, nel caso di giorno piovoso, la quantit~ di pioggia b dedotta da una distribuzione gamma con parametr i dipendenti dal tempo. Tutti i parametr i con dipendenza stagionale del precedente proeesso statistico sono stati espressi mediante uno sviluppo in serie di Fourier , avente un periodo fondamentale di un anno. Le distribuzioni osservate sono adeguatamente rappresenta te da sviluppi in serie che non superano la seconda armonica. Questo metodo di previsione stat ist ica giornaliera pub essere facilmente combinato con metodi di previsione giornaliera dinamiea, poich6 le previsioni (sia stat ist iea che dinamica) sono effettuate ogni giorno. Sebbene il modello sia stato messo a punto mediante le osservazioni di precipitazione a Modena, presumibilmente esso pub essere esteso all ' intera regione climaticamente omogenea, ossia la Pianura Padana.
CTaTEICTilqeeKoe npOrHO31ipoBaHile CyTOqliOrO Bbma~eHtl~i oca,~KOB.
Pe3noMe(*). - - I/I3 BpeMeHHO~ nocJiej/oaaTeJibHOCTg CyTOqHbIX abmaaenn~ oCa~KOB, 3aperncTpnpoBaHHbtx B MoaeHe (HTanrin) c 1830 r. , nocTpoeHa Moaeah aJl~ CyTOaaOrO cTarncTnnecKoro nporHo3npoaanrm. OCHOBIJOfi nncTpyMerIT MO/leJIn rIpeJIcTaBnaeT ypna, KOTOpa~ Co~xep~KHT tuapbI c MeTKaMrI ,<MOKpbffI,~ I4 <<cyxo17I>>. CyTOHHOe rl3ayleqeHI4e rI3 ypnbt onpelIeJI~eT rIporno3npoBanne Ha 3TOT ~leHb, T.e. 6y~IeT 3~n 0TOT ~eHb ~(MOKpbIlTI>> HJIH ,<cyxofi>>. Ecan aeHb -cyxo~>>, TO coaep)KaHne ypn~x naMeH~eTCS nocpeacTaOM ao6aBneHrm ~apoB, qaCTb 143 KOTOpblX noMeqeHa <<cyxI4MH>> 14 apyra~ qaCTb rIoMeqerta (~MOKpbIMI4>>. tlI4CJIO JIo6aBJIertHbIX mapoB 3aBrlC~T OT JIHn 13 rosy (ce3oI-IHa~l 3aBHCHMOCTb). EC~tt ~eHr~ <(MOKpbIl~l>>, TO ypHa BO3BpaIJ.IaeTc~ B HaqaJIbHOe COCTO~tHHe, KOTOpOe 3aBHCI, IT OT ~H~t B roJIy (ce3ormaz 3aBHCI4MOCTb). KpoMe woro, ecaI~ ~eH~, <<MOKpbll~l>>, TO sepOaTHOCTb npOrHO3~IpOBaHH8 BblBO~HTC~I I43 raMMa-pacHpeJ~e~TeHH~q c r~apaMeTpaM~, KOTOpble 3aBHC~T or BpeMenn rosa. Bce 3aBrlC~ll/2l, le OT ce3oHa napaMeTp~,~ B cTarncTnqecgnx npoi~eccax, ~orop~,ie paaee o6cy)v, aa~nc~,, i o r y r 6~r~ ~,~pa~eHbI C nOMOO4~,rO Oyp~,e-paz~o~enr~, KOTOpble HMerOY OeHOBHOI~I rIepr~o~, paBHb~ O~HOMy ro~Iy. Ha6~rojaeHHble pacnpe~e~ermz a~eK~arHo OIII, ICblBalOTC~I C IIOMOIJ.IblO paa~oz~eHri~, KOTOpble He IlpeBbll1IalOT BTOpblX FapMOH~K.
(*) Ilepe~ec)e~to pei)am4uef~.