statistical evaluation of the effectiveness of …
TRANSCRIPT

DOT HS-805 658
STATISTICAL EVALUATION OF THE EFFECTIVENESS OF FEDERAL MOTORVEHICLE SAFETY STANDARD 202: HEAD RESTRAINTS
Report No. 2 of 7
J. Richard Stewart
The Center for the Environment and Man, Inc.275 Windsor Street
Hartford, Connecticut 06120
Contract No. DOT HS-8-02014Contract Ami $581,905
SEPTEMBER 1980FINAL REPORT
This document is available to the U.S. public through theNational Technical Information Service,
Springfield, Virginia 22161
Prepared ForU.S. DEPARTMENT OF TRANSPORTATION
National Highway Traffic Safety AdministrationWashington, D.C. 20590

This document is disseminated under the sponsorshipof the Department of Transportation in the interestof information exchange. The United States Govern-ment assumes no liability for its contents or usethereof»

CONTRACT TECHNICAL MANAGER'S ADDENDUM
Prepared for the National Highway Traffic Safety Administration insupport of a program to review existing regulations, as required byExecutive Order 12044 and Department of Transportation Order 2100.5.Agency staff will perform and publish an official evaluation ofFederal Motor Vehicle Safety Standard 202 based on the findings ofthis report as well as other information sources. The values ofeffectiveness and benefits found in this report may be different fromthose that will appear in the official Agency evaluation.

Technical Report Documentation Pa§a
I . Report No.
DOT-HS-805-658
2. Government Accession No. 3. Recipient'» Catalog He.
4. T i t U and Subtitle
STATISTICAL EVALUATION OF THE EFFECTIVENESS OFFEDERAL MOTOR VEHICLE SAFETY STANDARD 202:
HEAD RESTRAINTS
5. Report Date
September 1980
o. Performing Orgunitnlion Code
7- *«*of'.) j, Richard Stewart(Highway Safety Research Center, Univ. of North Carolina)
8. Performing Orgamxotion Report No,
4254-673
9. Par forming Orfoni lotion Nome and Address
THE CENTER FOR THE ENVIRONMENT AND MAN, INC.275 Windsor Street
Hartford, Connecticut 06120
10. Work Unit No. (TRAIS)
I I . Contract or Grant No.
DOT-HS-8-02014
12. Sponsoring Agency Name and Address
U.S. Department of TransportationNational Highway Traffic Safety Administration400 Seventh Street, S.W.Washington, D.C. 20590
13. Type of Report and Period Covered
1980Sponsoring Agency Cade
IS. Supplementary Notes
1.2.3.4.
FMVSSFMVSSFMVSSFMVSS
108:202:207:213:
SideHeadSeatChild
Marker Lamps (only)RestraintsBack Locks (only)Restraints
5.6.
7.
16. Abstract
This is the Final Report for the statistical evaluation of FMVSS 202 (Head Restraints)It is one of seven statistical evaluations to be conducted under this contract. Theseven Standards are: .
FMVSS 214: Side Door BeamsFMVSS 222: School Bus Seating andCrash ProtectionFMVSS 301: Fuel System Integrity
FMVSS 202 is designed to reduce the frequency and severity of neck injuries in rearend crashes. Head restraints may be either an integral type or a separate adjustabletype.
The study involved the development of statistical models for estimating the effective-ness of FMVSS 202 relative to three different effectiveness measures. The results showedthat integral head restraints were significantly effective in reducing overall injuryat an AIS level of one or greater relative to no head restraint. In general, forother head restraint types and other injury characterizations, head restrainteffectiveness estimates were positive, but were not statistically significant. Injuriesto rear seat occupants were also examined and head restraints were not found to be asafety hazard for these occupants.
17. Key W«,ds
FMVSS 202: Head Restraints.Statistical Analysis. Standard EvaluationWhiplash. Rear End Crash.NCSS Data Analysis.
18. Distribution Statement
Document is available to the public through' the National Technical Information Service,Springfield, Virginia 22161
19. Security Claasif. (of this reeeft)
Unclassified
20, Security Classif. (of this page)
Unclassified
21. No. of Pages
58
22. Priee
Farm DOT F 17CO.7 (8-72)

METRIC CONVERSION FACTORS
AapraxiMtf Caaworsiau la Mttfie Maasartf
WbM Tat KMW WaHis+y i f Te FM
LENGTH
iyaka!
khyd
K
to2
h 2
" l
oe
la
tap
Tbao
floec1*
qtga!
•F
Ulufet ot ttaiuhlh *
inchesfeetyards
an las
eeuare inchessquare teat
square yards
aquara aw leaacrec
euncas
pound!skort lont
(2000 Ibt
teaspoons
tablespoonsfluid ouncei
cupapintsquartsgallons
cubic Heatcubic yards
•2.S30
O.t1.1
AREA
«.so.os0.0
2.ee.«
MASS (wtiaht|
2t0.46
o.s
VOLUME
sIS
30
0.240.4?0.96
J. f
0.02
O.7C
TEMPERATURE (t»ct;
Fatronh.it
tempuature
*«La«as l lrr«Tl 2(
6/9 (attar
subtracting
32 i
a. SD C i w w Nu. CU.IU.286
centimeterscent Mattersmaters
kilomems
•quare centimeterssquare maters
square emlars
aquara kilometershectares
grams
kilogram.
tonnes
millilitars
miilillters
millilitars
litariliters
liters
lll«r»
cubic matarft
cubic maters
CelsiustemperaEur*
tatolu:.. Mm NdS Mik^. Puhl. I
cmcmmkm
cm2
I R 2
i 2
km 2
ho
skgt
mi
mlml
I11
1m3
n.J
°C
f VBkal
Aapraiiutt Caavartiast fia« Mttiic Maatarat
Wkaa YM I N . Matitpfv • ( Tt fimt
LENGTH
O.fM0.4
3.3
O.a
AREA
centiaeler*maws
square metersaquare kilomslarshectares 110.000 m
0.4I.i
yaidi
square inches
aquara yards
aquara miles
I*
K
1*
m1
MASS (wtifktt
-r m a
I (1000 fed)
0.0362-2t.I
VOLUME
mlII
I3
°c
millilitars
lilara
Illera
liters
cubic maters
cubic melara
0.03
2.1
1.0C
0.2*
3fi
1.2
poundsshort Ions
fluid ounces
pints
quarts
gallons
cubic leel
cubic yards
•Ilet
f luKat
TEMPERATURE Intel!
Celsius
temperature l U J
•F- 4 0
•FBZ
o 140 io I . izo i«o tea j
~t0 0 tO §40 »0 »O 100
Executive Summary
This is the Final Report of the statisitcal evaluation of Federal MotorVehicle Safety Standard (FMVSS) 202: Head Restraints.
The evaluation was carried out using data from the National Crash SeverityStudy (NCSS) on drivers and right front seat passengers involved in rear-endcrashes. Using data on the 3,380 such occupants, injury rates were estimatedfor those with integral head restraints, adjustable head restraints, and nohead restraint. Three characterizations of injury were considered.
a.) Whiplash symptoms or specific injury to the neck,b.) Overall injury at an AIS level of one or greater,c.) Overall injury at an AIS level of two or greater.
In order to obtain unbiased estimates of injury rates analyses wereperformed to identify relevant covariants that were associated with both headrestraint type and occupant injury. The list of such covariants includedoccupant age and sex, a variable indicating whether or not the occupant wasusing a seat belt, the weight of the vehicle the occupant was in, and theextent to which the vehicle was damaged in the crash.
For each characterization of occupant injury, an appropiate set ofcovariants was included in a weighted least squares categorical data modelwhich produced estimates of injury rates for each head restraint type. Themodel also produced estimates of head restraint effectiveness, defined as thepercent reduction in injury rate for each head restraint type relative tono head restraint. Estimates of standard errors of effectiveness estimateswere also determined so that the statistical significances of the effectivenessestimates could be assessed.
The results showed that in crashes that were severe enough that the casevehicle (vehicle hit in the rear) had to be towed from the scene, integralhead restraints were 31.6% effective in reducing overall injuries at an AISlevel of one or greater. This result was statistically significant at the S%level. When projected to the national level, it was estimated that integralhead restraints would have resulted in 56,782 fewer injuries in automobilecrashes in 1978, compared to those that would have occurred if no headrestraints were oresent. The effectiveness estimates for other restraint

types and other injury characterizations were generally positive9 but none
were statistically significant at the 5% level.
An investigation of injuries to rear seat occupants caused by headrestraints seems to indicate that head restraints did not present muchof a safety hazard to these occupants.
IV
TABLE OF CONTENTS
Section Page
1.0 INTRODUCTION 1-1
1.1 Background 1-11.2 Objective 1-21.3 Scope 1-21.4 Approach 1-21.4.1 Data Source 1-21.4.2 Population Involved 1-31.4.3 Data Characteristics 1-41.5 Limitations of the Study 1-41.6 Outline of the Report 1-41.7 References for Section 1 1-5
2.0 SUMMARY OF ANALYSES PERFORMED ON FMVSS 202 2-1
2.1 Measures of Effectiveness . 2-12.2 Estimated Effectiveness of FMVSS 202 2-12.2.1 Methods 2-12.2.2 Results 2-22.2.3 National Estimate of Injuries Avoided Due to Presence
of Integral Head Restraints 2-42.2.4 Examination of Injuries Caused by Head Restraints 2-52.3 Evaluation of Effectiveness Analysis 2-52.4 References for Section 2 2-6
3.0 DATA PREPARATION AND DATA ANALYSIS 3-1
3.1 Introduction 3-13.2 Preparation of NCSS Data for Analysis 3-13.3 Construct Working File for FMVSS 202 Evaluation 3-13.4 Selection of Control Variables 3-43.5 Estimation of Head Restraint Effectiveness 3-143.6 Injuries Caused by Head Restraints 3-26
APPENDIX - Head Restraint Effectiveness Models A-l

^OKNCWLEDGMENTS
The work being performed by CEM and HSRC in statistically evaluating theeffectiveness of seven Federal Motor Vehicle Safety Standards is the product ofan interdisciplinary team effort. Under subcontract to CEM, HSRC has principalresponsibility for the evaluation of three Standards. Dr. Richard Stewart ofHSRC had principal responsibility for the overall preparation of this report.Dr. Donald Reinfurt is Principal Scientist in charge of all work performed byHSRC. Dr. Gaylord Northrop of CEM is Principal Investigator for the study. Wewish to gratefully acknowledge the other Study Team members who madecontributions to this report. They are:
jjSRC CEM
Dr. George Chi Ms. Kayla CostenobleMs. Anita Leung Mr. Joseph ReidyDr. Richard Stewart Dr. Hans JokschMs. Jane Stutts
Consultant to HSRC ii°J!LyJjL^ntJL9Jp|.'v'
Dr. Gary Koch Dr. Michael Sutherland
VI

ABBREVIATIONS USED
AIS . Abbreviated Injury Scale
BMDP3F Biomedical Computer Program for Log-linear
Analysis of Multiway Frequency Tables
CEM The Center for the Environment and Man, Inc.
FMVSS Federal Motor Vehicle Safety StandardGENCAT A Computer Program for the Generalized Chi-square
Analysis of Categorical Data Using Weighted LeastSquares
H-ICDA Hospital Adaptation of the International Classification
of Diseases
HSRC Highway Safety Research Center
NCSS National Crash Severity Study
NHTSA National Highway Traffic Safety Administration
OAIS Abbreviated Injury Scale for Overall Injury
vii

1.0 INTRODUCTION
1.1 Background
This is the second in a series of reports of the statistical evalu-
ation of the effectiveness of seven Federal Motor Vehicle Safety Standards
(FMVSS). This work is being conducted under Contract DOT-HS-8-02014, by The
Center for the Environment and Man, Inc. (CEM) and its subcontractor, the
Highway Safety Research Center (HSRC) of the University of North Carolina. The
seven Standards to be statistically evaluated are:
• FMVSS 108: Side Marker Lamps (only)
• FMVSS 202: Head Restraints
• FMVSS 207: Seat Back Locks (only)
• FMVSS 213: Child Restraints
• FMVSS 214: Side Door Beams
• FMVSS 222: School Bus Seating and Crash Protection
• FMVSS 301: Fuel System Integrity
The Final Report for FMVSS 202 (Head Restraints) is presented
herein.
FMVSS 202 originally went into effect on January 1, 1969, requiring
passenger cars to be equipped with head restraints. Volkswagen had head
restraints as standard equipment in their 1968 models, while Ford installed them
on almost all their 1969 models. General Motors and Chrysler did not install
head restraints on many vehicles until a mid-model year change. Two methods
evolved for complying with the Standard. Some seats were manufactured with
separate head restraints, some of which are adjustable. Other seats were
manufactured with an integrated head restraint as part of a higher seat back.
Initially, the foreign cars complied primarily with the integrated head
restraint, while domestic manufacturers provided separate head restraints. This
sharp difference no longer applies.
The head restraint device must conform to either a dynamic test in which
the angular displacement of the manikin's head is measured, or a static test
where the rearward displacement of the test dummy head form is measured while
applying a load to the head form. In the dynamic test, the acceleration has an
amplitude of between 8.0 and 9.6 g and a duration of between 80 and 96
milliseconds. In the static test, the maximum load is 200 pounds (or less if
the seat fails) .
If the head restraint complies under the dynamic test requirements, no
specific dimensions for the head restraint are established. If the head
1-1

restraint complies under the static test requirements, the dimensions of the
fully extended head restraint must be as follows:
• The top of the restraint must be at least 27.5 in. abovethe seating reference point.
• The lateral width, when measured either 2.5 in. below thetop of the restraint or 25 in. above the seating referencepoint, must be at least 10 in. for bench type seats or6.75 in. for individual seats.
j.,2 Objective
The primary objective of this analysis was to determine the effectiveness
of FMVSS 202 in reducing the frequency and severity of neck injuries in
passenger cars equipped with head restraints. In addition, the effectiveness of
integrated head restraints was compared with that of adjustable restraints when
correctly adjusted and when incorrectly adjusted. Another objective of the
analysis was to investigate the extent to which injuries to occupants resulted
from their striking some part of the head restraint.
1.3 Scope
The analysis of FMVSS 202 was done using National Crash Severity Study
(NCSS) data. This data contains detailed information on head restraints and
their adjustment and on the presence of neck injuries occurring to occupants of
the involved vehicles. The data also includes information on many other factors
such as age and sex of occupant, type and severity of crash, e tc . , that were
important to consider relative to the occurrence of neck injuries. Statistical
models for estimating head restraint effectiveness were developed using some of
these variables.
The data was also examined to identify the occurrence of injuries to
occupants caused by head restraints. The severity of these injuries was
compared to the severity of injuries to similar occupants in similar crashes
when head restraints were not present.
1.4 Approach
1.4.1 Data Source
The evaluation of FMVSS 202 was based on an analysis of the NCSS data which
was recently collected. The NCSS was a multi-year effort which began in October
1976 and continued through March 1979. The goal was to collect Level 2-type (or
intermediate-level) accident investigation data on over 10,000 towaway
1-2
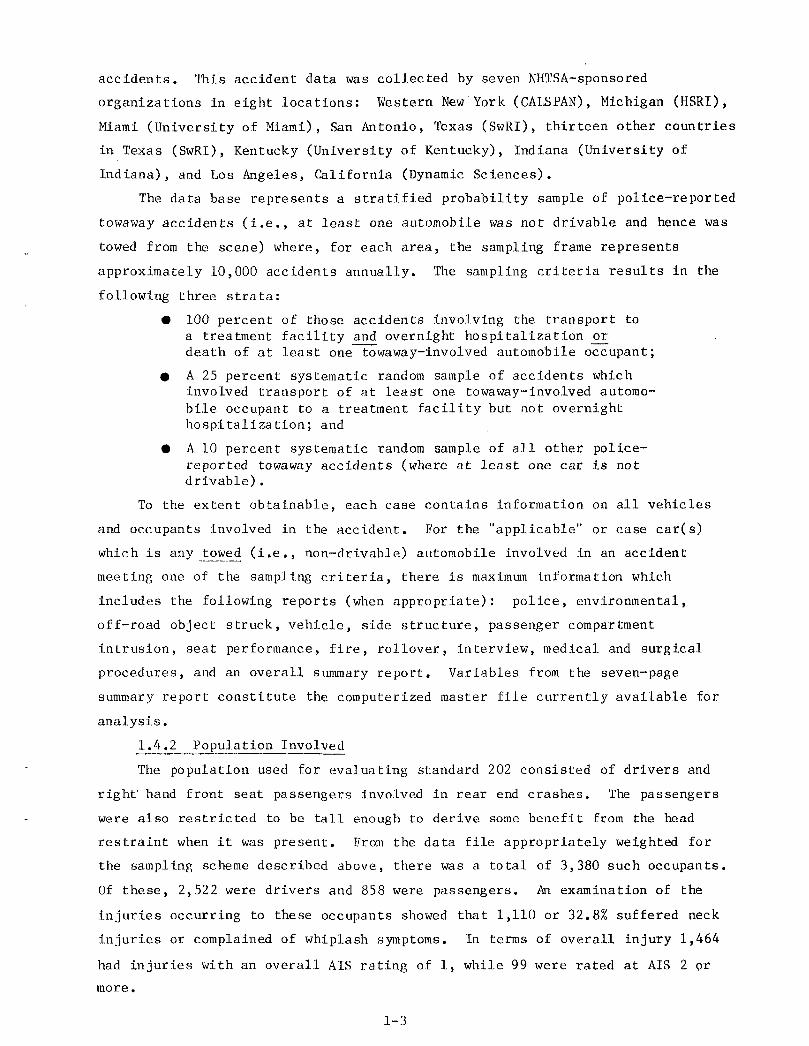
accidents. This accident data was collected by seven NHTSA-sponsored
organizations in eight locations: Western New York (CALSPAN), Michigan (HSRI),
Miami (University of Miami), San Antonio, Texas (SwRI), thirteen other countries
in Texas (SwRI), Kentucky (University of Kentucky), Indiana (University of
Indiana), and Los Angeles, California (Dynamic Sciences).
The data base represents a stratified probability sample of police-reported
towaway accidents ( i . e . , at least one automobile was not drivable and hence was
towed from the scene) where, for each area, the sampling frame represents
approximately 10,000 accidents annually. The sampling criteria results in the
following three strata:
• 100 percent of those accidents involving the transport toa treatment facility and overnight hospitalization JJTdeath of at least one towaway-involved automobile occupant;
• A 25 percent systematic random sample of accidents whichinvolved transport of at least one towaway-involved automo-bile occupant to a treatment facility but not overnighthospitalization; and
• A 10 percent systematic random sample of all other police-reported towaway accidents (where at least one car is notdrivable) .
To the extent obtainable, each case contains information on all vehicles
and occupants involved in the accident. For the "applicable" or case car(s)
which is any towed ( i . e . , non-drivable) automobile involved in an accident
meeting one of the sampling cri ter ia , there is maximum information which
includes the following reports (when appropriate): police, environmental,
off-road object struck, vehicle, side structure, passenger compartment
intrusion, seat performance, f ire, rollover, interview, medical and surgical
procedures, and an overall summary report. Variables from the seven-page
summary report constitute the computerized master file currently available for
analysis.
1.4.2 Population Involved
The population used for evaluating standard 202 consisted of drivers and
right' hand front seat passengers involved in rear end crashes. The passengers
were also restricted to be tall enough to derive some benefit from the head
restraint when i t was present. From the data file appropriately weighted for
the sampling scheme described above, there was a total of 3,380 such occupants.
Of these, 2,522 were drivers and 858 were passengers. An examination of the
injuries occurring to these occupants showed that 1,110 or 32.8% suffered neck
injuries or complained of whiplash symptoms. In terms of overall injury 1,464
had injuries with an overall AIS rating of 1, while 99 were rated at AIS 2 or
more.
1-3

1.4.3 Data Characteristics
Of particular importance relative to the evaluation of the effectiveness of
FMVSS 202 were data elements in the NCSS file containing information on head
restraints in the involved vehicles, and on the occurrence of neck injuries to
the occupants of these vehicles. In addition to these items, the NCSS file
contains information on a variety of other factors that were considered in the
evaluation. These included:
Occupant age, sex, and heightSeating positionSeat typeRestraint useInjury severityOccupant contact (first)Characteristics of the accident- Impact type- Delta V- Extent of damage
• Vehicle weight, model year, model type, etc.• Head restraint type• Front seat type• Front seat/head restraint measurements (left and right front)
1.5 Limitations of the Study
Although the NCSS data contains detailed Information on head restraints,
neck injuries and many other contributing factors, the analysis was limited by
relatively small sample sizes of occupants in vehicles with various head
restraint systems involved in rear-end crashes. As a result, it was only
possible to include some of the most important factors in models for head
restraint effectiveness rather than all factors of interest. The small sample
sizes also yielded relatively large variances for many of the estimated
quantities. This, in turn, resulted in many of these quantities not. being
statistically significant.
1.6 Outline of the Report
Section 2 of this report summarizes the analyses performed for FMVSS 202.
It includes a discussion of the measures of effectiveness; the estimates of
effectiveness based on the various measures (i.e., injury characterizations);
confidence limits of the effectiveness estimates; and overall success of the
evaluation.
Section 3 contains the details of the statistical analyses which resulted
in the effectiveness estimates summarized in Section 2.
1-4
1.7 References for Section 1
1. Ball, J.T., J.C. Reidy and G.M. Northrop. CEM 4229-596: FinalDesign and Implementation Plan for Evaluating the Effectivenessof FMVSS 202: Head Restraints, and FMVSS 207: Seating Systems,Hartford, Connecticut, CEM, December 1977. (DOT-HS-7-01675)
2. Northrop, G.M., J.T. Ball, D. Bancroft and J.C. Reidy,CEM 4228-4229-600: Evaluation Methodologies for Nine FederalMotor Vehicle Safety Standards: FMVSS 105, 108, 122, 202, 207,213, 220, 221, 222. Hartford, Connecticut, The Center for theEnvironment and Man, Inc., March 1978. (DOT-HS-7-01674 &DOT-HS-7-01675)
3. Stewart, J.R. CEM 4254-633: Work Plan for Statistical Evaluationof the Effectiveness of FMVSS 202: Head Restraints. Chapel Hill,North Carolina, Highway Safety Research Center, and HartfordConnecticut, The Center for the Environment and Man, Inc.,December 1978.
1-5

2.0 SUMMARY OF ANALYSES PERFORMED ON FMVSS 202
2.1 Measures of Effectiveness
The NCSS data contains a variable which indicates the presence or absence
of head restraints in each case vehicle. When head restraints are present, the
variable indicates the type of restraint (integral or adjustable), and for
adjustable restraints gives the. height of the restraint above the seat cushion.
For cases where this variable was missing or coded as unknown it was usually
possible to determine if head restraints of some type were present by examining
the vehicle make and model year. Thus, four conditions relative to head
restraints were considered:
a) Integral Head Restraints;b) Adjustable Head Restraints;c) Head Restraint Present (type unknown);
d) No Head Restraint Present
The measure of effectiveness of some head restraint type (a, b, c., or some
combination thereof) was taken to be the percentage change in the injury rate
for that head restraint type relative to the injury rate for no head restraint.
That; i s , effectiveness for head restraint type r was estimated as,
(injury rate/no restraint) - (injury rate/type r restraint) x QQr injury rate/no restraint
Three different characterizations of occupant injury were used in esti-
mating the injury rates for calculating head restraint effectiveness. These
were:
1) Presence or absence of whiplash symptoms;
2) Any injury at AIS 1 or greater, versus no injury;
3) Any injury at a level of AIS 2 or greater, versusno injury or lesser injury.
2.2 Estimated Effectiveness of FMVSS 202
2.2.1 Methods
Many factors pertaining to the crash, the vehicle, and the occupant may be
associated with both the presence or absence of head restraints, and with the
degree of injury to the occupant. Thus, in order to obtain unbiased estimates
of head restraint effectiveness i t is necessary to first identify these factors,
Models using these factors could then be developed to estimate head restraint
effectiveness.
2 - 1
As an initial step in this factor identification or variable selection, the
marginal association between each potential variable and head restraint type,
and between each variable, and injury was examined from a series of two-way
contingency tables. When only a few variables (two or three) were significantly
associated with both head restraint type and injury, these variables were
further examined by including them in a log linear model to determine their
partial associations using the procedure described by Fuchs (1979). The
variables that showed significant, interactions with both injury and head
restraint type were retained for use in modeLs for head restraint
effectiveness.
When a larger numbui" of variables were significantly associated with both
injury and head restraint type, the stepwise variable selection procedure of:
Clarke and Koch (1976) was used to select those variables most strongly asso-
ciated with injury from the subset of those that were significantly associated
with head restraint type. With this procedure, partial associations are tested
using Chi-square and Mantel-Haenszel tests.
After the appropriate set of variables was selected, head restraint
effectiveness estimates were obtained by fitting linear models to the injury
rate data for the various head restraint types partitioned by the control
variables. The weighted least squares procedure (CENCAT) was used for the
modeling. The effectiveness estimates produced by these models are shown in
Table 2-1.
hjL'JL Results
As can be seen from Table 2-1, separate effectiveness estimates were made
for towed and non-towed case vehicles. Detailed information on type and adjust-
ment of head restraints was generally missing for non-towed case vehicles.
Thus, comparisons could only be made for head restraint present (as determined
by vehicle make and model year) versus no head restraint. Also, no Injuries at
a level of AIS 2 or greater were suffered by occupants of non-towed case
vehicles, and, hence, no comparisons could be made relative to this measure.
The table shows that most of the effectiveness estimates are positive,
indicating that the injury rates for the occupants with the various types of
head restraints are usually smaller than the injury rates for occupants with no
head restraints. Only for the comparison of integral head restraints versus no
restraints relative to OA1S > 1, however, was the effectiveness estimate statis-
tically different from zero at a 5 percent level of significance (as can be seen
by the fact that the lower confidence limit is positive for this case).
2-2

TABLE 2-1
FFFECTIVENESS ESTIMATES
Head RestraintComparison
Al 1 Types vs.
Al l Types vs.
Al 1 Types vs.
A l l Types vs .
Al 1 Types vs .
Integral vs.
Adjustable vs
Integral vs.
Adjustable vs
Integral vs.
Adjustable vs
None
None
None
None
None
None
. None
None
. None
None
. None
InjuryCriterion
Whiplash
OAIS _> 1
OAIS _> 2
Whiplash
OAIS I 1
Whipi ash
Whiplash
OAIS 2 1
MIS 2 1
OAIS _> 2
OAIS 2. 2
Case Vehic leCondi t ion
Towed
Towed
Towed
Mo n-To wed
Non-Towed
Towed
Towed
Towed
Towed
Towed
Towed
Ef fect iveness
9.95%
13.57%
-20.60%
-1.35%
19.28%
20.27%
-1.27%
31.61%
12.02%
47.41%
-2.35%
95% ConfidenceInterval
(-10.00, 29.90)
( -4 .81 , 31.95)
(-180.63, 139.43)
(-65.46, 62.76)
(-16.98, 55.54)
(-3.47, 44.01)
(-24.16, 21.62)
(17.38, 45.86)
(-3.72, 27.76)
(-22.76, 117.58)
(-125.34, 120.64)
Table 2-2 shows comparisons of correctly positioned adjustable head
restraints with adjustable restraints not correctly positioned, in terms of
TABLE 2-2COMPARISON OF CORRECTLY ADJUSTED AND INCORRECTLY
ADJUSTED ADJUSTABLE HEAD RESTRAINTS
Injury Criterion
Whiplash
OAIS 2 1
OAIS 2 2
InjuryDifference
-1
-4
-1
.96 per
.38 per
.36 per
Rate
hundred
hundred
hundred
StandardDeviation
5.
5
2.
63
.93
11
2-3
differences in their respective injury rates. None, of the differences in rates
was significantly greater than zero, and in fact, the injury rates for the
correctly positioned restraints always slightly exceeded the injury rates for
those not correctly positioned. In view of these results, and those of Table
2-1 for adjustable restraints, separate effectiveness estimates (relative to no
head restraint) for correctly and incorrectly positioned adjustable head
restraints were not made.
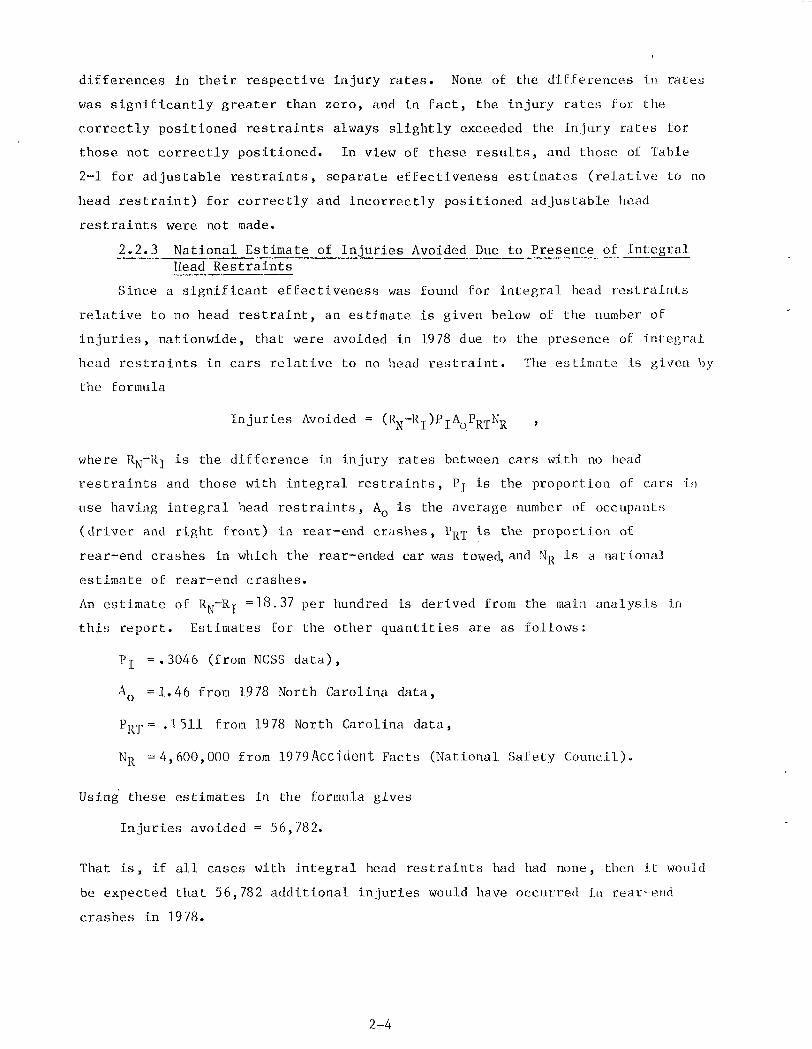
2.2.3 National Estimate of Injuries Avoided Due to Presence of .IntegralHead Restraints
Since a significant effectiveness was found for integral head restraints
relative to no head restraint, an estimate is given below of the number of
injuries, nationwide, that were avoided in 1978 due to the presence of: integral
head restraints in cars relative to no head restraint. The estimate is given by
the formula
Injuries Avoided = (R\r~Rx^PIAoPRT% '
where %~Rj is the difference in injury rates between cars with no head
restraints and those with integral restraints, Pj- is the proportion of cars in
use having integral head restraints, AQ is the average number of occupants
(driver and right front) in rear-end crashes, P^p is the. proportion of
rear-end crashes in which the rear-ended car was towed, and N R is a national
estimate of rear-end crashes.
An estimate of %fRj; =18.37 per hundred is derived from the main analysis in
this report. Estimates for the other quantities are as follows:
Pj- =.3046 (from NCSS data),
AQ =1.46 from 1978 North Carolina data,
P R T = .1511 from 1978 North Carolina data,
N R =4,600,000 from 1979Accident Facts (National Safety Council).
Using these estimates in the formula gives
Injuries avoided = 56,782.
That is, if all cases with integral head restraints had had none, then it would
be expected that 56,782 additional injuries would have occurred in rear-end
crashes in 1978.
2-4

2.2.4 Examination of Injuries Caused by Head Restraints
The NCSS data file shows that there were 2123 (weighted) cases of injuries
occurring to rear seat occupants in cars equipped with head restraints. In 32
(about 1.5%) of these cases the object contacted was the head restraint. Nearly
all of these occupants also had other injuries caused by contacting other
objects, and the head restraint caused injury was not always the most severe.
The average severities of the head restraint caused injuries were compared with
the average severities of injuries occurring to similar (in age and sex) rear
seat occupants in similar (with respect to extent of damage) crashes, in cars
not equipped with head restraints. For most of the age by sex by extent of
damage categories, the average severity of the head restraint caused injuries
did not exceed the average severity of the injuries occurring to rear seat occu-
pants when head restraints were not present. In view of these results, it does
not appear that head restraints represent a safety hazard to rear seat occu-
pants.
2.3 Evaluation of Effectiveness Analysis
All of the analyses were done using a weighted data file. That is, for
example, an observation from the 10 percent sample was treated as 10 identical
observations. To compensate for this inflation of the actual data, all
variances were similarly inflated by the ratio of weighted to unweighted cases.
This variance inflation factor varied from situation to situation, but was
generally on the order of 5. Even with the weighted data, however, sample sizes
often became quite small, especially with respect to frequencies of injured
occupants with specific types of head restraints in certain accident
configurations. This, together with the inflated variances, resulted in many of
the effectiveness estimates, while being of substantial magnitudes not being
statistically significant. While not significant at a 5 percent level, the
effectiveness estimates of integral restraints relative to whiplash, adjustable
restraints relative to OAIS _> 1, and all restraints (towed cases) relative to
OAIS _> 1 all had p-values in the .10 to .20 range.
It is of interest to note that integral restraints were found to be more
effective than adjustable restraints and that the positioning of the adjustable
restraint did not seem to matter.
2-5
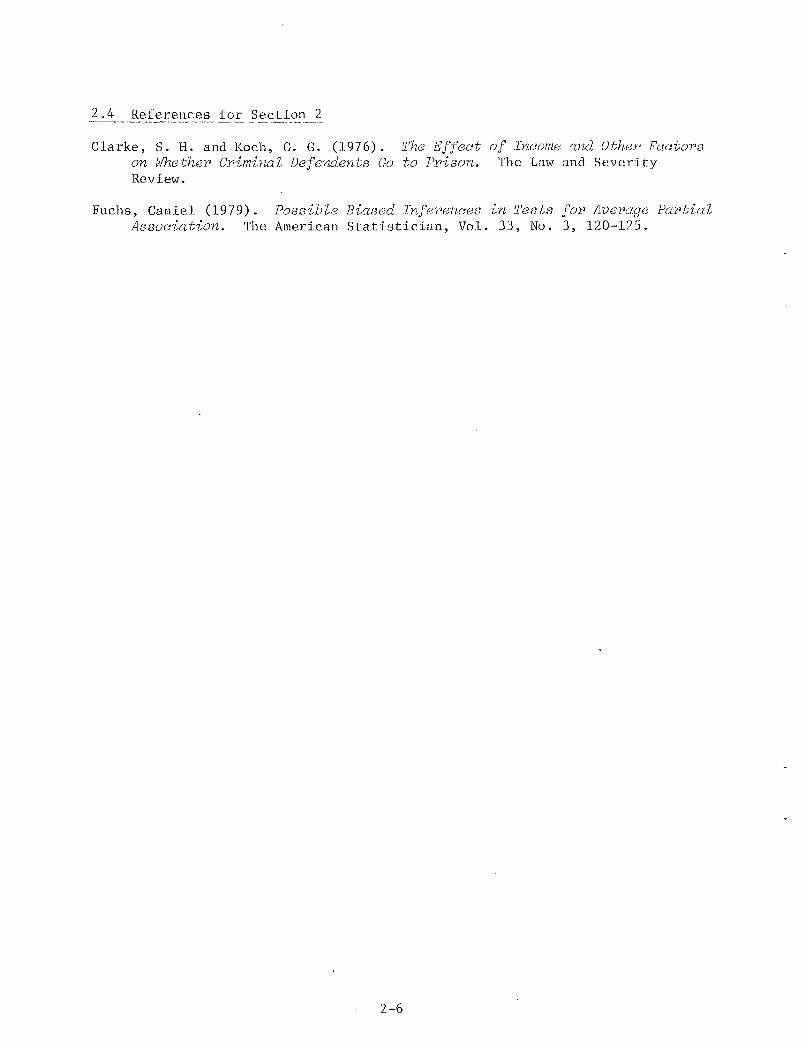
2.4 References for Sec_tion 2
Clarke, S. H. and Koch, 0. G. (1976). The Effect of Income and Other Factorson Whether Criminal Defendents Go to Prison. The Law and SeverityReview.
Fuchs, Caniel (1979). Possible Biased Inferences in Tests for Average PartialAssociation. The American Statistician, Vol. 33, No. 3, 120-125.
2-6

3.0 DATA PREPARATION AND DATA ANALYSIS
3.1 Introduction
The analysis of FMVSS 202 (Head Restraints) was based on NCSS data.
Figure 3-1 is a flow diagram indicating the steps followed in this analysis.
The Subtask numbering system is explained as follows:
Subtask 1.2.1
Task Number \(1 through 4) Standard Subtask
Number Number(1 through 7)
This numbering sequence was chosen for the following reasons:
• Task Number. All seven Standards involve three Tasks:
Task 1: Review Methodology and Develop Work Plans
Task 2: Analysis of Data
Task 3: Final Analysis and Final Report on the Standard
• Standard Number. For convenience, throughout the entire study,
we use the following "Standard Numbers."
1 = FMVSS 108: Side Marker Lamps
2 = FMVSS 202: Head Restraints
3 = FMVSS 20 7: Seat Back Locks
'. = FMVSS 213: Child Seating Systems
5 = FMVSS 214: Side Door Beams
6 = FMVSS 222: School Bus Seats and Crash Protection
7 = FMVSS 301: Fuel System Integrity
All CEM report numbers have last digits in the sequence notedabove.
• Subtask Number. Sequential numbers, beginning with "1".
A discussion of each Subtask indicated within Figure 3-1 completes this section.
3.2 Preparation of NCSS Data for Analysis
As shown in Figure 3-1, the first steps in the analysis were to obtain the
NCSS data file and prepare it for use.
3.3 Construct Working File For FMVSS 202 Evaluation
In determining the variables and data items to be included in the analysis
file several terms were defined as follows:
3-1

TASK 1 Task 1.3.1
Task ?.3.1
Task 2.3.2
TASK
Task 2.3.3
Task 2.3.4
TASK 3
Task 2.3.9
Task 3.3.1
Task 3.3.2
Acquire NCSS Data
Determine Proper HeadRestraint Adjustment asa Function of Occupant
Height
SelectPotentialControl
Variables
Compare Indicators ofNeck Injury and Severity
Make Selection
Tabulationscal TestsImportance
andofof
Stat is t i -telativeControl
Variables
Select Variables,Characteristics, and
Model Forms
Fit Models, ObtainPreliminary EffectivenessEstimates and Confidence
Intervals
Tabulate Data, Check f o r CompletenessConsistency Between Report ing Teams
Investigate aridMake Necessary
Adjustments
Create Working Fi le torFMVSS 202 fvaluation
Identify Cases WithInjur ies Caused by
Head Restraints
Task 2 . 3 . 5
[ Tabul ateCharacteristics of
Occupants and Crashes
Task2.3.6
Identify Rear EndCrashes Kith SomeOccupants HavingHead Restraints
and Some Not
Task 2.3T7 ~J~~~ "Determine
Feasibi l i ty ofWithin Vehicle
Analysis
Compare Injur ies andSeverity With Those
of Similar Occupantsin Similar Crashes
Task2.3.8
Do Analysis IfFeasible ObtainEffectiveness
Estimates
Prepare Task 2 Preliminary Analysis Report• Specify Effectiveness o f FMVSS 20"? to
Degree Possible.• Identify Additional Analysis to be
Performed on Task 3.
Conduct Final Analysis 1Prepare FMVSS 202 Final R e p o r t j
Figure 3-1. Flow diagram for evaluation of FMVSS 202:Head Restraints,
3-2

1. Rear-end crash: The NCSS data file contains information on asmany as two impacts occurring to each vehicle, listed in orderof decreasing severity. A second variable gives the order in whichthe impacts occurred. For the purpose of this analysis a crash wasconsidered to be a rear-end crash if the impact which occurredfirst had the principal direction of force in the range from 5 to7 o'clock (inclusive). The rear impact need not have been themost severe impact. Only the first impact was considered since forsubsequent impacts it could not be assumed that the occupants would bein a position to be protected by the head restraints.
2. Occupants (relative to neck injuries): For the purpose of eval-uating head restraints, only occupants tall enough to benefit fromthe restraints were considered. From an examination of anthropo-metric tables and seat back heights it was decided that onlyoccupants at least 47 inches tall would be considered. In addi-tion only occupants seated in the front left and front rightpositions were considered since only these positions are equipped withhead restraints.
3. Head restraints: The NCSS data contains a special variable whichprovides information on head restraint type -- integral, adjustable,or none -- for each occupant. For cases where this variable wasmissing (primarily when the case vehicle was not towed), theoccupants could usually be classified as having some type of headrestraint or no restraint by examining the vehicle make and modelyear (as described in Section 1.1).
4. Head restraint adjustment: For vehicles with adjustable headrestraints, the NCSS data includes measurements of the distancefrom the top of the restraint to the top of the (undeflective)seat cushion for each restraint. From anthropometric tables itwas estimated that this distance should lie in the range of from39 percent to 45 percent of the occupants height in order for thehead restraint to be correctly positioned behind the occupant'shead.
5. Occupant injury: For each occupant the NCSS data contains infor-mation on as many as three specific injuries, recorded in orderof decreasing severity. This information includes the body regionto which the injury occurred and an AIS severity score for eachinjury. In addition to the information on the three most severeinjuries an overall AIS severity score is also included. Whenan occupant is uninjured all of the variables pertaininq to thethree specific injuries are left blank, while the overall AISseverity score should be coded as zero. When the occupant isinvolved in a rear-end crash an additional item of information isavailable which tells when the occupant first noticed whiplashsymptoms, if, indeed, such symptoms did occur. An examinationof these injury-related variables showed that in many cases wherewhiplash symptoms were indicated, a neck injury was not listed asone of the three most severe injuries. There were also cases withneck injuries such as sprains, dislocations, etc. but no whiplashsymptoms indicated. In view of the above discussion two character-izations of injury were used in the evaluation of head restraints.These are as follows.
3-3
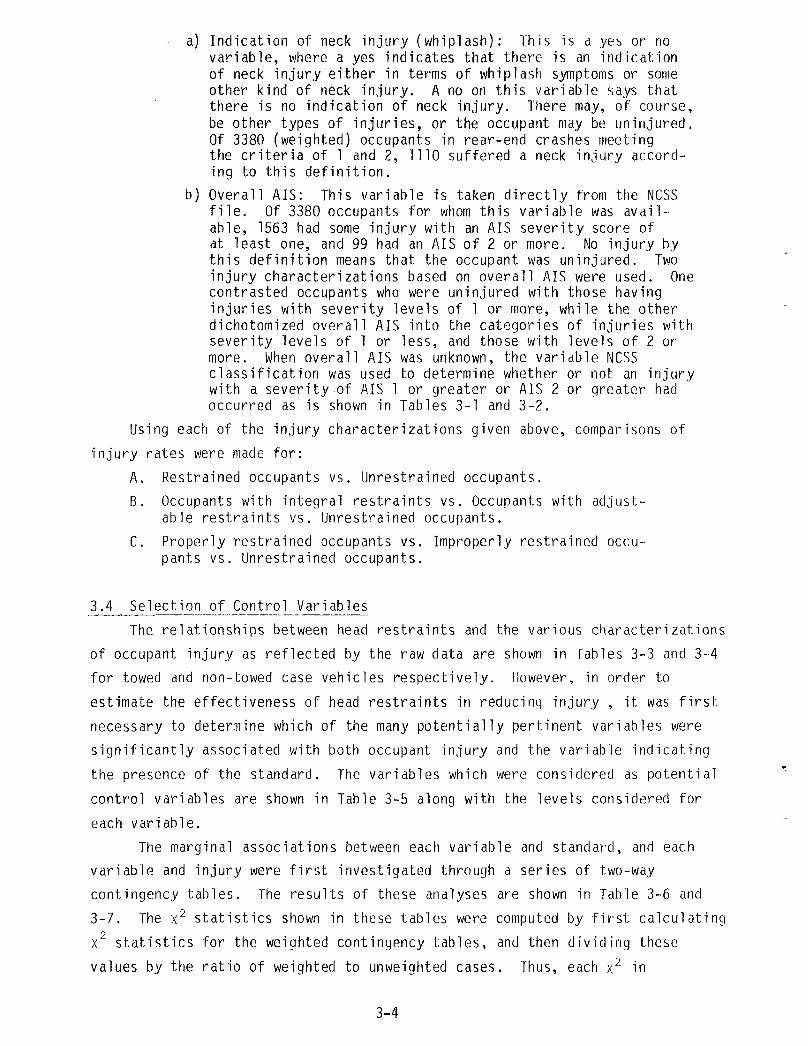
a) Indication of neck injury (whiplash): This is a yes or novariable, where a yes indicates that there is an indicationof neck injury either in terms of whiplash symptoms or someother kind of neck injury. A no on this variable says thatthere is no indication of neck injury. There may, of course,be other types of injuries, or the occupant may be uninjured.Of 3380 (weighted) occupants in rear-end crashes meetingthe criteria of 1 and 2, 1110 suffered a neck injury accord-ing to this definition.
b) Overall AIS: This variable is taken directly from the NCSSfile. Of 3380 occupants for whom this variable was avail-able, 1563 had some injury with an AIS severity score ofat least one, and 99 had an AIS of 2 or more. No injury bythis definition means that the occupant was uninjured. Twoinjury characterizations based on overall AIS were used. Onecontrasted occupants who were uninjured with those havinginjuries with severity levels of 1 or more, while the otherdichotomized overall AIS into the categories of injuries withseverity levels of 1 or less, and those with levels of 2 ormore. When overall AIS was unknown, the variable NCSSclassification was used to determine whether or not an injurywith a severity of AIS 1 or greater or AIS 2 or greater hadoccurred as is shown in Tables 3-1 and 3-2.
Using each of the injury characterizations given above, comparisons of
injury rates were made for:
A. Restrained occupants vs. Unrestrained occupants.
B. Occupants with integral restraints vs. Occupants with adjust-able restraints vs. Unrestrained occupants.
C. Properly restrained occupants vs. Improperly restrained occu-pants vs. Unrestrained occupants.
3.4 Selection of Control Variables
The relationships between head restraints and the various characterizations
of occupant injury as reflected by the raw data are shown in Tables 3-3 and 3-4
for towed and non-towed case vehicles respectively. However, in order to
estimate the effectiveness of head restraints in reducing injury , it was first
necessary to determine which of the many potentially pertinent variables were
significantly associated with both occupant injury and the variable indicating
the presence of the standard. The variables which were considered as potential
control variables are shown in Table 3-5 along with the levels considered for
each variable.
The marginal associations between each variable and standard, and each
variable and injury were first investigated through a series of two-way
contingency tables. The results of these analyses are shown in Table 3-6 and
3-7. The x 2 statistics shown in these tables were computed by first calculating
X 2 statistics for the weighted contingency tables, and then dividing these
values by the ratio of weighted to unweighted cases. Thus, each x 2 in
3-4
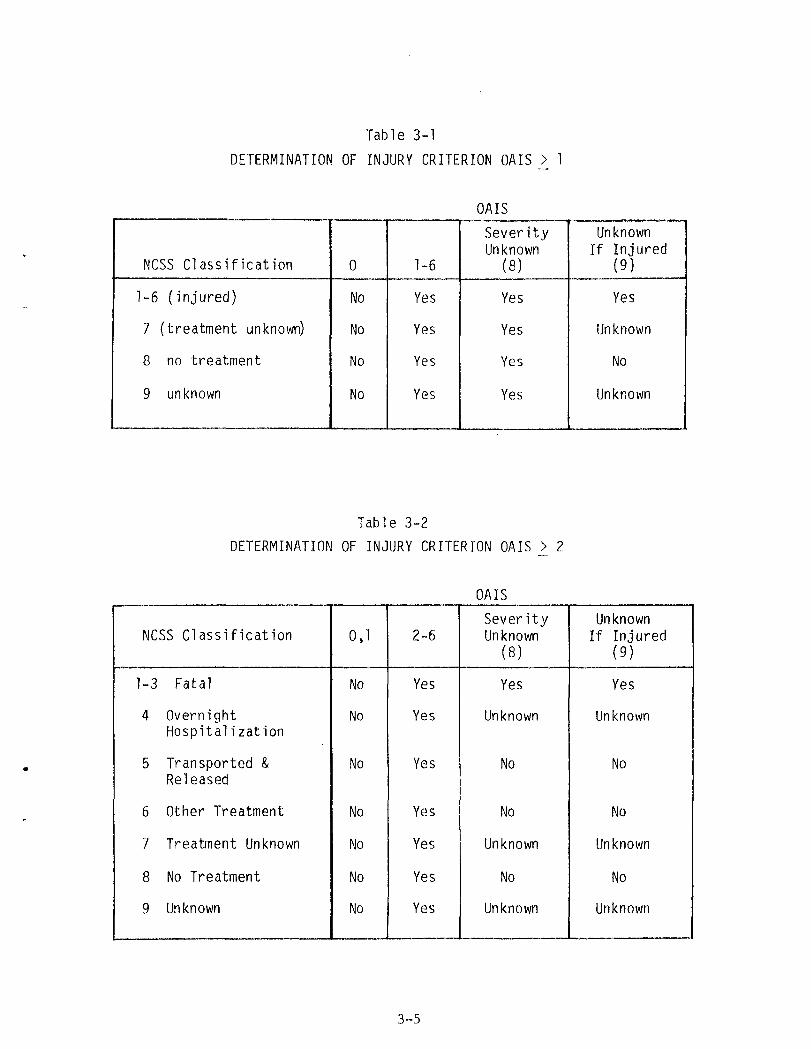
Table 3-1
DETERMINATION OF INJURY CRITERION OAIS _>
OAIS
NCSS Classification
1-6 (injured)
7 (treatment unknown)
8 no treatment
9 unknown
0
No
No
No
No
1-6
Yes
Yes
Yes
Yes
SeverityUnknown
(8)
Yes
Yes
Yes
Yes
UnknownIf Injured
(9)
Yes
Unknown
No
Unknown
Table 3-2
DETERMINATION OF INJURY CRITERION OAIS _> 2
OAIS
NCSS Classification
1-3 Fatal
4 OvernightHospitalization
5 Transported &Released
6 Other Treatment
7 Treatment Unknown
8 No Treatment
9 Unknown
0,1
No
No
No
No
No
No
No
2-6
Yes
Yes
Yes
Yes
Yes
Yes
Yes
SeverityUnknown
(8)
Yes
Unknown
No
No
Unknown
No
Unknown
UnknownIf Injured
(9)
Yes
Unknown
No
No
Unknown
No
Unknown
3-5
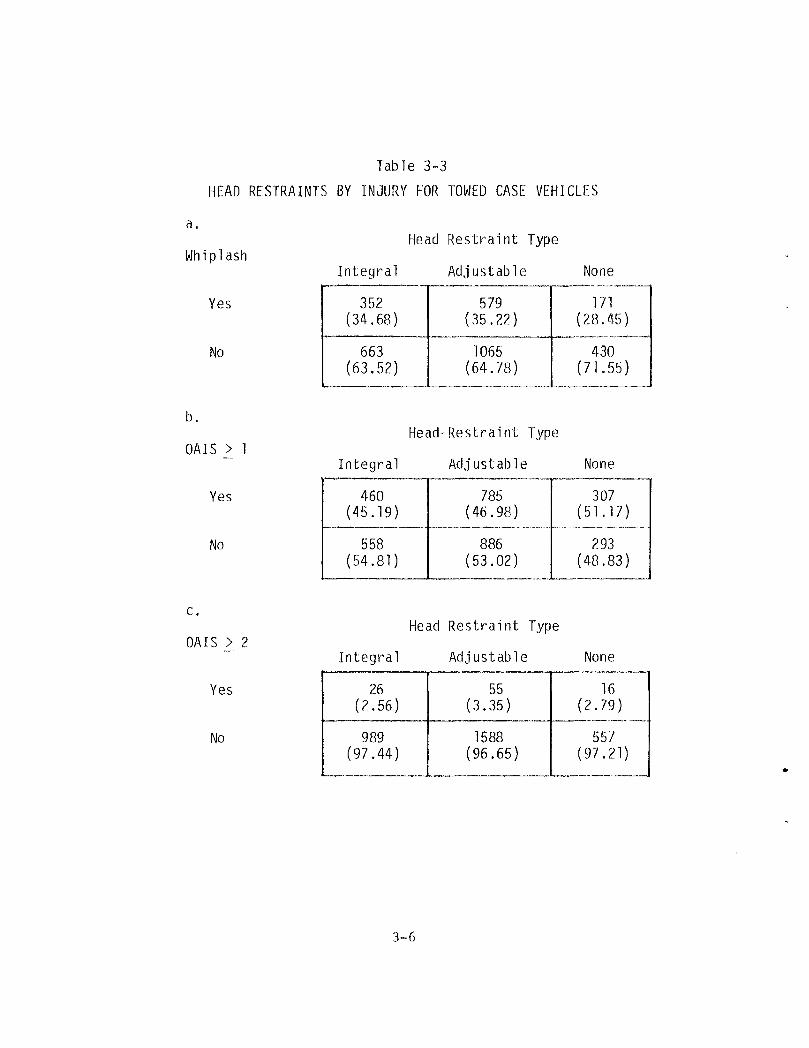
Table 3-3
HEAD RESTRAINTS BY INJURY FOR TOWED CASE VEHICLES
a.
Whiplash
Yes
No
b.
OAIS >_ 1
Yes
No
c.
OAIS >_ 2
Yes
No
Integral
352(34.68)
663(63.52)
Integral
460(45.19)
558(54.81)
Integral
26(2.56)
989(97.44)
Head Restraint Type
Adjustable
579(35.22)
1065(64.78)
Head-Restraint Type
Adjustable
785(46.98)
886(53.02)
Head Restraint Type
Adjustable
55(3.35)
1588(96.65)
None
171(28.45)
430(71.55)
None
307(51.17)
293(48.83)
None
16(2.79)
557(97.21)
3-6
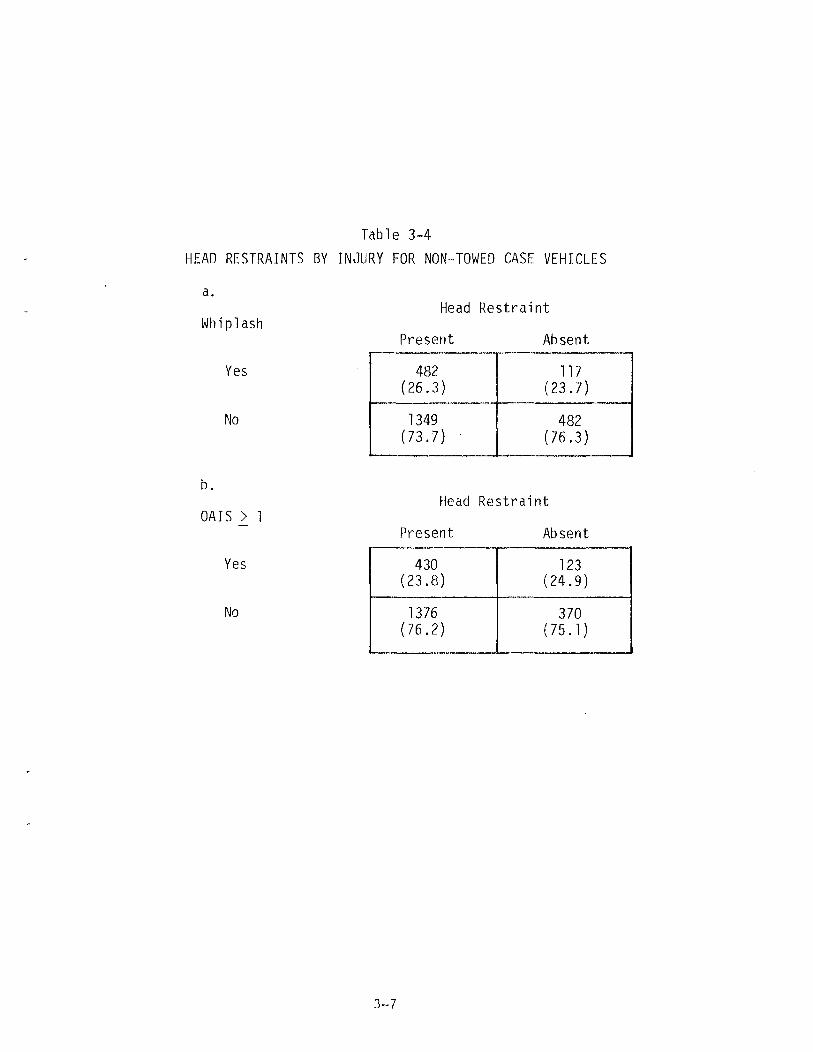
Table 3-4
HEAD RESTRAINTS BY INJURY FOR NON-TOWED CASE VEHICLES
a.
Whiplash
Yes
No
b.
OAIS _> 1
Yes
No
Head
Present
482(26.3)
1349(73.7)
Head
Present
430(23.8)
1376(76.2)
Restraint
Absent
117(23.7)
482(76.3)
Restraint
Absent
123(24.9)
370(75.1)
3-7

Table 3-5
POTENTIAL CONTROL VARIABLES
Variable
1. Occupant Sex
2. Occupant Age
3. Extent of Damage
4. Belt Use
5. Direction of Force
6. Object Contacted
7. Seat Position
8. Seat Type
9. Vehicle Weight
10. V Total
Levels
Male, Female
(0-19),(20-29),(30-54),(55 & over)
(1 & 2 ) , (3 & 4 ) , (5-9)
Belted, Not Belted
6 o'clock, 5 or 7 o'clock
Compact or subcompact car,intermediate car, standard orluxury, small truck, othervehicle, other non-vehicle
Driver, right front
Bench, bucket, split
Up to 2300, 2400-3300, 3400 andover
(0-5), (6-10), (11-15), (16-20),(21-25), (26-30), (30 & over)
Table 3-6.1 and in the first column of 3-6.2 was derived by dividing the
3380 weighted casesweighted x2 by the scale factor 5.13 = 659~mme±ghte^A~cas^eB • F o r the second
column of Table 3-6.2 the scale factor was 5.28, while for Table 3-7 it was
7.94.
When the number of variables that had significant marginal associations
with both the standard and injury was small (e.g., two or three), a log linear
model was fit, using the BMDP3F computer program, to the frequencies of the
multidimensional contingency table containing all of the significant control
variables together with injury and the standard. Partial associations were then
determined by examining the interactions (first order and higher) of the control
variables with both standard and injury. Control variables which had
significant marginal and partial associations with standard and injury were then
included in models for estimating head restraint effectiveness. It might be
again noted that the log-linear models were fit to weighted frequencies and that
the test statistics (x2) were divided by the appropriate scale factors.
For example, in comparing all types of head restraints combined with no
restraint relative to whiplash injury, it can be seen from Table 3-6.1 that the
3-8
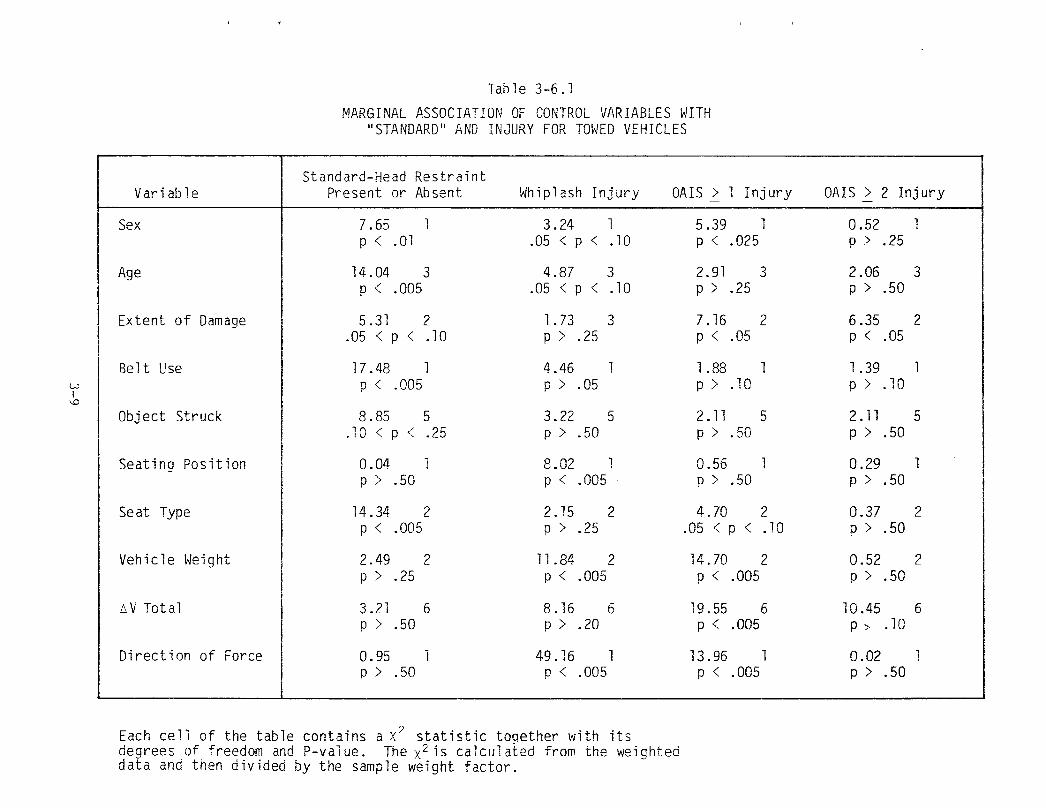
Table 3-6.1
MARGINAL ASSOCIATION OF CONTROL VARIABLES WITH"STANDARD" AND INJURY FOR TOWED VEHICLES
Variable
Sex
Age
Extent of Damage
Belt Use
Object Struck
Seating Position
Seat Type
Vehicle Weight
AV Total
Direct ion of Force
Standard-Head RestraintPresent or Absent
7.65P <
14.04P <
5.31.05 <
17.48P <
8.85.10 <
0.04P >
14.34P <
2.49P >
3.21P >
0.95P >
1.01
3.005
2p < .10
1.005
5p < .25
1.50
2.005
2.25
6.50
1.50
Whiplash In ju ry
3.24 1.05 < p < .10
4.87 3.05 < p < .10
1.73 3p > .25
4.46 1p > .05
3.22 5p > .50
8.02 1p < .005
2.15 2p > .25
11.84 2p < .005
8.16 6p > .20
49.16 1p < .005
OAIS >
5.39P <
2.91P >
7.16P <
1.88P >
2.11P >
0.56P >
4.70.05 <
14.70P <
19.55P <
13.96P <
1 In ju ry
1.025
3.25
2.05
1.10
5.50
1.50
2p < .10
2.005
6.005
1.005
OAIS _> 2
0.52P > •
2.06P > •
6.35P < •
1.39P > •
2.11P > •
0.29P > •
0.37P > •
0.52P > •
10.45P > •
0.02P > •
In jury
25
50
05
10
50
50
50
50
10
50
1
3
2
1
5
1
2
2
6
1
Each cell of the table contains a X statistic together with itsdegrees of freedom and P-value. Thex 2is calculated from the weighteddata and then divided by the sample weight factor.
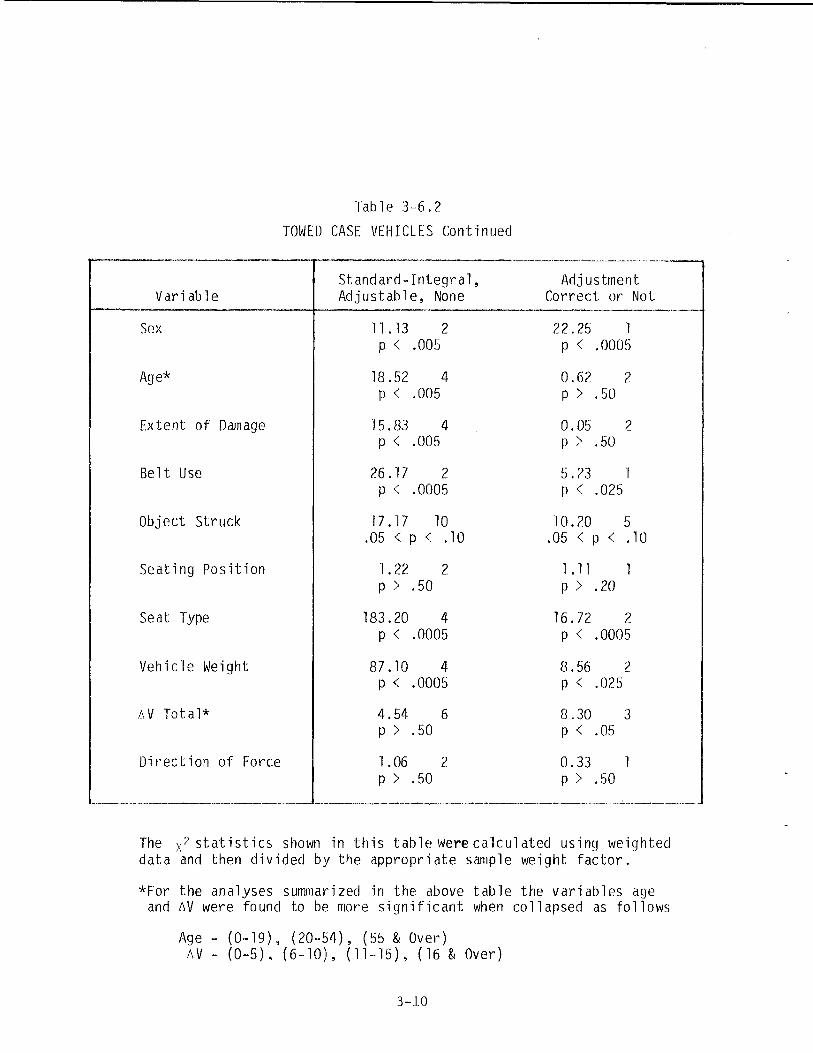
Table 3-6.2
TOWED CASE VEHICLES Continued
Variable
Sex
Age*
Extent of Damage
Belt Use
Object Struck
Seating Posit ion
Seat Type
Vehicle Weight
AV Tota l*
Direct ion of Force
Standard-Integral,Adjustable, None
11.13 2p < .005
18.52 4p < .005
15.83 4p < .005
26.17 2p < .0005
17.17 10.05 < p < .10
1.22 2p > .50
183.20 4p < .0005
87.10 4p < .0005
4.54 6p > .50
1.06 2p > .50
AdjustmentCorrect or Not
22.25 1p < .0005
0.62 2p > .50
0.05 2p > .50
5.23 1p < .025
10.20 5.05 < p < .10
1.11 1p > .20
16.72 2p < .0005
8.56 2p < .025
8.30 3p < .05
0.33 Ip > .50
The x2 s t a t i s t i c s shown in th is table were calculated using weighteddata and then divided by the appropriate sample weight factor .
*For the analyses summarized in the above table the variables ageand AV were found to be more s ign i f i cant when collapsed as follows
Age - (0-19), (20-54), (55 & Over)AV - (0 -5) , (6-10), (11-15), (16 & Over)
3-10
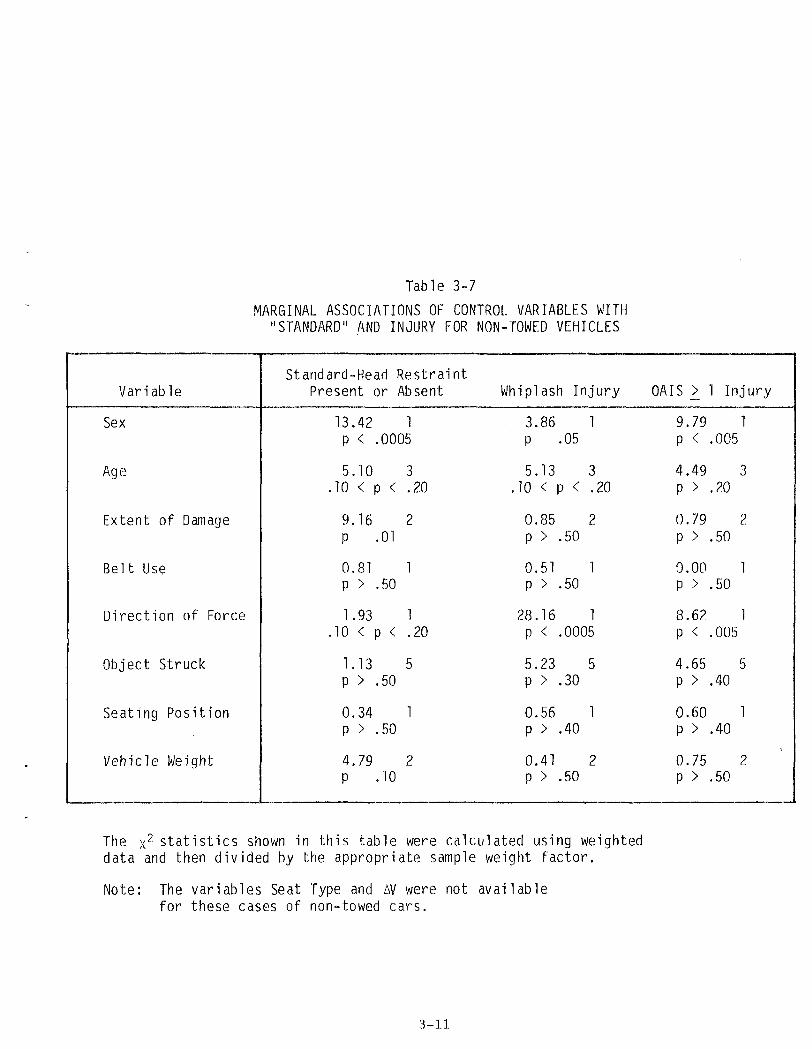
Table 3-7
MARGINAL ASSOCIATIONS OF CONTROL VARIABLES WITH"STANDARD" AND INJURY FOR NON-TOWED VEHICLES
Variable
Sex
Age
Extent of Damage
Belt Use
Direction of Force
Object Struck
Seating Position
Vehicle Weight
Standard-HeadPresent or
RestraintAbsent
13.42 1p < .0005
5.10.10 < p <
9.16p .01
0.81p > .50
1.93.10 < p <
1.13p > .50
0.34p > .50
4.79p .10
3.20
2
1
1.20
5
1
2
Whiplash
3.86P
5.13.10 < p
0.85P > •
0.51P > •
28.16P < •
5.23P > •
0.56P > •
0.41P > •
Injury
05
<
50
50
1
3.20
2
1
10005
30
40
50
5
1
2
OAIS >_
9.79P <
4.49P >
0.79P >
0.00P >
8.62P <
4.65P >
0.60P >
0.75P >
1 Injury
1.005
3.20
2.50
1.50
1.005
5.40
1.40
2.50
The x2 statistics shown in this table were calculated using weighteddata and then divided by the appropriate sample weight factor.
Note: The variables Seat Type and AV were not availablefor these cases of non-towed cars.
3-11
variables driver sex, age, and belt use are the only ones with significant (at a
.10% level) marginal associations with both standard and injury. Log-linear
models fit to these variables revealed significant partial associations between
each of the three control variables and injury and standard, thus all three were
retained for modeling head restraint effectiveness. On the other hand, in
comparing head restraints relative to OAIS _> 1, the variables with significant
marginal associations were sex, extent of damage, and seat type. The log-linear
model for these variables, however, shows the partial association between seat
type and injury to be quite nonsignificant. This, plus the fact that the
marginal association between seat type and injury was not especially strong led
to seat type being omitted from the effectiveness model.
When a larger number of variables had significant marginal associations
with standard and injury a stepwise selection procedure was used as follows.
The first control variable selected was that having the strongest association
with injury (as measured by x /degrees of freedom) chosen from the subset of
variables significantly associated with standard. In subsequent steps the
relationships between the control variables and injury were examined within
levels of standard and the previously selected control variables. Again,
candidate control variables were restricted to those significantly associated
with standard, and at each step the variable selected was the one with the
largest overall x2/degrees of freedom, provided that its partial association
with injury was significant, as indicated either by a Mantel-Haenszel statistic
or the X s summed over the various subtables.
For example, this procedure was used in selecting variables for comparing
integral restraints and adjustable restraints with no restraint relative to
whiplash injury. The first variable selected was the one with the largest value
of x2/degrees °f freedom relative to whiplash injury, chosen from among the
variables significantly associated with the three level head restraint type
variables. From tables 3-6.1 and 3-6.2 j_t can be seen that this variable is
vehicle weight. At the next step the relationships between the possible control
variables and whiplash injury were examined within levels of head restraint type
and vehicle weight. The variable extent of damage had the highest overall
X2/degrees of freedom, but the Mantel-Haenszel statistic for this variable was
not significant. The variable with the next highest x /degrees of freedom,
which was significant, was belt use, and so this was the second variable
selected. No additional variables were significant beyond these two.
The application of these selection procedures led to the selection of
variables for the various models as shown in Table 3-8.
3-12

Table 3-8
VARIABLES SELECTED
Head RestraintComparison
All Types Vs. None
All Types Vs. None
Al1 Types Vs. None
All Types Vs. None
All Types Vs. None
Integral, AdjustableVs. None
Integral, AdjustableVs. None
Integral, AdjustableVs. None
Correctly Adjusted Vs.Not Correctly Adjusted
Correctly Adjusted Vs.Not Correctly Adjusted
Correctly Adjusted Vs.Not Correctly Adjusted
InjuryCriterion
Whiplash
OAIS 2 1
OAIS 2 2
Whiplash
OAIS 2 1
Whiplash
OAIS 2 1
OAIS 2 2
Whiplash
OAIS 2 1
OAIS 2 2
Case VehicleCondition
Towed
Towed
T ;wed
Non-Towed
No n-Towed
Towed
Towed
Towed
Towed
Towed
Towed
Variables in Model
Age, Sex, Belt Use
Sex, Extent of Damage
Extent of Damage
Sex
Sex
Vehicle Weight, Belt Use
Vehicle Weight, Extentof Damage
Extent of Damage
Vehicle Weight
Vehicle Weight
Extent of Damage
3-13

3.5 Estimation of Head Restraint Effectiveness
The next step in the analysis consisted of fitting models to injury data
for each of the head restraint comparisons listed in Table 3-8, using the
appropriate control variables. Head restraint effectiveness estimates were then
computed using the smoothed injury rates resulting from the model fitting.
As an illustration of the model fitting procedure, consider the comparison
of all types of restraints combined versus no restraints relative to OAIS >_ 1
injury in towed case vehicles. The basic (weighted) data for this comparison is
given in Table 3-9. in some preliminary analyses both linear and log-linear
models were fit to the data for several of the comparisons, and it was found
Table 3-9
DATA FOR COMPARING ALL HEAD RESTRAINTS WITH NONERELATIVE TO OAIS > 1 INJURY IN TOWED VEHICLES
Extent ofDamage
1 & 2
1 & 2
1 & 2
1 & 2
3 & 4
3 & 4
3 & 4
3 & 4
5 - 9
5 - 9
5 - 9
5 - 9
OccupantSex
MMF
F
MMF
FMMFF
HeadRestraint
R
NR
NRNR
NR
NR
N
OAIS _> 1
Yes
263
82
47371
136
48
208
40
120
17
96
9
Injury
No
490
139
434
79
112
40
193
14
95
20
100
0
PercentInjured
34.93
37.10
52.15
47.33
54.84
54.55
' 51.87
74.07
55.81
45.95
48.98
100.00
that the linear models generally gave a somewhat better fit.
the model fit to the data of Table 3-9 was of the form
P = X 3 ,
For this reason
3-14

where P is the vector of proportions of. injured occupants in the various
subpopulations defined by extent of damage, sex, and head restraint, X is a
design matrix, and 3 is a vector of model coefficients. Figure 3-2 shows the
vector of proportions, the initial design matrix, and the estimated model
coefficients resulting from fitting the design matrix to the data. A weighted
least squares procedure GENCAT was used to fit the model.
P =
.349
.371
.522
.473
.548
.545
.519
.741
.558
.459
.490
.989*
1 0 0101 0 ISO1 1 0101 1 I'Oo o ono o ono o ono o ono o o oo o o oo o o oo o o o
0 0 0 0 00 0 0 0 00 0 0 0 00 0 0 0 00 "O"'O 0 00 1J0 0 01 O'O 0 0
1 l l o_°_°o~ofi o o~0 0 1 0 10 0 1 1 00 O i l 1 1
3-| ( s . d . ) =
.356
.160-.007
"".520 *.016.104.492.072.356
(.039 )(.050)LQ631.(.068)(.082)
•102(.072(.097(.097
Figure 3-2. Injury Rates, In i t i a l Design Matrix, and Model Coefficients.
It can be seen that the design matrix X- is in block diagonal form. By
comparing the rows of X-, with the subpopulations of Table 3-9 i t is seen that
the three blocks of X2 Correspond to the three levels of extent of damage.
The first column in each block is a base line effect for the block whose coeffi-
cient gives the injury rate for male occupants with head restraint. The second
column in each block is a sex effect, while the last column is the head
restraint effect. The vector of estimated coefficients has been similarly
partitioned, and an examination of the coefficients and their standard devia-
tions suggest certain reductions that might be made in the design matrix. For
example, the difference in the baseline coefficients of the second and third
blocks is quite small relative to their standard deviations so that the columns
corresponding to these effects might be combined. To the extent that a model
fails to provide an adequate fit to the data, either in an overall sense or for
certain subpopulations, the design matrix might need to be expanded in certain
areas in addition to being reduced. Through a sequence of tests of hypotheses
concerning the model coefficients a design matrix can be determined which pro-
vides an adequate fit to the data with as few parameters (columns) as possible.
*Zero frequencies are replaced by 0.1 for computational purposes.
3-15

Figure 3-3 shows the final design matrix and model coefficients for the
example used above. Again interpretation of the model coefficients or the
columns of the design matrix can be found by comparing the rows with the
subpopulations. Thus, for this example,
Figure 3-3
Model for Head Restraint Effectiveness Basedon OAIS _>. 1 Injury for Towed Case Vehicles
Extento f Damage
1 A 2
1 * 2
1 & 2
1 Fi 2
3 & 4
3 A 4
3 & 4
3 & 4
5-9
5-9
5-9
5-9
DriverSex
M
M
F
F
M
M
F
F
M
M
F
F
HeadRestraint
R
N
R
N
R
N
R
N
R
N
R
N
InjuryRates
.349
.371
.522
.473
.548
.545
.519
.741
.558
.459
.490
.989
PredictedInjuryRates
.356
.348
.516
.508
.528
.521
.528
.927
.528
.521
.528
.927
Desi
1
1
1
1
0
0
0
0
0
0
0
0
0
0
1
1
0
0
0
0
0
0
0
0
gn
0
0
0
0
1
1
1
1
1
1
1
1
Matrix
0 0
0 1
0 0
0 1
0 0
0 1
0 0
1 0
0 0
0 1
0 0
1 0
Model Coefficients (and standard deviations)
.356(.036)
.160(.050)
.528(.034)
.398(.075)
-.007(.054)
X2due to error = 3.46 with 7 degrees of freedom
Effectiveness estimate • E = 13.57%Standard deviation = 9.38
3-16

3-i is the baseline effect (injury rate) for extent of damageequal 1 or 2,
32 is the sex effect for extent = 1 or 2,
3n is the baseline for extent = 3-9,
3, is the head restraint effect for female occupants incrashes with extent = 3-9, and
3r is the head restraint effect in all other situations.
The head restraint effect 3^, is quite nonsignificant. It is retained in
the model, however, since it is used in estimating head restraint effectiveness.
For more complicated models (i.e., models containing more interactions) the
interpretation of the model coefficients can be obtained in the same way, but
the explanation becomes quite cumbersome.
The subpopulations and injury frequencies to which the other models were
fit are shown in Tables 3-10through 3-19.
The procedure for using the models to estimate head restraint effectiveness
is illustrated below also using the example of Table 3-7 and Figure 3-3. In
this model there are six subpopulations defined by the three levels of extent of
damage and the two of occupant sex. Each subpopulation can be given a
weight,N.I
wi = ^~ , where
= number of occupants in ij_h subpoulation, and
Within each subpopulation expressions for the injury rate of unrestrained
occupants, P^, and for the difference in injury rates between unrestrained and
restrained occupants, P^~PJJ> are given in terms of the model coefficients.
Thus, the design matrix shows that in the first subpopulation (extent = 1 or 2,
sex = M ) .
PN = &1+fi5 and PN-PR = 35 ,
while adding up the frequencies from Table 3-9 gives w^ = .2970.
Overall estimates of the quantities P^ and P^~13R are, thus, obtained as
weighted sums over the subpopulations. Finally, these sums have the form
3-17

Table 3-10.
DATA FOR COMPARING ALL HEAD RESTRAINTS WITH NONERELATIVE TO WHIPLASH INJURY IN TOWED VEHICLES
OccupantAge
< 19< 19< 19< 19< 19< 19< 19< 19
20-5420-5420-5420-5420-5420-5420-5420-5455+55+55+55+55+55+55+55+
BeltUse
yesyesyesyesnonononoyesyesyesyesnonononoyesyesyesyesnononono
OccupantSex
MMFFMMFFMMFFMMFFMMFFMMFF
HeadRestraint
RNRNRNRMRNRNRNRNRNR.NRNRN
Whiplash
Yes
100
100
491063
358
498
8203'
77321
50144
124
522
499
Injury
No
80
100
9897
14844
1230
940
47898
50893290
250
97679431
PercentInjured
55.50_..
50.00—
33.339.35
29.866.38
32.04100.0051.04
100.0029.8144.0038.7234.9732.56
100.0032.43
100.0034.90
2.9034.2722.40
3-18
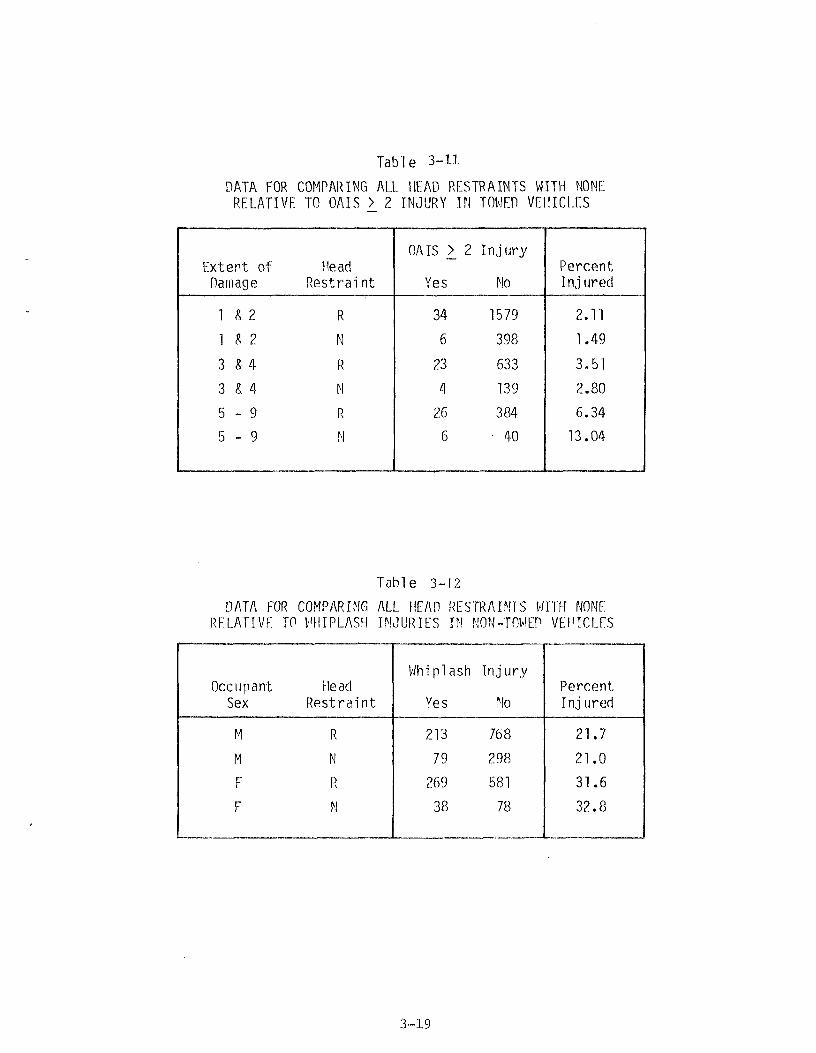
Table 3-11
DATA FOR COMPARING ALL HEAD RESTRAINTS WITH NONERELATIVE TO OAIS > 2 INJURY IN TOWED VEHICLES
Extent ofDamage
1 & 2
1 ft 2
3 & 4
3 & 4
5 - 9
5 - 9
HeadRestraint
R
N
R
N
R
N
OAIS >_
Yes
34
6
23
4
26
6
2 In jury
No
1579
398
633
139
384
• 4 0
PercentIn jured
2.11
1.49
3.51
2.80
6.34
13.04
Table 3-12
DATA FOR COMPARING ALL HEAD RESTRAINTS WITH NONERELATIVE TO WHIPLASH INJURIES IN NON-TOWED VEHICLES
OccupantSex
M
M
F
F
HeadRest ra in t
R
N
R
M
Whiplash
Yes
213
79
269
38
Injury
No
768
298
581
78
PercentInjured
21.7
21.0
31.6
32.8
3-19

Table 3-13
DATA FOR COMPARING ALL HEAD RESTRAINTS WITH NONERELATIVE TO OAIS > 1 INJURY IN NON-TOWED VEHICLES
OccupantSex
M
M
F
F
HeadRestraint
R
N
R
N
OAIS >_
Yes
140
95
290
28
1 Injury
No
832
282
544
88
PercentInjured
14.4
25.2
34.8
24.1
3-20

Table 3-14
DATA FOR COMPARING INTEGRAL RESTRAINTS AND ADJUSTABLERESTRAINTS*WITH NO RESTRAINT RELATIVE TO WHIPLASH INJURY
VehicleWeight
L ightL ightLiqhtL ightL ightL ightMed.Med.Med.Med.Med.Med.HeavyHeavyHeavyHeavyHeavyHeavy
BeltUse
YesYesYesNoNoNoYesYesYesNoMoNoYesYesYesNoNoNo
HeadRestraint
IntegralAdj ust .
NoneIntegralAdjust.
NoneIntegralAdjust .None
IntegralAdjust.None
IntegralAdj us t .
NoneIntegralAdjust.
None
Whiplash
Yes
3840
144574546571280
1704915428
29245
57
In jury
No
29480
21214862
101140
16615413224 •730
127603235
PercentInjured
56.77.7
40.427.842.131.380.3
100.032.552.527.138.536.5
100.018.628.919.5
*Towed Case Vehicles Only
Vehicle Weight: Light = < 2300 l b s . , Med. - 2400-3300,Heavy = > 3400
3-21
T a b l e 3 -15
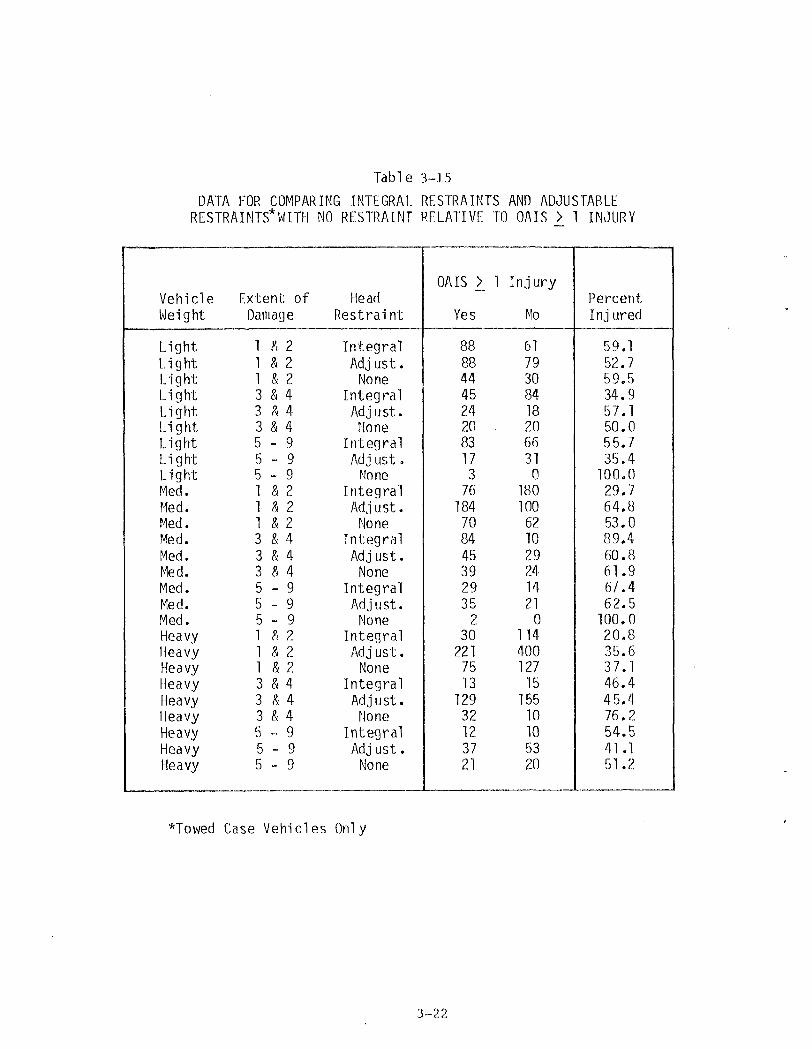
DATA FOR COMPARING INTEGRAL RESTRAINTS AND ADJUSTABLERESTRAINTS*WITH NO RESTRAINT RELATIVE TO OAIS > 1 INJURY
VehicleWeight
LightLightLightLightLightLightLightLightLightMed.Med.Med.Med.Med.Med.Med.Med.Med.HeavyHeavyHeavyHeavyHeavyHeavyHeavyHeavyHeavy
Extent ofDamage
1 F, 21 & 21 & 23 & 43 X 43 & 45 - 95 - 95 - 91 & 21 & 21 & 23 & 43 & 43 & 45 - 95 - 95 - 91 Fi 21 8 21 & 23 & 43 h 43 & 45 - 95 - 95 - 9
HeadRestraint
IntegralAdj us t .
NoneIntegralAdj u s t .None
IntegralAdj us t .
NoneIntegralAdjust.
NoneIntegralAdjust .
NoneIntegralAdjust.None
IntegralAdj ust .
NoneIntegralAdjust.
NoneIntegralAdj us t .
None
OAIS >_
Yes
88884445242083173
76184708445392935
230
2217513
12932123721
1 Injury
No
61793084182066310
180100621029241421
011440012715
15510105320
PercentInjured
59.152.759.534.957.150.055.735.4
100.029.764.853.089.460.861,967.462.5
100.020.835.637.146.445.476.254.541.151.2
*Towed Case Vehicles Only
3-22
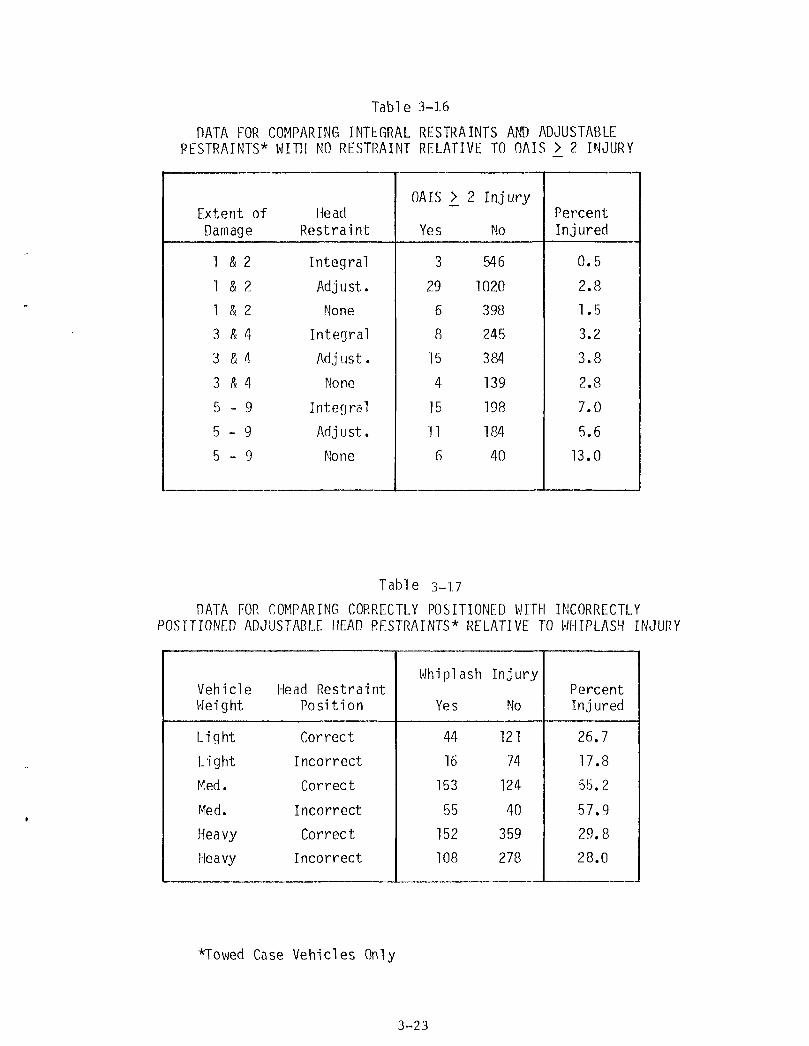
Table 3-16
DATA FOR COMPARING INTEGRAL RESTRAINTS AND ADJUSTABLERESTRAINTS* WITH NO RESTRAINT RELATIVE TO OAIS > 2 INJURY
Extent ofDamage
1 &
1 &
1 &
3 &
3 &
3 &
5 -
5 _
2
2
2
4
4
4
9
9
9
HeadRestraint
Integral
Adjust.
None
Integral
Adjust.
None
Integral
Adjust.
None
OAIS >_
Yes
3
29
6
8
15
4
15
11
6
2 Injury
Mo
546
1020
398
245
384
139
198
184
40
PercentInjured
0.5
2.8
1.5
3.2
3.8
2.8
7.0
5.6
13.0
Table 3-17
DATA FOR COMPARING CORRECTLY POSITIONED WITH INCORRECTLYPOSITIONED ADJUSTABLE HEAD RESTRAINTS* RELATIVE TO WHIPLASH INJURY
VehicleWeight
Light
Light
Med.
Med.
Heavy
Heavy
Head RestraintPosition
Correct
Incorrect
Correct
Incorrect
Correct
Incorrect
Whiplash
Yes
44
16
153
55
152
108
Injury
No
121
74
124
40
359
278
PercentInjured
26.7
17.8
55.2
57.9
29.8
28.0
*Towed Case Vehicles Only
3-23

Table 3-18
DATA FOR COMPARING CORRECTLY POSITIONED WITH INCORRECTLYPOSITIONED ADJUSTABLE RESTRAINTS RELATIVE TO OAIS > 1 INJURY
VehicleWeight
Light
Light
Med.
Med.
Heavy
Heavy
Head RestraintPosition
Correct
Incorrect
Correct
Incorrect
Correct
Incorrect
OAIS >_
Yes
88
40
182
63
217
133
1 Injury
No
77
50
115
31
302
253
PercentInj ured
53.3
44.4
61.3
67.0
41.8
34.5
Table 3-19
DATA FOR COMPARING CORRECTLY POSITIONED WITH INCORRECTLYPOSITIONED ADJUSTABLE RESTRAINTS RELATIVE TO OAIS > 2 INJURY
Extent ofDamage
K 0 O
1 a c1 & 2
3 & 4
3 8 4
5 - 9
5 - 9
Head RestraintPosition
Correct
Incorrect
Correct
Incorrect
Correct
Incorrect
OAIS >_
Yes
24
5
11
4
4
7
2 Injury
No
582
363
222
137
113
58
PercentInjured
4.0
1.4
4.7
2.8
3.4
10.8
3-24

5
P N = ^ CN- 6- a n d
5PN-PR = I C N _ R ^ , where
j = l
the Cjg-: and CM_^J are sums of the w^'s. The vector, Q =
* PN
can be estimated by the GENCAT program along with its covariance matrix VQ«
These, in term can be further analyzed to give
E* = f3(f2(f1(Q))) =• exp. (A log Q ) ,
where A is the one-rowed matrix (-1, 1). The quantity E* is computed in
three steps corresponding to the three transformations. At each step a
covariance matrix is also computed of the form,
Vf =I HV'Hl1,
rdf "1
where H is the matrix r^T* > V* is the estimated covariance matrix from the
preceding step, and q* is an element from the transformed vector Q. Finally,
the effectiveness estimate is given by
E = 100 E*
and its standard deviation by
SDE = 100
where N and N are, respectively,
Nw VN,uw*11/2
the numbers of weighted and
unweighted cases upon which the analysis was based.
Details of the model fit to the data of Tables 3-10 to 3-19 are given in
the Appendix. Results are shown in Tables 3-20 and 3-21. Since no significant
differences in injury rates were found between correctly and incorrectly
positioned adjustable restraints, no separate effectiveness estimates were
made.
From Table 3-20 it is seen that most of the effectiveness estimates are
positive indicating that occupants having head restraints were found generally
to have lower injury rates than occupants not having head restraints. It was
only for the comparison of integral restraints with no restraint that the
results were*statistically significant at a five percent level.
3-25

3.6 Injuries Caused by Head Restraints
Injuries to rear seat occupants resulting from striking the head restraint
system were also examined. Table 3-22 shows the number of such injuries as a
function of age and sex of the occupant and extent of damage to the vehicle.
Each cell of this table gives a frequency count (unweighted), the average AIS
score of the head restraint caused injuries and the average AIS score of similar
(age, sex, extent) occupants who were injured in cars not equipped with head
restraints. In general, the head restraint caused injuries seem to be no more
severe than the injuries occurring when head restraints were' not present.
Moreover, using weighted counts the 32 head restraint caused injuries made up
only about 1.5 percent of the 2123 injuries suffered by rear seat occupants in
cars equipped with head restraints, and occurred to only 0.5% of the 6461
exposed rear seat occupants involved in crashes (of all types). Moreover, only
four of these injured occupants did not also receive injuries from other contact
sources. Thus, only four occupants were injured by contact with the head
restraints who, otherwise, might have been uninjured. By contrast, if the 6461
occupants had been seated in the front right and left hand positions in rear end
crashes, 1186 fewer injuries would have been expected had they been protected by
integral head restraints as opposed to no head restraints. It should be noted,
however, that the crashes in which the 6461 rear seat occupants were involved
were not pre-selected to be those for which a head restraint caused injury was
considered to be most likely. In any case it does not appear that head
restraints present much of a safety hazard to rear seat occupants.
3-26
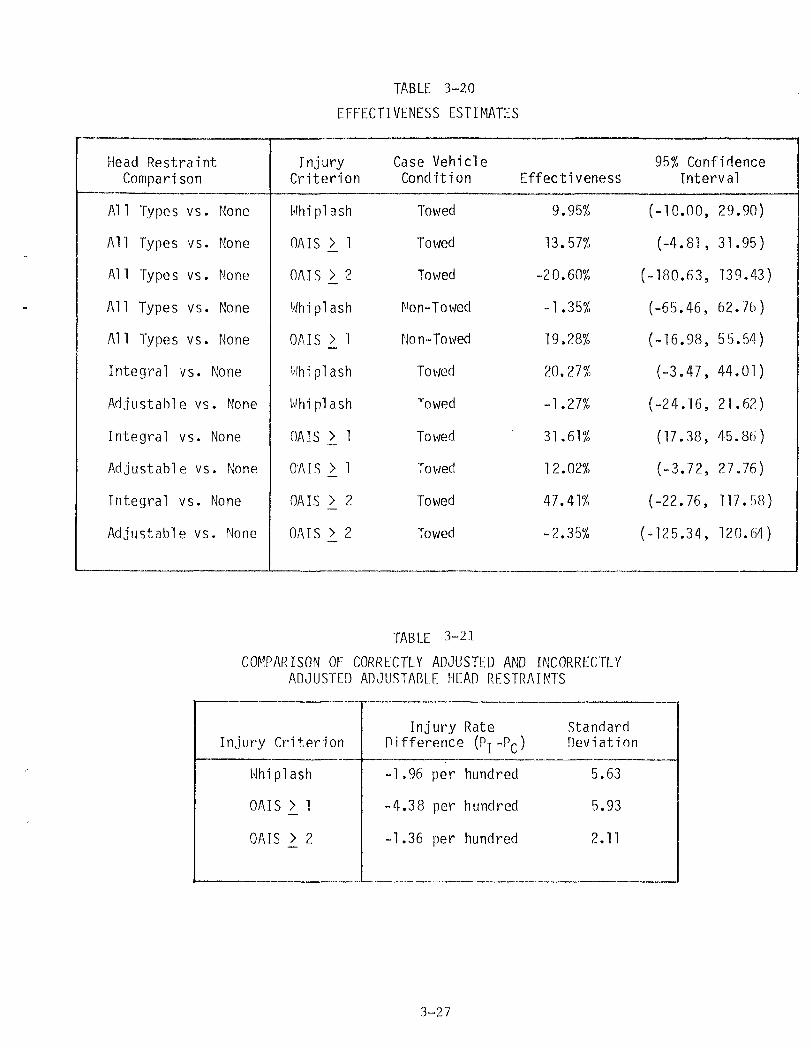
TABLE 3-20
EFFECTIVENESS ESTIMATES
Head RestraintComparison
A l l Types vs .
A l l Types vs.
Al 1 Types vs.
A l l Types vs.
Al1 Types vs.
Integral vs.
Adjustable vs
Integral vs.
Adjustable vs
Integral vs.
Adjustable vs
None
None
None
None
None
None
. None
None
. None
None
. None
InjuryCriterion
Whiplash
OAIS >_ 1
OAIS I 2
Whiplash
OAIS _> 1
Whiplash
Whi pi ash
OAIS >_ 1
OAIS _> 1
OAIS ^ 2
OAIS >_ 2
Case Vehic leCondi t ion
Towed
Towed
Towed
Non-Towed
No n~ To wed
Towed
Towed
To wed
Towed
Towed
Towed
Effectiveness
9.95%
13.57°/,
-20.60%
-1.35%
19.28%
20.27%
-1.27%
31.61%
12.02%
47.41%
-2.35%
95% ConfidenceInterval
(-10.00, 29.90)
( - 4 . 8 1 , 31.95)
(-180.63, 139.43)
(-65.46, 62.76)
(-16.98, 55.54)
(-3.47, 44.01)
(-24.16, 21.62)
(17.38, 45.86)
(-3.72, 27.76)
(-22.76, 117.58)
(-125.34, 120.64)
TABLE 3-21COMPARISON OF CORRECTLY ADJUSTED AND INCORRECTLY
ADJUSTED ADJUSTABLE HEAD RESTRAINTS
Injury Cri 1;erion
Whiplash
OAIS 2
OAIS 2
1
2
Di
-1
-4
-1
Injuryfference
.96
.38
.36
per
per
per
Rate0*1-pc>
hundred
hundred
hundred
StandardDeviation
5.63
5.93
2.11
3-27

Table 3-22
OCCUPANTS INJURED FROM CONTACT WITH HEAD RESTRAINTS
Sex
M
F
Age
O-1O
11-20
21-30
31-40
41-55
56 & Over
n-io
11-20
21-30
31-40
41-55
56 & Over
Extent of Damage
1 2 3 4 5 6
1 11.00 2.00
(1.00) (1.13)
4 4 11.00 2.00 3.00
(1.38) (1.28) (3.00)
1 11.00 2.00
(1.71) (2.00)
4 21.00 1.00
(1.00) (1.40)
71.71
(1-52)
41.00
(none)
1 11.00 1.00
(1.50) (2.33)
Cell entriesnumber of injured occupantsaverage AIS of head restraint injuries(average AIS of injuries when head restraints not present)
3-28

FIGURE A-l
MODEL FOR HEAD RESTRAINT EFFECTIVENESS BASED ONWHIPLASH INJURY FOR TOWED CASE VEHICLES
DriverAge
< 19< 19< 19< 19< 19< 19<• 1 9< 19
20-5420-5420-5420-5420-5420-5420-5420-54
55+55+55+55+55+55+55+55+
Popul
BeltUse
yesyesyesyesnonononoyesyesyesyesnonononoyesyesyesyesnononono
ations
DriverSex
MMFFMMFFMMFFMMFFMMFFMMFF
HeadRestraint
RMRNRNP.NRNRNRNRNRMRNRNRN
InjuryRates
.556
.500
.500
.500
.333
.093
.299
.064
.320
.976
.510
.988
.298
.440
.387
.350
.326
.976
.324
.976
.349
.029
.343
.225
PredictedIn j uryRates
.526
.526
.526
.526
.317
.059
.317
.059
.317
.854
.4831.000
.317
.371
.375
.428
.317
.976
.317
.976
.317
.059
.375
.116
111100000000000000000000
000011111111111111111111
Desi
000000000011000000000000
gn
000000000000001100000011
Matrix
000001010000000000000101
000000000101000000000000
000000000000010100000000
000000000000000001010000
.526(.181)
Model Coeff ic ients (and standard deviations)
h.317(.027)
P3
.166(.079)
.057(.041)
-.259(.041)
.536(.100)
P7
.053(.066)
.658(.125)
X2 due to error = 4.14 with 16 degrees of freedom
Effectiveness estimates: E = 9.95%
Standard deviation = 10.18
A-l

FIGURE A-2MODEL FOR COMPARING ALL HEAD RESTRAINTS WITH
NONE RELATIVF TO OAIS > 2 INJURY IN TOWED VFHICLES
Extentof Damage
1 « 2
1 & 2
3 8 4
3 4 4
5-9
5-9
HeadRestraint
R
MRNRN
InjuryRates
.0211
.0149
.0351
.0280
.0634
.1304
PredictedInjuryRates [
.0208
.0156
.0347
.0294
.0674
.0622
lesi
1
1
1
1
1
1
gn
0
0
1
1
0
0
Matrix
0
0
0
0
1
1
0
10
1
0
1
Model Coefficients (and standard deviations)
.0208 .0138 .0122 -.0052(.0079) (.0161) (.0276) (.0143)
X2 due to error = 0.397 with 2 degrees of freedom
Effectiveness estimate E = -20.60%S.D. = 81.65
A-2
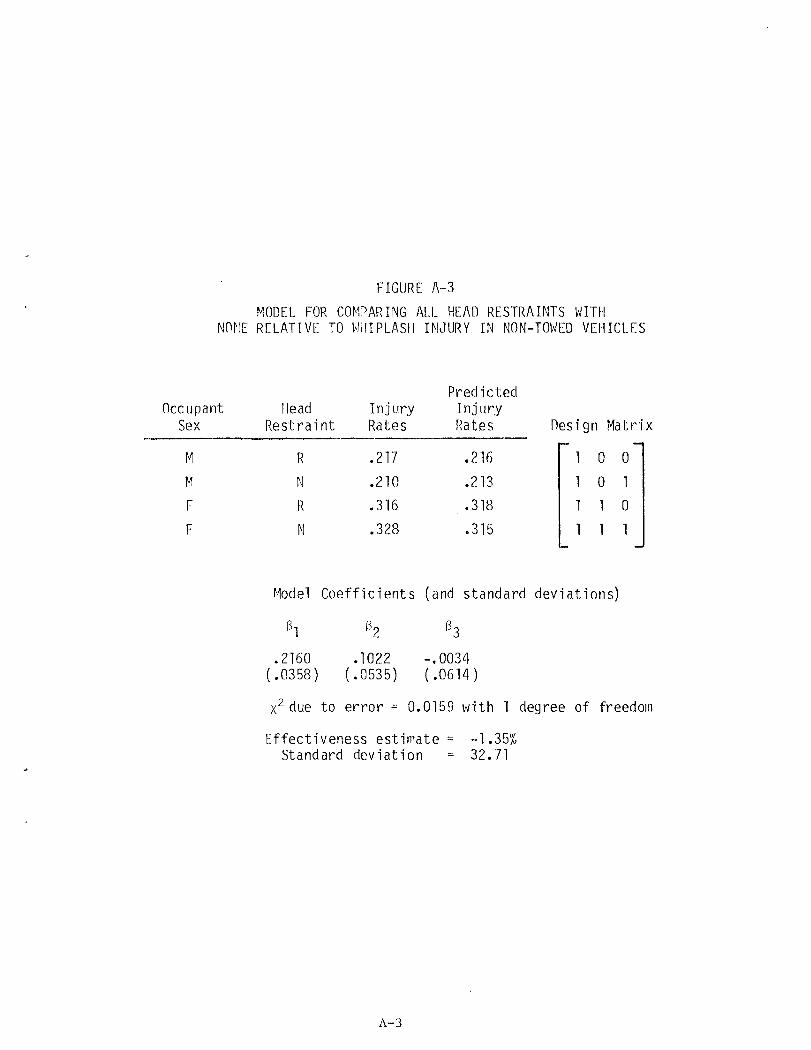
FIGURE A-3
MODEL FOR COMPARING ALL HEAD RESTRAINTS WITHNONE RELATIVE TO WHIPLASH INJURY IN NON-TOWED VEHICLES
OccupantSex
MMFF
HeadRestraint
RNRM
InjuryRates
.217
.210
.316
.328
PredictedInjuryRates
.216
.213
.318
.315
Uesi
11
1
1
gn
0
0
1
1
Matr
0
1
0
1
X
Model Coefficients (and standard deviations)
B1 32 33
.2160 .1022 -.0034(.0358) (.0535) (.0614)
x2 due to error = 0.0159 with 1 degree of freedom
Effectiveness estimate = -1.35%Standard deviation = 32.71
A-3

FIGURE A-4
MODEL FOR COMPARING ALL HEAD RESTRAINTS WITHNONE RELATIVE TO OAIS > 1 INJURY IN NON-TOWED VEHICLES
OccupantSex
M
M
F
F
HeadRes t ra in t
R
N
R
H
I n j uryRates
.144
.252
.348
.241
PredictedInjuryRates
.155
.209
.324
.378
Desi
1
1
1
1
gn
0
0
1
1
Matrix
0
1
0
1
Model Coefficients (and standard deviations)
.1550 .1692 -.0537(.0310) (.0516) (.0609)
x2 due to error = 2.335 with 1 degree of freedom
Effectiveness estimate = 19.28%Standard deviation = 18.50
A-4

FIGURE A-5
MODELS FOR EFFECTIVE ESTIMATES OF INTEGRAL AND ADJUSTABLE HEADRESTRAINTS RELATIVE TO NO HEAD RESTRAINT FOR WHIPLASH INJURY
VehicleWeight
lightlightlightlightlightlightmediummediummed i urnmediummed iurnmed i urnheavyheavyheavyheavyheavyheavy
BeltUse
yesyesyesnononoyesyesyesnononoyesyesyesnonono
HeadRestraint
integraladjust.none
integraladjust.none
integraladjust.none
integraladjust.none
integraladjust.none
integraladjust.none
InjuryRates
.567
.077
.500
.404
.278
.421
.313
.803
.999
.325
.527
.271
.386
.365
.999
.186
.289
.195
PredictedInjuryRates
.553
.077
.444
.407
.269
.444
.327
.824
.999
.329
.525
.220
.327
.365
.999
.183
.289
.220
111111000000000000
000000111000111000
000000000111000111
Design
100000000100000000
000100000000000100
Matrix
000000100000100000
000010010000000000
010000000000000000
000000000010000000
000000000000010000
000000000000000010
pl
.444(.061)
.305(.075)
Model Coefficients (and standard deviations)
.999(.016)
B10
-.633(.102)
.220(.041)
.069(.054)
.109(.072)
-.037(.063)
-.672(.079)
-.175(.072)
P8
-.367(.104)
x2 due to error - .934 with 7 degrees of freedom
Effectiveness estimates: E-j. = 20.27%
SD = 12.11
E A = -1.27%
SD = 11.68
A-5
FIGURE A-6
MODEL FOR COMPARING INTEGRAL RESTRAINTS AND ADJUSTABLE RESTRAINTSWITH NO RESTRAINT RELATIVE TO OAIS > 1 INJURY (TOWED VEHICLES)
VehicleWeight
l ightl ightl ightl ightl igh tl ightl ightl ightl igh tmediummediummed i urnmediummed i urnmed iurnmed i urnmed iurnmediumheavyheavyheavyheavyheavyheavyheavyheavyheavy
Extent ofDamage
1 & 21 & 21 & 23 & 43 & 43 & 45 - 95 - 95 - 91 & 21 & 21 & 23 & 43 & 43 & 45 - 95 - 95 - 91 & 21 & 21 & 23 & 43 & 43 & 45 - 95 - 95 - 9
RestraintUse
integraladjust.none
integraladjust.none
integraladjust.none
integraladjust.none
integraladjust.none
integraladjust.none
integraladjust.none
integraladjust.none
integraladjust.none
In juryRates
.591
.527
.595
.349
.571
.500
.557
.3541.000
.297
.648
.530
.894
.608
.619
.674
.6251.000
.208
.356
.371
.464
.454
.762
.545
.411
.512
PredictedIn juryRates
.585
.488
.562
.298
.639
.562
.672
.354
.935
.298
.639
.562
.894
.629
.703
.672
.676
.935
.163
.353
.427
.439
.444
.703
.585
.488
.562
111111000111000000000000111
000000000000111000000111000
000000111000000111000000000
Design
000000000000000000111000000
100000000000000000000000100
Matrix
000100100100000100100100000
000000000000100000000000000
010000000000010000010000010
000010000010000000000000000
000000000000000010000010000
000000010000000000000000000
Model Coefficients (and standard deviations)
.562(.051)
Bg
.077(.078)
.703(.074)
-.259(.087)
.935(.053)
-.581(.168)
.427(.055)
.023(.101)
-.263(.055)
.191(.103)
-.074(.057)
x2 due to error = 5.399 with 16 degrees of freedom
Effectiveness estimates and standard deviations
E T ^ — i = 31.61% ^Adjusted = 12-02%
S.D. = 8.03
Integral "
S.D. = 7.27
A-6
FIGURE A-7
MODEL FOR COMPARING INTEGRAL RESTRAINTS AND ADJUSTABLERESTRAINTS WITH NO RESTRAINT RELATIVE TO OAIS > 2 INJURY
Extentof Damage
1
1
1
3
3
3
5
5
5
& 2
& 2
& 2
& 4
f, 4
& 4
- 9
- 9
- 9
RestraintType
Integral
Adjust.
None
Integral
Ad j ust.
None
Integral
Adjust.
None
InjuryRate
.005
.028
.015
.032
.038
.028
.070
.056
.130
PredictedInjuryRate
.006
.026
.014
.023
.043
.031
.063
.063
.130
1
1
1
0
0
0
0
0
0
Desi
0
0
0
1110
0
0
gn
0
0
0
0
0
0
1
1
1
Matrix
10
0
10
0
0
0
0
0
1
0
0
10
0
0
0
0
0
0
0
0
0
1
1
0
Model Coefficients (and standard deviations)
3i h h e4 35.014 .031 .130 - . 0 0 8 .012
( . 0 1 4 ) ( . 0 1 8 ) ( . 1 1 5 ) ( . 0 1 4 ) ( . 0 1 6 )-.067(.117)
x due to error = 0.278 with 3 degrees of freedom
Effectiveness estimate
integral = 47-41% ^Adjusted = -2.35%
S.D. = 35.80 S.D. = 62.75
A-7
FIGURE A-8MODEL FOR COMPARING CORRECTLY POSITIONED WITH INCORRECTLY POSITIONED
ADJUSTABLE HEAD RESTRAINTS REALTIVE TO WHIPLASH INJURY
VehicleWeight
Light
Light
Medium
Med i urn
Heavy
Heavy
HeadRestraintPosition
Correct
Incorrect
Correct
Incorrect
Correct
Incorrect
InjuryRates
.267
.178
.552
.579
.298
.280
PredictedInjuryRates t
.290
.255
.552
.579
.290
.255
)esi
1
1
0
0
1
1
gn
0
0
110
0
Matr
0
1
0
0
0
1
ix
0
0
0
1
0
0
Model Coefficients (and standard deviations)
.290(.039)
h.552(.069)
-.035(.060)
.027(.135)
X2 due to error - 1.035 with 2 degrees of freedom
Injury rate difference (Pr-PQ ) = -1.96 per hundredStandard deviation = 5.63
A~8
FIGURE A-9
MODEL FOR COMPARING CORRECTLY POSITIONED WITH INCORRECTLY POSITIONEDADJUSTABLE RESTRAINTS RELATIVE TO OALS > 1 INJURY
VehicleWeight
Light
Light
Med i urn
Medium
Heavy
Heavy
HeadRestraintPosition
Correct
Incorrect
Correct
Incorrect
Correct
Incorrect
InjuryRate
.533
.444
.613
.670
.418
.345
PredictedInjuryRate
.577
.487
.577
.670
.425
.335
Desi
1
1
1
1
0
0
gn
0
0
0
0
11
Matrix
0
1
0
0
0
1
0
0
0
1
0
1
Model Coefficients (and standard deviations)
.577(.048)
.425(.076)
-.090(.064)
.093(.122)
X2 due to error = 0.720 with 2 degrees of freedom
Difference in Injury Rates (P, -P~) = -4.38 per hundred
Standard Deviation = 5.93
A-9
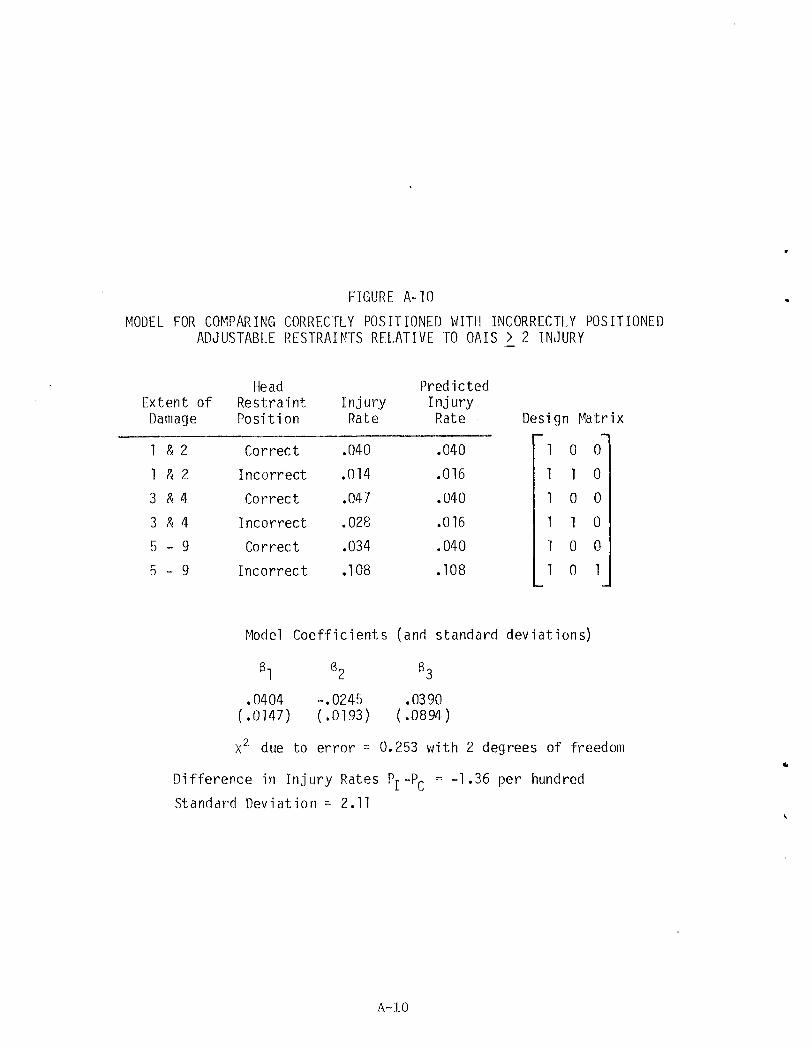
FIGURE A-10
MODEL FOR COMPARING CORRECTLY POSITIONED WITH INCORRECTLY POSITIONEDADJUSTABLE RESTRAINTS RELATIVE TO OAIS > 2 INJURY
Extent ofDamage
1 8 2
1 a 2
3 & 4
3 * 4
5 - 9
5 - 9
HeadRestraintPosition
Correct
Incorrect
Correct
Incorrect
Correct
Incorrect
InjuryRate
.040
.014
.047
.028
.034
.108
PredictedInjuryRate
.040
.016
.040
.016
.040
.108
Desi
111
1
1
1
gn
0
10
1
0
0
Matrix
0
0
0
0
0
1
Model Coeff ic ients (and standard deviations)
1 2 3
.0404 -.0245 .0390(.0147) (.0193) (.0894)
X2 due to error = 0.253 with 2 degrees of freedom
Difference in In jury Rates Pj-PQ = -1.36 per hundred
Standard Deviation = 2.11
A-10