evaluation of the effectiveness of radar … detection-avoidance... · evaluation of the...
TRANSCRIPT

EVALUATION OF THE EFFECTIVENESS OF RADAR OBSTACLE DETECTION
SYSTEMS WHEN USED ON INDUSTRIAL LIFT TRUCKS
By
Oluwatosin Toluwalase Odetola
A Thesis Submitted to the Faculty of Mississippi State University
in Partial Fulfillment of the Requirements for the Degree of Master of Science
in Mechanical Engineering in the Department of Mechanical Engineering
Mississippi State, Mississippi
December 2002

EVALUATION OF THE EFFECTIVENESS OF RADAR OBSTACLE DETECTION
SYSTEMS WHEN USED ON INDUSTRIAL LIFT TRUCKS
By
Oluwatosin Toluwalase Odetola
Approved: Elborn W. Jones Rogelio Luck Professor of Mechanical Engineering Associate Professor of Mechanical Engineering (Major Professor) (Graduate Coordinator) John T. Berry Rogelio Luck Professor of Mechanical Engineering Associate Professor of Mechanical Engineering (Committee Member) (Committee Member)
A. Wayne Bennett Dean of Engineering

Name: Oluwatosin Toluwalase Odetola
Date of Degree: December 13, 2002
Institution: Mississippi State University
Major Field: Mechanical Engineering
Major Professor: Dr. Elborn W. Jones
Title of Study: EVALUATION OF THE EFFECTIVENESS OF RADAR OBSTACLE DETECTION SYSTEMS WHEN USED ON INDUSTRIAL LIFT TRUCKS
Pages in Study: 80
Candidate for Degree of Master of Science
This study addresses the application and the effectiveness of radar obstacle sensors for
forklift trucks during reverse travel. Two different discriminating radar obstacle sensors with
different outputs are evaluated. This study reviews the safety of human exposure to emissions
from these radar sensors; documents the field of view obtained from experiments with the two
systems; gives the results from experiments with sensors on lift trucks. The influence of obstacle
reflectivity, composition and area on the size and shape of the radar detection zone are discussed.
An experimental setup for measuring position and velocity of the obstacle crossing the truck path
is described. The combination of obstacle sensors required for full coverage of the back of the lift
trucks and the mounting height and angle are discussed.

-ii-
DEDICATION
I would like to dedicate this research to my mother Mrs. Abosede Folusho Olarewaju and
Dr. (Mrs.) Adebimpe Odetola whose sacrifices I appreciate. Also to my husband Olumide
Folorunsho Odetola and my son Boluwatife Joshua Odetola who mean so much to me and gave
me all the support I required to complete this study.
-iii-
ACKNOWLEDGEMENTS
I give praise to my Father and my God Almighty for His presence, strength and the
endurance to perform this research.
I would like to express my sincere gratitude to my mentor Dr. Elborn Jones for his
inspiration, support and guidance during the course of this research. I would like to thank my
committee members Dr. J. T. Berry, Dr. Rogelio Luck for their instructions, guidance and their
support during my graduate studies. I thank Dr. George A. Adebiyi for his fatherly support and
my Aunty, Mrs Adebiyi, for her motherly support and care. I express my sincere appreciation to
Dr. Glenn Steele and Dr. William Person for their support. I thank Ms. Anne Dawson and Ms. Liz
Rook. I thank Luke Nason for his technical assistance.
I sincerely thank Dr. (Mrs.) Adebimpe Odetola, Olajumoke Odetola, Mrs. Abosede
Olarewaju, Tope Abodunrin, Tayo Okoro, Todimu Olarewaju, and my cousins, the Adebiyis for
their assistance during the course of obtaining my Master’s Degree.
I would like to express my gratitude to Taylor Machine Works in Louisville for the
funding of this research. I thank Lenn Wall, Matt Hillyer and Mike Boyles for their direction and
interest in this project. I thank John Fadgen of Preco Electronics and Hugh Bishop of Sense
Technologies for their donation of test equipment and their technical assistance.
Finally, I express my heartfelt appreciation to my husband, Olumide Odetola, and my
son, Boluwatife Joshua Odetola, for their love, care and support.
Thank you all.

-iv-
TABLE OF CONTENTS
Page DEDICATION .............................................................................................................. ii
ACKNOWLEDGEMENTS ............................................................................................ iii LIST OF TABLES ......................................................................................................... vii LIST OF FIGURES ....................................................................................................... viii CHAPTER
I. INTRODUCTION .......................................................................................... 1
Background..................................................................................................... 1 Research Objective.......................................................................................... 1
Problems with Backup Alarms.......................................................................... 2 Radar Systems ................................................................................................ 3 Principle of Operation ...................................................................................... 3 Description of sensors...................................................................................... 5
The Preview Obstacle Sensor.................................................................. 5 The Guardian Alert Obstacle Sensor ........................................................ 6
Settings of the Obstacles Sensors...................................................................... 7 Settings of the Preview Obstacle Sensor .................................................. 7 Settings of the Guardian Alert Obstacle Sensor ......................................... 8
Literature Review............................................................................................ 9 Thesis Overview.............................................................................................. 12
II. RADIATION LEVELS OF OBSTACLE SENSORS........................................ 13
Introduction ..................................................................................................... 13 Standards Governing Human Exposure to RF Emissions ..................................... 13 Evaluation of Obstacle Sensors......................................................................... 18
Safety Evaluation of the Preview Obstacle Sensor .................................... 19 Safety Evaluation of the Guardian Alert Obstacle Sensor........................... 19
III. DISTANCE TO OBSTACLE, STOPPING DISTANCE, VELOCITY
RELATIONSHIPS................................................................................. 20 Introduction ..................................................................................................... 20 The Total Stopping Distance............................................................................. 20
Response Time ....................................................................................... 24

-v-
CHAPTER Page
Perception Time ..................................................................................... 25 Reaction Time ........................................................................................ 26 Braking Distance .................................................................................... 27
Effect of Speed on Stopping Distance ............................................................... 28
IV. DESIGN OF TEST APPARATUS AND DATA COLLECTION SYSTEM...... 30
Introduction ..................................................................................................... 30 Design of Apparatus ........................................................................................ 30 Computer Controlled Test................................................................................. 32
Obstacle Drive ....................................................................................... 33 Data Collection System........................................................................... 36
V. EXPERIMENTAL PROPCEDURE FOR PERFORMANCE TESTING OF
OBSTACLE SENSORS ............................................................................ 38 Introduction ..................................................................................................... 38 Manual Measurements of the Field of View of Sensors...................................... 39
Horizontal Detection Range of Sensors .................................................... 39 Vertical Detection Range of Sensors........................................................ 40
Automated Measurements of the Field of View of Sensors................................. 41 Location of Sensor on Truck for Tests .............................................................. 41
Location of the Preview on the Forklift Trucks ......................................... 42 Location of the Guardian Alert on the Forklift Trucks ................................ 42
Tests of Obstacle Sensors on Actual Lift Trucks ............................................... 42
VI. EXPERIMENTAL RESULTS ......................................................................... 46
Results Obtained from the Manual Tests ........................................................... 46 Horizontal Detection Range Results for the Preview Obstacle Sensor ........ 46 Vertical Detection Range Results for the Preview Obstacle Sensor ........... 54 Horizontal Detection Range Results for the Guardian Alert Obstacle Sensor .............................................................. 59 Vertical Detection Range Results for the Guardian Alert Obstacle Sensor....................................................................... 62
Results Obtained from the Data Acquisition System........................................... 63 Other Tests for Performance of Sensors ........................................................... 65
VII. CONCLUSONS AND RECOMMENDATIONS .......................................... 68
The Influence of Sensor Position on Detection Range ..................................... 68 Stopping Distances........................................................................................ 73 The Influence of Composition, Size and Orientation on Detection Range........... 73 Environmental Effects on Obstacle Sensors.................................................... 74 Design and Settings of Obstacle Sensors ........................................................ 74 Durability of Obstacle Sensors....................................................................... 74 Closure ........................................................................................................ 75

-vi-
Page
REFERENCES .............................................................................................................. 77 APPENDIX................................................................................................................... 79

-vii-
LIST OF TABLES
TABLES Page
2.1 Estimated distances to RF power density limit ................................................. 14
2.2 FCC MPE limit for controlled occupational exposure....................................... 16
2.3 FCC MPE limit for general population uncontrolled exposure ........................... 16
2.4 FCC technical standard given in field strength................................................. 17
2.5 IEEE MPE for controlled environments.......................................................... 17
2.6 IEEE MPE for uncontrolled environments ...................................................... 18
3.1 The coefficient of traction for different roadway surfaces ............................... 28
6.1 Preview sensor and display settings for rectangular pattern experiment ....................................................................... 47
6.2 Preview sensor and display parameters for cone pattern experiment ....................................................................... 48
6.3 Preview sensor and display parameters for side pattern
experiment with a 5'6" tall, 160 lbs female........................................ 49
6.4 Vertical detection range number of LEDs activated for the preview sensor for a cone pattern at positions shown in figure 6.12................................................... 58
6.5 Guardian sensor parameters for partial velocity discrimination.......................... 60 6.6 Guardian sensor parameters for no velocity discrimination ............................... 61
6.7 The response of the guardian alert to base vibrations ...................................... 67

-viii-
LIST OF FIGURES
FIGURE Page 1.1 Transmitted signal from radar system with wavelength, λ ...................................... 4
1.2 Reflected signal from target leading to a change in signal parameters: λ > λl.......................................................................................... 5
3.1 Forces acting on a vehicle moving downhill .......................................................... 22 3.2 Stopping distance increases with sensor response time .......................................... 25 3.3 Stopping distance increases with perception time .................................................. 26 3.4 Stopping distance increases with reaction time...................................................... 27 3.5 Stopping distance increases with initial speed values ............................................. 29 4.1 The mounting of the Preview sensor .................................................................... 31 4.2 The mounting of the Guardian Alert sensor ......................................................... 32
4.3 The side view of test apparatus; obstacle position drive ......................................... 34 4.4 Trolley system with sensor position ...................................................................... 35
4.5 The Wiring diagram of the Preview and the connections of the data system...................................................................................... 37
4.6 The Wiring diagram of the Guardian Alert and the connections of the data system...................................................................................... 37
5.1 Figure showing the top view of the forklift truck and the horizontal
detection range of a radar sensor ................................................................. 40 5.2 Figure showing the side view of the forklift truck and the vertical
detection range of a radar sensor ................................................................. 41 5.3 The Position of three Preview sensors on TC 300S forklift. One is on the truck centerline and the other two sensors are located at 0.15 m ahead of the center sensor, 0.43 m from the truck centerline and rotated at 600 clockwise and counterclockwise respectively The sensors are located with centers 0.33 m above the ground and tilted upward 90. .......................... 44

-ix-
FIGURE Page 5.4 The Position of the Guardian Alert on TC 300S forklift is located 1.15 m above the ground................................................................. 45
6.1 Comparison of the horizontal detection range of a rectangular
pattern of a female 5'6" and a male 5'7" test bodies for Preview................... 47 6.2 Comparison of the horizontal detection range of a cone
pattern of a female 5'6" and a male 5'7" test bodies ..................................... 48
6.3 Comparison of the horizontal detection range of a rectangular, cone
and side detection patterns for Preview ..................................................... 50 6.4 Plywood cut into the shape of the upper torso of the human being......................... 51
6.5 Comparison of the horizontal detection range of a cone detection pattern for a human obstacle and a plywood obstacle as detected by the Last zone only (i.e. the other four LEDs were ON continually) for Preview ........................................................................................... 51
6.6 The horizontal detection range of a rectangular pattern of a male 5'10" tall test body
based on observations of blinking LEDs as occurring at the fringe of the detection zone and stable as occurring inside the detection zone for Preview...................................................................... 52
6.7 The horizontal detection range of a cone pattern of a female 5'6" tall test body based on observations of blinking LEDs as occurring at the fringe of the detection zone and stable as occurring inside the detection zone for Preview..................................................................... 53
6.8 The horizontal detection range of a side pattern of a female 5'6" tall test body based on observations of blinking LEDs as occurring at the fringe of the detection zone and stable as occurring inside the detection zone for Preview..................................................................... 54
6.9 The vertical detection range of a Preview sensor for a rectangular
pattern with a male 5'10" tall test body..................................................... 55
6.10 The vertical detection range of a Preview sensor for a cone pattern with a female 5'6" tall test body ................................................... 56
6.11 The vertical detection range of a Preview sensor for a rectangular pattern 5'10"
tall test with a male body based on observations of blinking LEDs as the occurring at fringe of the detection zone and stable as occurring inside the detection zone .................................................................................. 57

-x-
FIGURE Page
6.12 The vertical detection range of a Preview sensor for a cone pattern with a
female 5'6" tall test body based on observations of blinking LEDs as occurring at the fringe of the detection zone and stable as occurring inside the detection zone. The Initial Detection zone is the location of the first response ........................................................... 58
6.13 The vertical detection range of a Preview sensor for a cone pattern with a
female 5'6" tall test body as detected by the Last zone only (i.e. the other four LEDs were ON continually) ........................................ 59
6.14 The horizontal detection range of the Guardian Alert sensor with
partial velocity discrimination ................................................................. 60 6.15 The horizontal detection range of the Guardian Alert sensor with
no velocity discrimination........................................................................ 62 6.16 The vertical detection range of the Guardian Alert sensor with
no velocity discrimination........................................................................ 63
6.17 The response of the LEDs of the Preview sensor on a test stand at a distance 2 m away from the sensor obtained from the data acquisition system............................................................................. 64 6.18 The response of the LEDs of the Guardian Alert sensor (with no velocity discrimination) on the test stand at a distance 0.5 m away from the sensor obtained from the data acquisition system............................................................. 64 6.19 Comparison of the horizontal detection range for the Guardian Alert sensor with not velocity discrimination for tests in a corrugated iron sheet building and a gymnasium .............................................................. 67 7.1 The Preview obstacle sensor with conical field of view
mounted on top of the counterweight of truck TC-300S........................................................................................ 71
7.2 The Guardian Alert obstacle sensor with rectangular
field of view mounted on top of the counterweight of truck TC-300S.............................................................. 72

-1-
CHAPTER I
INTRODUCTION
Background
Forklift trucks are the first choice for moving materials in factories and yards due to their
versatility and the high density of people. Presently, 1% of factory accidents involve forklift
trucks and 10% of these accidents lead to physical injuries (James 1984). Accidents involving lift
trucks are usually blamed on operator errors but 25% of these accidents are usually caused by
controllable environmental factors (Miller 1998). The operation of lift trucks therefore requires
extra diligence during reverse travel because the stabilizing counterweight hampers the view and
the operator must turn his or her head backward to get a better view.
The use of obstacle sensors on forklift trucks is relatively new. Girardi reviews the
limitations of ultrasonic sensors for industrial lift truck applications in his paper SAE 96809
(Girardi, 1996). some of these limitations will apply to radar and optical sensors as well. The
SAE standard “Discriminating Back-Up Alarm System Standard” required that these systems
detect obstacles 100% of the time with not more than 10% inadvertent detection for them to be
considered reliable (SAE J1741 June 1999).
Research Objective
The objective of this research is to evaluate two obstacle sensors, which operate on different
principles, for application on industrial lift trucks. This evaluation includes: determining the field
of view (detection zone) of the sensors; investigating the effect of obstacle orientation and shape
on detectability; identifying any permanent blind spots; investigating the range in the size of

-2-
objects that can be detected; determining the influence of obstacle material on detectability;
determining the effect of rain and vibrations on the performance of sensors. The desirable
detection range suitable with the steering geometry of lift trucks will be analyzed.
The stopping distance required to prevent collision for two different lift trucks at different
speeds of travel will be estimated. This is necessary to allow enough distance between the truck
and obstacle for the operator to prevent collision when the alarm sounds. Factors like operator
and system reaction time will be determined as well. The results obtained from this research will
be used to configure and mount obstacle sensors on industrial lift trucks. The occurrence of false
detection will be noted during the course of the experiments.
Problems with Backup Alarms
Problems that may be encountered in the use of backup alarms/object detection systems
include: habituation, filtering, ambient noise, dependency and fatigue. These factors will be
discussed briefly
Habituation may occur when the operator or pedestrians get used to hearing the alarm and
cease to recognize it as a warning signal. This may be addressed by reducing the frequency of
false alarms so each warning is taken seriously. The warning signal may either be in form of
sound or Light Emitting Diode (LED) display. The operator should always look over the field of
travel to ensure that it is safe to backup. Filtering may occur if people condition their senses to
respond only to warnings they consider important and ignore those that are less important. This is
very dangerous because no warning signal should be ignored. This problem may be addressed by
conducting safety drills often to see how people respond to warnings. Ambient noise is the noise
level of the operating environment. If the ambient noise is very high then it might overshadow the
sound of the warning. The obstacle sensors under study have warnings both in form of sound and
LED indicators. The allowable ambient noise level should be at least 10 dB lower than the sound
-3-
level of the alarm (SAE J994 August 1993). Dependency may occur when the operator gets
accustomed to people responding to the alarm and leaving the forklifts’ path of travel. The
operator might become less vigilant under these conditions and may reduce the effort to ensure
that the path of travel is clear. Habituation and filtering, mixed with dependency are a recipe for
disaster. Fatigue simply affects the operator’s response to a warning signal. Fatigue may lead to
an increase in the actual stopping distance due to an increase in the human perception time and
reaction time.
Radar Systems
Currently, there are several radar obstacle detection systems available for lift truck
application but only two of these radar detection were investigated. These two systems operate on
different principles and have different features described below.
Principle of Operation
The obstacle sensors use radio detection and ranging (RADAR) to extract information
about the target’s position. Radar systems transmit signals in form of electromagnetic waves from
the antenna. The signal travels from the source to the target where it is reflected back to the
receiver antenna. The difference in the parameters of the transmitted signal and the received
signal are then used to extract information about the target. Information that may be obtained
includes position, speed, height and size of target. The distance to the target is obtained from the
time lapse between the received and the transmitted signal. The size of target is directly
proportional to the power of the received signal. The relationship between these parameters used
for radar devices is given by equation 1-1.

-4-
2RKP
P TR = (1-1)
Where,
PR is the received power
PT is the transmitted power
R is the distance to the target
K is the constant of proportionality that depends on the antenna gain, cross-sectional area
of target and effective area of the antenna.
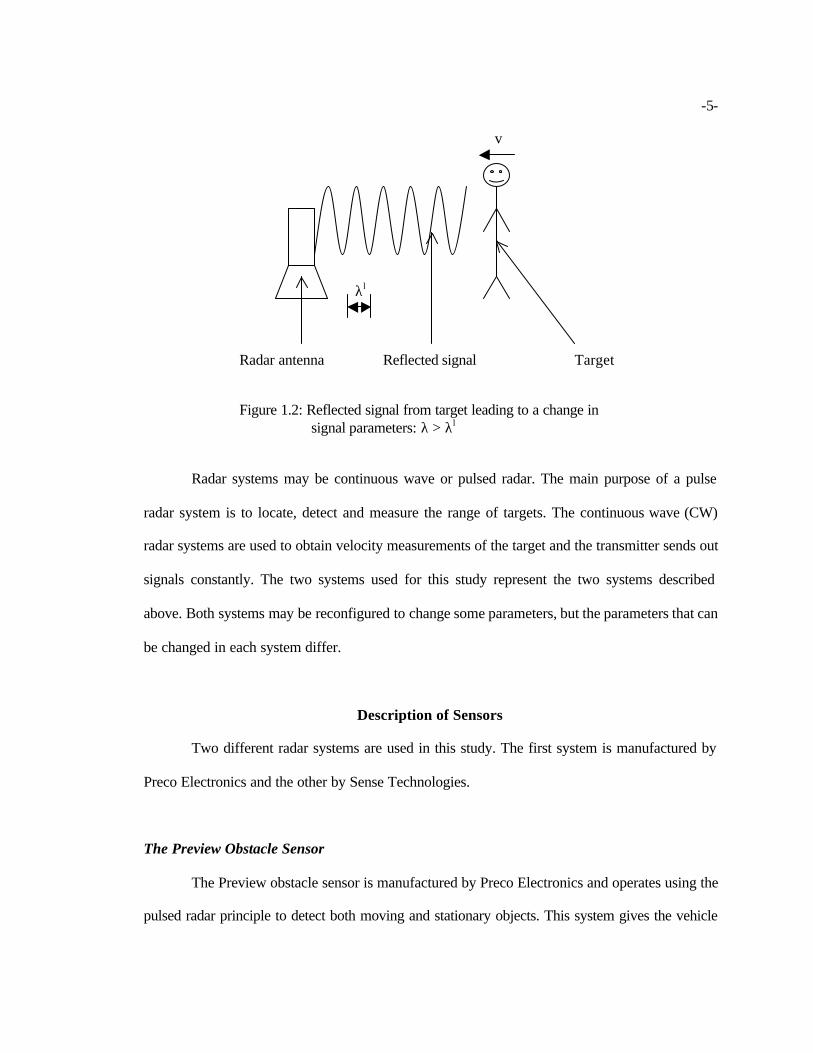
If the target approaches the antenna, the reflected signal increases in frequency. Conversely, the
reflected signal becomes expanded due to an increase in frequency as the target moves away from
the antenna. This is illustrated in Figures 1.1 and 1.2.
v
λ
Radar antenna Transmitted signal Target
Figure 1.1: Transmitted signal from radar system with wavelength, λ
-5-
v
λl
Radar antenna Reflected signal Target
Figure 1.2: Reflected signal from target leading to a change in
signal parameters: λ > λl
Radar systems may be continuous wave or pulsed radar. The main purpose of a pulse
radar system is to locate, detect and measure the range of targets. The continuous wave (CW)
radar systems are used to obtain velocity measurements of the target and the transmitter sends out
signals constantly. The two systems used for this study represent the two systems described
above. Both systems may be reconfigured to change some parameters, but the parameters that can
be changed in each system differ.
Description of Sensors
Two different radar systems are used in this study. The first system is manufactured by
Preco Electronics and the other by Sense Technologies.
The Preview Obstacle Sensor
The Preview obstacle sensor is manufactured by Preco Electronics and operates using the
pulsed radar principle to detect both moving and stationary objects. This system gives the vehicle

-6-
operator information about the distance to the closest object by visual indication of light emitting
diodes (LED) and an audible signal. This system consists of three major parts, a 5.8 GHz radar
sensor enclosed safely in a case, a display unit that may be mounted in the cab with the operator
and an external backup alarm. The operator display provides a row of 5 LEDs that indicate the
distance of the unit to the detected object. The number of LEDs illuminated depends on the
distance to the detected object. If the object is close, more LEDs will be illuminated. The distance
may be adjusted, but the maximum distance is 8 meters (26 feet). The system operates with a
minimum voltage of 9.8 volts and a maximum of 33.0 volts.
The Guardian Alert Obstacle Sensor
The Guardian Alert is manufactured by Sense Technologies and the system operates
using the Doppler radar principle. This system detects only when there is a relative movement
between the sensor and the obstacle. The information about the distance to the closest object
detected is given to the vehicle operator by visual indicators (LED) and an audible signal. This
system consists of three major parts, which include a 10.525 GHz radar sensor pulsed at a 12%
duty cycle. The sensor is a range-gated microwave Doppler radar enclosed safely in a case, a
display unit that may be mounted in the cab with the operator, and an external backup alarm. The
operator display provides a row of 3 LEDs that indicate the degree of danger for impact with the
detected object. The combination of LEDs illuminated depends on the distance to the detected
object. The distance may be adjusted, but the maximum distance is 35 feet. The Guardian Alert
comes with heavy-duty lights that may be used with the LED, only one of these display units may
be used at a time. The system operates with a voltage of 12 volts.

-7-
Settings of the Obstacle Sensors
The settings of an obstacle sensor are determined by how it is programmed, which is
briefly described below. The settings of the sensor will determine the beep rate of the alarm, the
detection range of the sensor, and the velocity of obstacles to be detected for the Doppler radar.
The settings will influence the occurrence of false alarms also.
Settings of the Preview Obstacle Sensor
The Preview obstacle sensor can be programmed by configuring the sensor to suit the end
user. Both the sensor and the display can be programmed. Some of the parameters that can be
programmed are the sensor ID, the sensor type, the range, the pattern and the sensor calibration.
The sensor ID is used to identify each sensor in a multi-sensor detection system. The
value of the ID can range from 1 – 254. The sensor ID is relayed to the Preview display, which
uses this number to determine the acceptance of data from the sensor. The sensor type indicates
the location of the sensor on the vehicle, and this information is also conveyed to the Preview
display. The sensor range defines the length of the detection zone. Standard settings for detection
range may be used or the sensor range may be customized. The pattern of the sensor defines the
shape of the Preview sensor detection zone and the program has a predefined set of shapes. The
predefined shapes are rectangular, cone and side patterns. The Preview enables the user to
customize the pattern by allowing the entry of a sequence of 52 values that control this variable.
The calibration of the Preview sensor serves as a means to get the sensor to overlook static
objects that are part of the vehicle on which the sensor is mounted.
The Preview display properties that may be configured include the display ID, display
type, maximum number of sensors, sensor IDs, LED mode and buzzer mode. The Preview
display ID is the parameter used to identify each display in a multi-display detection system. The
Preview display ID can range from 1 – 254. The display type indicates the location of the sensor
-8-
on the vehicle from which the Preview display will receive information. Preview sensors will
only receive data from displays that match the sensor type. In a multi-sensor detection system, the
Preview display must be programmed to know the number of sensors it will receive data from.
This number varies from 1 – 31 sensors. The in cab display can be configured to allow the
audible warning signal (buzzer) and the LEDs to operate in certain scenarios. The buzzer can be
turned OFF or allowed to operate while the vehicle is in reverse and the LEDs can operate in
reverse only or continuously.
Settings of the Guardian Alert Obstacle Sensor
The settings of the Guardian Alert can be changed to suit specific applications by
downloading programs furnished by the manufacturer. Programs are written by defining the
sensor parameters. Parameters that may be customized by programming the Guardian Alert
include: the number of ranges, the self test, Direction of Motion (DOM), Range (ft), Priority,
Velocity (mph), Turn off seconds, Turn off inches, Alarm color and Alarm duration.
The “number of ranges” can vary from 1 to 8 and dictates the number of independent
ranges that the user wants the sensor to detect obstacles. The “self test” can be turned either ON
or OFF. Switching the self test ON makes the display beep once when the operator switches to
the reverse gear to indicate that the sensor is functional. The DOM can either be turned ON or
OFF and it is functional when it is ON. The DOM sensor parameter enables the sensor to be more
discriminating about the obstacle detected. The sensor alerts the operator only if the distance
between the truck and obstacle(s) detected is decreasing. With good programming, this will help
decrease the occurrence of false alarms, i.e. alarms for situations which pose no danger.
The “Range” describes the radial distance from the sensor in which obstacles are
detected. The Range value can vary from 1 – 35 feet. The Range works together with the number
of ranges selected. Priority can vary from 1 – 10 with a default value of 5. The Priority parameter

-9-
defines how fast the sensor detects an obstacle within a range gate and overrides previous
decisions. Velocity is a very important sensor parameter for the Guardian Alert due to the fact
that a Doppler sensor requires motion to identify an obstacle. The velocity parameter can vary
from 0 –15 mph. The zero mph setting indicates that there is no velocity discrimination. The
“Turn off seconds” defines how long the alarm is active after the relative movement between
sensor and obstacle is detected. The “Turn off seconds” can be varied from 1 – 10 seconds. The
“Turn off inches” defines the distance of sensor away from the point of obstacle detection to the
obstacle, before the audible warning signal is stopped. The turn off inches can be varied from 1 –
24 inches if the DOM is ON.
The “Alarm color” describes the form of visual display, the LEDs. The LEDs may either
be red or yellow and different colors may be assigned to each range gate. Alarm “duration”
defines the beep and flash rate that the display applies to the alarms within each range gate as
programmed by the user. This parameter ranges from 0 – 9.
A good understanding of the settings of these obstacle sensors is required. The detection
range obtained from the sensors is determined by the settings of the sensors.
Literature Review
The Society of Automotive Engineers (SAE) has compiled a standard for testing
discriminating backup alarms systems (SAE J1741 June 1999). This standard describes the test
procedures for evaluating the performance of these detection devices. It also addresses the
minimum detection area behind any machine, the system false detection requirements, and the
audible and visual information presented to the operator. The standard also includes the operator
system function test and maintenance procedures.
Johnson, Guy A. et al (1986) conducted a series of tests on different obstacle sensors for
mining applications and reported the results in the United States Bureau of Mines Information
-10-
Circular 9079. The experiments were conducted with obstacle sensors with infrared, ultrasonic
and Doppler technologies to evaluate their performance on mining equipments in 1986. These
sensors were evaluated to see whether they were capable of detecting objects at the rear of mining
equipment. From these tests it was concluded that Doppler radar technology was the best of the
three different types of technologies. Doppler radar systems use the Doppler shift principle to
detect objects. The detection zone of Doppler radar systems have the shape of a tear drop. From
these experiments it was observed that the power output, sensitivity, reflectivity from obstacle,
the shape of the antenna and the radar profile determine the detection range. The detection zone
obtained for bigger, more reflective obstacles had a wider range. Some of the in-mine test
demonstrated that a system that detects a person at a distance of 20 feet would detect a small car
at 40 feet and a large metal building at several hundred feet. One advantage of Doppler radar
sensors is, that it is not affected by lighting, rain, fog, wind or snow like the other sensors per this
report.
Girardi, Walter J. (1996) performed experiments to analyze the limitations of ultrasonic
sensors on lift trucks. The tests were conducted to check the ability of the ultrasonic sensors to
eliminate false signals, eliminate habituation and reduce the amount of noise introduced into the
environment by warning signals from these alarms. The test results detected a rectangular wood
target (38 mm x 140 mm x 1219 mm), with the obstacle sensor mounted 1143 mm above the
ground. The detection zone obtained was a cone 4318 mm in height; 1118 mm in diameter and
vertex located 0.0348 mm from the face of the sensor. This conical shape limited the coverage
directly behind the lift truck because a person in the 95% percentile crouched behind the truck
would not be detected. The sensor detected objects 635 mm – 1753 mm above the floor
longitudinally placed along the centerline of the sensor. The ultrasonic sensor has the potential to
reduce the level of noise pollution created by the warning alarm. With centerline of the obstacle
sensor mounted laterally 102 mm and 699 mm above the ground. The sensor detected objects 140

-11-
mm – 1257 mm above the floor longitudinally placed along the centerline of the sensor. The
sensor centerline was located at 1143 mm above the floor and tilted 13.50 downward. At this
position the sensor detected objects ranging from 51 mm – 1143 mm above the above the floor,
located longitudinally along the centerline. Objects 1143 mm above the floor, not extending to the
floor surface were not detected until they were within 0.0348 mm from the face of the sensor.
Habituation problems remain the same and when the sensor was mounted too low the occurrence
of false signals increased due to the detection of objects which were not detected when sensor
was mounted at a higher position.
Ruff (2001) tested some collision warning systems including the Preview and the
Guardian Alert obstacle sensors and gave the results in the National Institute for Occupational
Safety and Health (NIOSH) Report of Investigations 9654. The test was performed on mining
equipment in a graded test area approximately 60m by 30m. The obstacles to be detected were a
three ton, four-wheel drive pickup truck and a man between 178 – 191 cm (70 – 75 inches) tall.
The first sensor was mounted at a height of 1.3 m. If this sensor was mounted less than 1.3 m
from the ground it would constantly detect the bed of the dump truck. The reliable detection zone
for this human target extended from the sensor out to 9.1 m when placed in the rear of the truck.
Some irregular detection was observed at the fringes of the detection zone. The reliable detection
zone for the pickup truck covered the width of the dump truck and extended from the sensor out
to 8.4m when placed in the rear of the truck. There were no false alarms when the truck was
moved forward in a clear field. The detection zone of a cinder block ranged from 4.6 – 9.1 m
away from the sensor. Lower mounting height caused this system to be more sensitive to object
that were lying low. The second obstacle sensor was mounted 2.7 m high and tilted downward at
100. This obstacle sensor generated an alarm when the truck’s gear was switched or when the
brakes were applied suddenly. The detection zone of a person walking toward the stationary
dump truck was 6.1 m from a distance close to the tires; the width of the zone was only 3 m. The

-12-
detection zone of a slowly driven pickup truck was 10.7 m from a distance close to the tires, the
width of the zone increased to 9.1 m. From this research it is observed that the mounting height
and angle, the size of obstacle, the technology behind the operation of the sensor, and the
composition and orientation of the obstacle will affect the detection zone of radar obstacle
sensors.
Thesis Overview
This thesis is simply based on obtaining the field of view of the obstacle sensors under
study and determining their reliability. Chapter II discuses the safety required for operation of the
obstacle sensors and how they conform to the safety standards for radar devices. Chapter III
discusses the stopping distance relative to the operation of the lift truck equipped with these
sensors. It also discusses the use of the knowledge obtained about stopping distance in the
configuration of the obstacle sensors. Chapter IV gives a description of the test for collecting data
manually and automatically. A description of the data collection system and the devices that
make up the data collection system is also given. Chapter V gives a description of the
experimental procedures for obtaining the field of view of the two sensors both manually and
automatically, and some procedures to mount the sensors on lift trucks to obtain the maximum
detection zone with minimum occurrence of false alarms. Chapter VI presents the results of the
field of view obtained from the manual experiments and automated experiments for both sensors.
Finally, Chapter VII gives the conclusions and recommendations of this study.

-13-
CHAPTER II
RADIATION LEVELS OF OBSTACLE SENSORS
Introduction
The obstacle sensors in this study use radio frequency (RF) waves to detect the presence
of objects within their range of coverage. One system uses Doppler radar, which requires relative
motion between target and sensor, while the other system uses pulsed radar, which will sense
objects in the field regardless of the relative velocity. The Institute of Electrical and Electronic
Engineers (IEEE) and The Federal Communications Commission (FCC) have published rules and
standards to ensure that radar devices are safe for human usage. This section presents the standard
requirements relative to the emission levels of these two systems.
Standards Governing Human Exposure to RF Emissions
Radar systems must conform to IEEE or FCC standards before their usage is allowed.
Each of these standards differs in the magnitude of the factor of safety. The guideline first
adopted by FCC was in 1985 to evaluate the human exposure to Radio frequency (RF) emissions.
The new guideline dated 1999 states the limits for Maximum Permissible Exposure (MPE) in
terms of electric and magnetic field strength and power density for transmitters operating at
frequencies between 300 kHz and 100 GHz.
Power density (W/m) is a measure of the power generated by a transmitter, while electric
field strength is the strength of the electric field created by the transmitter (V/m). The magnitude
of power transmitted varies with the distance from sensor as illustrated in Table 2.1. As the

-14-
transmitted power increases, the distance to the limit also increases for a constant frequency of
operation.
Table 2.1
ESTIMATED DISTANCES TO RF POWER DENSITY LIMIT Frequency of operation: 144 MHz Controlled limit: 1 mw/cm2 Uncontrolled limit: 0.2 mw/cm2
Transmitter power (watts)
Distance to controlled limit (meters)
Distance to uncontrolled limit (meters)
10 3.11 6.95 100 9.83 21.98 500 21.98 49.16
1500 38.08 85.14
The commonly used relationship between power and electric field strength is given by
equation 2-1. A more accurate relationship between power and electric field strength depends on
some additional factors. Free space impedance is 377 ohms.
3771204
22
2
Ep
EpDPG
== (2-1)
Where,
P is the transmitter power (watts)
G is the numerical gain of the transmitting antenna relative to an isotropic source
D is the distance from the electrical center of antenna to measuring point (meters)
E is the field strength (Volts/meter).

-15-
The new MPE limit includes some factor of safety. This limit is based on the
exposure criteria quantified in terms of specific absorption rate (SAR). The basis for the
limit is a whole-body averaged SAR threshold level of 4 watts per kilogram (4 W/kg), as
averaged over the entire mass of the body. Expert organizations have determined that
potentially hazardous exposure may occur at SAR greater than 4 W/kg.
One of these devices under study transmits and receives at a frequency of 5.8
GHz while the other transmits and receives at a frequency of 10.525 GHz. The safety of
these devices is obtained by comparing the power density of RF emission to the MPE as
required by the IEEE and FCC standards. This safety check falls under class B, which is
MPE for uncontrolled environments. The environment is defined as “controlled” if all the
people that will be exposed to the system are aware of the hazards involved with the
emissions. If the people are not made aware of the hazards of exposure to the radio
frequency waves, the environment is classified as “uncontrolled”.
The FCC standards for controlled and uncontrolled exposure are given in Table
2.2 and Table 2.3. These tables for these two standards differ in the factor of safety at
higher frequencies of operation. This is due to the fact that the FCC limit combines the
IEEE and other standards.

-16-
Table 2.2
FCC MPE LIMIT FOR CONTROLLED OCCUPATIONAL EXPOSURE (FCC, 1999)
Frequency Range (MHz)
Electric Field Strength (E)
(V/m)
Magnetic Field Strength (H)
(A/m)
Power Density (S)
(mW/cm2)
Averaging Time |E|2, |H|2 or S (minutes)
0.3-3.0 614 1.63 (100) 6 3.0-30 1842/f 4.89/f (900/f2) 6 30-300 61.4 0.163 1.0 6 300-1500 -- -- f/300 6 1500-100,000 -- -- 5 6
Table 2.3
FCC MPE LIMIT FOR GENERAL POPULATION UNCONTROLLED EXPOSURE (FCC, 1999)
Frequency Range (MHz)
Electric Field Strength (E)
(V/m)
Magnetic Field Strength (H)
(A/m)
Power Density (S)
(mW/cm2)
Averaging Time |E|2, |H|2 or S
(minutes) 0.3-1.34 614 1.63 (100) 30 1.34-30 824/f 2.19/f (180/f2) 30 30-300 27.5 0.073 0.2 30 300-1500 -- -- f/1500 30 1500-100,000 -- -- 1.0 30
The FCC Technical Standard part 15 for uncontrolled exposure (class B) given in Field
Strength is presented in Table 2.4. The limit is expressed in decibels. The relationship between
microvolts per meter (µV/m) and decibels of microvolts per meter (dBµV/m) is given in equation
2-2.
mµV
dBm
µVlog20 10 =
(2-2)

-17-
Table 2.4
FCC TECHNICAL STANDARD GIVEN IN FIELD STRENGTH (FCC, 1999)
Spread Spectrum 1 Watt Output Power
Field Disturbance Sensors
500,000 µV/m (114 dBµV/m) @ 3 m
5.785 – 5.815 GHz
Any
50,000 µV/m (94 dBµV/m) @ 3 m
The IEEE standards for controlled and uncontrolled exposure are given in Table 2.5 and
Table 2.6 shown below.
Table 2.5
IEEE MPE FOR CONTROLLED ENVIRONMENTS (IEEE, 1996)
Frequency Range (MHz)
Electric Field Strength (E)
(V/m)
Magnetic Field Strength (H)
(A/m)
Power Density (S)
(mW/cm2)
Averaging Time
|E|2, |H|2 or S (minutes)
0.003-0.1 614 163 (100, 1,000,000) 6 0.1-3.0 614 1.63/f (100, 10,000/f2) 6 3-30 1842/f 1.63/f (900/f2, 10,000/f2) 6 30-100 61.4 1.63/f (1.0, 10,000/f2) 6 100-300 61.4 0.163 1.0 6 300-3,000 -- -- f /300 6 3,000-15,000 -- -- 10 6 15,000-300,000 -- -- 10 616,000/ f1.2
-18-
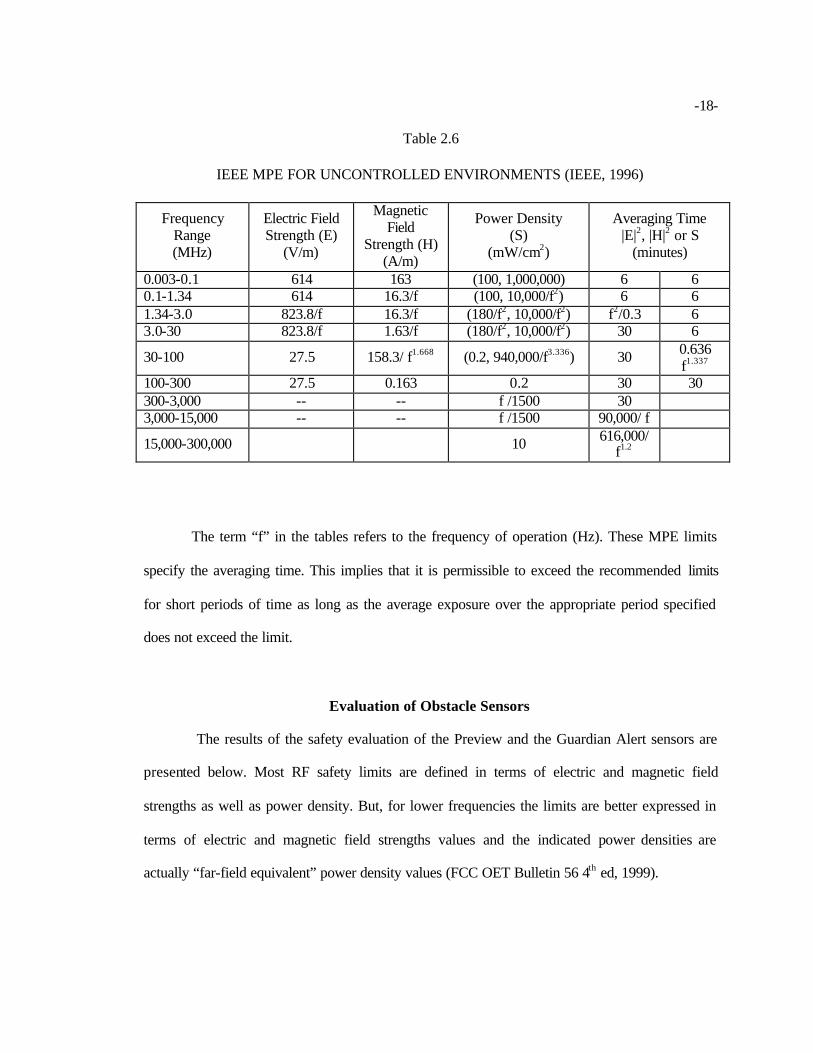
Table 2.6
IEEE MPE FOR UNCONTROLLED ENVIRONMENTS (IEEE, 1996)
Frequency Range (MHz)
Electric Field Strength (E)
(V/m)
Magnetic Field
Strength (H) (A/m)
Power Density (S)
(mW/cm2)
Averaging Time |E|2, |H|2 or S
(minutes)
0.003-0.1 614 163 (100, 1,000,000) 6 6 0.1-1.34 614 16.3/f (100, 10,000/f2) 6 6 1.34-3.0 823.8/f 16.3/f (180/f2, 10,000/f2) f2/0.3 6 3.0-30 823.8/f 1.63/f (180/f2, 10,000/f2) 30 6
30-100 27.5 158.3/ f1.668 (0.2, 940,000/f3.336) 30 0.636 f1.337
100-300 27.5 0.163 0.2 30 30 300-3,000 -- -- f /1500 30 3,000-15,000 -- -- f /1500 90,000/ f
15,000-300,000 10 616,000/ f1.2
The term “f” in the tables refers to the frequency of operation (Hz). These MPE limits
specify the averaging time. This implies that it is permissible to exceed the recommended limits
for short periods of time as long as the average exposure over the appropriate period specified
does not exceed the limit.
Evaluation of Obstacle Sensors
The results of the safety evaluation of the Preview and the Guardian Alert sensors are
presented below. Most RF safety limits are defined in terms of electric and magnetic field
strengths as well as power density. But, for lower frequencies the limits are better expressed in
terms of electric and magnetic field strengths values and the indicated power densities are
actually “far-field equivalent” power density values (FCC OET Bulletin 56 4th ed, 1999).
-19-
Safety Evaluation of the Preview Obstacle Sensor
This device was evaluated for safety using the test results obtained from the
manufacturer. This evaluation was based on the FCC standard – part 15 class B, for uncontrolled
environment. Most part 15 emission limits are specified in field strength. This device has a peak
field strength of 92.7 dBµV/m at a position 3 meters from the center of the antenna. The radar
emission from this device is considered to be safe because the standard gives a maximum limit
for field strength of 114 dBµV/m at 3 meters away from the centerline of the sensor.
Safety Evaluation of the Guardian Alert Obstacle Sensor
This device was evaluated for safety using the test results obtained from the
manufacturer. The evaluation was based on the IEEE standard for uncontrolled environment. A
duty factor of 1.0 is equivalent to continuous wave (CW) operation. This device in the CW mode
transmits a total power that is less than 15 mW. This power is distributed within a coverage
pattern of the radar sensor, and the maximum power density is 1 mW/cm2 at a distance 0.05 m
from the front of the device. This value reduces to 0.72 x 10⁻³ mW/cm2 at a distance 1 m away
from the centerline of the antenna. When operated in the pulsed mode (the normal operating
mode), with a duty cycle of 5% these values become 50 x 10-3 mW/cm2 and 0.036 x 10⁻³ mW/cm2
respectively. The radar emission from this device is considered to be safe because the standard
gives a maximum limit for power density of f/1500 mW/cm2, which is 7.0 mW/cm2 at a distance
0.05 m from the centerline of the sensor.

-20-
CHAPTER III
DISTANCE TO OBSTACLE, STOPPING DISTANCE, VELOCITY RELATIONSHIPS
Introduction
The obstacle sensors of this study are backup aids and not sole methods for rear collision
prevention. The sensors only indicate the presence of a hazard at a given distance from the
vehicle. The detection would be useless if suffic ient time is not allowed for the operator to stop
the truck before colliding with the detected object. The distance it takes to stop the vehicle in
order to avoid collision varies primarily as a function of speed, the perception time, response
time, reaction time and braking time, which is a function of coefficient of traction, braking
torque, tire radius, vehicle weight distribution, etc. A study of stopping distance will establish the
relation of the vehicle speed to the activation of the obstacle detector’s signal. The use of this
“stopping distance” will be different for the two sensors because they operate on different
principles.
The Total Stopping Distance
The actual stopping distance is the distance a truck travels from the time the obstacle
enters the sensor’s detection range until the truck stops. Factors that affect the actual stopping
distance include the initial velocity of the vehicle, the perception time, the response time, reaction
time and braking time, which varies with drag. Taborek, Jaroslav J.(1957), stated in the series
“Mechanics of vehicles” that air resistance has little effect on stopping distance except at higher
initial speeds. When descending grades, it takes a longer time to stop due to gravity pull downhill
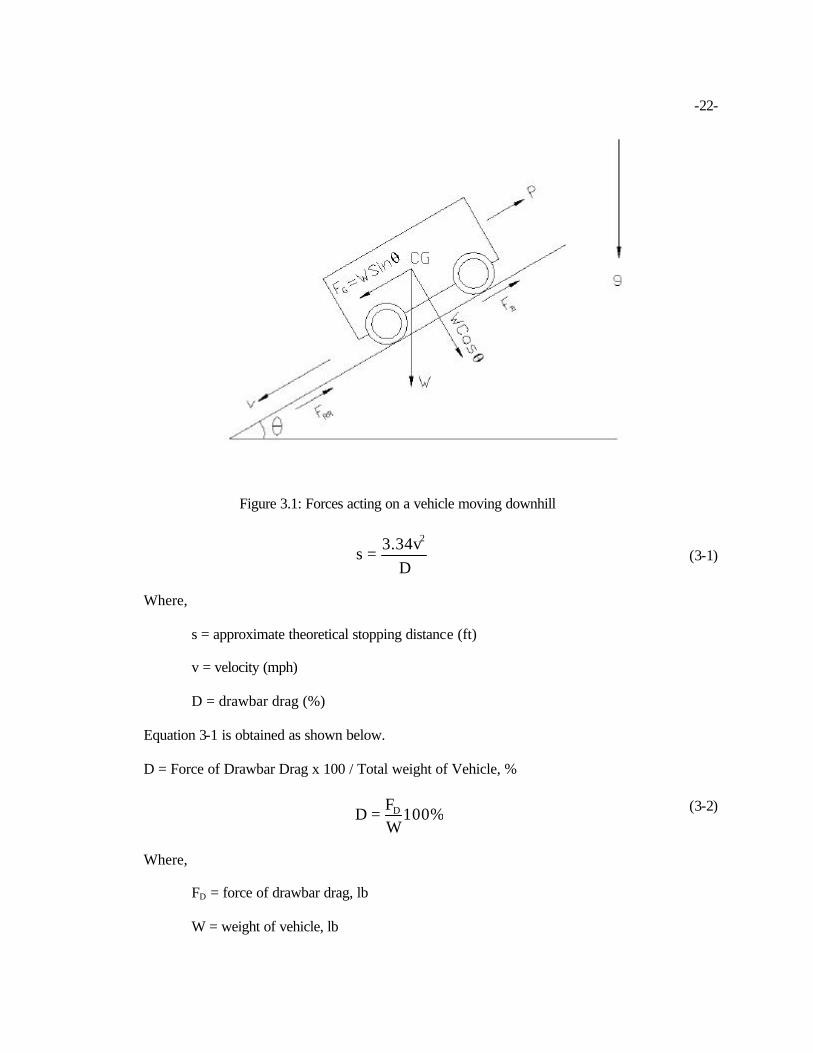
as illustrated in Figure 3.1, which shows the forces acting on a vehicle when decelerating
-21-
downhill. All of these factors are important parts of the actual stopping distance and are discussed
in this chapter. The approximate theoretical stopping distance on dry clean asphalt, brushed
concrete or an equivalent surface is given by Equation 3-1 from Safety Standards for Low Lift
and High Lift Trucks (ASME 1993), where the drawbar drag force includes the retarding force
between tire and road surface due to braking (FB), the rolling resistance (FRR), the component of
gravity force parallel to the road surface (FG), and any force externally applied to the truck due to
pulling or pushing a load (P).
FRR = CRW Cos θ
FG = W Sin θ ≈ W Tan θ = WG / 100
FD = FB + FRR - FG + P
Where,
W = Weight of vehicle plus pay load
CR = Coefficient of Rolling Resistance
θ = Angle of Grade
G = Grade, %
-22-
Figure 3.1: Forces acting on a vehicle moving downhill
D3.34vs
2
= (3-1)
Where,
s = approximate theoretical stopping distance (ft)
v = velocity (mph)
D = drawbar drag (%)
Equation 3-1 is obtained as shown below.
D = Force of Drawbar Drag x 100 / Total weight of Vehicle, %
100%WFD D= (3-2)
Where,
FD = force of drawbar drag, lb
W = weight of vehicle, lb
-23-
From Equation 3-2,
100WD
FD = (3-3)
From the Newton’s laws of motion,
2asvv 2i
2f =− (3-4)
Where,
fv = Final velocity, fps
iv = Initial velocity, fps
s = Stopping distance, ft
a = Constant acceleration (The force to accelerate vehicle is assumed to be constant due
to braking and grade).
From Equation 3-4 for a final velocity of zero, the stopping distance is:
av
s i
2
2
= (3-5)
Newton’s law for force and acceleration of truck on grade,
MF
a D= (3-6)
Where,
g = 32.17 ft/sec2, Gravity constant
M = W/g = Mass of truck
Substituting Equations 3-3 and 3-6 into Equation 3-5, gives the stopping distance:
2gD100v
s2
i= (3-7)
Substituting the value of g and doing some units conversion gives Equation 3-1. It should
be noted that Equation 3-1 does not include the response, perception and reaction time. To
-24-
include the perception time, the reaction time of the operator and the response time of the sensor,
Equation 3-1 is modified by adding the distances covered during each of these times. The actual
distance traveled before stopping is given by Equation 3-8.
D3.34v
vtvtvtS2
rpR +++= (3-8)
Where,
S = actual travel distance, ft
v = speed of travel of the truck, mph
tR = response time of sensor, sec
tp = perception time of the operator, sec
tr = reaction time of the operator, sec
Response Time
The “response time” is the time required for the obstacle sensor to detect the object in the
detection zone and activate all warning systems (SAE 1999). The distance traveled during this
time is a function of the initial speed of the truck and the response (detection) time of the sensor
system. This distance is traveled before there is an indication of the hazard. The response time of
these obstacle sensors are usually in milliseconds. For the Guardian Alert a highly reflective
object gives a response time of approximately 16 milliseconds; however, a small object with low
reflectivity could take about 128 milliseconds for response time or may not even sound the alarm.
For the Preview, the maximum response time possible is 200 milliseconds. This is based on the
eight 25 milliseconds sweeps for a detection signal. It takes a number of detections by the sensor
before a response is sent to the display. Four detections are required for the Guardian Alert and
eight for the Preview. This number affects the response time of the sensor. For an object with low
-25-
reflectivity, the reflected signal might be so weak that the sensor loses the signal and the whole
detection process will be started again.
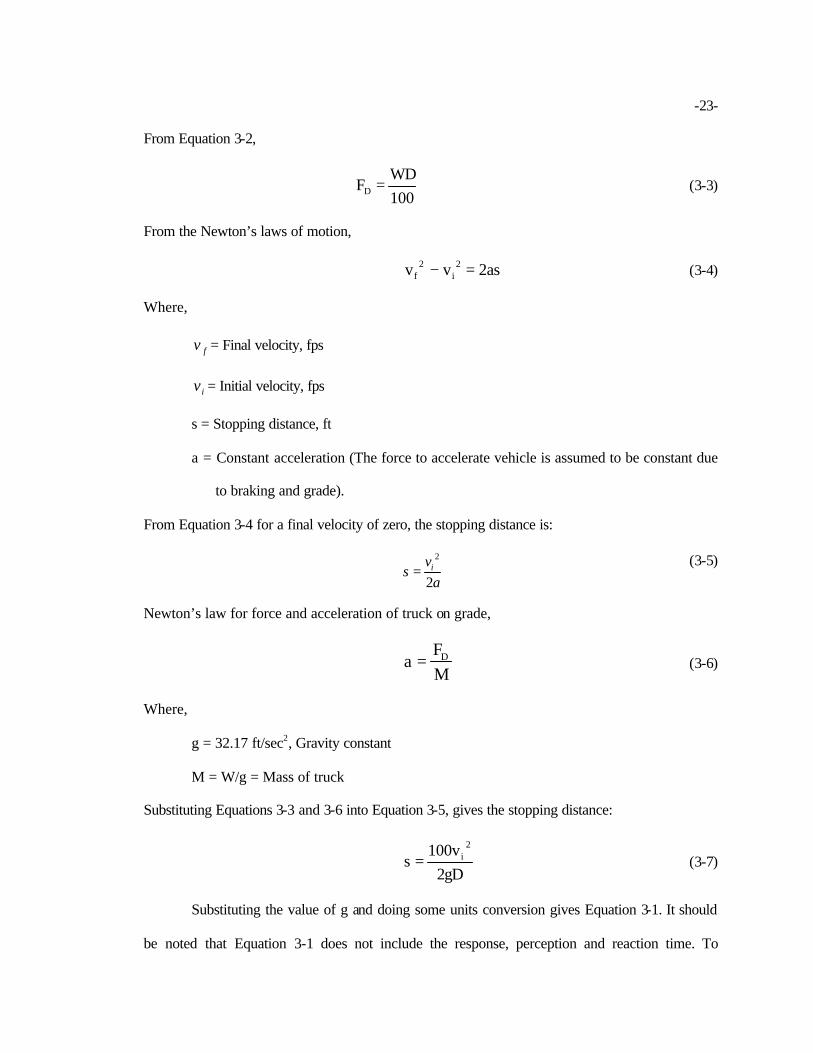
The influence of response time of the sensor on the stopping distance of lift trucks is
illustrated in Figure 3.2 for initial speeds of 16.6, 10 and 5 mph, and for tp = 0.75 sec, tr = 0.75
sec, D = 25 and G = 0. The increase in stopping distance is small due to the fact that the response
time of the sensor is in milliseconds.
The Influence of Response Time on Stopping Distance
0
5
10
15
20
25
30
0 0.05 0.1 0.15 0.2 0.25
Sensor Response Time (sec)
Sto
ppin
g D
ista
nce
at M
axim
um S
peed
(m
)
v = 16.6 mph
v = 10 mph
v = 5 mph
Figure 3.2: Stopping distance increases with sensor response time
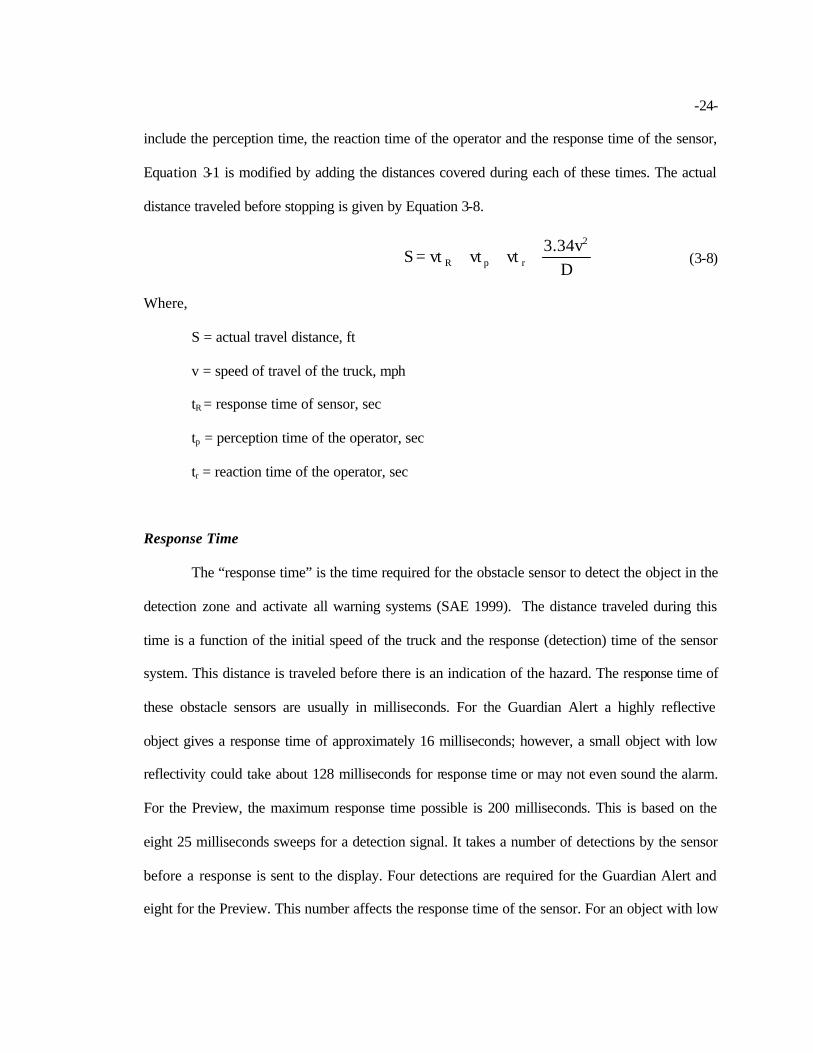
Perception Time
The perception time is the time it takes the operator to see the hazard, and for him to
recognize the situation as one that requires immediate action. Generally, perception time varies
between 0.25 to 0.75 seconds (Safety Drive Training, 2002). The distance traveled during this
time is a function of the velocity of the vehicle and the perception time. It is very important to

-26-
look in the direction of travel during the operation of lift trucks because the earlier the hazard is
recognized, the less the time required to stop the truck. Factors that can affect perception time
include the condition of the operator. Tiredness, fatigue, concentration level, old age, alcohol,
drugs and some medicines increase perception time. The influence of perception time on stopping
distance of lift trucks for initial speeds of 16.6, 10 and 5 mph, and for tR = 0.20 sec, tr = 0.75 sec,
D = 25 and G = 0 is illustrated in Figure 3.3.
The Influence of Perception Time on Stopping Distance
0
5
10
15
20
25
30
0 0.2 0.4 0.6 0.8 1 1.2
Perception Time (sec)
Sto
ppin
g D
ista
nce
at M
axim
um S
peed
(m
)
v = 16.6 mph
v = 10 mph
v = 5 mph
Figure 3.3: Stopping distance increases with perception time
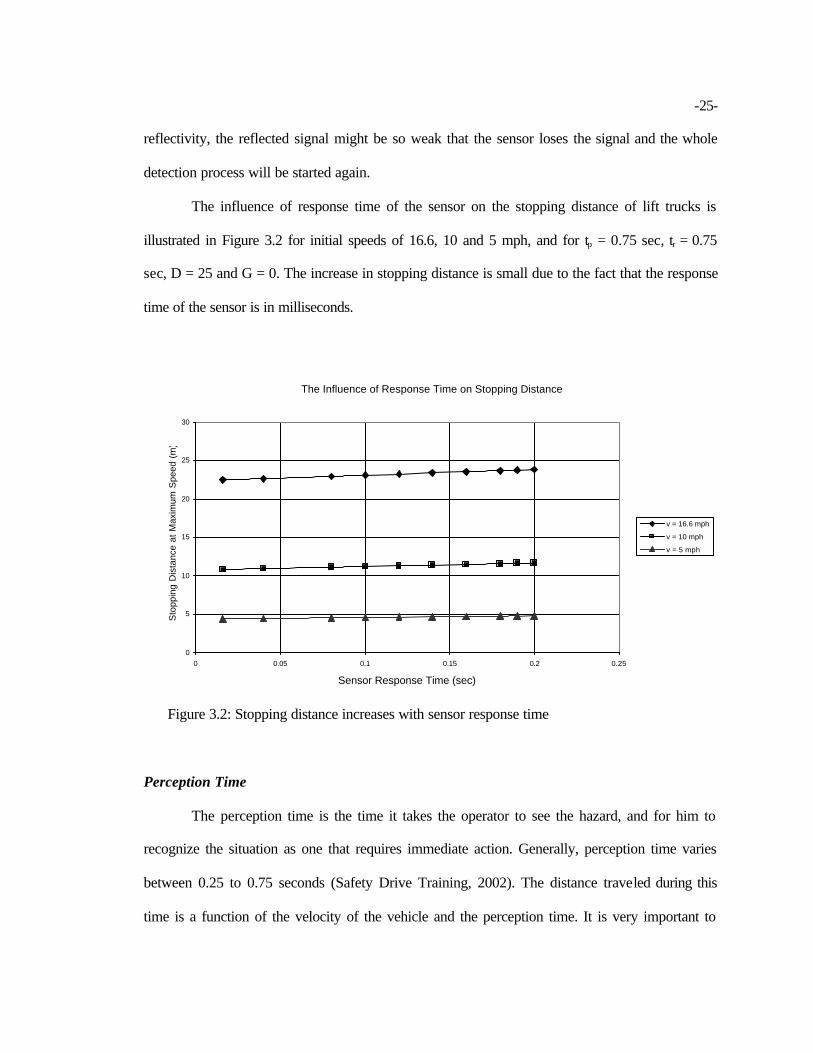
Reaction Time
Some time elapses before the operator releases his foot from the accelerator and fully
applies the brakes. This elapsed time is the operator’s reaction time. Factors that can affect
reaction time include the condition of the operator. Tiredness, fatigue, concentration level, old
age, alcohol, etc. increase reaction time. Generally reaction time can vary between 0.25 to 0.75
seconds. The average reaction time for truck operators is 0.75 seconds (Girardi, 1996). The

-27-
influence of reaction time on stopping distance of the lift trucks for a initial speeds of 16.6, 10
and 5 mph and for tR = 0.20 sec, tp = 0.75 sec, D = 25 and G = 0 is illustrated in Figure 3.4.
The Influence of Reaction Time on Stopping Distance
0
5
10
15
20
25
30
0 0.2 0.4 0.6 0.8 1 1.2
Reaction Time (sec)
Sto
ppin
g D
ista
nce
at M
axim
um T
ruck
Spe
ed (
m)
Figure 3.4: Stopping distance increases with reaction time
Braking Distance
This is the distance traveled before the truck comes to a rest, after the brakes have been
fully applied. Factors that affect braking distance include vehicle speed, condition of tire/road
interface (coefficient of traction and bumps), brake torque capacity, and the load on braking
wheels. The greater the speed the longer the stopping distance required due to dissipation of
higher kinetic energy. Braking distance is directly proportional to the square of the speed and
inversely proportional to the drag force. The drag force is the resisting force developed between
the tire and the road surface (rolling resistance and braking traction forces), which is augmented
on inclined roadways by the component of the truck’s weight force parallel to the roadway (FG =

-28-
W Sinθ) and any drawbar pull or push forces. Excessive brake torque may cause the lift truck to
tip over due to the high center of gravity and short wheelbase of this class of vehicles. Therefore,
the brake torque for large trucks is limited to provide drag, D, of 20%. The braking distance is
calculated using Equation 3-1. The “Drawbar Drag,” D, includes the rolling resistance and
friction force between the tire and road due to braking action. The value of D for forklift truck
stopping distance evaluation is given in from Safety Standards for Low Lift and High Lift Trucks
(ASME 1993) for v ≥ 8.33mph maximum speed as D = 25%
The coefficient of traction between various roadway surfaces may be determined from
Tractors and their Power Units (Barger, E. L. et al) as:
Table 3.1
THE COEFFICIENT OF TRACTION FOR DIFFERENT ROADWAY SURFACES
ROADWAY SURFACE COEFFICIENT OF TRACTION Concrete 0.68
Clay 0.58 Sand 0.42 Gravel 0.35
Effect of Speed on Stopping Distance
The effect of speed on stopping distance is very significant due to the fact that each
component of stopping distance is a function of speed. If the best response time of the sensor is
assumed to be 0.20 sec, the perception time is assumed to 0.75 sec and the average reaction time
of a lift truck operator is assumed to be 0.75 sec, then the relationship between speed and
stopping distance will be as shown in Figure 3.5 for different initial speeds. (tR = 0.20 sec, tp =
0.75 sec, tr = 0.75 sec and G = 0).

-29-
The Influence of Speed and Drawbar Drag on Stopping Distance
0
5
10
15
20
25
30
0 2 4 6 8 10 12 14 16 18
Initial Speed (mph)
Sto
ppin
g D
ista
nce
(m)
D = 25
D = 20
Figure 3.5: Stopping distance increases with initial speed values.
Dilich et. al. (2002), pointed out in their report “Evaluating Driver Response to a Sudden
Emergency: Issues of Expectancy, Emotional Arousal and Uncertainty” that in the case of an
emergency nobody can really predict what will happen. The settings of the alarm activation of the
obstacle sensors require estimates of stopping distances. This study estimates the settings of
distance between obstacle and sensor needed by an alert and skillful operator in order to stop the
moving vehicle from an initial speed before the obstacle detected is hit. For example, if the
maximum detection range for a human obstacle is set at 8 m, a vehicle with an initial speed of 8
mph or higher would strike the obstacle before the operator could stop if the operator’s only
warning was by the sensor. The setting of this distance at which the warning is sounded will vary
with the application, operator, and truck.
-30-
CHAPTER IV
DESIGN OF TEST APPARATUS AND DATA COLLECTION SYSTEM
Introduction
Detection of an obstacle by the obstacle detection system is indicated by the activation of
the LEDs. Hence, the performance of the system depends on monitoring the LED output.
The LED is energized when an obstacle is within the detectable range configured in the
sensor. The “detectable range” for activation of the LED varies with the reflectivity and size of
object being detected as well as the settings for the system. The LED may vary between “on” and
“off” near the perimeter of the “detectable range” or cycle between range positions. Hence, the
interpretation of results depends on the person observing the obstacle sensor and most likely will
vary from one person to another. The interpretation of the number of LEDs energized is also
subjective due to the fact that the duration of time that the LEDs stay on is difficult to quantify
accurately. A computer controlled data acquisition system is designed to minimize these human
errors in the recording of LED output. Some performance data is recorded without the computer
controlled system and some with the computer controlled system.
Design of Apparatus
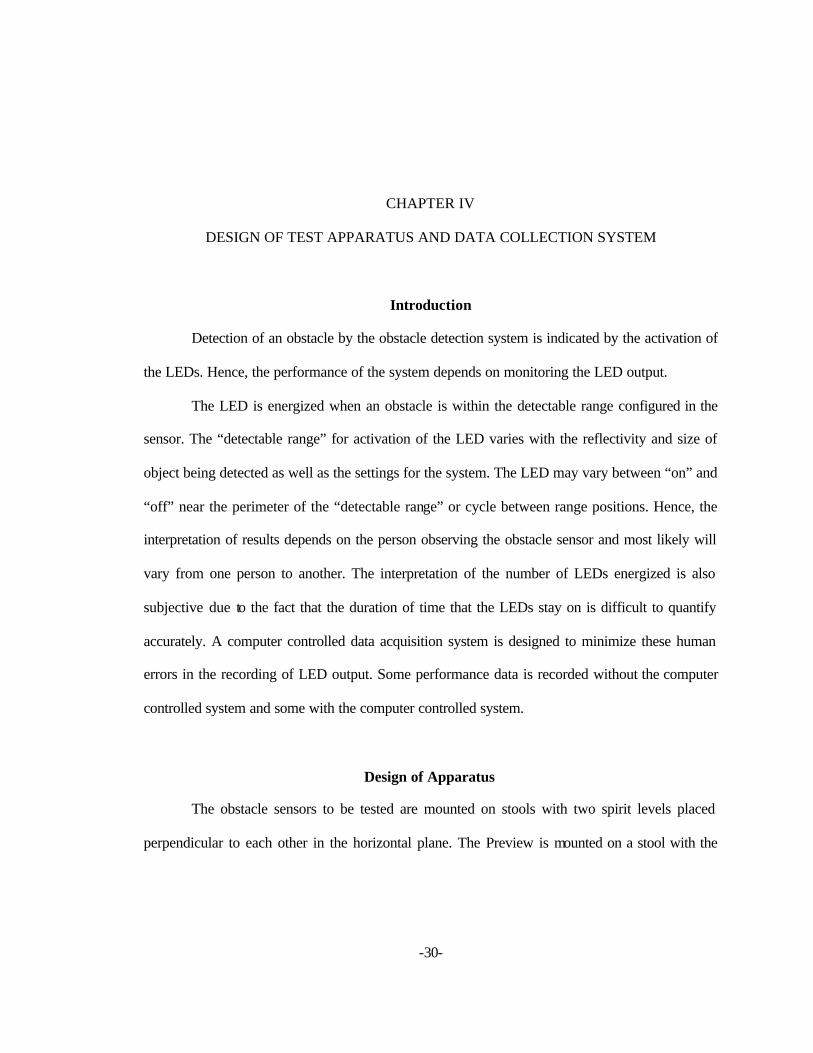
The obstacle sensors to be tested are mounted on stools with two spirit levels placed
perpendicular to each other in the horizontal plane. The Preview is mounted on a stool with the
-31-
centerline of the sensor about 25 inches from the ground. The Guardian Alert is mounted on a
stool with the centerline of about 25.5 inches from the ground. The Preview is a larger system
(7.56 inches high, 7.35 inches wide and 2.39 inches deep) than the Guardian Alert (3.00 inches x
3.00 inches x 1.50 inches deep). Figure 4.1 shows the mounting of the Preview sensor and Figure
4.2 shows that of the Guardian Alert. The test data may be manually collected from the devices of
Figure 4.1 or 4.2 by viewing the LEDs as a pedestrian walks across the field of view of the
sensor.
Figure 4.1: The mounting of the Preview sensor

-32-
Figure 4.2: The mounting of the Guardian Alert sensor
Computer Controlled Test
In order to create a computer controlled test, the obstacle (pedestrian) is towed across the
field of view by a cable, which rotates the pulley of Figure 4.3 and a rotary potentiometer. The
position of the obstacle is defined as a function of voltage. In order to define velocity of the
obstacle, the voltage defining position is recorded as a function of time. The position data
(voltage) as well as data (voltage) indicating that an LED is “ON” or “OFF” are recorded by a
computer controlled data acquisition system.

-33-
Obstacle Drive
The obstacle is pulled across the field of view by a wire cable per Figure 4.4. The
apparatus used to run the experiments consists of a variable speed drill motor (1/2-horsepower)
that provides the rotary motion required to wind a wire, which pulls the trolley carrying the test
body (obstacle). The wire attached to the trolley is rolled on a 14.00-inch diameter pulley. A shaft
connects the 14.00 inch pulley to the drill motor. The drill motor is held in position by bars
connected to the test apparatus.
A ten-turn rotary potentiometer is used to obtain the displacement of the moving trolley
that carries the obstacle. The output voltage from the potentiometer is proportional to the trolley
displacement. The voltage across the potentiometer changes with the turns of the shaft as the wire
winds up on the 14.00 inch diameter pulley as the trolley is pulled across the field of view of the
sensor. Two rolling contact bearings support the 14.00-inch diameter pulley and transfer rotary
motion to the friction clutch that limits torque on the potentiometer. A compression spring is used
limit torque to the potentiometer.

-34-
Figure 4.3: The side view of test apparatus; obstacle position drive

-35-
Figure 4.4: Trolley system with sensor position.

-36-
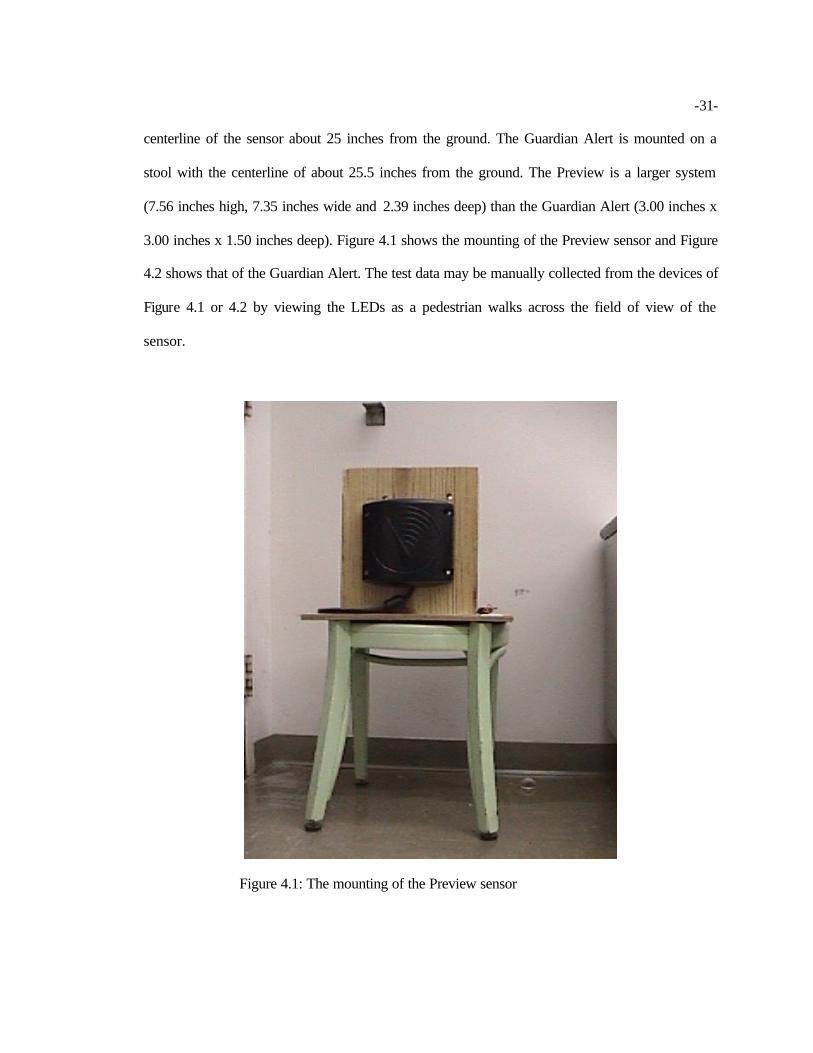
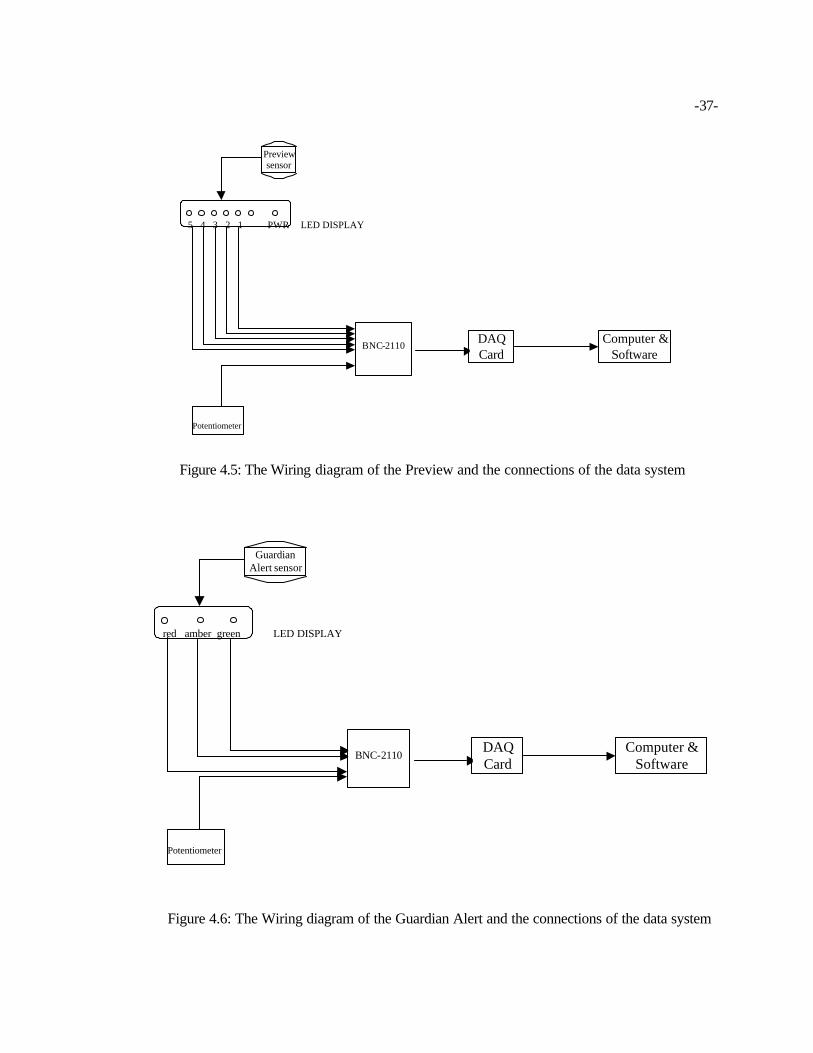
Data Collection System
The data acquisition (DAQ) system consists of a National Instruments DAQ card NI
6024 E installed in a personal computer, a National Instruments BNC-2110 shielded connector
block, a potentiometer and the data acquisition software.
The wiring diagrams of the Preview and Guardian Alert obstacle sensors are illustrated in
Figure 4.5 and 4.6. The potentiometer generates a voltage signal corresponding to the distance
traveled by the trolley that rotates the 14.00-inch diameter pulley. The voltage signal from the
potentiometer is fed into the connector block and measured. The DAQ system is controlled by the
National Instruments LabView 6.1 program. The programs used for the Preview and the Guardian
Alert obstacle sensors are shown in the Appendix. The signals sampled by the DAQ system as
functions of time are:
1. Potentiometer voltage (trolley travel)
2. Voltage across each of the LEDs of obstacle sensor (five LEDs for the Preview
and three for the Guardian Alert).
-37-
Preview sensor
BNC-2110
Potentiometer
DAQ Card
Computer & Software
5 4 3 2 1 PWR LED DISPLAY
Figure 4.5: The Wiring diagram of the Preview and the connections of the data system
Guardian Alert sensor
BNC-2110
Potentiometer
DAQ Card
Computer & Software
red amber green LED DISPLAY
Figure 4.6: The Wiring diagram of the Guardian Alert and the connections of the data system

-38-
CHAPTER V
EXPERIMENTAL PROCEDURE FOR PERFORMANCE TESTING OF OBSTACLE
SENSORS
Introduction
The detection range of an obstacle sensor is the area at the rear of the truck within which
an obstacle should be detected by the sensor. The Guardian Alert obstacle sensor detects
obstacles whose velocity relative to the truck exceeds some preset value when the distance
between the truck and obstacle is decreasing. The Preview obstacle sensor detects obstacles
independent of its relative velocity. The 3D-field of view of the sensors (i.e., the horizontal and
vertical detection ranges of the sensors) is needed to design for proper location of the sensor on
the truck. This field of view may be measured by experiment. This chapter describes the
procedures for obtaining the field of view of the obstacle sensors. The field of view is determined
manually and by an automated data collection system.
The test conducted on the Forklift trucks with these obstacle sensors have the sensors
located to provide good coverage of the width and depth of the field of view for reverse travel
based on data from the tests of sensors. The test area as specified by the SAE standard
“Discriminating Back-up Alarm System Standard” SAE J1741 (SAE 1999) should be an open
space with a smooth surface and no significant physical object within five machine lengths. Most
of the manual test data are from tests performed indoors in a gymnasium that had a polished
wooden floor or in a metal building with concrete floor. The data is for the two different devices,
which were configured with different sensor settings and for different obstacle sizes.

-39-
Manual Measurements of the Field of View of Sensors
The manual tests on the device described above in section 4.2, but without the automated
data acquisition system attached are described in this section. Tests are run for different
configurations of the obstacle sensors. The obstacle sensor is placed at a reference point and the
LED display is connected. Two spirit levels are used to ensure that the sensor is in a leveled
position. A centerline is projected from the center of the stationary sensor and divided into
increments at 0.5 m, 1 m, 2 m, 3 m, 4 m, 5 m, 6 m, 7 m and 8 m. The points of tests were chosen
to conform to the SAE standard “Discriminating Back-up Alarm System Standard” SAE J1741
(SAE 1999). Tests are conducted by moving the target along lines perpendicular to the centerline
at these increments.
The field of view of each sensor is obtained if the full detection range is split into two
components, the horizontal and vertical detection range. The perimeter of the field of the field of
view is obtained by plotting a line through the coordinates of the detection points on the
perimeter. Detection points are coordinates of the obstacle’s position when the system is actuated
as the target moves into the field. The obstacle continues to move along this line normal to the
centerline until all LEDs turn off and there is no detection as the obstacle moves out of the field.
The points where detection is initiated and where detection is terminated are recorded after the
experiment is completed.
Horizontal Detection Range of Sensors
The horizontal detection range for the Preview has the shape of a tear drop while that of
the Guardian Alert has the shape of an irregular polygon. Objects out of the detection range will
not be detected. This concept is best described graphically. The horizontal detection range of
radar sensors is illustrated in Figure 5.1.

-40-
Horizontal Detection Range
Figure 5.1: Figure showing the top view of the forklift truck and the horizontal detection range of a radar sensor.
Vertical Detection Range of Sensors
This describes the range in which obstacles will be detected by the obstacle sensor in the
vertical plane. The vertical detection range may produce false alarms as the truck moves over
undulating roadbeds. This concept is best described graphically. The vertical detection range of
radar sensors is illustrated in Figure 5.2. The vertical detection range is obtained experimentally
by installing the device with a 900 rotation about the centerline parallel to the ground. The results
of the vertical detection range will be used to reduce the occurrence of the false alarms initiated
by detecting the ground and to determine the minimum height of objects to be detected. The
horizontal and vertical detection range work hand-in-hand to define the total volume of the field
of view of obstacle sensors.
Rad
ar
sens
or
T
op V
iew
of
Tru
ck

-41-
Side View of Truck
Vertical Detection Range
Figure 5.2: Figure showing the side view of the forklift truck and the vertical detection range of a radar sensor.
Automated Measurements of the Field of View of Sensors
The collection of data by an automated system is needed for the Guardian Alert obstacle
sensor due to the dependence of this Doppler radar sensor on velocity, a vector and time
dependent quantity. The Preview obstacle sensor measurement will benefit from the automated
data collection system, but it is not required. The automated test is the same as the manual test
procedure, except the obstacle is pulled through the field of view of the sensor at a constant
velocity with a wire cable. The computer based data acquisition system records data for position
versus time and data showing range signal lights as being ON or OFF versus time.
The procedure previously described in the section entitled “ Manual Measurements of the
Field of View of Sensors” is repeated with the automated data acquisition system for both the
Preview and the Guardian Alert obstacle sensors.
Location of Sensor on Truck for Tests
The design for positioning of these sensors on the truck was simulated using the
perimeter of the most conservative field of view given in chapter VI and CAD drawings of the
sensors and lift trucks under study. The installed height of the sensor on the lift truck is very
important because it will detect the ground if installed too low and will not detect obstacles close
Rad
ar
sens
or
-42-
to the back of truck or close to the ground if installed too high. This simulation reduces the time
spent on determining the “best” locations of these sensors on different trucks.
Location of the Preview on the Forklift Trucks
Three Preview sensors are mounted across the rear of the truck to obtain the desired
width of field of view. The Preview is mounted on the lift truck TC 300S with the center of the
sensor C, at least 0.33 m above the ground and tilted upward 90 per Figure 5.3. This should
reduce the occurrence of false alarms. In the design for location of the Preview, the detection
range data obtained from the smallest human (test body) is used. Three Preview sensors are
spread across the rear of the truck to eliminate blind areas immediately behind the truck due to
the teardrop shape of the field of view of each sensor. The outer sensors may be turned outward
by 600 to include the path for a 900 turn within the field of view.
Location of the Guardian Alert on the Forklift Trucks
The Guardian Alert is mounted on the lift truck TC 300S at a height of 1.15 m from the
ground and the sensor is centered at the back of the truck per Figure 5.4. This should reduce the
occurrence of false alarms. In the design for location of the Guardian Alert, the average data for
the horizontal and vertical detections are used. The rectangular pattern of the field of view of this
sensor allows one sensor to cover the width of the truck. The position of the truck after a 900 turn
is illustrated by the faint truck outline of Figure 5.4.
Tests of Obstacle Sensors on Actual Lift Trucks
The Sensors are installed on the lift trucks as described in the section entitled “ Location
of Sensors for Test”. The Guardian Alert was mounted on the lift truck with the center of the
sensor 1.15 m above the ground. Manual and automated tests are conducted to determine the

-43-
detection zone at the back of the lift truck. The obstacle is pulled across the field of view of the
obstacle sensor with a wire cable attached to the 14 in pulley diameter of the test apparatus at
positions 0.5 m, 2 m, 4 m, 6 m and 8 m from the sensor.

-44-
Figure 5.3: The position of three Preview sensors on TC 300S forklift. One is on the truck centerline and the other two sensors are located at 0.15 m ahead of the center sensor, 0.43 m from the truck centerline and rotated at 600 clockwise and counterclockwise respectively. The sensors are located with centers 0.33 m above the ground and tilted upward 90.
TC-300S Truck (Side view)
TC-300S Truck
(Top View)
Detection Zone
(Horizontal)
Detection Zone(Vertical)

-45-
Figure 5.4: The position of the Guardian Alert on TC 300S forklift is located 1.15 m above the ground.
TC-300S Truck
(Top View)
Detection Zone
(Horizontal)
TC-300S Truck (Side view)
Detection Zone(Vertical)

-46-
CHAPTER VI
EXPERIMENTAL RESULTS
Results Obtained from the Manual Tests
This section presents the results obtained from the manual tests of obstacle sensor
performance using the procedures described in the section entitled “Manual Measurements of the
Field of View of Sensors”. The perimeter of the detection range is determined by having an
obstacle move along a straight line from one side of the detection field to the other. The sensor is
activated at the entrance into the field of view and is deactivated at the exit from the field of view.
The results obtained from the DAQ system using the procedures described in the section entitled
“Automated Measurements of the Field of View of Sensors” is presented in this chapter. The
position (i.e. elevation and angle) in which the obstacle sensor is installed depends on the field of
view desired and is limited by the actual field of view of obstacle sensors.
Horizontal Detection Range Results for the Preview Obstacle Sensor
The results presented in this section define the horizontal detection range of the Preview
obstacle sensor. These experiments compare the horizontal detection range for different test
bodies with different settings for detection patterns. The horizontal detection range data obtained
for the sensor and display settings in Table 6.1 are presented in Figure 6.1. The same sensor and
display settings are used, but with different sizes of test bodies. The test bodies include: a female
5'6" in height weighing 160 lbs and a male 5'7" in height weighing 180 lbs. It can be observed
that the detection range for a bigger body is wider than that of a smaller body.

-47-
Table 6.1
PREVIEW SENSOR AND DISPLAY SETTINGS FOR RECTANGULAR PATTERN EXPERIMENT
Horizontal Detection Range test
Height of Sensor Center: 25 inches above ground level
Preview Sensor Properties: Preview Display Properties:
ID: 1 ID: 1
Type: Rear Type: Rear
Range: 26 ft / 8.0 m Max sensors: 1
Pattern: Rectangular Sensor 1 ID: 1
Calibration: 4.0 ms LED mode: Forward and Reverse
Code Rev: 1.5 Buzzer mode Reverse announce/detect
Code Rev: 1.3
Note: All dimensions in meters
-5
-4
-3
-2
-1
0
1
2
3
4
5
0 1 2 3 4 5 6 7 8 9160 lbs Female
180 lbs Male
Figure 6.1: Comparison of the horizontal detection range of a rectangular pattern of a female 5'6" and a male 5'7" test bodies for Preview

-48-
The detection range data in Figure 6.2 are obtained when the sensor and display settings
are per Table 6.2. The only difference from the prior test (Figure 6.1) is the pattern setting.
Table 6.2
PREVIEW SENSOR AND DISPLAY PARAMETERS FOR CONE PATTERN EXPERIMENT
Horizontal Detection Range test
Height of Sensor Center: 25 inches above ground level
Preview Sensor Properties: Preview Display Properties:
ID: 1 ID: 1
Type: Rear Type: Rear
Range: 26 ft / 8.0 m Max sensors: 1
Pattern: Cone Sensor 1 ID: 1
Calibration: 4.0 ms LED mode: Forward and Reverse
Code Rev: 1.5 Buzzer mode Reverse announce/detect
Code Rev: 1.3
Note: All dimensions in meters
-5
-4
-3
-2
-1
0
1
2
3
4
5
0 1 2 3 4 5 6 7 8 9
160 lbs Female
180 lbs Male
Figure 6.2: Comparison of the horizontal detection range of a cone pattern of a female 5'6" and a male 5'7" test bodies

-49-
Figure 6.3 shows the horizontal detection range obtained using a 5'6" high, 160 lbs,
female test body for three different detection pattern settings: rectangular, cone and side. These
results show that the detection range varies for each detection pattern setting in the sensor even
though the test body is unchanged. The configurations of sensor and display are given in Table
6.3.
Table 6.3
PREVIEW SENSOR AND DISPLAY PARAMETERS FOR SIDE PATTERN EXPERIMENT WITH A 5'6" TALL, 160 LBS FEMALE
Horizontal Detection Range test
Height of Sensor Center: 25 inches above ground level
Preview Sensor Properties: Preview Display Properties:
ID: 1 ID: 1
Type: Rear Type: Rear
Range: 26 ft / 8.0 m Max sensors: 1
Pattern: Side Sensor 1 ID: 1
Calibration: 4.0 ms LED mode: Forward and
Reverse
Code Rev: 1.5 Buzzer mode Reverse
announce/detect
Code Rev: 1.3

-50-
Note: All dimensions in meters
-5
-4
-3
-2
-1
0
1
2
3
4
5
0 1 2 3 4 5 6 7 8 9Rectangular Pattern
Cone Pattern
Side Pattern
Figure 6.3: Comparison of the horizontal detection range of a rectangular, cone and side detection patterns for Preview.
A male test body 5'10" tall and 165 lbs in weight with the same sensor settings presented
in Table 2 was used to compare the detection range obtained from human and some non-human
obstacles. Only the last zone was used to run these tests as four LEDs were on continually during
these tests, the last LED was used to monitor the detection zone. Walls in the test area caused the
constant actuation of the four LEDs. The results obtained from these test are compared with that
of a plywood test body with dimension 30" tall x 11.5" wide x 0.375" thick per Figure 6.4. The
plywood was cut out in the shape of the upper torso of a human being with arms placed on sides.
These results are presented in Figure 6.5.

-51-
Figure 6.4: Plywood cut into the shape of the upper torso of the human being.
Note: All dimensions in meters
-5
-4
-3
-2
-1
0
1
2
3
4
5
0 1 2 3 4 5 6 7 8 9
165 lbs Male
Plywood
Figure 6.5: Comparison of the horizontal detection range of a cone detection pattern for a human obstacle and a plywood obstacle as detected by the Last zone only (i.e. the other four LEDs were ON continually) for Preview.

-52-
All results presented above, Figures 6.1, 6.2, 6.3 and 6.5 are presented without the
subjectivity of how long the LED stayed on or if it blinked. Detection was recorded when the
LED initially turned on. The subjectivity is due to the variation in the response time due to the
composition and size of obstacle. This subjectivity was discussed in chapter IV. The results
presented in Figures 6.6 to 6.8 shows the subjectivity in the interpretation of results. This simply
means that sometimes, the LEDs switch from one to the other, or one lights up and then goes off,
but then lights up again. The detection pattern configurations used for data of Figures 6.6 to 6.8
are given in Tables 6.1 to 6.3 respectively. A male body is used for the Figure 6.6 test.
Note: All dimensions are in meters
-5
-4
-3
-2
-1
0
1
2
3
4
5
0 1 2 3 4 5 6 7 8 9
Stable Detection
Blinking
Figure 6.6: The horizontal detection range of a rectangular pattern of a male 5'10" tall test body based on observations of blinking LEDs as occurring at the fringe of the detection zone and of stable LEDs as occurring inside the detection zone for Preview.

-53-
Note: All dimensions are in meters
-5
-4
-3
-2
-1
0
1
2
3
4
5
0 1 2 3 4 5 6 7 8 9Stable detection
Blinking
Figure 6.7: The horizontal detection range of a cone pattern of a female 5'6" tall test body based on observations of blinking LEDs as occurring at the fringe of the detection zone and of stable LEDs as occurring inside the detection zone for Preview.

-54-
Note: All dimensions are in meters
-5
-4
-3
-2
-1
0
1
2
3
4
5
0 1 2 3 4 5 6 7 8 9
Stable detection
Blinking
Figure 6.8: The horizontal detection range of a side pattern of a female 5'6" tall test body based on observations of blinking LEDs as occurring at the fringe of the detection zone and of stable LEDs as occurring inside the detection zone for Preview.
Vertical Detection Range Results for the Preview Obstacle Sensor
The results presented in this section define the vertical detection range of the Preview
obstacle sensor. All results are presented in meters and the test bodies and the detection patterns
are varied. The result obtained for a “last zone only” test is illustrated in Figure 6.13. The 5'10"
tall test body is a male weighing 165 lbs and the 5'6" tall test body is a female weighing 160 lbs.
The vertical field data of Table 6.4 shows the number of LEDs “ON” and their status [i.e. “stable
(constantly energized), “switching” (blinking ON and OFF of one or adjacent lights alternately)]
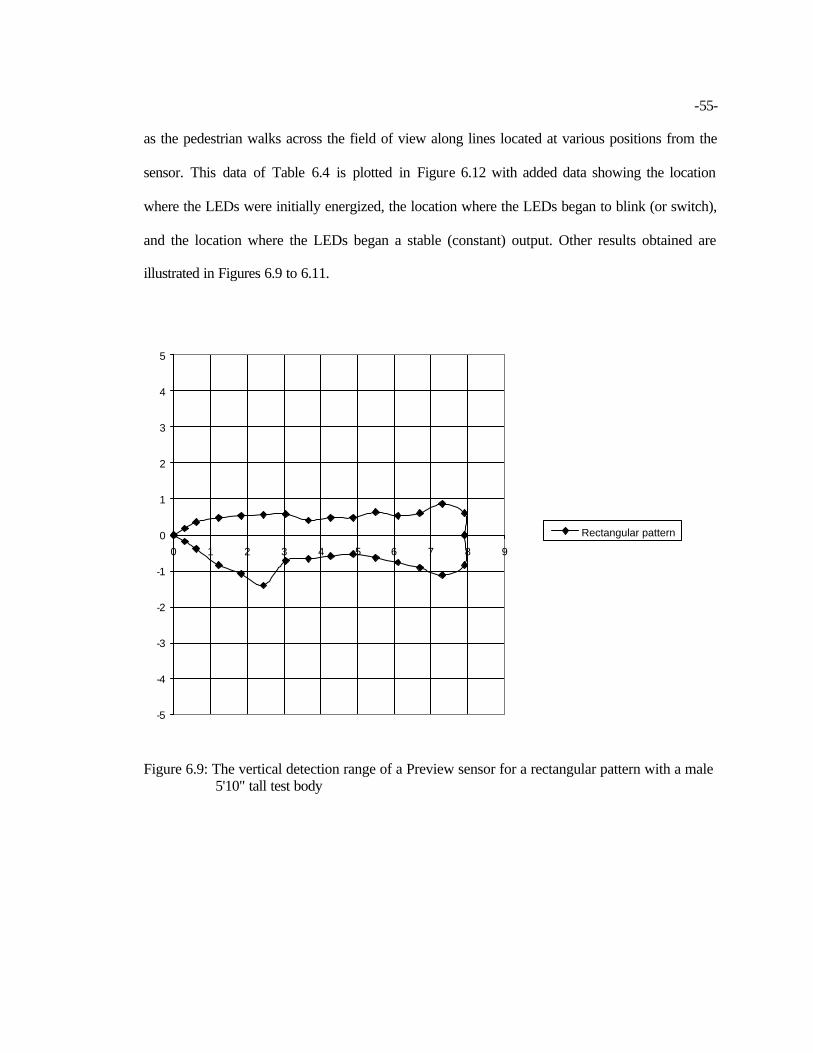
-55-
as the pedestrian walks across the field of view along lines located at various positions from the
sensor. This data of Table 6.4 is plotted in Figure 6.12 with added data showing the location
where the LEDs were initially energized, the location where the LEDs began to blink (or switch),
and the location where the LEDs began a stable (constant) output. Other results obtained are
illustrated in Figures 6.9 to 6.11.
-5
-4
-3
-2
-1
0
1
2
3
4
5
0 1 2 3 4 5 6 7 8 9
Rectangular pattern
Figure 6.9: The vertical detection range of a Preview sensor for a rectangular pattern with a male 5'10" tall test body
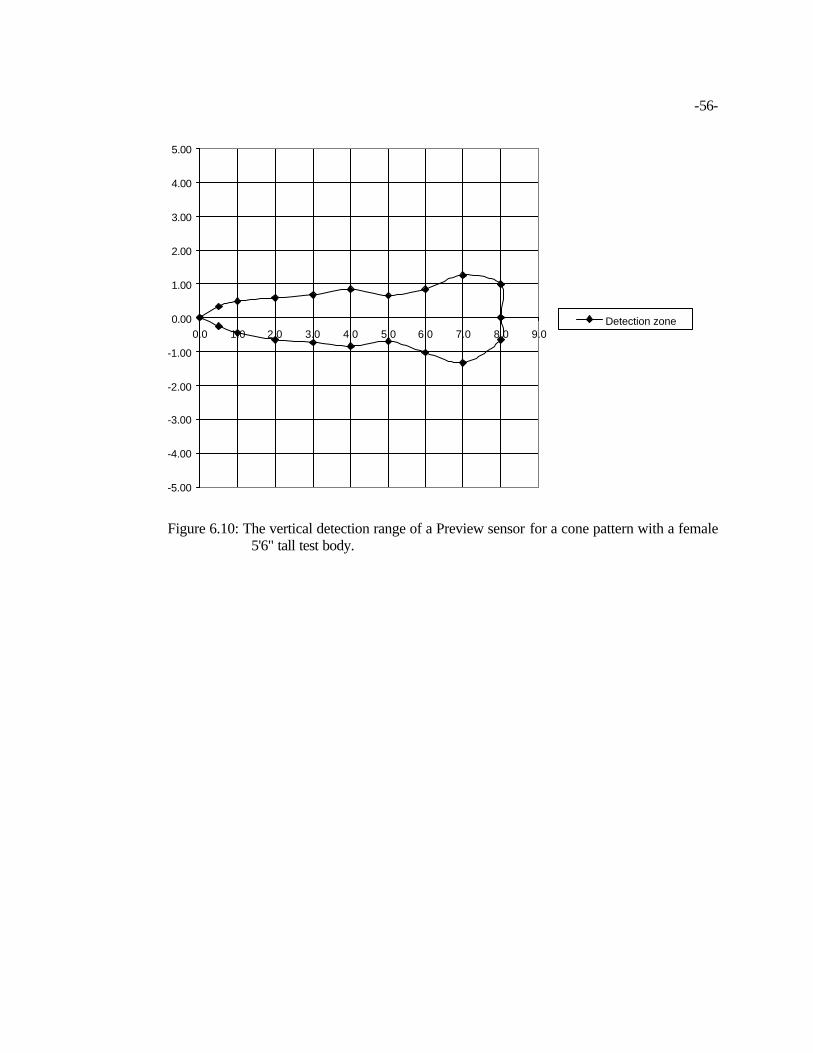
-56-
-5.00
-4.00
-3.00
-2.00
-1.00
0.00
1.00
2.00
3.00
4.00
5.00
0.0 1.0 2.0 3.0 4.0 5.0 6.0 7.0 8.0 9.0Detection zone
Figure 6.10: The vertical detection range of a Preview sensor for a cone pattern with a female 5'6" tall test body.
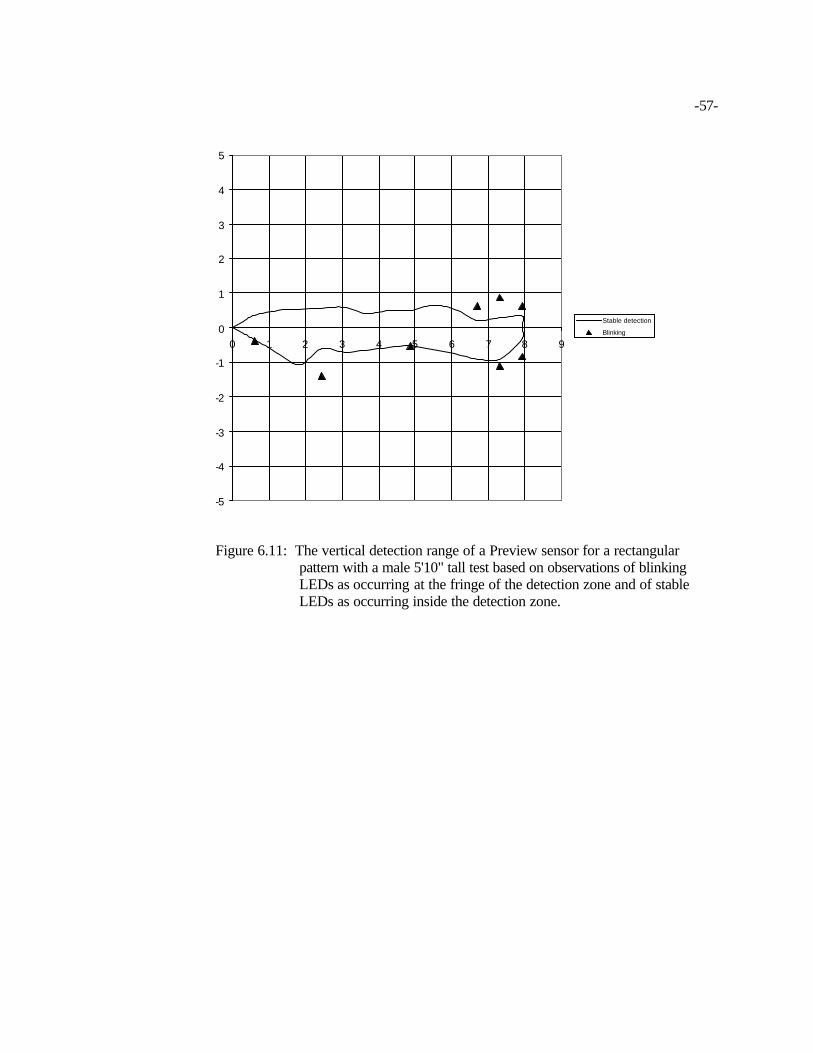
-57-
-5
-4
-3
-2
-1
0
1
2
3
4
5
0 1 2 3 4 5 6 7 8 9
Stable detection
Blinking
Figure 6.11: The vertical detection range of a Preview sensor for a rectangular pattern with a male 5'10" tall test based on observations of blinking LEDs as occurring at the fringe of the detection zone and of stable LEDs as occurring inside the detection zone.

-58-
-5.00
-4.00
-3.00
-2.00
-1.00
0.00
1.00
2.00
3.00
4.00
5.00
0.0 1.0 2.0 3.0 4.0 5.0 6.0 7.0 8.0 9.0
Stable detection
Blinking
Initial Detection zone
Figure 6.12: The vertical detection range of a Preview sensor for a cone pattern with a female 5'6" tall test body based on observations of blinking LEDs as occurring at the fringe of the detection zone and of stable LEDs as occurring inside the detection zone. The Initial Detection zone is the location of the first response.
Table 6.4
VERTICAL DETECTION RANGE NUMBER OF LEDS ACTIVATED FOR THE PREVIEW SENSOR FOR A CONE PATTERN AT POSITIONS SHOWN IN FIGURE 6.12
Position (meters) Number of LEDs ON at centerline
Number of LEDs ON to the left of centerline
Number of LEDs ON to the right of centerline
0.0 5 5 5
0.5 5 5 5
1.0 5 4 (stable), 5: switching from 4 to 5 5 2.0 5 4, 5 4, 5 3.0 4 3, 4 3, 4: switching from 3 to 4 4.0 3 3 3
5.0 2 2 (stable), 3: switching from 2 to 3 2 (stable), 3: switching 6.0 2 1, 2: switching from 1 to 2 then OFF 2 7.0 1 1 1 8.0 1 1 1
Beyond 8.0 0 0 0
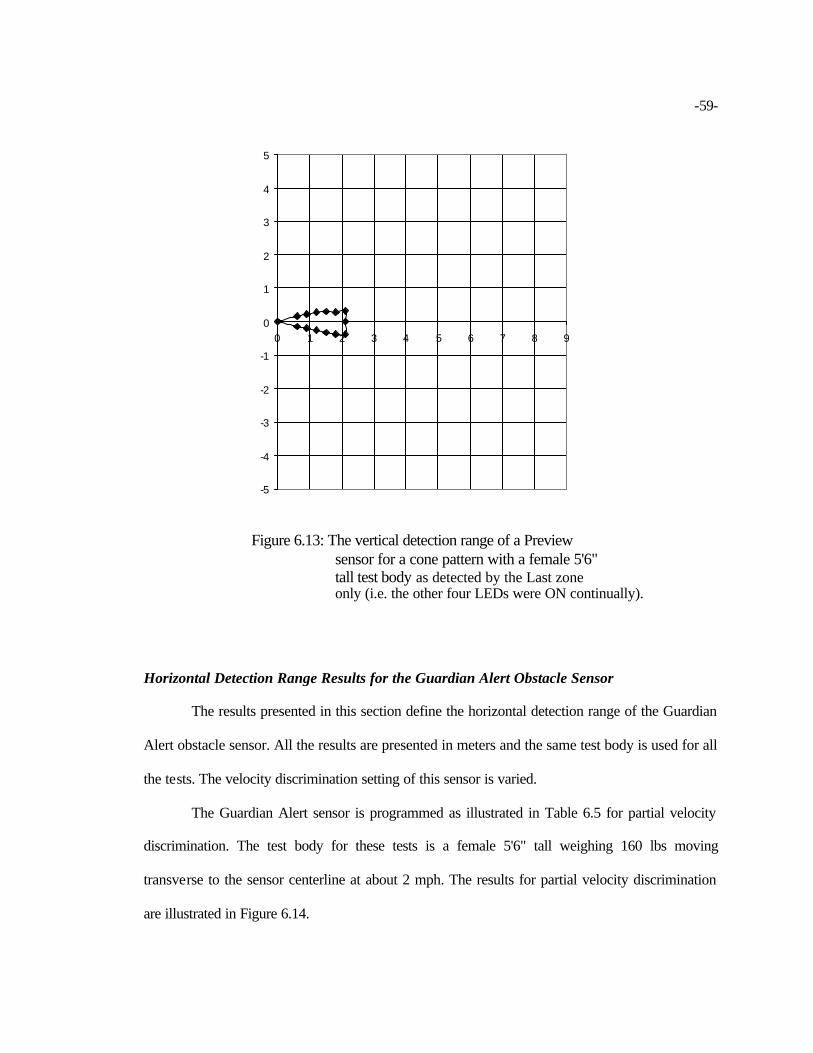
-59-
-5
-4
-3
-2
-1
0
1
2
3
4
5
0 1 2 3 4 5 6 7 8 9
Figure 6.13: The vertical detection range of a Preview sensor for a cone pattern with a female 5'6" tall test body as detected by the Last zone only (i.e. the other four LEDs were ON continually).
Horizontal Detection Range Results for the Guardian Alert Obstacle Sensor
The results presented in this section define the horizontal detection range of the Guardian
Alert obstacle sensor. All the results are presented in meters and the same test body is used for all
the tests. The velocity discrimination setting of this sensor is varied.
The Guardian Alert sensor is programmed as illustrated in Table 6.5 for partial velocity
discrimination. The test body for these tests is a female 5'6" tall weighing 160 lbs moving
transverse to the sensor centerline at about 2 mph. The results for partial velocity discrimination
are illustrated in Figure 6.14.
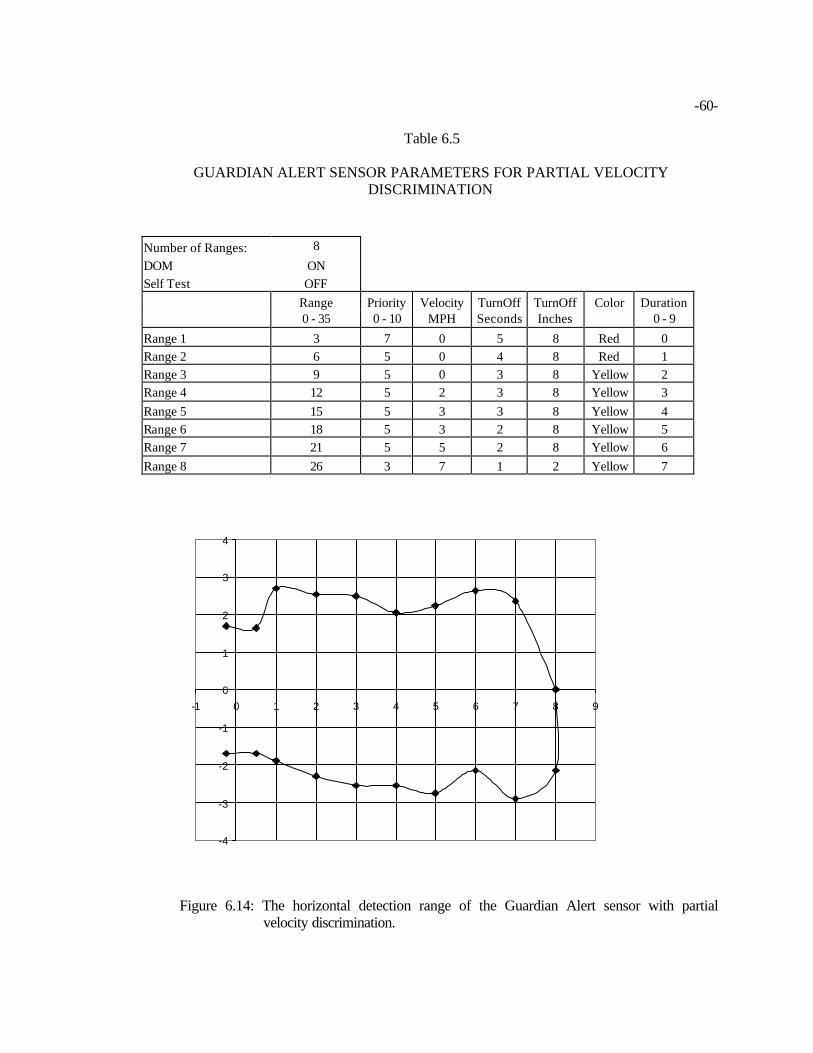
-60-
Table 6.5
GUARDIAN ALERT SENSOR PARAMETERS FOR PARTIAL VELOCITY DISCRIMINATION
Number of Ranges: 8 DOM ON Self Test OFF Range Priority Velocity TurnOff TurnOff Color Duration 0 - 35 0 - 10 MPH Seconds Inches 0 - 9
Range 1 3 7 0 5 8 Red 0 Range 2 6 5 0 4 8 Red 1 Range 3 9 5 0 3 8 Yellow 2 Range 4 12 5 2 3 8 Yellow 3 Range 5 15 5 3 3 8 Yellow 4 Range 6 18 5 3 2 8 Yellow 5 Range 7 21 5 5 2 8 Yellow 6 Range 8 26 3 7 1 2 Yellow 7
Figure 6.14: The horizontal detection range of the Guardian Alert sensor with partial velocity discrimination.
-4
-3
-2
-1
0
1
2
3
4
-1 0 1 2 3 4 5 6 7 8 9
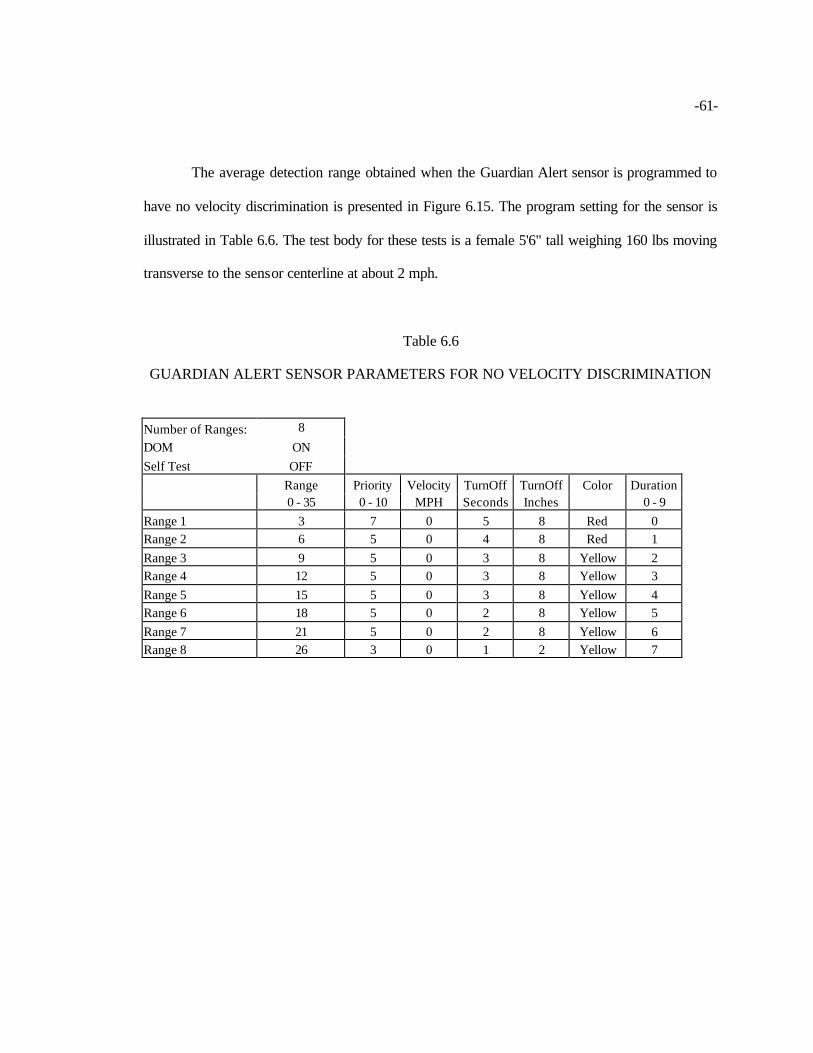
-61-
The average detection range obtained when the Guardian Alert sensor is programmed to
have no velocity discrimination is presented in Figure 6.15. The program setting for the sensor is
illustrated in Table 6.6. The test body for these tests is a female 5'6" tall weighing 160 lbs moving
transverse to the sensor centerline at about 2 mph.
Table 6.6
GUARDIAN ALERT SENSOR PARAMETERS FOR NO VELOCITY DISCRIMINATION
Number of Ranges: 8 DOM ON Self Test OFF Range Priority Velocity TurnOff TurnOff Color Duration 0 - 35 0 - 10 MPH Seconds Inches 0 - 9 Range 1 3 7 0 5 8 Red 0 Range 2 6 5 0 4 8 Red 1 Range 3 9 5 0 3 8 Yellow 2 Range 4 12 5 0 3 8 Yellow 3 Range 5 15 5 0 3 8 Yellow 4 Range 6 18 5 0 2 8 Yellow 5 Range 7 21 5 0 2 8 Yellow 6 Range 8 26 3 0 1 2 Yellow 7

-62-
-4
-3
-2
-1
0
1
2
3
4
0 1 2 3 4 5 6 7 8 9
Figure 6.15: The horizontal detection range of the Guardian Alert sensor with no velocity discrimination.
Vertical Detection Range Results for the Guardian Alert Obstacle Sensor
The results presented in this section define the vertical detection range of the Guardian
Alert obstacle sensor. All results are presented in meters. A female 5'6" tall weighing 160 lbs test
body is used for all tests. The results obtained when the Guardian Alert sensor is programmed to
have no velocity discrimination as illustrated in Table 6.6 are presented in Figure 6.16.

-63-
-5
-4
-3
-2
-1
0
1
2
3
4
5
0 1 2 3 4 5 6 7 8 9 10 11
Figure 6.16: The vertical detection range of the Guardian Alert sensor with no velocity discrimination.
Results Obtained from the Data Acquisition System
The automated data acquisition system has the ability to regulate the speed of the human
obstacle. The speed of the test could be obtained from the time elapsed and the distance traveled
by the test body during each test.
The Preview was tested with the DAQ system on the stand with the configuration shown
in Table 6.1. The test body for this test is a female 5'6" tall weighing 120 lbs. The results obtained
for the response of the LEDs at a distance 1 m away from the sensor are illustrated in Figure 6.17.
The Guardian Alert was tested with the DAQ system both on the stand and on the forklift with the
configuration shown in Table 6.6. The test body for these tests is a female 5'6" tall weighing 120
lbs. The results obtained for the response of the LEDs at a distance 0.5 m away from the sensor
when the Guardian Alert was mounted on the stand are illustrated in Figure 6.18.
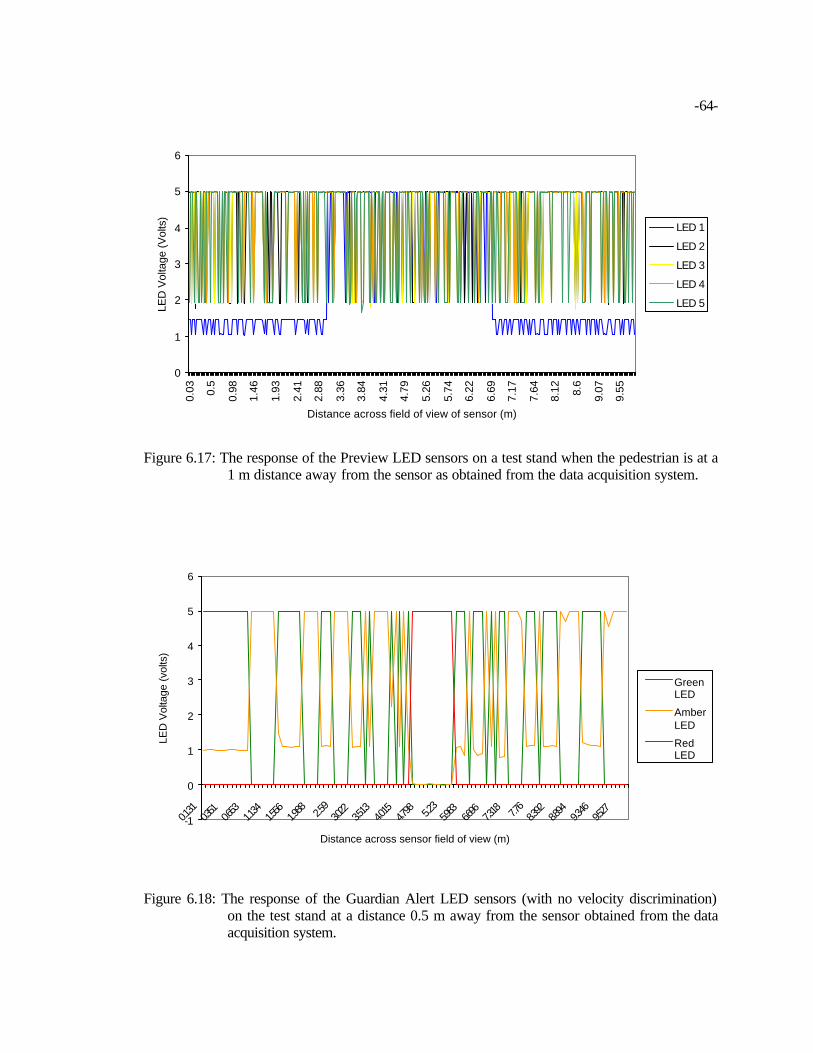
-64-
0
1
2
3
4
5
6
0.03 0.5
0.98
1.46
1.93
2.41
2.88
3.36
3.84
4.31
4.79
5.26
5.74
6.22
6.69
7.17
7.64
8.12 8.6
9.07
9.55
Distance across field of view of sensor (m)
LED
Vol
tage
(Vol
ts)
LED 1
LED 2
LED 3
LED 4
LED 5
Figure 6.17: The response of the Preview LED sensors on a test stand when the pedestrian is at a 1 m distance away from the sensor as obtained from the data acquisition system.
-1
0
1
2
3
4
5
6
0.131
0.351
0.653
1.134
1.556
1.988 2.5
93.0
223.5
134.0
154.7
98 5.23
5.983
6.696
7.318 7.7
68.3
928.8
949.3
469.5
27
Distance across sensor field of view (m)
LED
Vol
tage
(vol
ts)
GreenLED
AmberLED
RedLED
Figure 6.18: The response of the Guardian Alert LED sensors (with no velocity discrimination) on the test stand at a distance 0.5 m away from the sensor obtained from the data acquisition system.

-65-
Other Tests for Performance of Sensors
A plastic trashcan 32” by 12” was not detected at all by the Preview sensor at the sensor
settings presented in Table 6.2. For a 5’10” human test body weighing165 pounds, lying on the
floor parallel to the sensor centerline and about 2 meters away from the sensor, the Preview
sensor did not detected this body. A 5’10” body weighing165 pounds lying on the floor,
perpendicular to the sensor centerline and about 2 meters from the sensor, was not detected by the
Preview sensor. The Preview sensor did detect this body when hands and legs were raised. The
sensor was located 25 inches above the floor in a level orientation.
The influence of the angle of tilt of the sensors from the vertical plane normal to the
vehicle centerline is investigated. The first test consisted of tilting the top of the test stand
towards the rear until the sensors cease to detect the floor. Both the Preview and the Guardian
Alert sensors and detect the wooden floor at some inclination. The Preview sensor was raised to a
centerline height of 28.4 inches and tilted to an angle of tan-1 (3/28.4) to eliminate detection of the
floor. This test furnished the motivation for mapping the perimeter of the vertical field of view by
rotating the sensor 900 and having pedestrians move across the field of view.
For the 5’10” tall human test body weighing 165 pounds, lying on the floor on the truck
centerline and about 2 meters away from the sensor, the Guardian Alert sensor did not detected
this body. The Guardian Alert sensor did not detect this test body lying perpendicular to the
centerline and about 2 meters from the sensor. The Guardian Alert sensor did detect this body
when hands and legs were raised to about 20 inches above the floor. This sensor was mounted on
the rear of the counterweight surface at 1.15 m above the ground.
The influence of rain on the sensors is indicated by the results of a test with the sensors “looking
out” from the building doorway into a heavy rainstorm. The Guardian Alert detected raindrops
during the test without the presence of an obstacle, but it gave a higher pitch warning signal when

-66-
a human obstacle (a person) walked into the detection zone during this test. The Preview did not
respond to raindrops, but detected only the human obstacle who walked into the detection zone
during this test. Hence, the Guardian Alert gives a false signal but the Preview did not.
The Guardian Alert was locate on the side of a city street at a height 40 inches above
ground level and faced perpendicular to the direction of vehicles. The Guardian Alert at 85 ft
away from the roadway detected most trucks and the old cars, which were heavier than those
designed for the modern day use. The Guardian Alert obstacle sensor did not detect any vehicle at
95 ft away from this roadway. The detection zone of the Guardian Alert sensor for a human test
body 5’ 10” tall, weighing 165 lbs extended 28 ft away from the sensor. This test was not
conducted for the Preview.
The Guardian Alert sensor was mounted on the lift truck with the center of the sensor 1.1
m above the ground level. This test was performed in a sheet metal building with concrete floor.
The sensor was programmed to have no velocity discrimination as illustrated in Table 6.6. The
test body for the test was a male 5'10" tall weighing 165 lbs. For this human obstacle the length of
the detection zone was 14.588 m. This same test was conducted at a gymnasium with wood floor
and brick walls with the same test body and the sensor mounted at the same height of 1.1 m. A
comparison of the results obtained for the sheet metal building and the gymnasium is illustrated
in Figure 6.19 and shows the detection zone for this human obstacle to be roughly 30% longer
and 100% wider in the metal building. The detection range to the left of the sensor was not
completed in the metal building due to the limitation in the size of the test site. A forklift truck
that drove into the field of view of the Guardian Alert was detected at about twice the detection
range of the human obstacle.
During the course of the tests, it was observed that the Guardian Alert sensor was
sensitive to vibration. This observation led to the quantitative test of the Guardian Alert sensor for
reaction to vibration. The test was performed using a mechanical shaker with known input
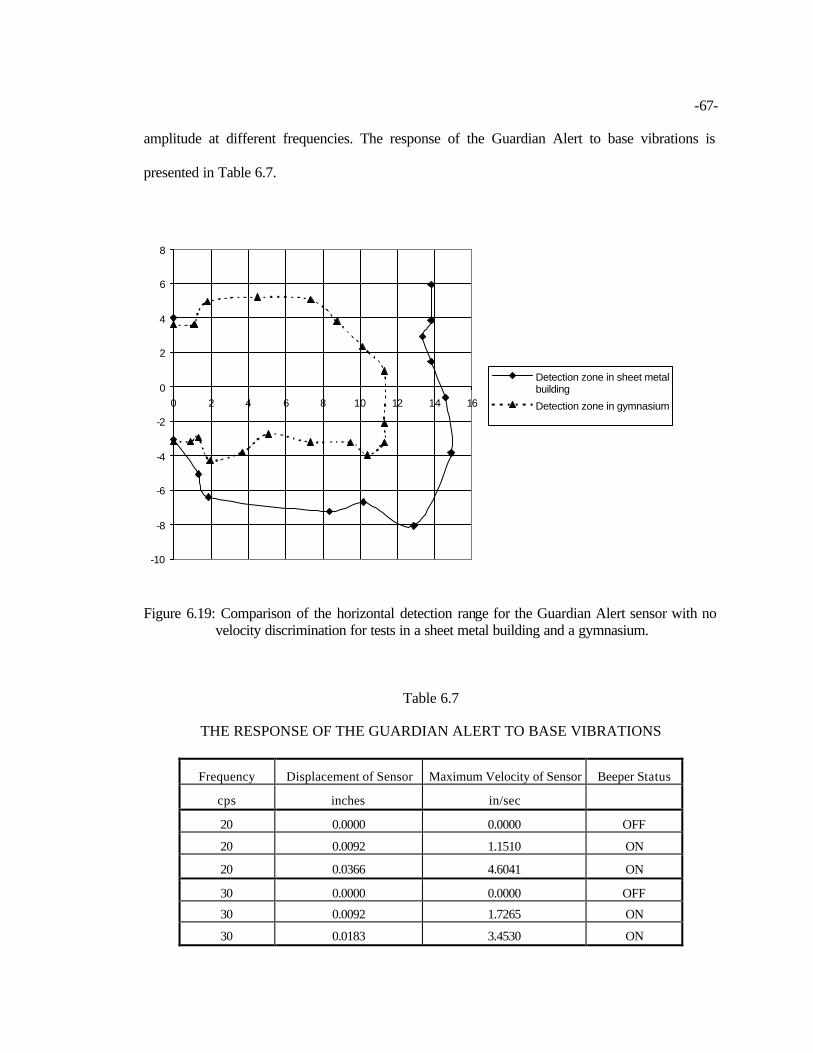
-67-
amplitude at different frequencies. The response of the Guardian Alert to base vibrations is
presented in Table 6.7.
-10
-8
-6
-4
-2
0
2
4
6
8
0 2 4 6 8 10 12 14 16
Detection zone in sheet metalbuilding
Detection zone in gymnasium
Figure 6.19: Comparison of the horizontal detection range for the Guardian Alert sensor with no velocity discrimination for tests in a sheet metal building and a gymnasium.
Table 6.7
THE RESPONSE OF THE GUARDIAN ALERT TO BASE VIBRATIONS
Frequency Displacement of Sensor Maximum Velocity of Sensor Beeper Status
cps inches in/sec
20 0.0000 0.0000 OFF
20 0.0092 1.1510 ON
20 0.0366 4.6041 ON
30 0.0000 0.0000 OFF
30 0.0092 1.7265 ON
30 0.0183 3.4530 ON

-68-
CHAPTER VII
CONCLUSONS AND RECOMMENDATIONS
The size, shape, composition and position of the obstacle and the position and orientation
of the of obstacle sensor on the lift truck will affect the performance of obstacle sensors. The
results obtained from this study help quantify how these factors and other considerations will
affect the performance of obstacle sensors when used on lift trucks in reverse travel. The results
of this study will aid in the positioning of these sensors on the truck to reduce blind spots and
false warning signals. Although, as the results of this study demonstrate, the performance
limitations of the sensors create a condition where blind spots and false signals cannot be
completely eliminated.
The Influence of Sensor Position on Detection Range
The location of the sensor on the lift truck will influence the detection range in both the
horizontal and vertical planes. Some of the considerations in locating sensors on a lift truck are
illustrated in the following comments for a lift truck TS-300S. This illustration only considers the
field of view and does not consider the design constraints.
For the specific lift truck tested, the vertical location for obstacle sensors should not be on
top or at the bottom of the counterweight. If the obstacle sensor is placed at the bottom of the
counterweight, more false alarms will be caused by the ground. If the sensor is placed on top of
the counterweight, it will be blind to obstacles immediately behind the truck even when the
obstacle sensor is tilted. The position of the obstacles that cannot be detected by

-69-
the Preview and the Guardian Alert, when the sensor is placed on top of the counterweight of the
lift truck are illustrated in Figures 7.1 and 7.2. Desirable vertical positions for the sensors are
illustrated in Figures 5.3 and 5.4.
The location of the sensors in the horizontal plane should provide coverage of the
rectangular (180 angle) area across the width of the rear of the truck and should provide coverage
of the vehicle’s path during the sharp turns typical of this class of vehicles. The Preview may
need three or more sensors (depending on type of truck) at different positions in order to cover
the full width of the truck, since it has an average angle of detection of 1000. To achieve a
detection pattern that only covers the width of the truck, one Guardian Alert sensor may be
sufficient due to its ability to cover 1800 angle of detection, but one sensor will not be sufficient
to cover the width of the field of view for sharp turns in reverse. It is recognized that the necessity
to arrange multiple sensors to cover areas, which may be entered by the truck during normal
maneuvers may be impractical to implement in design. Figures 5.3 and 5.4 show the horizontal
field of view of three Preview sensors and one Guardian Alert sensor during reverse travel. These
figures also show the position of the truck after a 900 turn in green to indicate the inadequacy of
the sensors warning of obstacles in the path before starting the turning maneuver and areas truck
may enter during normal maneuvers. (This study only considers sensors at the rear of the truck.
Therefore, it would not warn for a pedestrian standing beside the truck when the truck stops
ahead travel an initiates reverse travel with a turning maneuver. The effect of overlapping
detection ranges of multiple sensors was not investigated.
The Preview obstacle sensor should be installed at a height not less than 0.33 meters
above ground level with the settings of the sensor configured to a cone pattern, this pattern seems
to be the most appropriate. The choice of this pattern is determined by the relatively uniform
shape of the perimeter of the field of view obtained from tests, which reduces the inconsistencies
of detection created by the irregular shape at the base of the vertical detection range.
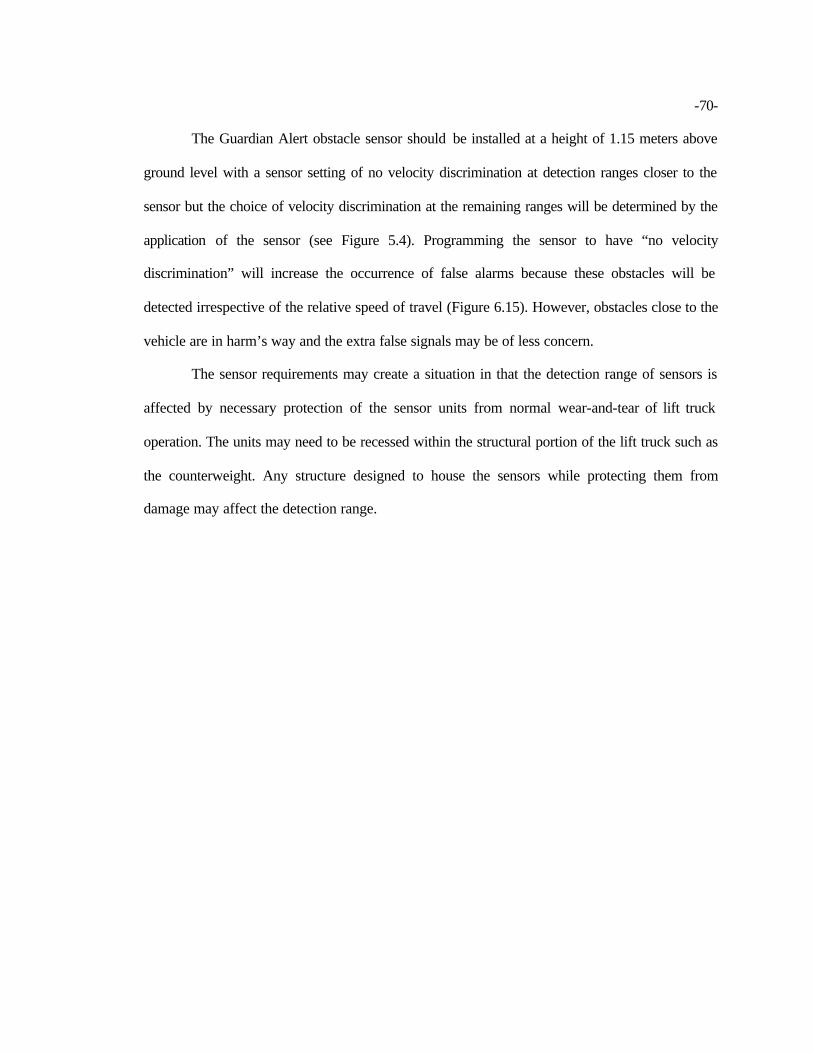
-70-
The Guardian Alert obstacle sensor should be installed at a height of 1.15 meters above
ground level with a sensor setting of no velocity discrimination at detection ranges closer to the
sensor but the choice of velocity discrimination at the remaining ranges will be determined by the
application of the sensor (see Figure 5.4). Programming the sensor to have “no velocity
discrimination” will increase the occurrence of false alarms because these obstacles will be
detected irrespective of the relative speed of travel (Figure 6.15). However, obstacles close to the
vehicle are in harm’s way and the extra false signals may be of less concern.
The sensor requirements may create a situation in that the detection range of sensors is
affected by necessary protection of the sensor units from normal wear-and-tear of lift truck
operation. The units may need to be recessed within the structural portion of the lift truck such as
the counterweight. Any structure designed to house the sensors while protecting them from
damage may affect the detection range.

-71-
Figure 7.1: The Preview obstacle sensor with a conical field of view mounted on top of the counterweight of truck TC-300S.
Detection Zone(Vertical)
Ground Level
Objects in this area will not be detected
Objects in this area will not be detected
Detection Zone(Vertical)
TC-300S Truck (Side view)
Ground Level
Tilt angle = 3

-72-
Figure 7.2: The Guardian Alert obstacle sensor with rectangular field of view mounted on top of the counterweight of truck TC-300S.
TC-300S Truck (Side view) Objects in this area will not be
detected
Detection Zone(Vertical)
Detection Zone(Vertical)
Objects in this area will not be detected
TC-300S Truck (Side view)
Tilt angle = 4

-73-
Stopping Distances
The approximate stopping distance at each initial truck speed can be obtained from
Figure 3.5. The results obtained show that these obstacle sensors are not effective at the
maximum speed (16.6 mph) of the lift truck. At speeds above 8.0 mph, if the maximum range
setting of the obstacle sensor is 8m, the truck will impact a detected obstacle before the operator
can stop the truck, assuming sensor response time is 0.2 sec, operator perception time is 0.75 sec
operator reaction time is 0.75 sec and the drawbar drag is 25. This data is theoretical while
assuming correct and accurate performance of the sensor system. Irregular pattern of the detection
zone of the sensor, unreliable detection of some objects, inconsistent performance of operators,
and some other factors may combine to create situations which may greatly reduce the maximum
speed to prevent impact at this range setting.
The Influence of Composition, Size and Orientation on Detection Range
The detection range obtained is greater for a larger test body than a smaller one due to the
higher reflectivity of the larger test body. It may be concluded that the size of the detection range
will increase as the size of obstacle increases. Obstacles projecting larger surface area to the
sensor field of view will be detected at farther distances than smaller areas due to the fact that
larger surface area produces greater reflectivity. Therefore, the response time of the sensor will
increase as the surface area of the obstacle decreases.
The composition of the obstacle also affects the detection range. Wood and plastic are not
good reflectors of radar emissions: Human beings are good reflectors, but metal is even better.
The orientation of obstacles will affect the detection range. The sensor response time
increases when the wide side of the test body is turned parallel to the sensor field of view. The

-74-
detection range decreases when the wide side of the test body is placed parallel to the sensor field
of view.
Environmental Effects on Obstacle Sensors
The results show that the Guardian Alert is sensitive to base vibration with high
amplitudes of vibration, therefore this sensor should be mounted rigidly on a rigid base such as
the counterweight. The Guardian Alert detects raindrops as distant obstacles, while the Preview
does not detect the rain. This implies that false alarms will occur with the Guardian Alert during a
rainfall. Tests under other environmental factors such as dust, snow etc. were not done.
Design and Settings of Obstacle Sensors
The detection range changes for different detection patterns for the Preview obstacle
sensor.
The LED displays of both the Preview and the Guardian Alert sensors have good
visibility. The warning signals of both the Preview and Guardian alert are audible, that of the
Guardian Alert might be too loud for some applications. The tests show that only the RED and
AMBER LED display may be configured and activated within certain range of the field of view
of the Guardian Alert obstacle sensor, the GREEN LED is activated once an obstacle is detected
within the maximum possible detection range of the Guardian Alert sensor.
Both the Preview and the Guardian Alert are sensitive to voltage variation; 12Volts was
used during the experimental tests. Both the Preview and the Guardian Alert require a minimum
of 10 volts for them to function properly.
Durability of Obstacle Sensors
The wiring of the system is very important. The wirings of the sensors should be strong,
durable and easily accessible. The application of the sensors is on a lift truck where there is much

-75-
vibration and rough terrain. The wiring of the Preview system is well designed, easily accessible,
durable and therefore suitable for industrial lift truck application. A more rugged wiring design is
needed by the Guardian Alert for lift truck application.
Closure
Safety of personnel is of primary concern. The operator of the lift truck is the dominant
factor in providing a safe environment. The operator’s skills, alertness and responsiveness, and
vigilance are key factors. Skills may be improved by training, while alertness and responsiveness
may be enhanced by life style. Also, the operator must use vigilance to protect those within his
working path by path by keeping a clear view of the path of travel.
While obstacle sensors may be located on a lift truck to alert the operator of the presence
of an obstacle within its path during reverse travel or turning, the sensor may augment the
operator’s visual sense in the dynamic environment by promoting the operator to apply extra
caution when a warning occurs. However, the net effect on the safety of the environment can only
be evaluated under strictly defined and limited operating conditions in specific applications. The
RADAR type sensors of this study may be set to provide an alarm for warnings to occur at a set
distance with some variations due to size of obstacles; however, obstacles of other sizes and
compositions will initiate the alarm at significantly different distances.
For a given truck, the sensor locations and settings for a specific application should be
coordinated with the stopping distance required for the operating speed to provide the desired
field of view. The false signals may be excessive, making the device ineffective due to the
frequency of the lift truck being in close proximity to other vehicles, equipment, aisles, etc.
encountered in applications such as warehouses, lumberyards, and steel mills. A compromise
must be made to limit sensor range setting and size of field of view to limit number of false
signals due to walls, passing vehicles, etc. The vehicle speed may be limited by the sensor range

-76-
and stopping distance. Because this study was based on static tests, it is recommended that the
sensors be mounted on a lift truck as proposed and the response of drivers recorded to identify
areas for added development, and to investigate the effectiveness of these sensors under actual
conditions.
-77-
REFERENCES
Barger E. L., et. al. “Tractors and their Power Units.” John Wiley & Sons, New York, 1952, pp. 383.
Dilich, Michael A. and Kopernik, D., “Evaluating Driver Response to a Life-Threatening
Emergency.” Safety Brief, Vol. 20, No. 4, June 2002. Dilich, Michael A., Kopernik, D., Goebelbecker, John M., “Evaluating Driver Response to a
Sudden Emergency: Issues of Expectancy, Emotional Arousal and Uncertainty.” Safety Brief, Vol. 20, No. 4, June 2002.
Gandhi, O. P., et. al. “IEEE Standard for Safety Levels with Respect to Human Exposure to
Radio Frequency Electromagnetic Fields, 3 kHz to 300 GHz.” IEEE std C95.1, April 16, 1999.
Girardi, Walter J., “Limitations of Ultrasonic Obstacle Sensors for Industrial Lift Truck Applications.” SAE Technical Paper,Series 961809, 1996.
International Standard Organization. Earth-moving machinery – Machine-mounted forward and
reverse audible warning alarm – Sound test method. International Standard Organization 1989 5th edition.
James, Laney. “How to Make Forklift Truck Safety Uplifting.” National Safety News, National
Safety Council, Chicago, 1984. Johnson, Guy A., Griffin, Russell E. and Laage, Linneas W. “Improved Backup Alarm
Technology for Mining Equipment.” United States Bureau of Mines Information Circular 9079, 1986.
Miller, Barrett C. “Forklift Safety by Design.” http://safety-engineer.com 1998
National Council on Radiation Protection and Measurements (NCRP), “Biological Effects and Exposure Criteria for Radiofrequency Electromagnetic Fields.” NCRP Report No. 86, April 1986.
National Council on Radiation Protection Measurements. Biological Effects and Exposure Criteria for Radiofrequency Electromagnetic Fields. National Council on Radiation Protection Measurements 1986.
National Council on Radiation Protection Measurements. Possible Health Effects of Exposure to
Residential electric and Magnetic Fields. National Academy Press 1997.
-78-
National Research Council, “Possible Health Effects of Exposure to Residential Electric and Magnetic Fields.” National Academy Press, Washington, D.C. 1997.
Ruff, Todd M. “Test Results of Collision Warning Systems on Off-Highway Dump Trucks:
Phase 2.” National Institute for Occupational Safety and Health (NIOSH) Report of Investigations 9654, U.S. Department of Health and Human Services, Pittsburgh Research Laboratory, February 2001.
Society of Automotive Engineers (SAE). “Discriminating Back-up Alarm System Standard
J1741.” SAE Standard, June 1999, pp 2-8. Society of Automotive Engineers. Alarm – Backup – Electronic Laboratory Performance Testing.
Society of Automotive Engineers 1993. Safety Drive Training (SDT) Australia Pty Ltd. (http://www.sdt.com.au/stoppingdistance.htm),
March 9, 2002. Taborek, Jaroslav J., “Machine Design.” Part 11 – Dynamics of Braking, Mechanics of Vehicles,
November 14, 1957. Taborek, Jaroslav J., “Machine Design.” Part 12 – Braking Performance Limits, Mechanics of
Vehicles, November 28, 1957. Taborek, Jaroslav J., “Machine Design.” Part 5 – Motion of Resisting Forces, Mechanics of
Vehicles, July 25, 1957. The American Society of Mechanical Engineers. “Safety Standards for Low Lift and High Lift
Trucks.” ASME B56.1-1993 February 7, 1994 pp. 4, 32-33. U.S. Federal Communications Commission, “Questions and Answers about Biological Effects
and Potential Hazards of Radiofrequency Electromagnetic Fields.” Federal Communications Commission, Office of Engineering and Technology, OET Bulletin 56 4th ed. August 1999.
U.S. Federal Communications Commission, “Understanding The FCC Part 15 Regulations
for Low Power, Non-Licensed Transmitters” Federal Communications Commission, Office of Engineering and Technology, OET Bulletin 63 October 1993.
U.S. Federal Communications Commission, “Evaluating Compliance with FCC Guidelines for
Human Exposure to Radiofrequency Electromagnetic Fields.” Federal Communications Commission, Office of Engineering and Technology, OET Bulletin 65 August 1997.

-79-
APPENDIX
LABVIEW PROGRAM FOR GENERATING AUTOMATED DATA
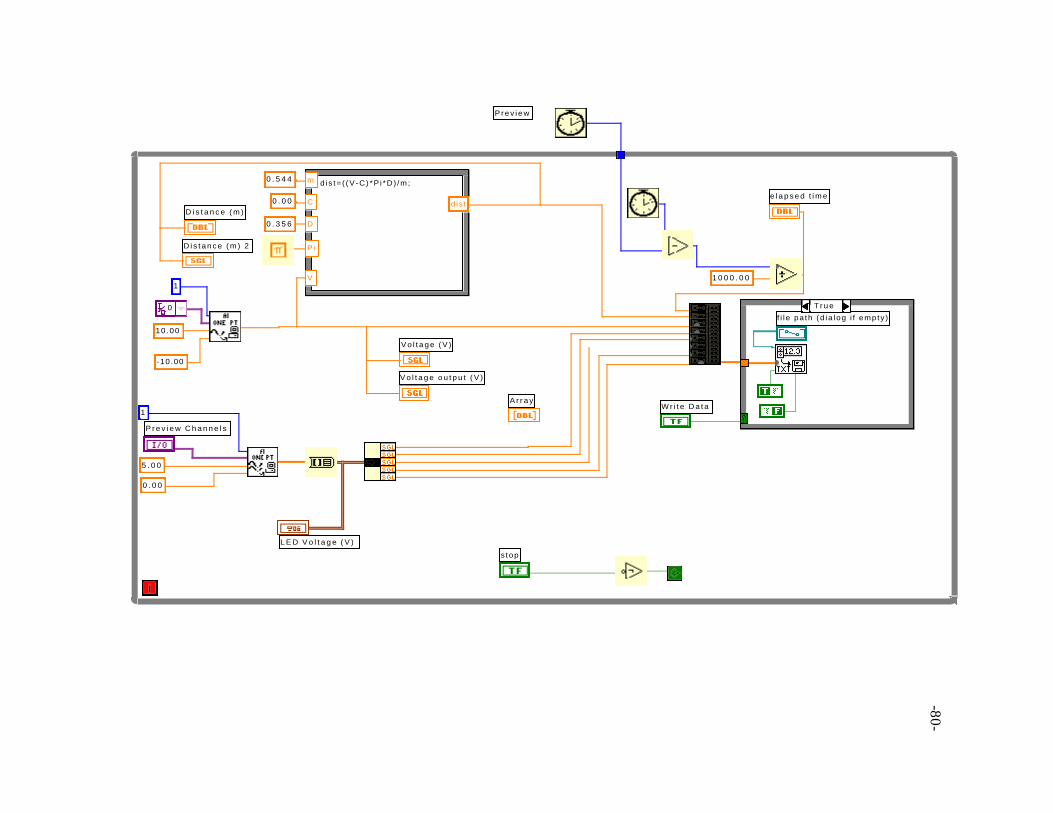
-80-
Prev iew
1
0
10 .00
-10.00
d is t= ( (V -C) *P i *D) /m;
P i
D
dis t
m
C
V
0 . 0 0
0 . 5 4 4
1 0 0 0 . 0 0
1
5 . 0 0
0 . 0 0
e l a p s e d t i m e
V o l t a g e o u t p u t ( V )
V o l t a g e ( V )
D i s t a n c e ( m ) 2
D i s t a n c e ( m )
P r e v i e w C h a n n e l s
L E D V o l t a g e ( V )
s top
0 . 3 5 6
f i l e pa th (d ia log i f empty )
T r u e
W r i t e D a t aA r r a y