statistical characterization of gps signal-in-space … characterization of gps signal-in-space...
TRANSCRIPT

Statistical Characterization ofGPS Signal-In-Space Errors
Liang Heng, Grace Xingxin Gao, Todd Walter, and Per Enge,Stanford University
BIOGRAPHY
Liang Heng is a Ph.D. candidate under the guidance of Pro-fessor Per Enge in the Department of Electrical Engineeringat Stanford University. He received his B.S. and M.S. de-grees in electrical engineering from Tsinghua University,Beijing, China. His current research interests include GNSSintegrity and modernization.
Grace Xingxin Gao, Ph.D., is a research associate in theGPS lab of Stanford University. She received the B.S. de-gree in mechanical engineering and the M.S. degree in elec-trical engineering, both at Tsinghua University, Beijing,China. She obtained the Ph.D. degree in electrical engineer-ing at Stanford University. Her current research interestsinclude GNSS signal and code structures, GNSS receiverarchitectures, and interference mitigation. She has receivedthe Institute of Navigation (ION) Early Achievement Award.
Todd Walter, Ph.D., is a senior research engineer in theDepartment of Aeronautics and Astronautics at StanfordUniversity. He received his Ph.D. from Stanford and iscurrently working on the Wide Area Augmentation System(WAAS), defining future architectures to provide aircraftguidance, and working with the FAA and GPS Wing on as-suring integrity on GPS III. Key early contributions includeprototype development proving the feasibility of WAAS,significant contribution to WAAS MOPS, and design ofionospheric algorithms for WAAS. He is a fellow of theInstitute of Navigation.
Per Enge, Ph.D., is a Professor of Aeronautics and As-tronautics at Stanford University, where he is the Kleiner-Perkins, Mayfield, Sequoia Capital Professor in the Schoolof Engineering. He directs the GPS Research Laboratory,which develops satellite navigation systems based on theGlobal Positioning System (GPS). He has been involved inthe development of WAAS and LAAS for the FAA. Per hasreceived the Kepler, Thurlow and Burka Awards from theION for his work. He is also a Fellow of the ION and theInstitute of Electrical and Electronics Engineers (IEEE). He
received his PhD from the University of Illinois in 1983.
ABSTRACT
For most Global Positioning System (GPS) standard posi-tioning service (SPS) users, real-time satellite orbits andclocks are derived from predicted ephemeris and clockparameters in broadcast navigation messages. Broadcastephemeris and clock errors, the differences between thebroadcast orbits/clocks and the truth, account for a dominantportion of signal-in-space (SIS) errors. Traditionally, SISuser range errors (UREs) is assumed to follow a zero-meannormal distribution with standard deviation represented bythe broadcast user range accuracy (URA). In addition, ad-vanced receiver autonomous integrity monitoring (ARAIM)may rely on an assumption that UREs of different satellitesare uncorrelated. This paper is intended to examine theseassumptions and give a thorough characterization of coreSIS error behavior based on the statistics of recent data.
The radial, alongtrack, and crosstrack ephemeris errors andclock errors are computed by comparing the broadcast ephe-merides/clocks with the precise ones, followed by the gener-ation of instantaneous SIS UREs, global-average SIS UREs,and worst-case SIS UREs. Anomalous satellite behaviorsare identified and excluded by an outlier filter. Robust statis-tics techniques are implemented to avoid the impact of sta-tistical outliers.
An analysis of long-term stationarity is first carried out todetermine the range of useful data. The SIS errors are thencharacterized with respect to mean and standard deviation,spatial correlation, normality, relation between rms UREand URA, and correlation among different satellites. Theresults show that mean of SIS errors are nonzero for severalsatellites; the radial errors, alongtrack errors, and clock er-rors are relatively strongly correlated; UREs usually have anon-Gaussian distribution; different satellites have differentinterpretation of URA; and the UREs of different satellitesare slightly correlated.

INTRODUCTION
The Global Positioning System (GPS) is so far the mostwidely used space-based global positioning, navigation, andtiming system. GPS works on the principle of trilateration,in which the measured distance from a user receiver to atleast four GPS satellites in view as well as the positionsand clocks of these satellites are the prerequisites for theuser receiver to fix its exact position [1]. For most GPSstandard positioning service (SPS) users, real-time satellitepositions and clocks are derived from ephemeris parametersand clock correction terms in navigation messages broadcastby GPS satellites. The GPS Control Segment routinely gen-erates navigation message data on the basis of a predictionmodel and the measurements at more than a dozen monitorstations [2]. The differences between the broadcast eph-emerides/clocks and the truth account for signal-in-space(SIS) errors. SIS errors are mainly contributed by the errorsdue to the
• Space Segment, such as satellite acceleration uncertainty,clock instability, satellite antenna variation [3], and sig-nal imperfection [4], and the errors due to the
• Control Segment, such as the estimation errors, predic-tion errors, and curve fit errors in broadcast ephemeridesand clocks [5].
Therefore, SIS errors are difficult to describe because theyare neither purely stochastic nor purely deterministic.
However, characterization and estimation of the core SISerror behavior are of vital importance for GPS SIS integrity.For example, receiver autonomous integrity monitoring(RAIM) (or Advanced RAIM (ARAIM) [6]) and GPS IIIintegrity may rely on the following assumptions:
• Mean of SIS errors is close to zero;
• User range errors (UREs) are described or overboundedby a normal distribution;
• Expected root mean square (rms) UREs are representedby broadcast user range accuracy (URA);
• UREs of different satellites are uncorrelated.
There have been some prior work studying GPS SIS errors[7–11], but the most of them did not focus on examining theabove assumptions. Employing the similar philosophy andmethodology as our previous paper that studies anomalousSIS error behavior [12, 13], this paper will examine theabove assumptions and give a thorough characterization ofcore SIS error behavior based on the statistics of recentdata. For the rest of this paper, we start with a descriptionof the methodology and then elaborate on the statisticalcharacterizations.
Figure 1. Procedure for computing SIS errors.
METHODOLOGY
Computation of ephemeris and clock errors
GPS ephemeris/clock errors are computed by comparingthe broadcast ephemerides/clocks with the precise, post-processed ones. As shown in Figure 1, broadcast navigationmessage data are obtained from International GNSS Service(IGS) [14]. Our well-established data cleansing softwareis employed to generate validated navigation messages thatare free of data logging errors [12, 13]. Precise ephemeri-des/clocks from National Geospatial-Intelligence Agency(NGA) are available every 15 minutes synchronized to GPStime [15]. NGA precise ephemerides/clocks are regardedas truth because they are an order of magnitude or moreaccurate than the broadcast ephemerides/clocks [16].
The validated navigation messages are used to propagatebroadcast orbits/clocks at 15-minute intervals that coincidewith the precise ephemerides/clocks. The differences be-tween broadcast and precise ephemerides are the ephemeriserrors, which are represented in the reference frame withrespect to the space vehicle: R—radial, A—alongtrack, andC—crosstrack. The differences between broadcast and pre-cise clocks are the clock errors, denoted by T in meters.
SIS URE metrics
GPS SIS URE is the pseudorange inaccuracy due to ephem-eris and clock errors. For an arbitrary set of ephemeris andclock errors (R, A,C,T ), GPS receivers at different locationson the Earth may experience different SIS UREs. Accord-ingly, the following four SIS URE metrics are considered inthis paper:• Instantaneous SIS UREs computed for 20 points spread
evenly on the earth (Figure 2);• Global average rms SIS URE given by [5]√
(0.98R − T )2 + 0.1412(A2 + C2); (1)

Figure 2. Instantaneous UREs are computed for 20 points spreadevenly on the earth, which are derived from the verticesof a regular dodecahedron.
• Orbit-error-only rms SIS UREO defined as√(0.98R)2 + 0.1412(A2 + C2); (2)
• Worst-case SIS URE defined as
max|θ|≤13.88◦
(R cos θ − T +√
A2 + C2 sin θ), (3)
where max(x) maximizes |x| and return the correspond-ing x.
Worst-case URE can be computed either numerically frominstantaneous UREs or analytically from (R, A,C,T ) [12].In this paper we use the latter way.
Outlier filter
Not all the SIS errors computed above should be includedin the statistics. For example, GPS receivers usually do notuse broadcast ephemerides/clocks that are set unhealthy orolder than 4 hours. The GPS SPS Performance Standard[5] has defined a SIS not-to-exceed URE (NTE) tolerance:4.42 times URA upper bound (UB)1 Accordingly, the SISerrors that meet any one of the following conditions are notincluded in our analysis:• The corresponding broadcast navigation message is un-
healthy, i.e.,– Health status word is not zero, or– URA is greater than 48 meters [5];
• The corresponding broadcast navigation message is notin its 4-hour fit interval;
• The corresponding precise ephemeris/clock is missingor marked “event”;
• The corresponding worst-case URE exceeds the NTEtolerance.
For a thorough discussion of these criteria and the anoma-lous SIS behavior in the past, please refer to [12, 13].
1For a normal distribution, ±4.42-sigma is equivalent to 10−5 tail prob-ability. Although the UREs generally have a heavier tail than a normaldistribution, the NTE tolerance is still a conservative threshold for out-lier filter because URA UB is at least two times larger than the standarddeviation of UREs.
Robust statistics
Because SIS errors do not necessarily have a normal distri-bution, the traditional statistics such as sample mean andsample standard deviation may be affected by some extremesamples or remaining outliers2. To cope with this problem,we use trimmed mean (also referred to as truncated mean)to measure the central tendency. A trimmed mean functionmeanα(·) is the mean after discarding the samples at the50α% high end and 50α% low end. Analogously, a trimmedstandard deviation function is defined as
stdα(X) =
√meanα
((X −meanα(X))2). (4)
In fact, trimmed mean is a compromise between samplemean and sample median, and trimmed standard deviation acompromise between sample standard deviation and samplemedian absolute deviation. In this paper, we use a smallvalue α = 0.01, i.e., use 99% of the data, to make the resultclose to the mean or the standard deviation.
Normality metric
SIS errors are usually described or overbounded by a normaldistribution. Hence, it is important to know how close thereal errors are to normally distributed. Popular statisticalhypothesis tests of normality, such as Shapiro-Wilk test [17],Lilliefors test [18], and Jarque-Bera test [19], are so strictthat they usually reject the null hypothesis that the SIS errorsamples comes from a distribution in the normal family.Even worse, these tests can not return a meaningful p-valueto tell how far the samples are from normally distributed.Therefore, kurtosis is proposed to to quantify normality.Kurtosis (or excess kurtosis) is defined as
γ(X) =E(X − EX)4(E(X − EX)2)2 − 3. (5)
A normal distribution has kurtosis γ = 0; a sub Gaussiandistribution with a lighter tail usually has kurtosis γ < 0; asuper Gaussian distribution with a heavier tail usually haskurtosis γ > 0.
Since kurtosis involves 4th-order statistics, it relies on ex-treme values but is vulnerable to statistical outliers. There-fore, we use a two-step outlier filter. In the first step, thesamples with the absolute value greater than 30 meters arediscarded. 30 meters is greater than 15-sigma for most SISerrors, so any samples beyond this threshold must be sta-tistical outliers. In the second step, 0.01% upper and lowerends are trimmed, i.e., 99.99% samples are involved in kur-tosis computation, which is important for a correct kurtosisestimation [20].
2Moreover, the sample mean may not be a maximum likelihood (ML)estimator of expected value for non-Gaussian samples. For instance, sam-ple median, rather than sample mean, is the ML estimator of expectedvalue for the samples from a two-sided exponential distribution.

STATISTICAL CHARACTERIZATION
Long-term stationarity
For the methodology and objective of this paper, any mean-ingful statistics should be based on a range of data that arerelatively stationary. Figure 3 shows the daily median ofglobal average rms SIS URE, orbit-error-only UREO, andabsolute value of clock errors for two GPS satellites. Thelong-term performance of IIR Space Vehicle Number (SVN)47 is very typical, and a similar improving trend of SIS per-formance can be seen for all other GPS satellites except IIASVN 27, which has a rather unusual worsening trend.
Two key messages are revealed from Figure 3. One is thatthe SIS performance is dominated by the clock performance,and the clock performance may affect the ephemeris per-formance. The other is that the long-term performance, forboth typical and atypical, was not stationary during the last7 years. Therefore, the statistics in the rest of the paper willbase on the data of last 3 years because the performance
2004 2005 2006 2007 2008 2009 2010 20110
1
2
3
Met
ers
Daily median rms SIS URE
2004 2005 2006 2007 2008 2009 2010 20110
1
2
3
Met
ers
Daily median orbit−error−only rms SIS URE
O
2004 2005 2006 2007 2008 2009 2010 20110
1
2
3
Met
ers
Year
Daily median |clock error|
(a) Typical long-term performance: IIR SVN 47/PRN22
2004 2005 2006 2007 2008 2009 2010 20110
1
2
3
Met
ers
Daily median rms SIS URE
2004 2005 2006 2007 2008 2009 2010 20110
1
2
3
Met
ers
Daily median orbit−error−only rms SIS URE
O
2004 2005 2006 2007 2008 2009 2010 20110
1
2
3
Met
ers
Year
Daily median |clock error|
(b) Atypical long-term performance: IIA SVN 27/PRN 27
Figure 3. Daily rms of global average rms SIS URE, orbit-error-only UREO, and absolute value of clock errors.
was relatively stationary and 3×365×24×4 ≈ 105 samplesper satellite are adequate for the statistical confidence of thecore SIS error behavior.
Mean and standard deviation of SIS errors
Although ephemeris errors are generally assumed to have azero mean distribution, the reality may be different. Figure 4plots the means of ephemeris errors, clock errors, instanta-neous UREs, and worse-case UREs with a comparison totheir standard deviations. The satellites are arranged roughlychronologically according to their Block Type3 and SVNalong the y-axis.
Figure 4 tells many stories. First of all, almost all satelliteshave zero mean for their crosstrack errors, while about onethird satellites have significant nonzero mean for their along-
−2 0 2A (m)
−1 0 1C (m)
−0.5 0 0.5R (m)
IIA SVN 23IIA SVN 24IIA SVN 25IIA SVN 26IIA SVN 27IIA SVN 30IIA SVN 33IIA SVN 34IIA SVN 35IIA SVN 36IIA SVN 38IIA SVN 39IIA SVN 40IIR−A SVN 41IIR−A SVN 43IIR−A SVN 44IIR−A SVN 45IIR−A SVN 46IIR−A SVN 51IIR−A SVN 54IIR−A SVN 56IIR−B SVN 47IIR−B SVN 59IIR−B SVN 60IIR−B SVN 61IIR−M SVN 48IIR−M SVN 50IIR−M SVN 52IIR−M SVN 53IIR−M SVN 55IIR−M SVN 57IIR−M SVN 58
−2 0 2Instantaneous URE (m)
−2 0 2Worst−case URE (m)
−2 0 2T (m)
IIA SVN 23IIA SVN 24IIA SVN 25IIA SVN 26IIA SVN 27IIA SVN 30IIA SVN 33IIA SVN 34IIA SVN 35IIA SVN 36IIA SVN 38IIA SVN 39IIA SVN 40IIR−A SVN 41IIR−A SVN 43IIR−A SVN 44IIR−A SVN 45IIR−A SVN 46IIR−A SVN 51IIR−A SVN 54IIR−A SVN 56IIR−B SVN 47IIR−B SVN 59IIR−B SVN 60IIR−B SVN 61IIR−M SVN 48IIR−M SVN 50IIR−M SVN 52IIR−M SVN 53IIR−M SVN 55IIR−M SVN 57IIR−M SVN 58
Figure 4. Mean of various SIS errors with a comparison to stan-dard deviation. The blue line with a length of twice thestandard deviation is centered at the mean denoted bythe green dot.
3In the figure, we follow the IGS convention to subdivide IIR satellitesinto two subgroups IIR-A and IIR-B because the last four IIR satelliteswere equipped with improved antennas. [21]

track errors. Fortunately, nonzero alongtrack or crosstrackerrors do not result in nonzero mean of UREs. The mean ofUREs are mainly correlated with the mean of clock errorsand radial errors. The nonzero mean of UREs is not criticalto ARIAM because no satellite has a mean exceeding 0.2times standard deviation.
Secondly, in light of standard deviation, the IIR and IIR-Msatellites usually have a better SIS performance than IIA. Ta-ble 1 summaries the standard deviation of various SIS errorsgrouped by Block Type. The better SIS performance of theyoung satellites is mainly due to better onboard clocks andbetter radial estimation. Nevertheless, SIS error behavioris different from satellite to satellite even for those withinthe same block and of similar age. A precise model for SISerrors should treat each satellite individually.
Lastly, both Figure 4 and Table 1 imply that clock perfor-mance dominates the performance of SIS UREs, reinforcingour observation from the long-term behavior.
IIA IIR IIR-MRadial (m) 0.243 0.130 0.145Alongtrack (m) 1.258 0.921 1.000Crosstrack (m) 0.675 0.575 0.594Clock (m) 1.074 0.384 0.498Instantaneous URE (m) 1.076 0.418 0.527
Table 1. Standard deviation of various SIS errors in metersgrouped by Block Type
Spatial correlation of SIS errors
The three components of ephemeris error and the clockerror are not necessarily independent from each other. Wecomputed the correlation coefficients for every possible pairof R, A, C, and T , and the results show that significantcorrelation only exists among R, A, and T . Figure 5 showsthese correlation coefficients for each satellite. The positivecorrelation between R and T is easy to understand, but thenegative correlation between R and A was unexpected. Thereason for the R-A correlation may be that the velocity ofsatellite is inversely proportional to the radius according toconservation of angular momentum, and a positive radialerror may result in a negative velocity error and hence anegative alongtrack error.
Distribution of SIS errors
In addition to mean and standard deviation, SIS errors arefurther characterized in terms of distribution. Figure 6 showsthe sample kurtosis of ephemeris errors, clock errors, in-stantaneous UREs, and worse-case UREs. It can be seen
IIA SVN 23IIA SVN 24IIA SVN 25IIA SVN 26IIA SVN 27IIA SVN 30IIA SVN 33IIA SVN 34IIA SVN 35IIA SVN 36IIA SVN 38IIA SVN 39IIA SVN 40
IIR−A SVN 41IIR−A SVN 43IIR−A SVN 44IIR−A SVN 45IIR−A SVN 46IIR−A SVN 51IIR−A SVN 54IIR−A SVN 56IIR−B SVN 47IIR−B SVN 59IIR−B SVN 60IIR−B SVN 61IIR−M SVN 48IIR−M SVN 50IIR−M SVN 52IIR−M SVN 53IIR−M SVN 55IIR−M SVN 57IIR−M SVN 58
−0.5 −0.4 −0.3 −0.2 −0.1 0 0.1 0.2 0.3 0.4 0.5correlation coefficient
R − TR − AA − T
Figure 5. Correlation coefficients among radial errors, alongtrackerrors, and clock errors.
IIA SVN 23IIA SVN 24IIA SVN 25IIA SVN 26IIA SVN 27IIA SVN 30IIA SVN 33IIA SVN 34IIA SVN 35IIA SVN 36IIA SVN 38IIA SVN 39IIA SVN 40
IIR−A SVN 41IIR−A SVN 43IIR−A SVN 44IIR−A SVN 45IIR−A SVN 46IIR−A SVN 51IIR−A SVN 54IIR−A SVN 56IIR−B SVN 47IIR−B SVN 59IIR−B SVN 60IIR−B SVN 61IIR−M SVN 48IIR−M SVN 50IIR−M SVN 52IIR−M SVN 53IIR−M SVN 55IIR−M SVN 57IIR−M SVN 58
−1 0 1 2R
0 1 2 3A
−1 0 1 2C
IIA SVN 23IIA SVN 24IIA SVN 25IIA SVN 26IIA SVN 27IIA SVN 30IIA SVN 33IIA SVN 34IIA SVN 35IIA SVN 36IIA SVN 38IIA SVN 39IIA SVN 40
IIR−A SVN 41IIR−A SVN 43IIR−A SVN 44IIR−A SVN 45IIR−A SVN 46IIR−A SVN 51IIR−A SVN 54IIR−A SVN 56IIR−B SVN 47IIR−B SVN 59IIR−B SVN 60IIR−B SVN 61IIR−M SVN 48IIR−M SVN 50IIR−M SVN 52IIR−M SVN 53IIR−M SVN 55IIR−M SVN 57IIR−M SVN 58
−10 0 10 20T
−5 0 5 10Instantaneous URE
−2 0 2 4Worst−case URE
Figure 6. Kurtosis of various SIS errors
that as for ephemeris errors, all satellites have a super Gaus-sian distribution for alongtrack, and about a half satelliteshave a super Gaussian distribution for radial and crosstrack.Nevertheless, no ephemeris errors have a kurtosis greaterthan 3, which means that the tail is not very strong and a

normal distribution with inflated sigma should be able tooverbound ephemeris errors. In contrast, clock errors, espe-cially the clock errors of some young satellites, have verylarge kurtosis.
Another interesting phenomenon in Figure 6 is that worst-case URE generally has a lower kurtosis than instantaneousURE, which contradicts the common sense that “worst-case”should come with heavier tails. In fact, it is improbable forworst-case UREs to be close to zero. Therefore, unlike theunimodal continuous distributions such as normal distribu-tion and Student’s t-distribution which has one peak at themean, the probability density function of worst-case UREshas two peaks. The two peaks boost the variance more thanthe 4th central moment, and hence reduce the kurtosis4.
In addition to kurtosis, quantile-quantile (Q-Q) plot is graph-ical method to compare the empirical distribution of SISerrors with the standard normal distribution. Figure 7 showsthree typical distributions: the sub-Gaussian distribution ofIIA SVN 27 radial errors, the almost-Gaussian distributionof IIR-M SVN 55 clock errors, and the super-Gaussian dis-tribution of IIR-M SVN 50 clock errors. It can be seen thateven with negative kurtosis, the IIA SVN 27 radial errorsstill have relative heavy tails5. When the kurtosis is positive,the tails are much heavier. Therefore, a super-Gaussian dis-tribution, such as Student’s t-distribution, may fit the realdata better.
Relation between rms URE and URA
As mentioned in Introduction, broadcast URA is intendedto be a conservative representation of the expected rmsbehavior of the corresponding SIS UREs. Since URA isused extensively in not only position fix but also integritymonitoring, it is important to know how conservative URAis. Figure 8 plots the rms instantaneous URE and rms worst-case URE grouped by different broadcast URA. From theleft subfigure, we can see that URA is truly conservative:for some old IIA satellites, URA is two times the expectedrms URE; for most IIR and IIR-M satellites, URA is fourtimes the expected rms URE. Furthermore, the rms worst-case URE in the right subfigure implies that even for themost unlucky user who always experiences largest URE, theuser can still expect the rms URE much lower than URA.Besides, different satellites interpret URA very differently.For example, the rms instantaneous URE for IIA SVN 27is around 1.3 meters despite the URA, whereas for IIR-M
4To understand this, consider an externa example, the Bernoulli distri-bution with p = 1/2, whose probability density function have two peaks,and the kurtosis is −2 [20].
5This apparent contradiction is because kurtosis depicts the normalityof the majority 105 samples, and the strong upper and lower tails includeno more than 50 samples.
−5 −4 −3 −2 −1 0 1 2 3 4 5−4
−3
−2
−1
0
1
2
3
4
IIA S
VN
27
radi
al e
rror
s (m
) Kurtosis = −0.71
−5 −4 −3 −2 −1 0 1 2 3 4 5−2
−1.5
−1
−0.5
0
0.5
1
1.5
2
IIR−
M S
VN
55
cloc
k er
rors
(m
) Kurtosis = 0.19
−5 −4 −3 −2 −1 0 1 2 3 4 5−4
−3
−2
−1
0
1
2
3
4
Standard Normal Quantiles
IIR−
M S
VN
50
cloc
k er
rors
(m
) Kurtosis = 8.95
Figure 7. Q-Q plot of three typical SIS errors
SVN 50 different URA does indicate different levels of rmsinstantaneous URE.
0 1 2 3
IIA SVN 23IIA SVN 24IIA SVN 25IIA SVN 26IIA SVN 27IIA SVN 30IIA SVN 33IIA SVN 34IIA SVN 35IIA SVN 36IIA SVN 38IIA SVN 39IIA SVN 40
IIR−A SVN 41IIR−A SVN 43IIR−A SVN 44IIR−A SVN 45IIR−A SVN 46IIR−A SVN 51IIR−A SVN 54IIR−A SVN 56IIR−B SVN 47IIR−B SVN 59IIR−B SVN 60IIR−B SVN 61IIR−M SVN 48IIR−M SVN 50IIR−M SVN 52IIR−M SVN 53IIR−M SVN 55IIR−M SVN 57IIR−M SVN 58
rms instantaneous URE (m)
0 1 2 3rms worst−case URE (m)
URA = 2.0 m
URA = 2.8 m
URA = 4.0 m
Figure 8. rms instantaneous URE and rms worst-case UREgrouped by different broadcast URA.
Correlation among UREs of different satellites
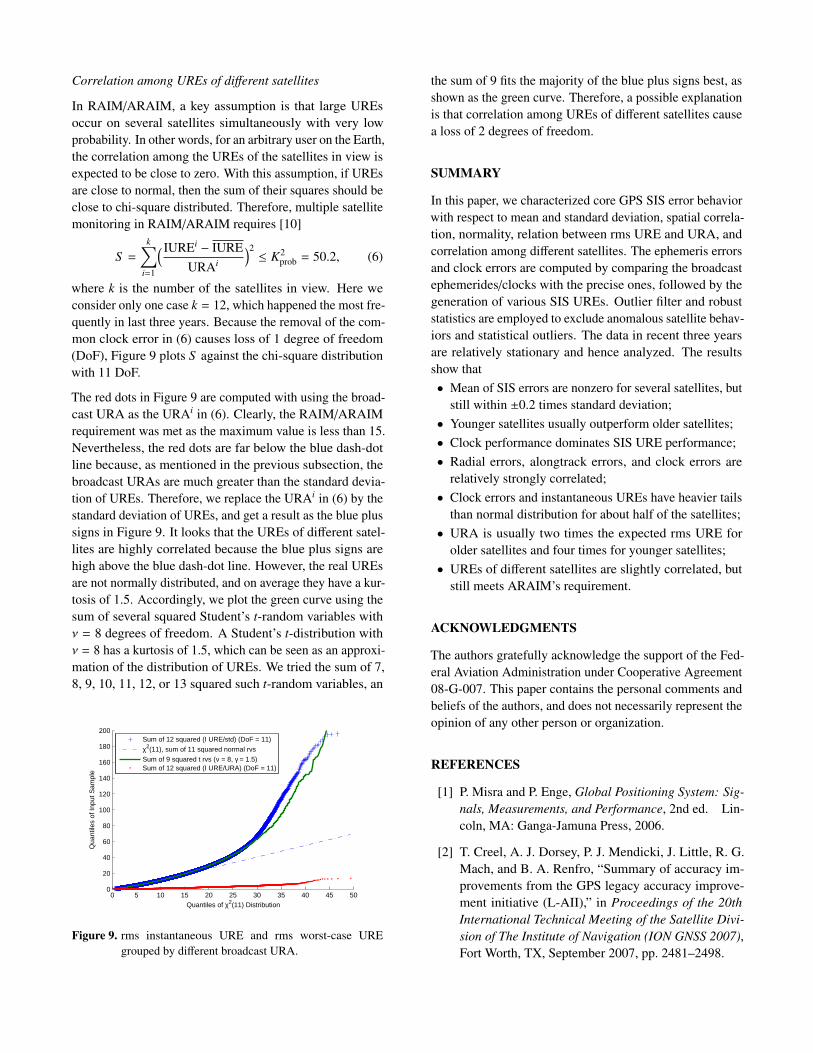
In RAIM/ARAIM, a key assumption is that large UREsoccur on several satellites simultaneously with very lowprobability. In other words, for an arbitrary user on the Earth,the correlation among the UREs of the satellites in view isexpected to be close to zero. With this assumption, if UREsare close to normal, then the sum of their squares should beclose to chi-square distributed. Therefore, multiple satellitemonitoring in RAIM/ARAIM requires [10]
S =
k∑i=1
( IUREi − IUREURAi
)2≤ K2
prob = 50.2, (6)
where k is the number of the satellites in view. Here weconsider only one case k = 12, which happened the most fre-quently in last three years. Because the removal of the com-mon clock error in (6) causes loss of 1 degree of freedom(DoF), Figure 9 plots S against the chi-square distributionwith 11 DoF.
The red dots in Figure 9 are computed with using the broad-cast URA as the URAi in (6). Clearly, the RAIM/ARAIMrequirement was met as the maximum value is less than 15.Nevertheless, the red dots are far below the blue dash-dotline because, as mentioned in the previous subsection, thebroadcast URAs are much greater than the standard devia-tion of UREs. Therefore, we replace the URAi in (6) by thestandard deviation of UREs, and get a result as the blue plussigns in Figure 9. It looks that the UREs of different satel-lites are highly correlated because the blue plus signs arehigh above the blue dash-dot line. However, the real UREsare not normally distributed, and on average they have a kur-tosis of 1.5. Accordingly, we plot the green curve using thesum of several squared Student’s t-random variables withν = 8 degrees of freedom. A Student’s t-distribution withν = 8 has a kurtosis of 1.5, which can be seen as an approxi-mation of the distribution of UREs. We tried the sum of 7,8, 9, 10, 11, 12, or 13 squared such t-random variables, an
0 5 10 15 20 25 30 35 40 45 500
20
40
60
80
100
120
140
160
180
200
Quantiles of χ2(11) Distribution
Qua
ntile
s of
Inpu
t Sam
ple
Sum of 12 squared (I URE/std) (DoF = 11)
χ2(11), sum of 11 squared normal rvs
Sum of 9 squared t rvs (ν = 8, γ = 1.5)Sum of 12 squared (I URE/URA) (DoF = 11)
Figure 9. rms instantaneous URE and rms worst-case UREgrouped by different broadcast URA.
the sum of 9 fits the majority of the blue plus signs best, asshown as the green curve. Therefore, a possible explanationis that correlation among UREs of different satellites causea loss of 2 degrees of freedom.
SUMMARY
In this paper, we characterized core GPS SIS error behaviorwith respect to mean and standard deviation, spatial correla-tion, normality, relation between rms URE and URA, andcorrelation among different satellites. The ephemeris errorsand clock errors are computed by comparing the broadcastephemerides/clocks with the precise ones, followed by thegeneration of various SIS UREs. Outlier filter and robuststatistics are employed to exclude anomalous satellite behav-iors and statistical outliers. The data in recent three yearsare relatively stationary and hence analyzed. The resultsshow that• Mean of SIS errors are nonzero for several satellites, but
still within ±0.2 times standard deviation;• Younger satellites usually outperform older satellites;• Clock performance dominates SIS URE performance;• Radial errors, alongtrack errors, and clock errors are
relatively strongly correlated;• Clock errors and instantaneous UREs have heavier tails
than normal distribution for about half of the satellites;• URA is usually two times the expected rms URE for
older satellites and four times for younger satellites;• UREs of different satellites are slightly correlated, but
still meets ARAIM’s requirement.
ACKNOWLEDGMENTS
The authors gratefully acknowledge the support of the Fed-eral Aviation Administration under Cooperative Agreement08-G-007. This paper contains the personal comments andbeliefs of the authors, and does not necessarily represent theopinion of any other person or organization.
REFERENCES
[1] P. Misra and P. Enge, Global Positioning System: Sig-nals, Measurements, and Performance, 2nd ed. Lin-coln, MA: Ganga-Jamuna Press, 2006.
[2] T. Creel, A. J. Dorsey, P. J. Mendicki, J. Little, R. G.Mach, and B. A. Renfro, “Summary of accuracy im-provements from the GPS legacy accuracy improve-ment initiative (L-AII),” in Proceedings of the 20thInternational Technical Meeting of the Satellite Divi-sion of The Institute of Navigation (ION GNSS 2007),Fort Worth, TX, September 2007, pp. 2481–2498.

[3] R. Schmid, M. Rothacher, D. Thaller, and P. Steigen-berger, “Absolute phase center corrections of satelliteand receiver antennas,” GPS Solutions, vol. 9, pp. 283–293, 2005.
[4] G. Wong, R. E. Phelts, T. Walter, and P. Enge, “Charac-terization of signal deformations for GPS and WAASsatellites,” in Proceedings of the 23rd InternationalTechnical Meeting of The Satellite Division of the In-stitute of Navigation (ION GNSS 2010), Portland, OR,September 2010, pp. 3143–3151.
[5] US DoD, Global Positioning System Standard Po-sitioning Service Performance Standard, 4th ed.,September 2008.
[6] J. Blanch, M. J. Choi, T. Walter, P. Enge, andK. Suzuki, “Prototyping advanced RAIM for verticalguidance,” in Proceedings of the 23rd InternationalTechnical Meeting of The Satellite Division of the In-stitute of Navigation (ION GNSS 2010), Portland, OR,September 2010, pp. 285–291.
[7] J. Zumberge and W. Bertiger, “Ephemeris and clocknavigation message accuracy,” in Global Position-ing System: Theory and Applications, B. Parkinson,J. Spilker, P. Axelrad, and P. Enge, Eds. Washington,DC: American Institute of Aeronautics and Astronau-tics, 1996, vol. I, pp. 585–699.
[8] R. B. Langley, H. Jannasch, B. Peeters, and S. Bisnath,“The GPS broadcast orbits: an accuracy analysis,” in33rd COSPAR Scientific Assembly, Warsaw, Poland,July 2000.
[9] D. M. Warren and J. F. Raquet, “Broadcast vs. pre-cise GPS ephemerides: a historical perspective,” GPSSolutions, vol. 7, pp. 151–156, 2003.
[10] T. Walter, J. Blanch, and P. Enge, “Evaluation of sig-nal in space error bounds to support aviation integrity,”in Proceedings of the 22nd International TechnicalMeeting of The Satellite Division of the Institute ofNavigation (ION GNSS 2009), Savannah, GA, Septem-ber 2009, pp. 1317–1329.
[11] J. C. Cohenour and F. van Graas, “GPS orbit and clockerror distributions,” NAVIGATION, Journal of the In-stitute of Navigation, acceptted April 2009.
[12] L. Heng, G. X. Gao, T. Walter, and P. Enge, “GPSephemeris error screening and results for 2006–2009,”in Proceedings of the 2010 International TechnicalMeeting of the Institute of Navigation (ION ITM 2010),San Diego, CA, January 2010, pp. 1014–1022.
[13] ——, “GPS signal-in-space anomalies in the lastdecade: Data mining of 400,000,000 GPS navigation
messages,” in Proceedings of the 23rd InternationalTechnical Meeting of The Satellite Division of the In-stitute of Navigation (ION GNSS 2010), Portland, OR,September 2010, pp. 3115–3122.
[14] J. M. Dow, R. E. Neilan, and C. Rizos, “The in-ternational GNSS service in a changing landscapeof global navigation satellite systems,” Journal ofGeodesy, vol. 83, pp. 689–689, 2009.
[15] National Geospatial-Intelligence Agency GPS Divi-sion, Accessed November 2010. [Online]. Available:http://earth-info.nga.mil/GandG/sathtml/
[16] B. Wiley, D. Craig, D. Manning, J. Novak, R. Taylor,and L. Weingarth, “NGA’s role in GPS,” in Proceed-ings of the 19rd International Technical Meeting ofThe Satellite Division of the Institute of Navigation(ION GNSS 2006), Fort Worth, TX, September 2006,pp. 2111–2119.
[17] S. S. Shapiro and M. B. Wilk, “An analysis of variancetest for normality (complete samples),” Biometrika,vol. 52, no. 3-4, pp. 591–611, 1965.
[18] H. W. Lilliefors, “On the Kolmogorov-Smirnov test fornormality with mean and variance unknown,” Journalof the American Statistical Association, vol. 62, no.318, pp. 399–402, 1967.
[19] C. M. Jarque and A. K. Bera, “Efficient tests for nor-mality, homoscedasticity and serial independence ofregression residuals,” Economics Letters, vol. 6, no. 3,pp. 255 – 259, 1980.
[20] B. S. Chissom, “Interpretation of the kurtosis statistic,”The American Statistician, vol. 24, no. 4, pp. 19–22,1970.
[21] R. Schmid, P. Steigenberger, G. Gendt, M. Ge, andM. Rothacher, “Generation of a consistent absolutephase-center correction model for GPS receiver andsatellite antennas,” Journal of Geodesy, vol. 81, pp.781–798, 2007.