statewide evaluator market potential study presentation
TRANSCRIPT

PENNSYLVANIA MARKET POTENTIAL STUDY SUMMARY Meeting with Pennsylvania PUC Stakeholders June 5, 2012

AGENDA
1. Introduction by the PUC TUS Management 2. Overview of the Market Potential Study
Results 3. Q&A Session with Stakeholders 4. Conclusion
2

POTENTIAL STUDY GOALS
§ Evaluate the electric energy efficiency technical, economic, achievable and program potential savings in the overall Commonwealth of Pennsylvania, as well as in seven specific EDC service areas;
§ Calculate the Total Resource Cost Test (“TRC”) benefit-cost ratio for the achievable potential savings for electric energy efficiency measures and programs and determine the electric energy efficiency economic potential savings for Pennsylvania homes and businesses.
3

POTENTIAL STUDY INPUTS
§ Study followed approach outlined in National Action Plan for Energy-Efficiency (NAPEE) potential study guide
§ Pennsylvania specific data utilized wherever possible – 2011-2012 Residential and Non-residential baseline
study – EDC specific load forecasts and avoided cost structures – PA Act 129 Technical Reference Manual
§ Current PA EDC program performance – Program Savings – Program acquisition costs
4

POTENTIAL STUDY INPUTS
§ 579 unique energy efficiency measure characteristics researched and analyzed for specific PA parameters – Costs – Savings – Useful Life
§ Includes impacts of Energy Independence and Security Act (EISA) baseline updates for: – Compact Fluorescent Lamps – Linear Fluorescent Lamps – Motor Efficiencies
5

TYPES OF PROGRAM POTENTIAL
6
Not Technically Feasable
Not Technically Feasable
Not Cost Effective
Not Technically Feasable
Not Cost Effective
Market & Adoption Barriers
Not Technically Feasable
Not Cost Effective
Market & Adoption Barriers
Program Design, Budget, Staffing, & Time Constraints
Technical Potential
Economic Potential
Achievable Potential
Program Potential

SCENARIOS CONSIDERED
§ Achievable Potential – Scenario#1 considers the incentive provided to
implement an energy efficient measure to be 100% of incremental cost.
– Scenario#2 considers the incentive provided to implement an energy efficient measure to be at the current funding level of incremental cost. • 45% for residential sector • 28% for non-residential sector
7

SCENARIOS CONSIDERED
§ Program Potential – Data used to construct is based on achievable potential
scenario #2 for both program potential scenarios. – Scenario #1 determines savings goals with annual
program funding limitations at 2% of 2006 EDC revenue. • Scenario #1 is the basis for recommendations for phase 2
program goals. – Scenario #2 determines funding with an annual program
savings of 1% of 2010 annual sales.
8

MARKET POTENTIAL STUDY FINDINGS COST-EFFECTIVENESS
§ Study found remaining cost-effective energy-efficient savings.
§ Total Resource Cost Test (“TRC”) benefit-cost ratio for the achievable potential savings is 1.97 over the ten-year horizon.
9

MARKET POTENTIAL STUDY RESULTS
10

MARKET POTENTIAL STUDY FINDINGS
11
Energy Efficiency 3-‐year Program Poten2al #1 Savings Summary
EDC
3 Year Spending Ceiling
(total por=olio)
3 Year Program PotenAal
Savings (MWh)
3 Year Program
AcquisiAon Cost ($/MWh)
3 Year % of 2009/10 Forecast
Probable Range of 2009/10 Forecast
Duquesne $58,637,855 276,722 $211.90 2.0% 1.7% -‐ 2.5%
Met-‐Ed $74,600,676 337,753 $220.87 2.3% 2.0% -‐ 2.7%
Penelec $68,924,232 318,813 $216.19 2.2% 1.9% -‐ 2.7%
Penn Power $19,979,352 95,502 $209.20 2.0% 1.7% -‐ 2.5%
PPL $184,504,128 821,072 $224.71 2.1% 1.9% -‐ 2.7%
PECO $256,185,476 1,125,851 $227.55 2.9% 2.6% -‐ 3.1%
West Penn $70,687,404 337,533 $209.42 1.6% 1.4% -‐ 2.1%
Statewide $733,519,122 3,313,247 $221.39 2.3% 2.0% -‐ 2.7%

MARKET POTENTIAL STUDY FINDINGS
12
Energy Efficiency 5-‐year Program Poten2al #1 Savings Summary
EDC
5 Year Spending Ceiling
(total por=olio)
5 Year Program PotenAal
Savings (MWh)
5 Year Program
AcquisiAon Cost ($/MWh)
5 Year % of 2009/10 Forecast
Probable Range of 2009/10 Forecast
Duquesne $97,729,758 442,451 $220.88 3.1% 2.8% -‐ 4.2% Met-‐Ed $124,334,460 540,210 $230.16 3.6% 3.4% -‐ 4.5% Penelec $114,873,720 513,332 $223.78 3.6% 3.2% -‐ 4.4% Penn Power $33,298,920 154,500 $215.53 3.2% 2.8% -‐ 4.1% PPL $307,506,880 1,332,001 $230.86 3.5% 3.2% -‐ 4.5% PECO $426,975,793 1,884,517 $226.57 4.8% 4.3% -‐ 5.2% West Penn $117,812,340 547,332 $215.25 2.6% 2.3% -‐ 3.5% Statewide $1,222,531,870 5,414,343 $225.80 3.7% 3.3% -‐ 4.5%

POTENTIAL STUDY BENCHMARK COMPARISON
13
Spending (total por=olio)
Program Savings (MWh)
Program AcquisiAon Cost ($/MWh)
% of 2009/10 Forecast
3-‐year Projec2on (2013-‐2016) $733,519,122 3,313,247 $221.39 2.3%
5 – year Projec2on (2013-‐2018) $1,222,531,870 5,414,343 $225.80 3.7%
2 -‐ year Actual (2009-‐2010) $386,941,909 1,743,883 $139.35 1.9%
4 –year Budget (2009-‐2012) $978,025,496 4,399,854 $222.29 3%

MARKET POTENTIAL STUDY FINDINGS - UNCERTAINTY
14
2.3% 3.7%
Phase I Target

WHERE IS THE POTENTIAL?
15
Residen2al 56%
Non-‐Residen2al
44%

WHERE IS THE POTENTIAL - RESIDENTIAL?
16
!
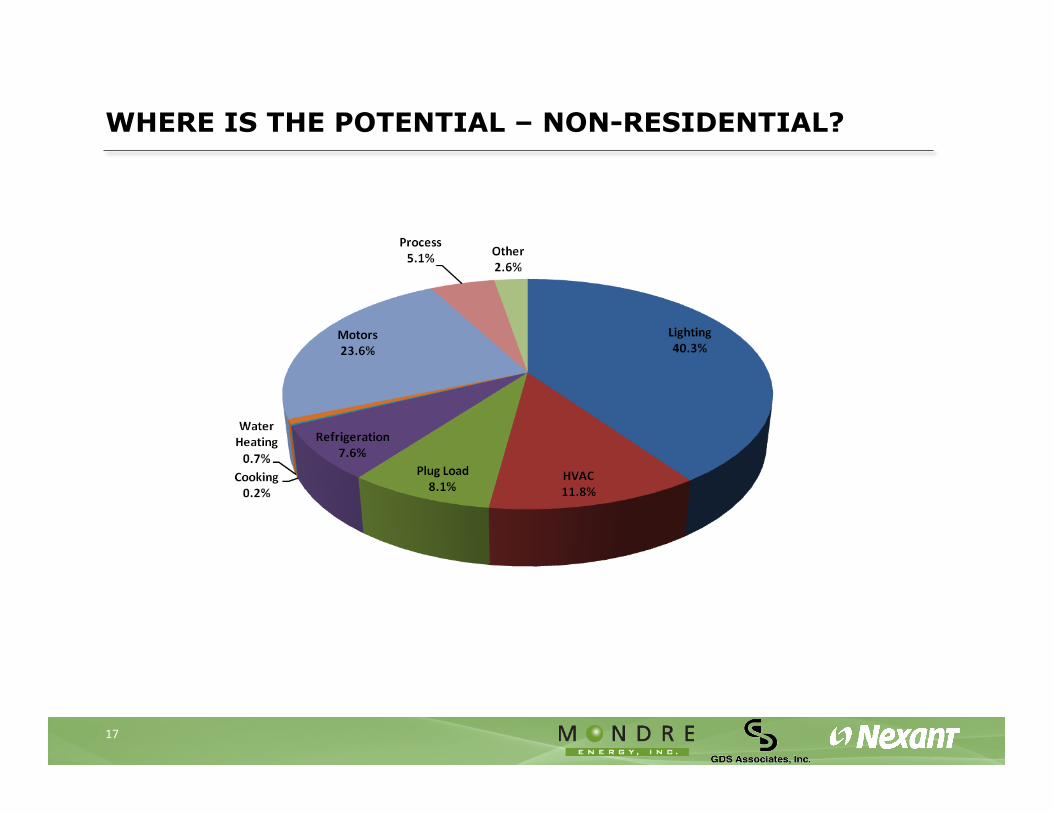
WHERE IS THE POTENTIAL – NON-RESIDENTIAL?
17
!

IMPORTANT FINDINGS
§ Future program saving potential will be less in future years. – Expected incentive share of participant cost is equal to
current program
§ Future program costs will be higher in future years. – “Low hanging fruit” will be captured within 2009-2012
programs – More “expensive” and “deeper” measures contribute a
larger share in the future
§ Uncertainty in the market place due to current federal code standards.
18

EDC DIFFERENCES
§ Potential targets for each EDC are unique, because savings are a function of: – Relative budget cap based on revenue in relationship to
EDC specific sales • PECO has the highest relative cap • West Penn has the lowest relative cap
– EDC avoided costs • EDC’s with higher avoided costs will have more measures
that pass cost-effectiveness test – Customer sector shares (residential, commercial and
industrial) • Residential sector has the highest relative potential • Industrial sector has the lowest relative potential
19

IMPORTANT CONSIDERATIONS
§ EDC specific targets § No sector specific “carve-outs” or “set-asides”
included. – High spending programs, such as low-income, will
reduce savings potential with fixed spending budget.
§ 100% of EDC budget is allocated to energy-efficiency. – No budgets for demand response or renewable energy
generation.
20

QUESTIONS?
21