statements on management accounting - · pdf filein accordance with the charge to the...
TRANSCRIPT
Statements on
ManagementAccounting
Statement Number 4DDMay 15, 1998
PRACTICES AND TECHNIQUES:
Tools and Techniquesfor Implementing Integrated
Performance Management Systems
SMA 4DD.p65 1/11/99, 3:07 PM1
In accordance with the charge to the Management AccountingPractices (MAP) Committee to issue statements on managementaccounting principles and practices, Statements on ManagementAccounting are promulgated to reflect official positions of theInstitute of Management Accountants (IMA). The work of theMAP Committee is based on a framework for managementaccounting, whose principal categories are:
1. Objectives2. Terminology3. Concepts4. Practices and Techniques5. Management of Accounting Activities
SMA 4DD.p65 1/11/99, 3:07 PM2
Statement on Management Accounting
Statement No. 4DDMay 15, 1998
Practices and Techniques:
Tools and Techniques forImplementing Integrated
Performance Management Systems
Institute of Management AccountantsArthur Andersen LLP
Small front matter.p65 1/11/99, 3:08 PM1

Published byInstitute of Management Accountants
10 Paragon DriveMontvale, NJ 07645-1760
Copyright © 1998 in the United States of Americaby Arthur Andersen LLP
All rights reserved
IMA Publication Number 98332ISBN 0-86641-269-7
Small front matter.p65 1/11/99, 3:08 PM2

ACKNOWLEDGMENTS
Statement 4DD, “Tools and Techniques for Implementing IntegratedPerformance Management Systems,” was approved for issuance as aStatement on Management Accounting by the Management Account-ing Committee (MAC) of the Institute of Management Accountants(IMA). IMA appreciates the collaborative efforts of the Cost Manage-ment Competency Center at Arthur Andersen LLP and the work of Dr.C. J. McNair, CMA, of Babson College, who drafted the manuscript.
Special thanks go to Randolf Holst, CMA, Knowledge Manager at ArthurAndersen, for his continuing oversight during the development of theStatement. IMA also thanks the members of the Management Account-ing Committee for their contributions to this effort.
Small front matter.p65 1/11/99, 3:08 PM3
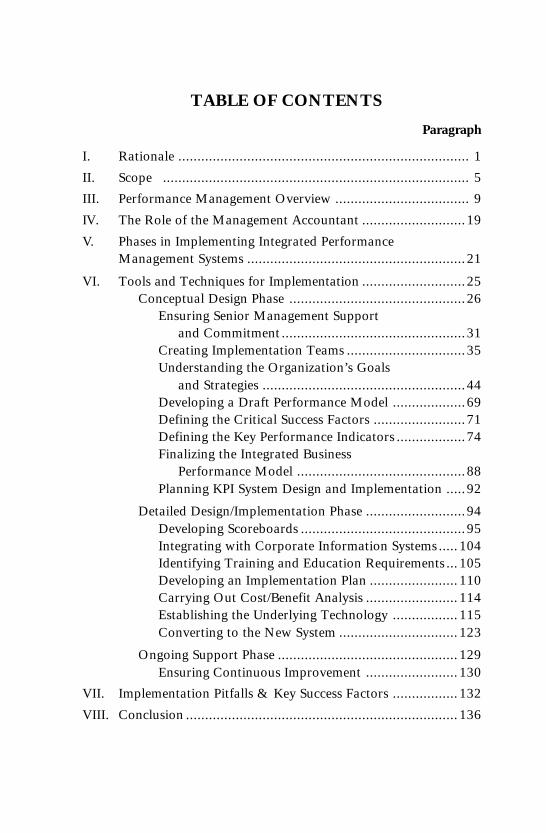
TABLE OF CONTENTS
Paragraph
I. Rationale ............................................................................ 1
II. Scope ................................................................................ 5
III. Performance Management Overview ................................... 9
IV. The Role of the Management Accountant ...........................19
V. Phases in Implementing Integrated PerformanceManagement Systems .........................................................21
VI. Tools and Techniques for Implementation ...........................25Conceptual Design Phase ..............................................26
Ensuring Senior Management Supportand Commitment ................................................31
Creating Implementation Teams ...............................35Understanding the Organization’s Goals
and Strategies .....................................................44Developing a Draft Performance Model ...................69Defining the Critical Success Factors ........................71Defining the Key Performance Indicators ..................74Finalizing the Integrated Business
Performance Model ............................................88Planning KPI System Design and Implementation .....92
Detailed Design/Implementation Phase ..........................94Developing Scoreboards ...........................................95Integrating with Corporate Information Systems ..... 104Identifying Training and Education Requirements ...105Developing an Implementation Plan ....................... 110Carrying Out Cost/Benefit Analysis ........................ 114Establishing the Underlying Technology ................. 115Converting to the New System ............................... 123
Ongoing Support Phase ............................................... 129Ensuring Continuous Improvement ........................ 130
VII. Implementation Pitfalls & Key Success Factors ................. 132
VIII. Conclusion ....................................................................... 136
Small front matter.p65 1/11/99, 3:08 PM5

IX. AppendixKey Performance Indicators DefinitionsScoreboard Terminology
X. Bibliography
Small front matter.p65 1/11/99, 3:08 PM6
TABLE OF EXHIBITS
FollowingParagraph
Exhibit 1: Integrating Financial and NonfinancialPerformance Measures .............................................13
Exhibit 2: GE Performance Measures .......................................16Exhibit 3: I-PMS Implementation Phases ..................................22Exhibit 4: The ABO Continuum ...............................................34Exhibit 5: Division of Responsibility in I-PMS
Implementation Process ...........................................40Exhibit 6: A Generic Business Model ........................................59Exhibit 7: Draft Performance Model ........................................72Exhibit 8: Ishikawa Cause-and-Effect Diagram .........................81Exhibit 9: Pareto Analysis of Manufacturing Delay ..................85Exhibit 10: Integrated Business Performance Model....................91Exhibit 11: Cell or Team Scoreboards ........................................95Exhibit 12: Scoreboard Report ...................................................95Exhibit 13: Graphical Format to Display KPIs .......................... 100Exhibit 14: Incident Log .......................................................... 102Exhibit 15: Training Principles ................................................. 105Exhibit 16: Individual Action Plan ........................................... 111Exhibit 17: Example of an I-PMS Communication Plan ............ 115Exhibit 18: The Do’s & Don’ts of I-PMS Implementation ......... 135
Small front matter.p65 1/12/99, 11:46 AM7
1
I. RATIONALE
1 Measurement is at the heart of the organizational process. Whatis measured becomes visible, what is rewarded gets done.Measurements define the playing field for organizational members,signaling how well the firm is playing the competitive game andlinking past, present, and future actions into a cohesive whole. Afirm’s values, strategies, and progress are all reflected in what itchooses to measure and how those measures are used to influencebehavior.
2 The global market and its rapid pace of change have increased thedemand on measurement systems in modern corporations. The“command and control” function (previously served byperformance measurement systems) has been transformed into aneed to “predict and prepare” the organization to meet the nextchallenge and to create the next opportunity. Changes to thebusiness context are also changing the nature of measurement.Process management emphasizing value and service to the customeris replacing traditional vertical and functional structures. Decision-making is increasingly being moved lower in the organization;self-directed work teams rather than individual managers now makedecisions. Virtual corporate structures are creating the need tomanage and measure performance across the value chain.1 Eachof these shifts has implications for the performance managementsystem and its ability to effectively serve the organization and itsstakeholders.
3 Since the key stakeholder in modern business is the customer,customer requirements have to play a pivotal role in defining themeasurements used by an organization. Business processes shouldbe designed to meet customer requirements, and performancemeasurements should be selected based on those requirements. As
1 John Shank and V. Govindarajan describe the value chain for any firm as the value-creating activities, from basic raw material sources and component suppliers through tothe ultimate end-use product delivered into the final consumer’s hands.
2
customer requirements filter through the organization theperformance measures developed at the process and subprocesslevels should reflect the customer’s perspective and should alsoensure high levels of customer satisfaction.
4 The performance management system must satisfy the followingimportant objectives: measure performance against key customerrequirements, make strategic objectives clear, focus on coreprocesses, focus on critical variables, signal where performanceis headed, identify which critical factors require attention, andprovide an unambiguous basis for assessing and rewardingperformance.
II. SCOPE
5 This Statement on Management Accounting (SMA) has beenwritten to facilitate the process of designing and implementing anintegrated performance management system (I-PMS). Thisstructured approach is founded on the principles of participatorymanagement. The methods and principles presented in this SMAsupplement the Institute of Management Accountants’ SMA 4U,“Developing Comprehensive Performance Indicators,” whichdescribes the series of steps an organization would take toimplement comprehensive performance indicators.
6 The objective of this SMA is to detail key phases in implementingan I-PMS. This Statement includes tools and techniques that canfacilitate these efforts and cites some common key success factorsto guide the process, as well as common pitfalls. Deployment ofstrategy is the underlying focus and assumption for theserecommendations.
7 The discussion assumes an organization with some experience indeveloping and using performance measurement practices. Itemphasizes issues of interest to organizations seeking to introducenew performance indicator concepts, as well as to those aspiringto integrate and improve existing performance managementsystems.
3
8 The information in this SMA will help management accountantsand others:
• comprehend the basic issues in designing and implementingeffective, customer-driven performance management systems;
• discern the pitfalls and key success factors in implementation;
• understand the tools and techniques that can be used toimplement integrated performance management systems;
• appreciate their roles and responsibilities in the new performancemanagement process; and
• broaden employee awareness and obtain their buy-in for thenew performance management system.
III. PERFORMANCE MANAGEMENT OVERVIEW
9 Performance management provides a systematic link betweenorganizational strategy, resources, and processes. It is acomprehensive management process framing the continuousimprovement journey, by ensuring that everyone understands wherethe organization is and where it needs to go to meet stakeholderneeds. Performance measurement is an integral part of performancemanagement, but it is not enough simply to measure. Performancemeasurement in isolation is incomplete.
10 Traditional approaches to performance measurement fail for severalbasic reasons. First, traditional output measures alone areincomplete as management tools. They fail to tell executives howto improve. Second, traditional methods of performancemeasurement often do not help identify or increase understandingof the core issues driving current performance. Third, in most cases,these measures tend to be retrospective rather than proactive. Whileknowing the score is undoubtedly important, it would be better tobe able to change a poor outcome. Finally, traditional methods ofperformance measurement review results instead of causes for thoseresults.
11 These acknowledged weaknesses in traditional performancemeasurement are driving organizations to implement performance
4
management systems. This implementation brings several majorbenefits. First, a performance management system helpsmanagement deploy and institutionalize its strategy. Second, aperformance management system provides focus for, and measuresthe success of, reengineering or total quality management (TQM)efforts. Third, a well-designed I-PMS helps coordinate efforts acrossother key management processes by providing a well-defined setof objectives that are cross-functional and process driven. Fourth,a performance management system provides a link between theefforts it measures and the achievements it rewards. Finally, aneffective integrated performance management system helps anorganization gain a competitive advantage by keeping everyone,at any level or in any job, focused on gaining and maintaining acore competence.
12 An I-PMS can be envisioned as an enterprise wide managementsystem that links strategic objectives, core business strategies,critical success factors, and key performance indicators. An I-PMSis an ongoing process that focuses priorities on results, integratesmeasurement, facilitates analysis and action, encourages continuousimprovement, and defines and reinforces accountability. Movingbeyond traditional financial and productivity measures, an I-PMSemphasizes the core dimensions of performance as defined bystrategy requirements. It also assists financial management byproviding cost indicators as reliable estimators of downstreamfinancial performance.
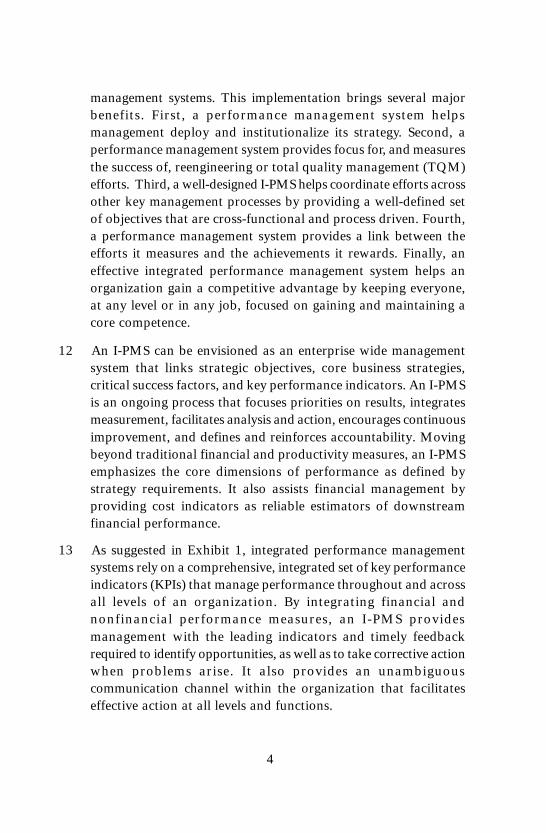
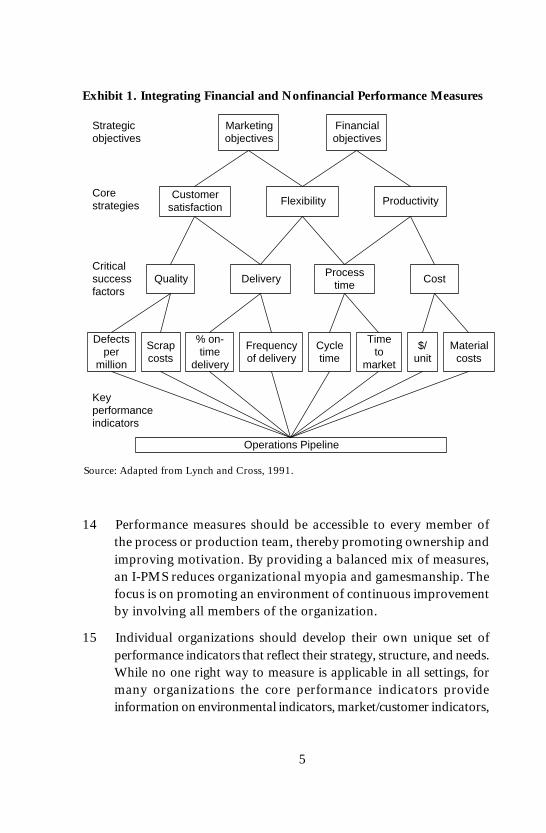
13 As suggested in Exhibit 1, integrated performance managementsystems rely on a comprehensive, integrated set of key performanceindicators (KPIs) that manage performance throughout and acrossall levels of an organization. By integrating financial andnonfinancial performance measures, an I-PMS providesmanagement with the leading indicators and timely feedbackrequired to identify opportunities, as well as to take corrective actionwhen problems arise. It also provides an unambiguouscommunication channel within the organization that facilitateseffective action at all levels and functions.
5
14 Performance measures should be accessible to every member ofthe process or production team, thereby promoting ownership andimproving motivation. By providing a balanced mix of measures,an I-PMS reduces organizational myopia and gamesmanship. Thefocus is on promoting an environment of continuous improvementby involving all members of the organization.
15 Individual organizations should develop their own unique set ofperformance indicators that reflect their strategy, structure, and needs.While no one right way to measure is applicable in all settings, formany organizations the core performance indicators provideinformation on environmental indicators, market/customer indicators,
Source: Adapted from Lynch and Cross, 1991.
Exhibit 1. Integrating Financial and Nonfinancial Performance Measures
Marketingobjectives
Financialobjectives
ProductivityFlexibilityCustomer
satisfaction
CostProcess
timeDeliveryQuality
Defectsper
million
Scrapcosts
% on-time
delivery
Frequencyof delivery
Cycletime
Timeto
market
$/unit
Materialcosts
Criticalsuccessfactors
Strategicobjectives
Corestrategies
Keyperformanceindicators
Operations Pipeline

6
competitor indicators, internal business process performanceindicators, human resource indicators, and financial indicators.
16 An I-PMS should be simple in design, containing only thosemeasures needed to direct attention and action. For example, atGeneral Electric (GE), performance indicators are linked directlyto a specific strategic objective as illustrated in Exhibit 2. A keyshareholder concern, profitability, is measured by residual income.Personnel development, essential to GE’s long-term growth, iscaptured by the measure “inventory of promotable people.”Measurement at GE provides the vital link between current andfuture performance.
17 An effective I-PMS should “make visible” the primary drivers ofsuperior performance. It should focus attention on those criticalactivities that, if done well, will lead to a sustainable competitiveadvantage and long-term growth.
18 Some of the best companies in the world cite their I-PMS as one ofthe key drivers of their success. AT&T, BellSouth, Bristol-MyersSquibb, Dun & Bradstreet, DuPont, Emerson Electric, GeneralElectric, Hewlett-Packard, Johnson & Johnson, Merck, Motorola,Pepsico, Wal-Mart, and Xerox are just a few of the organizationsthat are using an I-PMS to achieve superior performance.
IV. THE ROLE OF THE MANAGEMENT ACCOUNTANT
19 The implementation of an I-PMS requires the commitment of seniormanagement as well as the support and involvement of individuals
Exhibit 2. GE Performance Measures
Goals Performance Indicators
Profitability Residual incomeMarket position Market shareProductivity OutputProduct leadership Competitive standingPersonnel development Inventory of promotable peopleEmployee attitudes Percent of satisfied employees
7
from all areas of the organization, including accounting, marketing,product and process development, procurement, operations,distribution, sales, service, and information systems. Themanagement accountant should play an active role in the designand implementation of the I-PMS. Specific ways the managementaccountant may be involved in the implementation and downstreammaintenance of the I-PMS include:
• identifying the need for an integrated performance managementsystem and educating others about that need;
• working with the I-PMS champion or team in assessing theperformance of the current measurement system against theorganization’s critical success factors;
• assisting in developing the performance indicator architecture;
• reviewing and assessing current financial measures and reportsfor consistency and compatibility with overall I-PMS design,structure, and objectives;
• analyzing the potential behavioral impact of the performanceindicators;
• developing methods for ensuring the integrity of the data usedby the system;
• supporting the implementation by developing training andeducation programs;
• participating in planning and completing the conversion tothe new system;
• participating in reevaluating the performance evaluation andthe reward system; and
• identifying and implementing methods to ensure continualimprovement of performance and the I-PMS that tracks it.
20 As part of the management team, management accountants shouldbring their unique talents, experience, and perspective to thechallenging task of implementing a new performance managementapproach.
8
V. PHASES IN IMPLEMENTING INTEGRATEDPERFORMANCE MANAGEMENT SYSTEMS
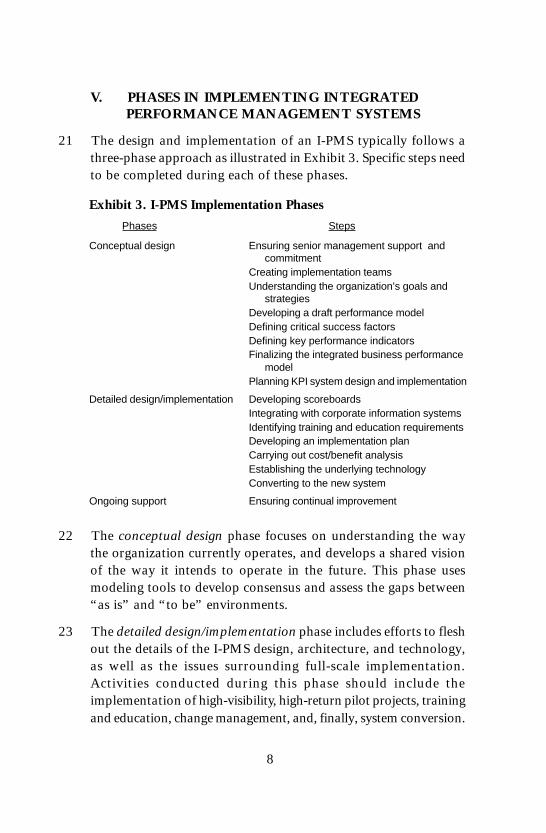
21 The design and implementation of an I-PMS typically follows athree-phase approach as illustrated in Exhibit 3. Specific steps needto be completed during each of these phases.
22 The conceptual design phase focuses on understanding the waythe organization currently operates, and develops a shared visionof the way it intends to operate in the future. This phase usesmodeling tools to develop consensus and assess the gaps between“as is” and “to be” environments.
23 The detailed design/implementation phase includes efforts to fleshout the details of the I-PMS design, architecture, and technology,as well as the issues surrounding full-scale implementation.Activities conducted during this phase should include theimplementation of high-visibility, high-return pilot projects, trainingand education, change management, and, finally, system conversion.
Exhibit 3. I-PMS Implementation Phases
Phases Steps
Conceptual design Ensuring senior management support andcommitment
Creating implementation teamsUnderstanding the organization’s goals and
strategiesDeveloping a draft performance modelDefining critical success factorsDefining key performance indicatorsFinalizing the integrated business performance
modelPlanning KPI system design and implementation
Detailed design/implementation Developing scoreboardsIntegrating with corporate information systemsIdentifying training and education requirementsDeveloping an implementation planCarrying out cost/benefit analysisEstablishing the underlying technologyConverting to the new system
Ongoing support Ensuring continual improvement
9
24 The ongoing support phase focuses on realizing the full benefits ofimplementation by supporting and fine-tuning the newly changedenvironment, as well as facilitating continuous improvement insystems and performance.
VI. TOOLS AND TECHNIQUES FOR IMPLEMENTATION
25 The implementation of performance management systems hasbeen formalized by leading organizations. These firms use anintegrated, systematic approach reflected in the following toolsand techniques.
Conceptual Design Phase
26 The main objective of the conceptual design phase is to identify apreliminary set of KPIs for each operating unit or organizationalsubunit being included in the performance management effort. Toensure that this effort yields effective measures for all users, theconceptual design process should take concurrent top-down andbottom-up approaches.
27 During the top-down analysis the focus is on becoming thoroughlyfamiliar with the firm and its marketplace. Based on a review ofexisting documents and reports, as well as interviews with keyindividuals in the various organizational subunits, the top-downanalysis ensures that the I-PMS addresses the customer perspectiveand the strategic issues confronting the organization.
28 During the bottom-up design efforts, attention shifts to identifyingcore activities and drivers that define operations. Process focused,the bottom-up analysis seeks to understand what factors affectcost and what major problems in the process or organization mayact as barriers to meeting performance objectives. The finalconceptual design for the I-PMS must combine these twoorganizational perspectives to ensure development of a consistent,unambiguous, strategically oriented set of measures.
29 Specifically, measures need to be developed matching decision-making requirements at the lowest level of the organization with
10
decision-making requirements in the corporate boardroom. Thisensures the I-PMS addresses needs throughout the organization,aligns all performance measures, and achieves strategic andoperational business objectives.
30 The conceptual design phase has eight primary steps. They are:
• ensuring senior management support and commitment;• creating implementation teams;• understanding the organization’s goals and strategies;• developing a draft performance model;• defining the critical success factors;• defining the key performance indicators;• finalizing the integrated performance model; and• planning KPI system design and implementation.
Ensuring Senior Management Support and Commitment
31 Senior management can often exhibit significant reservations aboutimplementing an I-PMS. The reasons for this resistance include:(1) they may be very familiar and comfortable with deeplyentrenched measurement systems; (2) they are unsure how newmeasures will affect the actions and behavior of subordinates; (3)they know how to tie existing measures to overall financialperformance to ensure that stakeholder expectations are met; and(4) existing measures provide time-tested, understandable signalsof problems and opportunities within the organization.
32 A new performance management system cannot succeed withoutsenior management support and commitment. To ensure this vitalsupport, organizations can employ a technique known as theAwareness, Buy-in, Ownership (ABO) Continuum2 to gauge thelevel of support and commitment among senior managers.
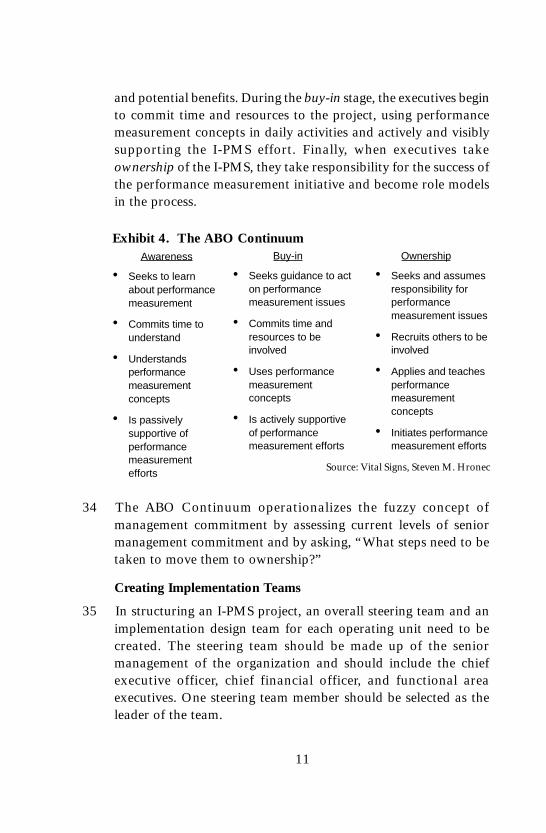
33 As illustrated in Exhibit 4, the first step in the ABO Continuum,awareness, occurs when executives show interest in the initiativeand seek to gather more information about its implementation
2 The ABO Continuum is a term coined by Arthur Andersen and should not be usedwithout the company’s knowledge and appropriate attribution to the original source.
11
and potential benefits. During the buy-in stage, the executives beginto commit time and resources to the project, using performancemeasurement concepts in daily activities and actively and visiblysupporting the I-PMS effort. Finally, when executives takeownership of the I-PMS, they take responsibility for the success ofthe performance measurement initiative and become role modelsin the process.
34 The ABO Continuum operationalizes the fuzzy concept ofmanagement commitment by assessing current levels of seniormanagement commitment and by asking, “What steps need to betaken to move them to ownership?”
Creating Implementation Teams
35 In structuring an I-PMS project, an overall steering team and animplementation design team for each operating unit need to becreated. The steering team should be made up of the seniormanagement of the organization and should include the chiefexecutive officer, chief financial officer, and functional areaexecutives. One steering team member should be selected as theleader of the team.
Awareness
• Seeks to learnabout performancemeasurement
• Commits time tounderstand
• Understandsperformancemeasurementconcepts
• Is passivelysupportive ofperformancemeasurementefforts
Exhibit 4. The ABO Continuum Buy-in
• Seeks guidance to acton performancemeasurement issues
• Commits time andresources to beinvolved
• Uses performancemeasurementconcepts
• Is actively supportiveof performancemeasurement efforts
Ownership
• Seeks and assumesresponsibility forperformancemeasurement issues
• Recruits others to beinvolved
• Applies and teachesperformancemeasurementconcepts
• Initiates performancemeasurement efforts
Source: Vital Signs, Steven M. Hronec
12
36 The steering team is responsible for leading and coordinating theeffort throughout the organization. Team members must revisitand/or develop the organization’s vision and strategy, identifyperformance goals and measures, and create awareness, buy-in,and ownership of the new performance measurement system amongall employees.
37 The effective design and implementation of the I-PMS also callsfor the use of a dedicated design team. This team’s objective is todeliver a company-wide I-PMS in a timely manner. The criteriathe design team should use to guide its efforts include ensuringthat the final measurements meet company objectives and reflectcurrent strategies and that the measurements seamlessly integrateboth the top-down and bottom-up perspectives.
38 The design team should not be overly large, no more than three tofive people. The composition of the team should be based on acareful assessment of where performance information is mostneeded to ensure performance improvements. For instance, atLabatt Breweries of Canada, the design team included a marketingmanager, a sales manager, a finance manager, and twomanufacturing managers. In a company where profitability wasdirectly driven by market share, ensuring that the right beer wasavailable in the right markets at the right times was critical.Marketing defined the critical success factors for the company;manufacturing ensured effective execution of the defined plans.The I-PMS had to serve both these management groups if companyobjectives for market share and profitability improvements wereto be achieved.
39 Tasks that are the direct responsibility of the design team include:
• interviewing key personnel/resources;
• documenting factors that affect an area’s overall performance;
• designing specific performance measures to meet unit objectivesand reflect performance drivers for the area;
• performing detailed cost and problem analysis;
• developing business models to help define KPIs;
13
• writing user procedures;• developing a communication plan for the implementation;• training/educating users; and• supporting the system after implementation.
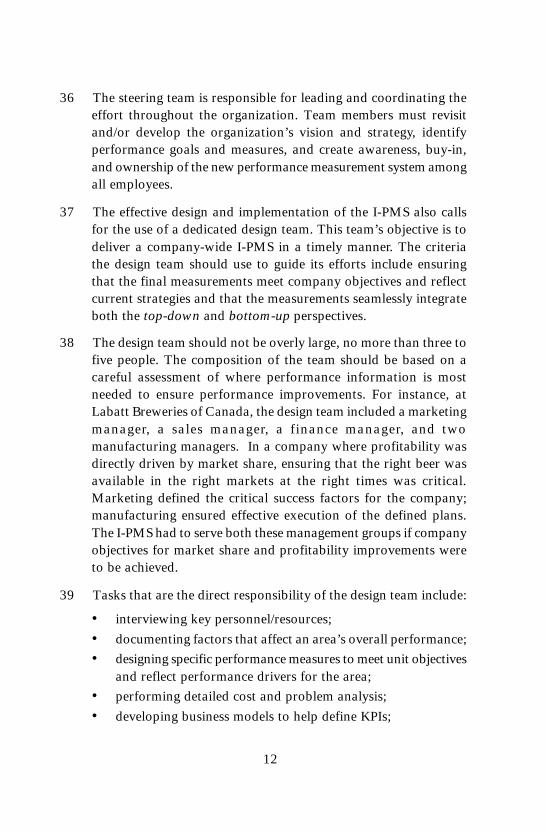
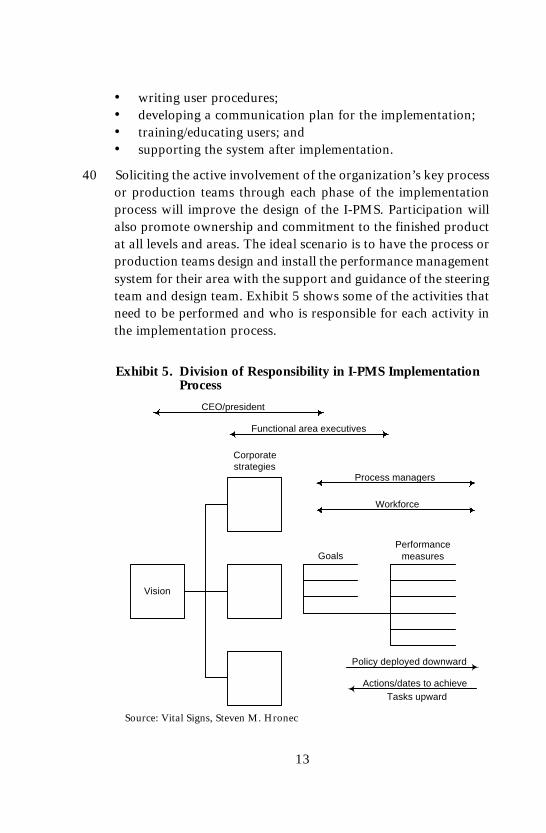
40 Soliciting the active involvement of the organization’s key processor production teams through each phase of the implementationprocess will improve the design of the I-PMS. Participation willalso promote ownership and commitment to the finished productat all levels and areas. The ideal scenario is to have the process orproduction teams design and install the performance managementsystem for their area with the support and guidance of the steeringteam and design team. Exhibit 5 shows some of the activities thatneed to be performed and who is responsible for each activity inthe implementation process.
Exhibit 5. Division of Responsibility in I-PMS ImplementationProcess
Vision
Corporatestrategies
CEO/president
Functional area executives
Process managers
Workforce
GoalsPerformance
measures
Policy deployed downward
Actions/dates to achieveTasks upward
Source: Vital Signs, Steven M. Hronec
14
41 The conceptual designs for all levels and areas affected by theI-PMS initiative should be developed concurrently. A concurrentapproach enables the design team to identify the unique informationneeds at each level of the organization and understand theirinterrelationships. It also enables personnel at each level to provideinput on the performance indicators for the levels both above andbelow them, as well as for their own operating unit.
42 It is imperative that people from all levels of the organization beactively involved in each phase of the process. The personnel whowork in each area best understand the factors and problems thataffect performance in their work cell or area. They will determinewhether the full benefit of the effort is realized by how completelythey adopt the new system.
43 Participation and communication help ensure consistency andintegration of the measurements throughout the organization. Theyalso aid in increasing the understanding of what the measurementsmean, how they will be used, and how they link to support theattainment/achievement of organizational goals. This approach canreduce the uncertainty and risk people feel as the new system isimplemented.
Understanding the Organization’s Goals and Strategies
44 Before new performance measurements can be seriously considered,the design team must thoroughly understand the business and themarketplace. Both success factors that affect the majority of operatingunits, such as process quality, and the unique factors that affect onlya single unit, such as availability of a key material or downtime of acritical machine, must be considered in the analysis.
45 Integrating these diverse measures into an effective, elegant I-PMSdesign can be facilitated by careful review and analysis of therelationships among strategic objectives, core business strategies,critical success factors, and key performance indicators. Thefollowing elements are potential sources of information foridentifying the strategic objectives and critical success factors thatare the foundation of an integrated business performance model:
15
• vision and mission statements;• strategic objectives;• customer requirements; and• compensation and reward systems.
46 Ensuring that these deployment mechanisms are consistent acrossfunctions and processes, as well as from one management level tothe next, is critical if the I-PMS is to provide the desired benefits.In the following discussion, these vital components are developedin more depth.
Vision Statements
47 A vision statement describes the basic goals, characteristics, andphilosophies that will shape the strategic direction of theorganization. The vision guides future improvement actions andaids in isolating opportunities to enhance the firm’s competitiveadvantage. An effective vision statement also aligns actionsthroughout the organization by providing a clear signal to guidedecisions and effort on a daily basis.
48 A vision statement is important because it helps employees focustheir efforts on achieving the overall goals of the organization. Italso improves coordination and communication with suppliers andcustomers, assuring that these stakeholders work with theorganization. The vision defines what the organization is about,why it exists, in a way that all stakeholders can understand.
49 A well-defined vision statement has three major components. First,it contains a focused concept or value-creation promise that peoplecan visualize. Second, it must have a sense of noble purpose. Thevision statement must emphasize something that is worth doing,something that can create value for stakeholders, make a definedcontribution to achieving stakeholder goals, and help theorganization win people’s commitment to the attainment of itsstrategic goals. Finally, an effective vision statement should have aplausible chance of success. The vision must represent somethingthat people can realistically expect to achieve. The followingillustrates examples of good vision statements:
16
• Starbucks: “to be the premier purveyor of the finest coffee inthe world.”
• Microsoft: “to create software that empowers the users ofpersonal computers.”
50 Each of these vision statements is an accurate reflection of theprimary driving force of excellence within these uniqueorganizations. They communicate quickly and precisely what thefirm is about and how it is seeking to provide value to its customers.These are effective vision statements because they so clearly capturethe essence of the organization in terms all stakeholders understand.Achieving the vision, though, requires a more elaborate definitionof the how, what, who, where, and why questions that create aframework for action. The mission statement provides theseanswers.
Mission Statements
51 An effective mission statement includes a clear statement aboutthe specific customers’ needs the organization is attempting tomeet—not what products or services are offered. To accomplishthis goal, the mission statement has to define unambiguously whothe organization’s primary customers are as well as how theorganization plans to go about its business (e.g., what its primarytechnologies are). The mission statements used by Johnson &Johnson and Southwest Airlines Company are good examples ofthese points.
“Johnson & Johnson is the world’s largest and mostcomprehensive manufacturer of health care products servingthe consumer, pharmaceutical, and professional markets.”
“Southwest Airlines Company is the nation’s low-fare, highcustomer satisfaction airline. We primarily serve short-haulcity pairs, providing single-class air transportation whichtargets the business commuter as well as leisure travelers.”

17
52 There are several criteria for evaluating the effectiveness of amission statement. First, the mission statement should be a culturalreflection of the values, beliefs, and philosophy of the organization.It should reflect who the organization is, not what it does. Second,the mission statement needs to be clear, brief, and understandableto all employees. If people do not understand the mission, theycannot use it to guide their activities and decisions.
53 Next, the mission statement should specify clearly what business theorganization is in. It should leave no one in doubt about theorganization’s focus relating to its markets, customers, and products.Fourth, the mission statement should motivate the organization,serving as a source of energy as well as a rallying point. Finally,the mission statement should reflect the distinctive competence ofthe organization. It must set the organization apart from itscompetitors in ways the customer recognizes and values, if strategicobjectives are to be met. When the overall mission of anorganization is well defined along each of these dimensions, theorganization can proceed to evaluate performance in a meaningfulway.
Strategic Objectives
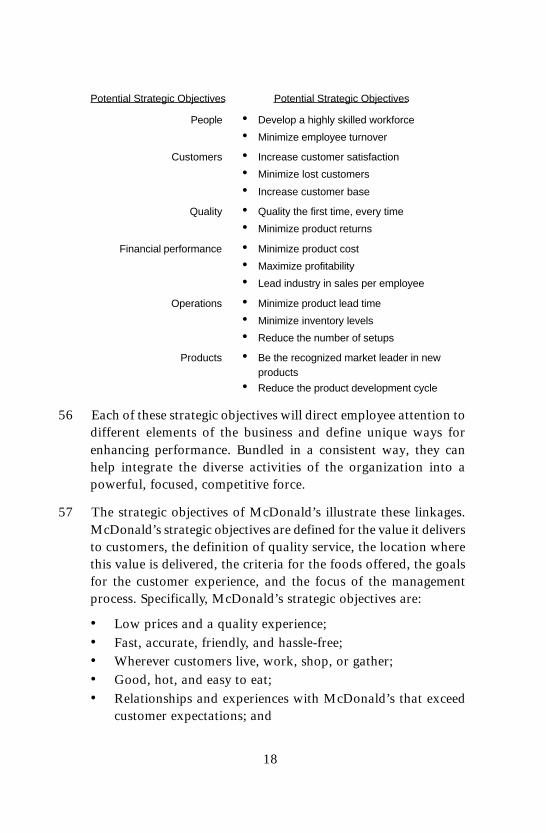
54 At the heart of the performance management process is a clear,unambiguous set of strategic objectives that shape current and futureactions and results. These objectives should reflect critical successfactors along the primary dimensions of the competitive puzzle:people, customers, quality, financial performance, operation, products,and marketing as well as the organization’s mission and vision.
55 Examples of strategic objectives for each of these primarydimensions of performance are illustrated on the next page.
18
Potential Strategic Objectives Potential Strategic Objectives
People • Develop a highly skilled workforce
• Minimize employee turnover
Customers • Increase customer satisfaction
• Minimize lost customers
• Increase customer base
Quality • Quality the first time, every time
• Minimize product returns
Financial performance • Minimize product cost
• Maximize profitability
• Lead industry in sales per employee
Operations • Minimize product lead time
• Minimize inventory levels
• Reduce the number of setups
Products • Be the recognized market leader in newproducts
• Reduce the product development cycle
56 Each of these strategic objectives will direct employee attention todifferent elements of the business and define unique ways forenhancing performance. Bundled in a consistent way, they canhelp integrate the diverse activities of the organization into apowerful, focused, competitive force.
57 The strategic objectives of McDonald’s illustrate these linkages.McDonald’s strategic objectives are defined for the value it deliversto customers, the definition of quality service, the location wherethis value is delivered, the criteria for the foods offered, the goalsfor the customer experience, and the focus of the managementprocess. Specifically, McDonald’s strategic objectives are:
• Low prices and a quality experience;• Fast, accurate, friendly, and hassle-free;• Wherever customers live, work, shop, or gather;• Good, hot, and easy to eat;• Relationships and experiences with McDonald’s that exceed
customer expectations; and
19
• Ongoing performance improvement through creativeleadership and management processes.
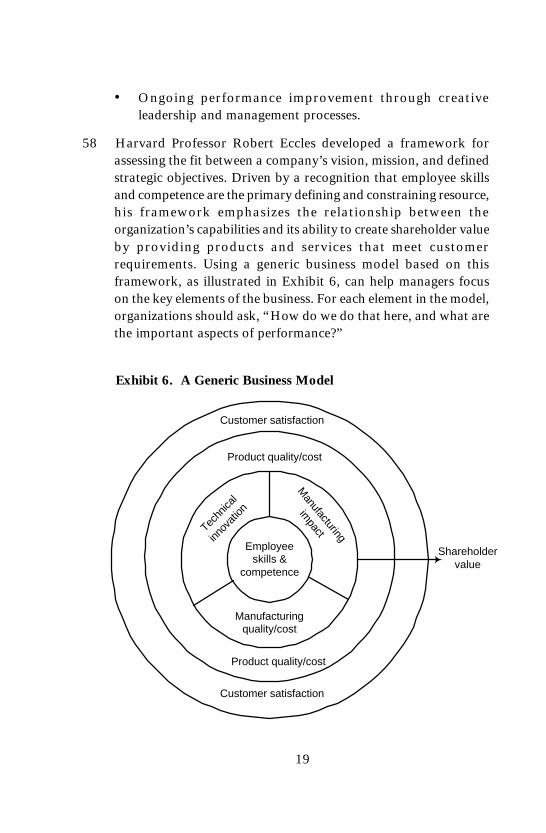
58 Harvard Professor Robert Eccles developed a framework forassessing the fit between a company’s vision, mission, and definedstrategic objectives. Driven by a recognition that employee skillsand competence are the primary defining and constraining resource,his framework emphasizes the relationship between theorganization’s capabilities and its ability to create shareholder valueby providing products and services that meet customerrequirements. Using a generic business model based on thisframework, as illustrated in Exhibit 6, can help managers focuson the key elements of the business. For each element in the model,organizations should ask, “How do we do that here, and what arethe important aspects of performance?”
Exhibit 6. A Generic Business Model
Employeeskills &
competence
Customer satisfaction
Product quality/cost
Shareholdervalue
Techn
ical
innov
ation
Manufacturingquality/cost
Manufacturing
impact
Customer satisfaction
Product quality/cost
20
59 In addition to the review of the firm’s vision and mission statementsand strategic objectives, the design team should conduct a seriesof interviews with key unit and subunit managers, engineers,supervisors, and other employees. A performance measurementquestionnaire should be developed and used to understand theimportance of various areas in the company and the applicabilityof possible performance measures. The questionnaire should becompleted by all affected employees and the results compiled bythe design team. The intent of this tool is to involve managers andfunctional employees in the design process and to use their inputto create effective, actionable, and informative performancemeasures appropriate to the needs of I-PMS users.
60 The design of this performance measurement questionnaire shouldinclude such elements as:
• general data—classifies the respondents;
• production improvement—focuses on competitive prioritiesand the current performance measurement system related tothe core activity of the organization or department (for instance,manufacturing); and
• personal performance measures—focuses on the respondents’perceptions of the most important measures for assessingindividual performance. These measures should be judged ineach of five time frames: daily, weekly, monthly, quarterly,and annually. Space should be included for general comments,so respondents can voice their feelings and opinions about theprocess.
61 The questionnaire can be supplemented by facilitated groupsessions. These sessions can be used to debrief the survey results,seek clarification on specific issues and measures, and judge theoverall reaction to the survey within the organization.
Customer Requirements
62 Addressing the customer perspective is a critical part ofunderstanding the goals and strategies of the organization. To
21
identify customers’ key service and product requirements and togauge current performance against these needs, customer interviewsshould be conducted to identify the following:
• performance requirements;• critical success factors;• relative weight/importance of various performance criteria;• a performance baseline; and• opportunities for improving.
63 Requirements identified during customer interviews typically focuson delivering high-quality products and services on time, and at acompetitive cost, while maintaining a flexible organizationresponsive to changing customer needs.
64 For example, during the implementation of the I-PMS at EdmontonTelephone, their design team initiated an assessment ofstakeholders’ needs, focusing specifically on the expectations andrequirements of customers. Specific customer needs werecategorized on three dimensions: time, quality, and costimplications. The identified needs formed the basis for developingthe core entity performance measures used to define the type,number, and focus of measures deployed throughout theorganization.
Compensation and Reward
65 Compensation and reward systems should not exist in a vacuumbut should be related to the organization’s strategy and short-term,medium-term, and long-term goals.
66 An important factor is the strategic role, in particular, theresponsibilities of each organizational unit. Once the responsibilitiesof these units are determined, performance measures can bedeveloped. Performance can be measured for the individual, adivision, or the entire organization.
67 Some companies, believing that tying financial compensation toperformance is a powerful lever, have established such a linkage.For example, a major American oil company uses its performance
22
measurement system as the sole basis for computing incentivecompensation. The company ties 60 percent of its executive bonusesto their achievement on ambitious targets for a weighted-averageof four financial indicators: return on capital, profitability, cashflow, and operating cost. It bases the remaining 40 percent onindicators of customer satisfaction, dealer satisfaction, employeesatisfaction, and environmental responsibility.
68 As attractive and as powerful as such a linkage is, it neverthelesscarries risks. For instance, does the company have the rightmeasures? Does it have valid and reliable data for the selectedmeasures? Could there be unintended or unexpected consequencesfrom the way the targets for the measures are achieved? These areimportant questions the design team should ask.
Developing a Draft Performance Model
69 The results of the questionnaires, interviews, and document reviewsare combined to create a draft business performance model. Adraft model makes the performance initiative come to life andbecome “real” to the persons using it. Effort should be taken toensure that the identified measures are unambiguous and that thelinkage between measures used at different levels of the organizationis clear. An example of a draft model for the order fulfillmentprocess is illustrated in Exhibit 7.

23
70 Both financial and nonfinancial measures should be included in adraft performance model. Reporting and measuring frequenciesshould be noted as well as who (e.g., what area) is to receive thereports or use the measures. The more complete the draft model,the more effective it will be in communicating the focus andstructure of the new performance management system to individualsat all levels of the organization. It is a draft model, though. Thisfact should be clearly communicated so that people feel free tochallenge it and participate in modifying measures that fail to meettheir needs.
Exhibit 7. Draft Performance Model
Function Objectives Strategies Actions KPIs
Orderprocessing
Customersatisfaction
Fast deliveryand installation(percentageon-timeinstallations)
Accurateorder datelogging
Accuratedelivery datelogging
Reducevendorresourceconflicts
Order datelogging errors
Deliverydate logging
Number ofinstallchecklists notcompleted
Number ofconfigurationsnot tested
Qualityinstallation(number ofcallbacks
Maximumcost effec-tiveness
Accuratelyfollowinstallationguidelines
Completelytestconfigurations
Promptlyaddressvendorissues
Satisfybusinessobjectives
Vendorissues notaddressedwithin 48hours
24
Defining the Critical Success Factors
71 Critical success factors (CSFs) focus attention on the key dimensionsof performance the firm must excel at if it is to achieve its goalsand meet customer requirements. Limited in number, CSFsemphasize the activities and processes that will have the mostimpact on total performance and that will drive accomplishmentin supporting areas.
72 The emphasis is on the reporting system at the organization’s highestlevels. This system needs to reflect the relative importance of thedifferent aspects of performance, as identified by the critical factors.
73 Typical enterprisewide CSFs include:
• producing products that customers perceive to be of the high-est quality;
• designing new products quickly;• keeping the cost of the product or service low; and• responding quickly and fully to customer requests.
Defining the Key Performance Indicators
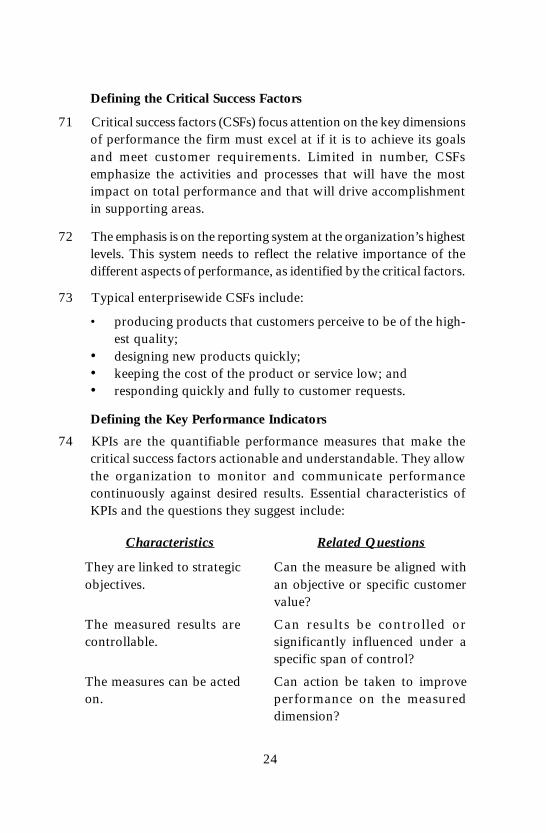
74 KPIs are the quantifiable performance measures that make thecritical success factors actionable and understandable. They allowthe organization to monitor and communicate performancecontinuously against desired results. Essential characteristics ofKPIs and the questions they suggest include:
Characteristics Related Questions
They are linked to strategicobjectives.
The measured results arecontrollable.
The measures can be actedon.
Can the measure be aligned withan objective or specific customervalue?
Can results be controlled orsignificantly influenced under aspecific span of control?
Can action be taken to improveperformance on the measureddimension?
25
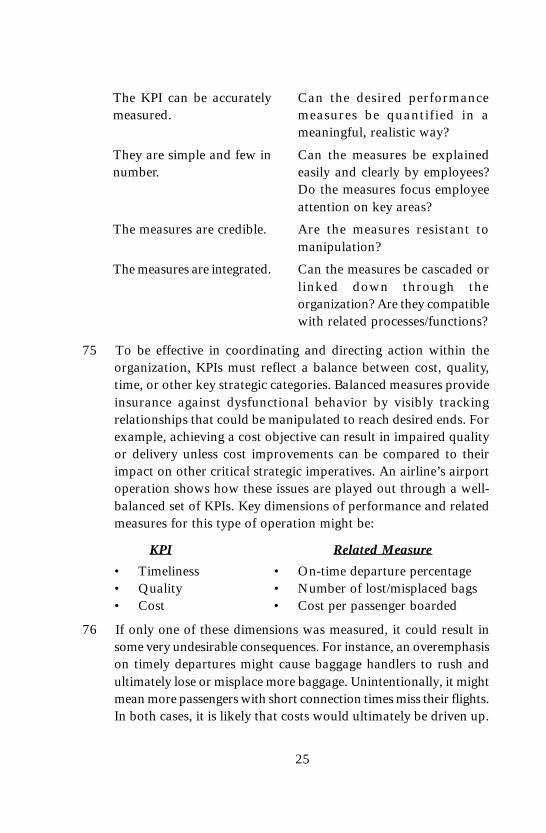
The KPI can be accuratelymeasured.
They are simple and few innumber.
The measures are credible.
The measures are integrated.
Can the desired performancemeasures be quantified in ameaningful, realistic way?
Can the measures be explainedeasily and clearly by employees?Do the measures focus employeeattention on key areas?
Are the measures resistant tomanipulation?
Can the measures be cascaded orlinked down through theorganization? Are they compatiblewith related processes/functions?
75 To be effective in coordinating and directing action within theorganization, KPIs must reflect a balance between cost, quality,time, or other key strategic categories. Balanced measures provideinsurance against dysfunctional behavior by visibly trackingrelationships that could be manipulated to reach desired ends. Forexample, achieving a cost objective can result in impaired qualityor delivery unless cost improvements can be compared to theirimpact on other critical strategic imperatives. An airline’s airportoperation shows how these issues are played out through a well-balanced set of KPIs. Key dimensions of performance and relatedmeasures for this type of operation might be:
KPI Related Measure
• Timeliness • On-time departure percentage• Quality • Number of lost/misplaced bags• Cost • Cost per passenger boarded
76 If only one of these dimensions was measured, it could result insome very undesirable consequences. For instance, an overemphasison timely departures might cause baggage handlers to rush andultimately lose or misplace more baggage. Unintentionally, it mightmean more passengers with short connection times miss their flights.In both cases, it is likely that costs would ultimately be driven up.

26
77 If, instead, the measures placed an overemphasis on eliminatinglost or misplaced baggage, it is quite likely costs would increaseand the probability of late departures would increase. Finally, alack of balance might play out through an overemphasis oncustomer service and safety. Only by keeping all three measuresclearly in sight (visibly linking the interrelationships among thecritical success factors) can an organization reduce or eliminateundesirable consequences.
78 Balance is not the only issue that needs to be addressed in thedevelopment of an effective I-PMS. To achieve its strategicobjectives, an organization must focus on identifying the right KPIsas well as on placing the right amount of emphasis on each specificmeasure. Areas to focus on when defining critical success factorsand their corresponding KPIs include:
• What are the cost drivers in today’s business and where arethey controlled? If a company does a poor job identifying actualcost drivers, then it will be very difficult to develop effectiveKPIs.
• Which factors have the biggest impact on cost? It is imperativethat the KPIs target those areas where improvement is neededthe most and the resulting impact will be greatest. Some areasthat might be explored would be scrap, raw materials, andlabor.
• What are the major problems in the process or organizationthat act as barriers to meeting performance objectives?Problems such as excessive or unplanned machine downtime,absenteeism, and production or process bottlenecks can inhibitor prevent the attainment of strategic objectives.
• What things do we have to do correctly to retain our currentcustomers? Specifically, the organization needs to understandwhat factors are critical if desired growth objectives are to bemet and what factors are really not very important in thisregard.
79 While many different tools and techniques can be used to gatherthe information required to answer these questions, several specific
27
approaches have been found most useful: (1) the Ishikawa cause-and-effect diagram; (2) Pareto diagrams/analysis; and (3) targetedreviews of existing performance measures.
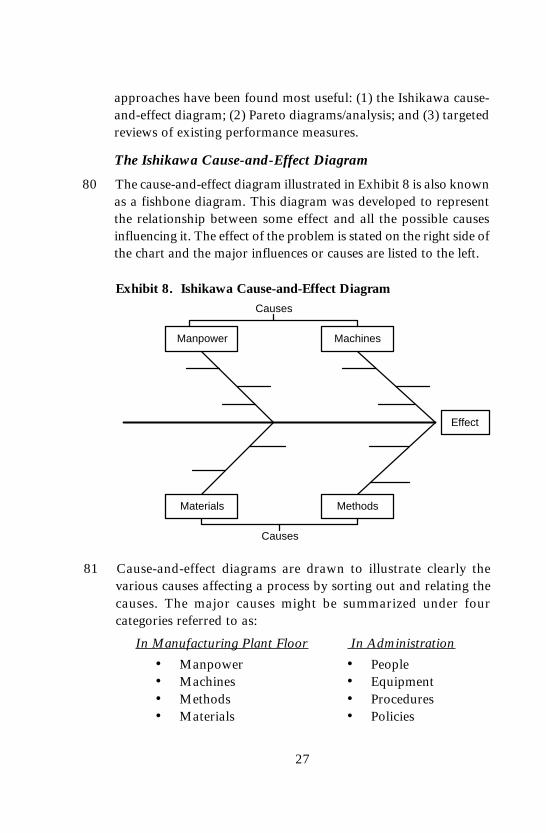
The Ishikawa Cause-and-Effect Diagram
80 The cause-and-effect diagram illustrated in Exhibit 8 is also knownas a fishbone diagram. This diagram was developed to representthe relationship between some effect and all the possible causesinfluencing it. The effect of the problem is stated on the right side ofthe chart and the major influences or causes are listed to the left.
Exhibit 8. Ishikawa Cause-and-Effect Diagram
81 Cause-and-effect diagrams are drawn to illustrate clearly thevarious causes affecting a process by sorting out and relating thecauses. The major causes might be summarized under fourcategories referred to as:
In Manufacturing Plant Floor In Administration
• Manpower • People• Machines • Equipment• Methods • Procedures• Materials • Policies
Effect
MachinesManpower
Causes
Materials Methods
Causes
28
82 Typical of costly categories of root causes are:
• processes that require sequential processing by manyindividuals;
• incompatible or redundant systems;• organizational structures that distance work from its
customers;• unreliable operating capacity with frequent unplanned
downtime; and• lack of training or versatility in the workforce.
83 Once the fishbone diagram is developed and the most likely causesare identified and selected for further analysis, the design teamshould ask “why” each of the causes is occurring. By asking “why,”the design team can target recurring problems with theirrecommended KPIs.
Pareto Diagrams/Analysis
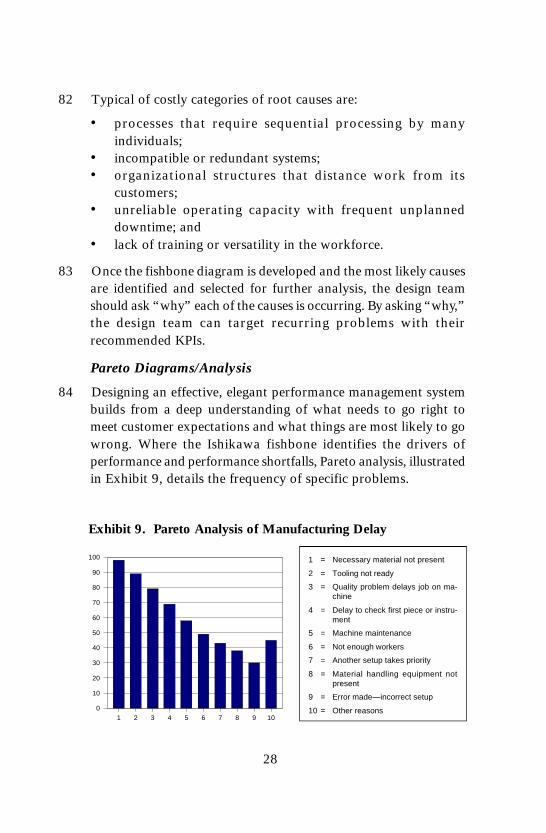
84 Designing an effective, elegant performance management systembuilds from a deep understanding of what needs to go right tomeet customer expectations and what things are most likely to gowrong. Where the Ishikawa fishbone identifies the drivers ofperformance and performance shortfalls, Pareto analysis, illustratedin Exhibit 9, details the frequency of specific problems.
Exhibit 9. Pareto Analysis of Manufacturing Delay
1 = Necessary material not present
2 = Tooling not ready
3 = Quality problem delays job on ma-chine
4 = Delay to check first piece or instru-ment
5 = Machine maintenance
6 = Not enough workers
7 = Another setup takes priority
8 = Material handling equipment notpresent
9 = Error made—incorrect setup
10 = Other reasons1 2 3 4 5 6 7 8 9 10
0
10
20
30
40
50
60
70
80
90
100
29
85 Specific performance measures should be created to target andeliminate the most common causes of performance shortfalls andproblems. Reflecting Pareto’s principle, namely that 80 percent ofthe problems can be traced back to 20 percent of the variables/causes, Pareto analysis aids in the selection of KPIs that will providethe greatest improvement against organizational goals and customerexpectations.
Review of Existing Performance Measures
86 Another approach for identifying KPIs is to review existingperformance measures. This review often reveals key measurablesthat may not have been identified in the draft model but that playa vital role in tracking some key element of performance. The goalis to understand what is measured currently, why, by whom, andwhere. These measures should be evaluated to determine if theyencourage constructive activity, support management strategy, arecontrollable within the operating unit, and are easily understood.Measures that are clear, actionable, controllable, and acceptedshould be identified and considered for inclusion in the draft model.
87 The combination of these tools allows the design team to identifyand develop KPIs that will move a unit or process rapidly towardits performance goals. Much of the information needed to developthe analysis can come from questionnaires or current operatinginformation (e.g., cost accounting systems, incident logs, andexisting performance measures). The objective is to identify factorscritical to the success of the organization that may not have surfacedduring the top-down analysis.
Finalizing the Integrated Business Performance Model
88 After reviewing current performance measures and performing theroot cause and Pareto analysis, the design team should review thedraft business model to identify any issues that may have beenoverlooked in the earlier design. It is important at this point todevelop a systematic review process, in which critical success factorsare matched against the KPIs in the draft model to identify overlaps,holes, and ambiguities. A KPI checklist may include details for all
30
critical success factors, as well as the measures being proposed totrack them within each unit or for the organization as a whole.Care should be taken to ensure that measures supply vitalinformation to track and motivate performance measurable againststrategic objectives and related critical success factors.
89 Having ensured that logical, actionable measures are present foreach critical success factor, the design team needs to turn its attentionto integrating the objectives and information gathered from thetop-down and bottom-up analyses. The draft model should berevised when necessary to reflect high-priority factors to be trackedwith focused measures. The integration should deal specificallywith the types of measures used at various levels of the organization(financial versus nonfinancial), potential performance baselines(historical average, standards, or best practice benchmarks), andthe aggregation of measures both vertically and horizontally tosupport management analysis and control.
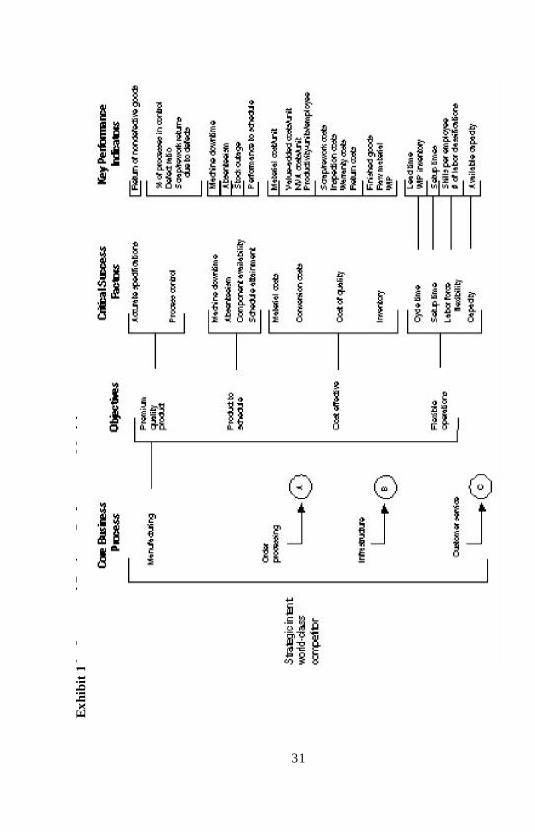
90 An integrated business performance model requires a cleardefinition of the firm’s strategic intent. From this intent, the corebusiness processes that will be used to gain the desired performancegoals, the objectives they must deliver against, and the relatedcritical success factors and KPIs must be identified. An integratedbusiness performance model for a manufacturing firm is illustratedin Exhibit 10. As the subsequent detail suggests, each core businessprocess is fleshed out, resulting in a comprehensive set of measuresthat define and coordinate performance across the organization.
31
Exh
ibit
10.
Int
egra
ted
Bus
ines
s Pe
rfor
man
ce M
odel

32
Exh
ibit
10.
Int
egra
ted
Bus
ines
s Pe
rfor
man
ce M
odel
33
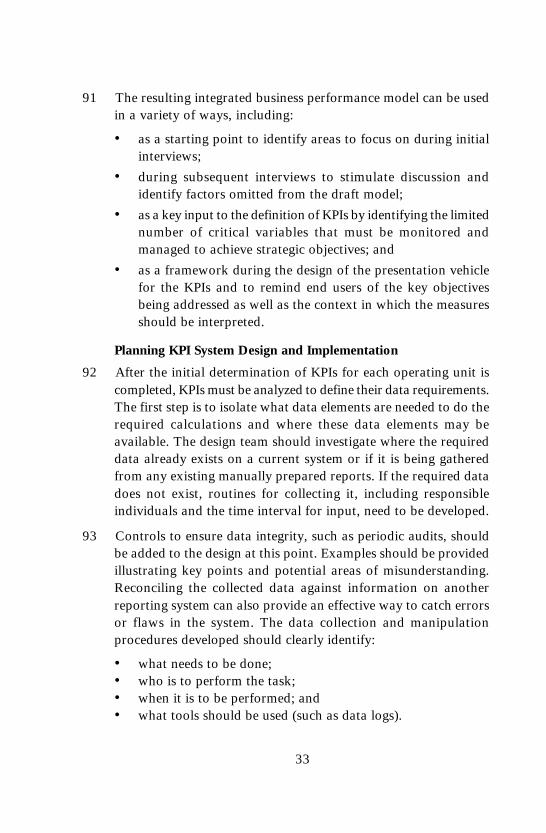
91 The resulting integrated business performance model can be usedin a variety of ways, including:
• as a starting point to identify areas to focus on during initialinterviews;
• during subsequent interviews to stimulate discussion andidentify factors omitted from the draft model;
• as a key input to the definition of KPIs by identifying the limitednumber of critical variables that must be monitored andmanaged to achieve strategic objectives; and
• as a framework during the design of the presentation vehiclefor the KPIs and to remind end users of the key objectivesbeing addressed as well as the context in which the measuresshould be interpreted.
Planning KPI System Design and Implementation
92 After the initial determination of KPIs for each operating unit iscompleted, KPIs must be analyzed to define their data requirements.The first step is to isolate what data elements are needed to do therequired calculations and where these data elements may beavailable. The design team should investigate where the requireddata already exists on a current system or if it is being gatheredfrom any existing manually prepared reports. If the required datadoes not exist, routines for collecting it, including responsibleindividuals and the time interval for input, need to be developed.
93 Controls to ensure data integrity, such as periodic audits, shouldbe added to the design at this point. Examples should be providedillustrating key points and potential areas of misunderstanding.Reconciling the collected data against information on anotherreporting system can also provide an effective way to catch errorsor flaws in the system. The data collection and manipulationprocedures developed should clearly identify:
• what needs to be done;• who is to perform the task;• when it is to be performed; and• what tools should be used (such as data logs).

34
Detailed Design/Implementation Phase
94 After a preliminary set of operational KPIs has been identified, theimplementation of the I-PMS turns toward the creation of a detaileddesign. Focused on identifying the specific KPIs that will beimplemented at the firm, this phase yields the scoreboard, datacollection and manipulation procedures, cost/benefit analysis, keytraining and education needs, and conversion to the new system.It is often best to address these issues at the cell or work team levelbefore moving up to the process, subplant, and organizational levels.This allows for maximum flexibility and learning with minimaldisruption of the organization. The lessons learned and stepsundertaken are very similar as the scope of the detailed designwidens.
Developing Scoreboards
95 Once the KPIs have been selected, a cell or team scoreboardbecomes a useful tool. Scoreboards display information related tothe key performance indicators, providing a highly visible, easilyinterpreted integration of the key measures driving performancein an area. As suggested by Exhibit 11, the scoreboard can alsodisplay or include the following items:
Exhibit 11. Cell or Team Scoreboards`
PerformanceMeasures
LOCK ASSEMBLY
Mission Statement Team Members
Action ItemsBulletins& Notices
DiagnosticMeasures
xxxxxxxxxxxxxxxxxxxxx
xxxxxxxxxxxxxxxxxxxxx
xxxxxxxxxxxxxxxxxxxxx
xxxxxxxxxxxxxxxxxxxxx
______ü______ü______ü______ü
______ü______ü______ü______ü
______ü______ü______ü______ü
______ü______ü______ü______ü
1st
CellStatusLight

35
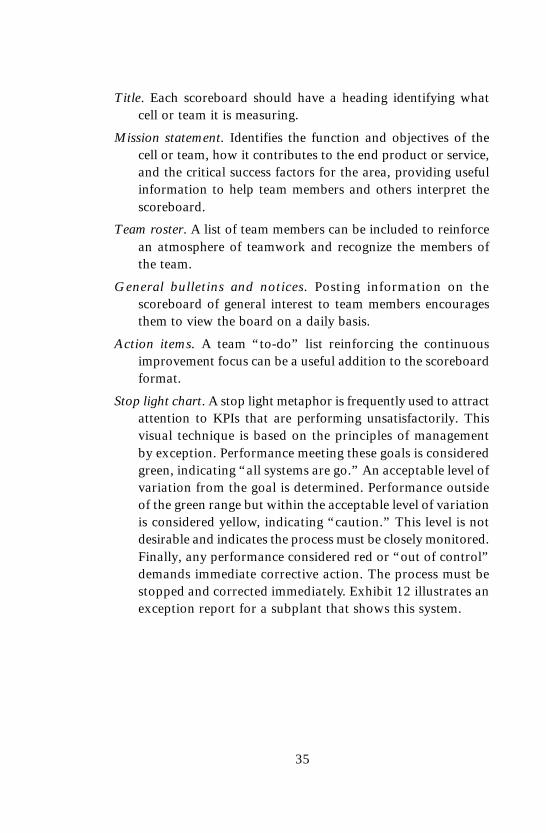
Title. Each scoreboard should have a heading identifying whatcell or team it is measuring.
Mission statement. Identifies the function and objectives of thecell or team, how it contributes to the end product or service,and the critical success factors for the area, providing usefulinformation to help team members and others interpret thescoreboard.
Team roster. A list of team members can be included to reinforcean atmosphere of teamwork and recognize the members ofthe team.
General bulletins and notices. Posting information on thescoreboard of general interest to team members encouragesthem to view the board on a daily basis.
Action items. A team “to-do” list reinforcing the continuousimprovement focus can be a useful addition to the scoreboardformat.
Stop light chart. A stop light metaphor is frequently used to attractattention to KPIs that are performing unsatisfactorily. Thisvisual technique is based on the principles of managementby exception. Performance meeting these goals is consideredgreen, indicating “all systems are go.” An acceptable level ofvariation from the goal is determined. Performance outsideof the green range but within the acceptable level of variationis considered yellow, indicating “caution.” This level is notdesirable and indicates the process must be closely monitored.Finally, any performance considered red or “out of control”demands immediate corrective action. The process must bestopped and corrected immediately. Exhibit 12 illustrates anexception report for a subplant that shows this system.
35
Title. Each scoreboard should have a heading identifying whatcell or team it is measuring.
Mission statement. Identifies the function and objectives of thecell or team, how it contributes to the end product or service,and the critical success factors for the area, providing usefulinformation to help team members and others interpret thescoreboard.
Team roster. A list of team members can be included to reinforcean atmosphere of teamwork and recognize the members ofthe team.
General bulletins and notices. Posting information on thescoreboard of general interest to team members encouragesthem to view the board on a daily basis.
Action items. A team “to-do” list reinforcing the continuousimprovement focus can be a useful addition to the scoreboardformat.
Stop light chart. A stop light metaphor is frequently used to attractattention to KPIs that are performing unsatisfactorily. Thisvisual technique is based on the principles of managementby exception. Performance meeting these goals is consideredgreen, indicating “all systems are go.” An acceptable level ofvariation from the goal is determined. Performance outsideof the green range but within the acceptable level of variationis considered yellow, indicating “caution.” This level is notdesirable and indicates the process must be closely monitored.Finally, any performance considered red or “out of control”demands immediate corrective action. The process must bestopped and corrected immediately. Exhibit 12 illustrates anexception report for a subplant that shows this system.

36
SUMMARY/EXCEPTION REPORTSUBPLANT
WEEK ENDING MM-DD-YY
This Period Year To Date
Key Performance Indicators Goal Actual Status Goal Actual Status
Subplant-level KPIs
Customer satisfaction 95% 82% RED 95% 96% Green
Schedule performance 20000 19100 Yellow 19000 19500 Green
On-time delivery 95% 97% Green 95% 96% Green
Subplant cost rate $0.05 $0.05 Green $0.06 $0.06 Green
Productivity 850 883 Green 800 823 Green
Lead time 13 12 Green 14 13 Green
No. of scheduled orders/day 10 11 Green 9 10 Green
Percentage of setup 10% 15% RED 10% 11% Yellow
Available capacity 20% 18% RED 20% 21% Yellow
96 A scoreboard serves many useful functions. For instance, it canact as a source of information for the entire cell team as well as forany visitors. The scoreboard also promotes “management bywalking around” by providing a visible, succinct, up-to-date statusreport. The scoreboard encourages participatory management asinformation is disseminated to the entire team. Teamwork isencouraged as team goals and achievements are stressed. Finally, awell-designed scoreboard broadcasts success stories and providespositive reinforcement of behavior through recognition ofoutstanding performance.
97 An I-PMS operates these scoreboards at several levels. For example,there may be scorecards for each product family as well as a seniormanagement scorecard that summarizes the entire organization.By allowing this change in scope, this feature helps departments,process teams, and individuals focus on the measures and actionsfor which they are accountable.
98 When placing individual KPIs on a scoreboard, measures withclose relationships should be grouped, providing for a simultaneous
Exhibit 12. Scoreboard Report

37
review of their trend lines. These visual comparisons can lead toimproved diagnostic and core problem analysis. While manydifferent methods can be used to post measures, graphicalpresentation is the preferred approach. Placing a forecast line onthe graph creates a visual trace of effectiveness of improvementefforts.
99 Exhibit 13 illustrates a graphical format used to display cell level“performance to schedule” for a machining cell in a manufacturingfirm.
•
Exhibit 13. Graphical Format to Display KPIs
Matching Cell Defects to Forecast
0 1 2 3 4 50
1
2
3
4
5
6
7
8
9
10
Time (weeks)
Def
ects
per
100
un
its
Legend
Forecast
Actual
Week 1 2 3 4 5
Actual defects 8 9 8.5 7.8 9Forecast defects 9.5 9 8.5 8 7.5
100 Although higher-level scoreboards are very similar to those designedat the cell or team level, several key differences should be kept inmind:
• data on subplant and plant scoreboards tends to be updatedless often than cell or team scoreboards;
• subplant and plant scoreboards are viewed by more peoplethan their cell or team counterparts;
• they are less interactive than on cell or team scoreboards; and
38
• they serve as public relations tools, as well as performancemanagement tools. It may be important to make the boardmore attractive to make a positive, professional statement.
101 Organizations can choose from several scorecard approaches.Popular systems currently include Robert Kaplan and DavidNorton’s Balanced Scorecard, the Vital Signs approach from ArthurAndersen, and the Baldrige Award criteria. Many organizationsdevelop their own scoreboard/card approach that may be basedon one of these systems or on their own unique perspective.
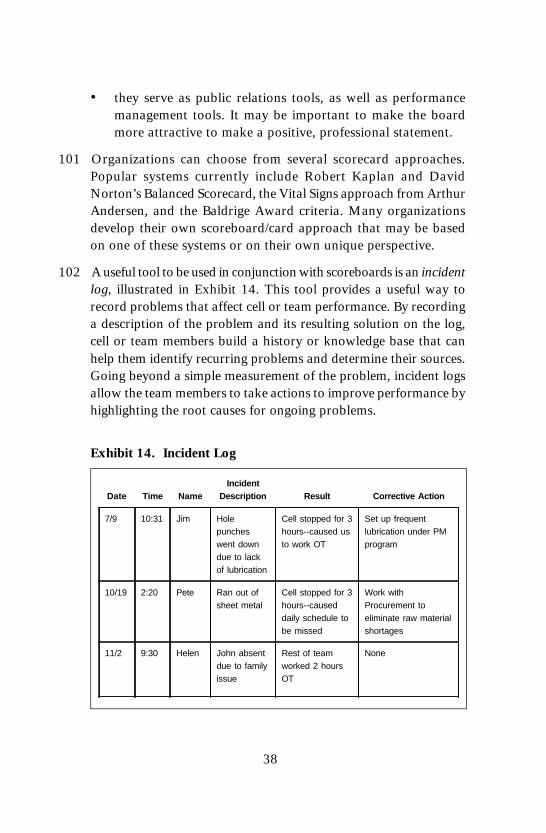
102 A useful tool to be used in conjunction with scoreboards is an incidentlog, illustrated in Exhibit 14. This tool provides a useful way torecord problems that affect cell or team performance. By recordinga description of the problem and its resulting solution on the log,cell or team members build a history or knowledge base that canhelp them identify recurring problems and determine their sources.Going beyond a simple measurement of the problem, incident logsallow the team members to take actions to improve performance byhighlighting the root causes for ongoing problems.
Exhibit 14. Incident Log
Date Time NameIncident
Description Result Corrective Action
7/9 10:31 Jim Holepuncheswent downdue to lackof lubrication
Cell stopped for 3hours--caused usto work OT
Set up frequentlubrication under PMprogram
10/19 2:20 Pete Ran out ofsheet metal
Cell stopped for 3hours--causeddaily schedule tobe missed
Work withProcurement toeliminate raw materialshortages
11/2 9:30 Helen John absentdue to familyissue
Rest of teamworked 2 hoursOT
None
39
103 As the functional and technical designs are being completed,attention focuses on the integration with the organization’sinformation systems, developing an implementation plan, cost/benefit analysis, and the training/education needs of affectedindividuals and teams. Specific details about each of these areasfollow.
Integrating with Organizational Information Systems
104 The information used by the I-PMS needs to be integrated withthe organization’s information/operational systems. If the I-PMSis not directly integrated with the organization’s operationalsystems, the information in the performance measurement systemis likely to be inaccurate and out-of-date. Moreover, a great dealof time will be spent reconciling performance numbers withoperational numbers, leading to waste and ineffectiveness. TheI-PMS should derive its information directly from the organization’soperational systems. Enabling technology should support the abilityto integrate information across various management areas.
Identifying Training and Education Requirements
105 New performance measurements can significantly affect the waymany jobs are performed. Often employees need new skills tomeet the new demands (such as statistical process control,teamwork, communication skills, or data analysis techniques).These changes also affect the compensation and reward process.Training and education efforts can make or break theimplementation because they affect individual and team abilityto complete new activities successfully. Effective training is basedon a set of learning principles that indicate that people typicallyforget 90 percent of what they learn within 72 hours. Therefore,immediate application is critical. Exhibit 15 illustrates theseprinciples.

40
106 In the exhibit, the C curve represents traditional training (lectures).Awareness is high during the training event, but the skills andissues are forgotten right after.
107 The B curve occurs when companies augment lectures with casestudies and practice sessions. The effectiveness of training increases,as illustrated by the increase in performance.
108 The A curve represents all of the above training—lectures, casestudies, and practice—plus support after the training to enablepeople to use their new skills immediately on the job. Obviouslythe A-type training is most costly to implement, but the benefits ofthe extra effort far outweigh the cost—and therefore, the clientorganization receives greater value. However, in many situations,the most effective training can be as simple as clearly communicatedexpectations and timely feedback on performance.
Source: Vital Signs, Steven M. Hronec
A X X X
B X X X
C X X X
Exhibit 15. Training Principles
Corporate Training Practice Support
Required Performance
TIME AND EXPERIENCE
OU
TC
OM
ES
Ownership (A)
Buy-In (B)
Awareness (C)
Training Event Posttraining Learning
TheGap
A
B
C
41
Description of theAction
PersonResponsible
ActionPlanIndication
J F M A M J D
Training of thewelders. Aftertraining, welderswill be able to dobasic maintenanceoperations.
Weldingmanagementcenter
Numberof trainedwelders 10 20 30 40 50 100
Installation ofcatchers to detectfailures
Weldingmanagementcenter
% ofequippedmachines
20 50 70 100 100
Hiring of workersfor the maintenancedepartment
Maintenance Numberofworkershired
1 1 1 1 4 4
Use ofpreassembledspare parts
Maintenance % ofspareparts
5 10 20 30 40 50 50
Total benefits on the indicator (expressed innumber of cars/month with unreliable welds)
500 400 300 50
109 The design team should estimate the training/educationdevelopment costs based on the number of employees requiringtraining and the number of hours each will need to reach therequired skill level.
Developing an Implementation Plan
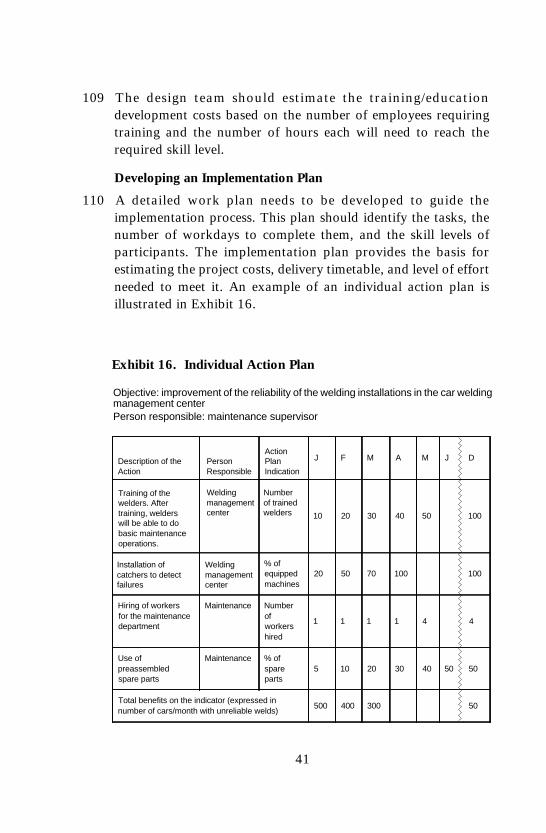
110 A detailed work plan needs to be developed to guide theimplementation process. This plan should identify the tasks, thenumber of workdays to complete them, and the skill levels ofparticipants. The implementation plan provides the basis forestimating the project costs, delivery timetable, and level of effortneeded to meet it. An example of an individual action plan isillustrated in Exhibit 16.
Exhibit 16. Individual Action Plan
Objective: improvement of the reliability of the welding installations in the car weldingmanagement centerPerson responsible: maintenance supervisor
42
111 Gantt charts3 can be useful visual tools to coordinate theimplementation across phases and areas of the organization. Keycompletion dates and deliverables should be clearly identified, andresponsibility for their achievement assigned to key individuals onthe team and within the affected area.
112 Meeting deadlines is key to keeping the I-PMS implementation ontrack; missing deadlines can destroy momentum. For this reason,it is important to ensure deadlines are reasonable and contingencyplans are developed for handling potential problems as they occur.Finally, communication plays a key role in the effectiveimplementation of an I-PMS.
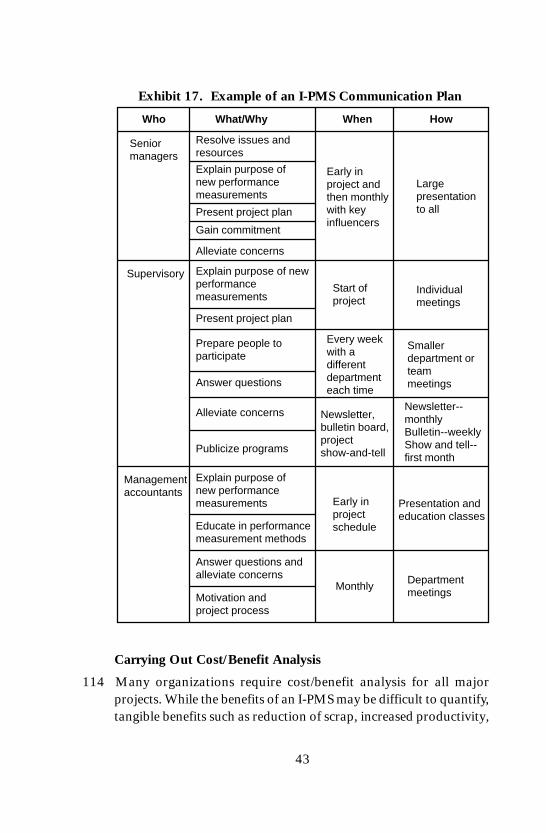
113 It is impossible to overstate the importance of communicationthroughout the design and implementation of an I-PMS. Newmeasurements bring uncertainty and often meet with resistance.The key to overcoming potential problems is to make sure thateveryone is kept apprised of the progress, timetable, objectives,and results of the measurement project. The design team shouldensure that communication takes place, assigning responsibilityand action as suggested in Exhibit 17.
3 A Gantt chart is an activity chart that lays out tasks of a project in sequentialorder and shows when each must take place. The activities are related to thesteps defined in the implementation plan.
43
Exhibit 17. Example of an I-PMS Communication Plan
Carrying Out Cost/Benefit Analysis
114 Many organizations require cost/benefit analysis for all majorprojects. While the benefits of an I-PMS may be difficult to quantify,tangible benefits such as reduction of scrap, increased productivity,
Supervisory
Managementaccountants
Departmentmeetings
Presentation andeducation classes
Newsletter--monthlyBulletin--weeklyShow and tell--first month
Who What/Why When How
Seniormanagers
Resolve issues andresources
Explain purpose ofnew performancemeasurements
Present project plan
Gain commitment
Alleviate concerns
Explain purpose of newperformancemeasurements
Present project plan
Alleviate concerns
Publicize programs
Prepare people toparticipate
Explain purpose ofnew performancemeasurements
Educate in performancemeasurement methods
Answer questions andalleviate concerns
Motivation andproject process
Monthly
Early inprojectschedule
Smallerdepartment orteammeetings
Largepresentationto all
Newsletter,bulletin board,projectshow-and-tell
Every weekwith adifferentdepartmenteach time
Early inproject andthen monthlywith keyinfluencers
Answer questions
Start ofproject
Individualmeetings
44
and reduced lead time and inventory levels can be estimated.Intangible benefits, such as improved employee morale, bettercustomer service, and improved information flow can be estimatedbased on the problems (and costs) these improvements will avoid(such as recruitment, severance, training, and grievance costs). Thecost/benefit analysis that results should be summarized in a conciseformat suitable for management review. In some organizations,performance measurement is seen simply as a part of doing business;its cost is justified as part of the ongoing effort to establish bestpractices.
Establishing the Underlying Technology
115 Information gathered in the conceptual design phase is useful indetermining what delivery mechanism (manual, PC-based, ormainframe-based) would be most effective for the I-PMS. Bothmanual and automated systems are viable alternatives. The finalchoice should reflect the requirements as well as the constraints ofthe organization.
116 Several factors need to be considered when selecting a specificdelivery mechanism. For instance, the breadth and complexity ofthe KPI data, both in terms of data collection and manipulation,can make manual or PC-based deliveries difficult. Relatedly, theroll-up, drill-down, and variety of “management by exception”needs the system must meet can move the choice away from manualand toward more sophisticated delivery approaches.
117 Another concern is the span of control or scope the I-PMS mustincorporate. The broader the span, the more likely the need forsome form of automated system. In a similar vein, the interactivefeature requirements, such as integrated user comments and actionplans, influence the choice of delivery mechanism. Integratedcomments allow the person or team to explain performancevariations. Action plans provide a way to develop and communicateimprovement approaches. While improving communication andpromoting user support of the system, the downside of these featuresis that they require a sophisticated delivery mechanism.
45
118 Finally, graphical requirements impact the choice of technology.If the design team feels manually prepared graphs may not be clearenough to read and simple enough to prepare, an automatedapproach may be chosen. Relatedly, if the underlying data are socomplex that an automated solution is required to facilitate clearpresentation in an effective, efficient manner, manual systems arean unlikely alternative.
119 A popular underlying technology today is the data warehouse,whereby the relevant information is extracted from the operationalsystems and loaded into a database. This technology makes dataaccess easier, but the information needs to be processed andanalyzed to create the required performance measurement reportsand analysis.
120 Other organizations purchase a fully integrated, enterprise widesystem from a single software vendor. The functionality of thesesystems in such areas as performance measurement and knowledgemanagement is generally limited to executive information systemsand report writers. Adapting these systems to changes in thecorporate structure or data flows can be complex and timeconsuming. These systems can do an excellent job of integratingthe organization’s business processes and supporting financial andcost accounting methods, but they are not generally designed tosupport a flexible and strategically based performance managementI-PMS approach.
121 Building an in-house performance measurement system is a routesome organizations take. However, these can be expensive andtime consuming to develop. They usually do not have the sameflexibility and design integrity as systems that have been designedand developed by specialists in the field of performancemanagement. The ongoing cost of the maintenance and support ofthese kinds of systems can be very high.
122 A detailed cost/benefit analysis may prove useful when determiningthe best delivery mechanism for a specific company or application.It is relatively easy to analyze the difference in cost between manual,

46
PC-based, and mainframe-based systems. The related benefits aremore difficult to quantify but may be captured through estimates ofthe time required to develop, complete, and interpret informationfrom a manual versus automated system. Relatedly, the cost savingsfrom avoiding waste and reducing nonvalue-added activities can beused to estimate the benefits of one alternative over another. Once achoice is made, attention shifts to conversion to the new system.
Converting to the New System
123 Conversion to a new I-PMS involves a variety of tasks that spanthe organization and that, if mishandled, can impair theeffectiveness of the measurement initiative. Conversion requiresthe development of documentation and tools to help institutionalizethe new system. Tasks making up the conversion phase are:
• finalizing functional and technical designs for manual orautomated solutions;
• installing the system, including hardware and software, forautomated systems;
• doing unit testing and system development; and• developing user training and education.
124 Management must be visibly involved and committed during theconversion phase. They should take an active role with the designteam to coordinate the rollout and to define tangible targets foreach KPI, as well as action plans for achieving them. The targetsshould encourage continuous improvement and reflect industrybest practices where possible. It is also important to ensure thatproduction or process teams be empowered and given the resourcesneeded to achieve the identified goals to avoid downstreamfrustration and discontent.
125 Implementing an I-PMS means more than putting new KPIs inplace. Full benefit can be gained from the measurements initiativeonly if the new measures become part of everyday life and if theysupport team and individual continuous improvement efforts. Thetrue value of KPIs is unleashed by ensuring a culture that is proactiveand encourages a participatory environment.

47
126 A key task to be performed during the conversion to the new systemis user training/education. All members of the production teams(including management) need to thoroughly understand each KPIand the critical success factors it addresses.
127 The cell or team manager must have sound communication skillsand a thorough understanding of proactive and participatorymanagement principles. Other team members may require training/education in areas such as:
• data collection techniques;• problem-solving skills including statistical process control
(SPC);• communication skills such as meeting facilitation;• team building;• participatory management; and• world-class manufacturing techniques including just-in-time
(JIT), SPC, and total quality management (TQM).
128 Action and interaction support institutionalizing KPIs. Meetingsat all levels of the organization should include a review andevaluation of performance against the KPIs as well as the progressof improvement projects designed to have a positive effect on thisperformance. If a KPI proves to be of no value, then that KPIshould be eliminated or replaced with measures that the operationalteam feels will lead to improved decision making and performance.
Ongoing Support Phase
129 After the I-PMS has been implemented, all members of theorganization need to begin to rely on and use the data to drivecontinuous improvement in all areas of the business. This goaldrives the ongoing support phase of the I-PMS initiative.
Ensuring Continuous Improvement
130 The issues that need to be addressed during this phase include:
• human factors, such as subjective application of evaluationprograms with the I-PMS, the adequacy of training initiativesto provide the skills needed to utilize the system fully, and the
48
available resources needed to meet goals and implementimprovements identified by the KPIs;
• ongoing evaluation and updating of the KPIs to ensure thatthey continue to reflect and adequately measure critical successfactors as the business and its environment change;
• focused measures to combat specific performance problems;these measures should complement operational KPIs and bediscontinued once the problem is solved; and
• continuous revision of KPI targets to reflect continuousimprovement efforts.
131 The I-PMS is a dynamic system; KPIs must be changed as the firmevolves. The ongoing support phase ensures the system remainsrelevant, providing timely information for decision analysis andaction to an ever-changing set of users and requirements. The datacollection, analysis, and presentation efforts should be made asflexible as possible, ensuring that building new measures andeliminating old ones can be done with minimal impact on ongoingactivities and on the effectiveness of the firm and its management.Achieving this success starts with avoiding as many implementationpitfalls as possible.
VII. IMPLEMENTATION PITFALLS & KEYSUCCESS FACTORS
132 The pitfalls in any implementation strategy represent the “don’ts,”while key success factors are the “do’s” that can smooth the effortand ensure success. Exhibit 18 summarizes these issues for anI-PMS.
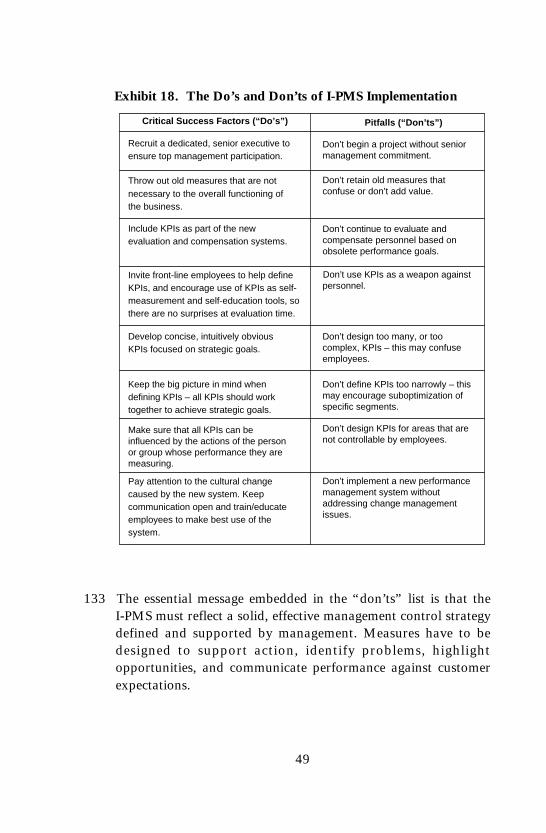
49
Exhibit 18. The Do’s and Don’ts of I-PMS Implementation
133 The essential message embedded in the “don’ts” list is that theI-PMS must reflect a solid, effective management control strategydefined and supported by management. Measures have to bedesigned to support action, identify problems, highlightopportunities, and communicate performance against customerexpectations.
Critical Success Factors (“Do’s”) Pitfalls (“Don’ts”)
Recruit a dedicated, senior executive toensure top management participation.
Don’t begin a project without seniormanagement commitment.
Throw out old measures that are notnecessary to the overall functioning ofthe business.
Don’t retain old measures thatconfuse or don’t add value.
Include KPIs as part of the newevaluation and compensation systems.
Don’t continue to evaluate andcompensate personnel based onobsolete performance goals.
Invite front-line employees to help defineKPIs, and encourage use of KPIs as self-measurement and self-education tools, sothere are no surprises at evaluation time.
Don’t use KPIs as a weapon againstpersonnel.
Develop concise, intuitively obviousKPIs focused on strategic goals.
Don’t design too many, or toocomplex, KPIs – this may confuseemployees.
Keep the big picture in mind whendefining KPIs – all KPIs should worktogether to achieve strategic goals.
Don’t define KPIs too narrowly – thismay encourage suboptimization ofspecific segments.
Make sure that all KPIs can beinfluenced by the actions of the personor group whose performance they aremeasuring.
Don’t design KPIs for areas that arenot controllable by employees.
Pay attention to the cultural changecaused by the new system. Keepcommunication open and train/educateemployees to make best use of thesystem.
Don’t implement a new performancemanagement system withoutaddressing change managementissues.
50
134 Measures that don’t add value or that confuse users are worsethan no measures at all. A bad measure is one that is uncontrollableat the level held responsible for its achievement. When people areheld accountable for things they cannot change, they becomedemotivated, often rejecting the whole measurement process asthey rationalize their ongoing performance problems. Implementinga new or improved I-PMS requires active attention to changemanagement issues, including providing solid attention to the risksand resistance change represents.
135 The “do’s” of implementing an I-PMS have been detailed in thepreceding pages. Linking performance evaluation and rewards tothe KPIs is one of the fastest and most reliable ways to ensure thesystem is implemented and used. Aligning individual goals,incentives, and rewards with KPIs the employees can control iscritical. Finally, the design of the I-PMS and the measures it usesmust foster and reflect continuous improvement. Learning, notcontrol, is the ultimate goal.
VIII. CONCLUSION
136 Performance measurement and management define the current andfuture success of an organization. Measurement done well andintegrated across processes and units can support the attainmentof strategic and operational goals. Measurement done poorly, infragmented ways, can destroy the momentum and culture of anorganization.
137 Reflecting strategic goals (top-down) and operational realities(bottom-up), of an I-PMS supports the achievement of performanceexcellence at all levels of the organization. An effective I-PMSserves as a vital communication channel between individuals,teams, processes, management levels, and units, ensuring that theydeliver a coordinated, focused set of products and services thatmeet or exceed customer requirements.
138 As companies take on new, competitive challenges in the globalmarketplace and create ever more responsive and flexible product/service bundles and delivery mechanisms, the importance of well-

51
designed measurements will increase. A living, dynamic snapshotof organizational health, an effective I-PMS should provideinformation for managing today’s activities and planningtomorrow’s opportunities and growth strategies.
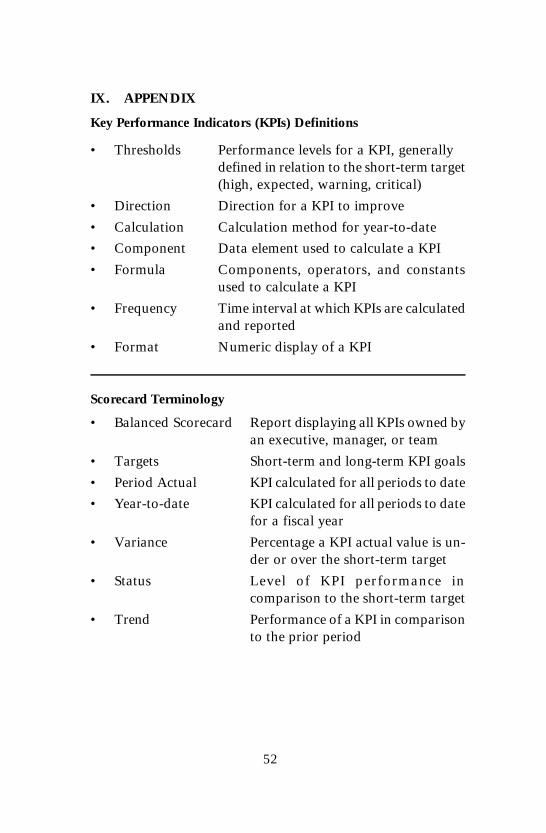
52
IX. APPENDIX
Key Performance Indicators (KPIs) Definitions
• Thresholds Performance levels for a KPI, generallydefined in relation to the short-term target(high, expected, warning, critical)
• Direction Direction for a KPI to improve
• Calculation Calculation method for year-to-date
• Component Data element used to calculate a KPI
• Formula Components, operators, and constantsused to calculate a KPI
• Frequency Time interval at which KPIs are calculatedand reported
• Format Numeric display of a KPI
Scorecard Terminology
• Balanced Scorecard Report displaying all KPIs owned byan executive, manager, or team
• Targets Short-term and long-term KPI goals
• Period Actual KPI calculated for all periods to date
• Year-to-date KPI calculated for all periods to datefor a fiscal year
• Variance Percentage a KPI actual value is un-der or over the short-term target
• Status Level of KPI performance incomparison to the short-term target
• Trend Performance of a KPI in comparisonto the prior period
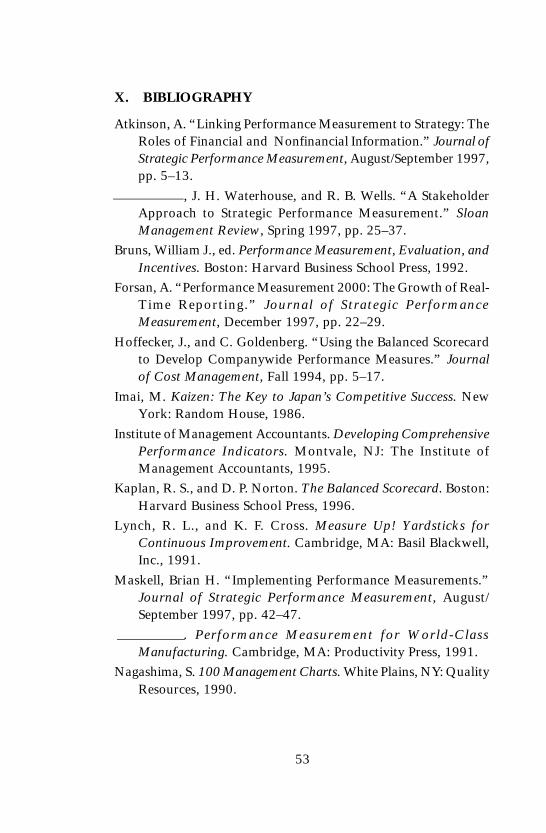
53
X. BIBLIOGRAPHY
Atkinson, A. “Linking Performance Measurement to Strategy: TheRoles of Financial and Nonfinancial Information.” Journal ofStrategic Performance Measurement, August/September 1997,pp. 5–13.
, J. H. Waterhouse, and R. B. Wells. “A StakeholderApproach to Strategic Performance Measurement.” SloanManagement Review, Spring 1997, pp. 25–37.
Bruns, William J., ed. Performance Measurement, Evaluation, andIncentives. Boston: Harvard Business School Press, 1992.
Forsan, A. “Performance Measurement 2000: The Growth of Real-Time Reporting.” Journal of Strategic PerformanceMeasurement, December 1997, pp. 22–29.
Hoffecker, J., and C. Goldenberg. “Using the Balanced Scorecardto Develop Companywide Performance Measures.” Journalof Cost Management, Fall 1994, pp. 5–17.
Imai, M. Kaizen: The Key to Japan’s Competitive Success. NewYork: Random House, 1986.
Institute of Management Accountants. Developing ComprehensivePerformance Indicators. Montvale, NJ: The Institute ofManagement Accountants, 1995.
Kaplan, R. S., and D. P. Norton. The Balanced Scorecard. Boston:Harvard Business School Press, 1996.
Lynch, R. L., and K. F. Cross. Measure Up! Yardsticks forContinuous Improvement. Cambridge, MA: Basil Blackwell,Inc., 1991.
Maskell, Brian H. “Implementing Performance Measurements.”Journal of Strategic Performance Measurement, August/September 1997, pp. 42–47.
. Performance Measurement for World-ClassManufacturing. Cambridge, MA: Productivity Press, 1991.
Nagashima, S. 100 Management Charts. White Plains, NY: QualityResources, 1990.
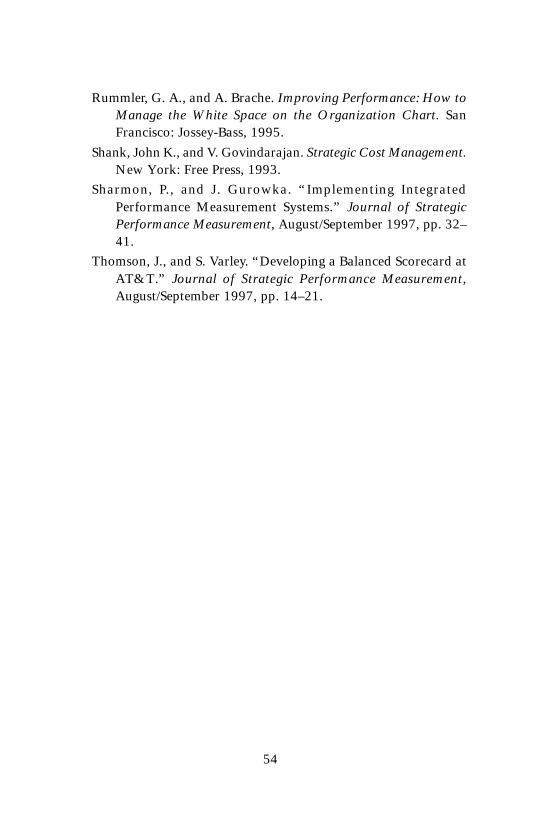
54
Rummler, G. A., and A. Brache. Improving Performance: How toManage the White Space on the Organization Chart. SanFrancisco: Jossey-Bass, 1995.
Shank, John K., and V. Govindarajan. Strategic Cost Management.New York: Free Press, 1993.
Sharmon, P., and J. Gurowka. “Implementing IntegratedPerformance Measurement Systems.” Journal of StrategicPerformance Measurement, August/September 1997, pp. 32–41.
Thomson, J., and S. Varley. “Developing a Balanced Scorecard atAT&T.” Journal of Strategic Performance Measurement,August/September 1997, pp. 14–21.
Management Accounting Committee1997-98
Chair—Alfred M. King, CMA, CFMChairman of the Board, Valuation Research Corporation, Princeton, NJ
Sally A. Claybourn-EvansVP and ControllerInstitute of Biology R&DIrvine, CA
Dennis C. Daly, CMAChair—Dept. of AccountingMetropolitan State UniversityMinneapolis, MN
Dale L. Flesher, CMA, CFMProfessor—School of AccountancyUniversity of MississippiOxford, MS
Randolf Holst, CMAKnowledge ManagerArthur Andersen LLPDallas, TX
Edward J. McCracken, CPAManager—Group AccountingAmericas Polyurethanes GroupWest Depford, NJ
Michael R. McGranaghan, CMAVP—Finance & Information Mgmt.Ethicon Endo-Surgery Inc.Cincinnati, OH
Philip T. Murphy, CPAControllerNovartis Corp. Protection Inc.Greensboro, NC
Darrell J. Oyer, CMA, CPAGovernment Contract SpecialistDarrell J. Oyer & Co.Gaithersburg, MD
Raymond H. PetersonConsultantPetaluma, CA
Grover L. Porter, CPAProfessor of AccountingUniversity of AlabamaHuntsville, AL
Barbara C. Reilly, CPARegional Director, Mid-Atlantic
RegionDefense Contract Audit AgencyPhiladelphia, PA
L. Hal Rogero, Jr., CPAAssistant Corporate ControllerMead CorporationDayton, OH
James R. YoungManager, Business Development
FinanceGeneral Electric CompanySchenectady, NY
StaffTerri L. Funk, CMA, CFMDirectorManagement Accounting Practices
Statements on Management Accounting in PrintCode Title
1A Definition of Management Accounting1B Objectives of Management Accounting1C Standards of Ethical Conduct for Practitioners of Management
Accounting and Financial Management1D The Common Body of Knowledge for Management Accountants1E Education for Careers in Management Accounting2A Management Accounting Glossary4A Cost of Capital4B Allocation of Service and Administrative Costs4C Definition and Measurement of Direct Labor Cost4D Measuring Entity Performance4E Definition and Measurement of Direct Material Cost4F Allocation of Information Systems Costs4G Accounting for Indirect Production Costs4H Uses of the Cost of Capital4I Cost Management for Freight Transportation4J Accounting for Property, Plant, and Equipment4K Cost Management for Warehousing4L Control of Property, Plant, and Equipment4M Understanding Financial Instruments4N Management of Working Capital: Cash Resources4O The Accounting Classification of Real Estate Occupancy Costs4 P Cost Management for Logistics4Q Use and Control of Financial Instruments by Multinational Companies4R Managing Quality Improvements4S Internal Accounting and Classification of Risk Management Costs4T Implementing Activity-Based Costing4U Developing Comprehensive Performance Indicators4V Effective Benchmarking4W Implementing Corporate Environmental Strategies4X Value Chain Analysis for Assessing Competitive Advantage4Y Measuring the Cost of Capacity4Z Tools and Techniques of Environmental Accounting for Business Decisions4AA Measuring and Managing Shareholder Value Creation4BB The Accounting Classification of Workpoint Costs4CC Implementing Activity-Based Management: Avoiding the Pitfalls4DD Tools and Techniques for Implementing Integrated Performance
Management Systems5A Evaluating Controllership Effectiveness5B Fundamentals of Reporting Information to Managers5C Managing Cross-Functional Teams5D Developing Comprehensive Competitive Intelligence5E Redesigning the Finance Function
For information about prices and to order Statements on Management Accounting, contact theCustomer Order Department, Institute of Management Accountants, 10 Paragon Dr., Montvale,NJ 07645-1760 (tel: 201/573-9000 x 278 or 1 800/638-4427 x 278; Fax 201/573-9507).

Institute of Management Accountants10 Paragon Drive • Montvale, NJ 07645-1760
ISBN 0-86641-269-7 SMA 4DD-5/98
SMA 4DD.p65 1/11/99, 3:07 PM3