financial statements - banco central do brasil statements 122011.pdf · accounting and financial...
TRANSCRIPT
Administration Management
Accounting and Financial Department
Financial Statements
December 31, 2011
BANCO CENTRAL DO BRASIL
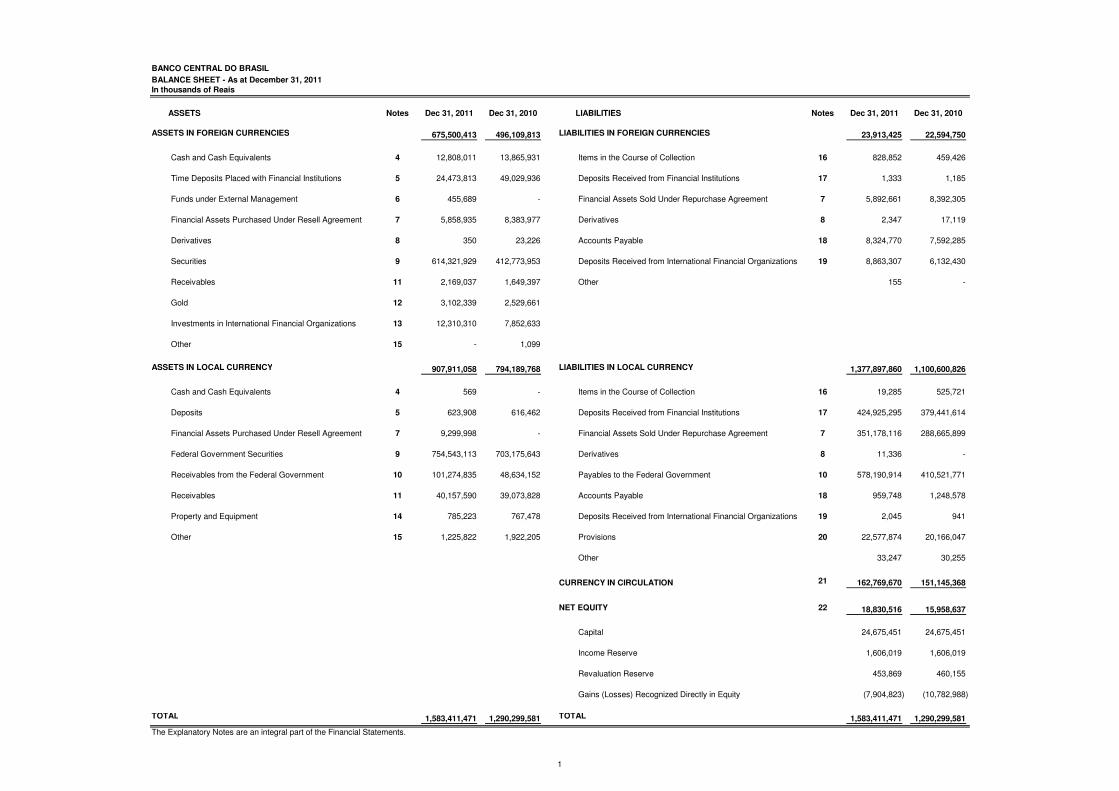
BALANCE SHEET - As at December 31, 2011
In thousands of Reais
ASSETS Notes Dec 31, 2011 Dec 31, 2010 LIABILITIES Notes Dec 31, 2011 Dec 31, 2010
ASSETS IN FOREIGN CURRENCIES 675,500,413 496,109,813 LIABILITIES IN FOREIGN CURRENCIES 23,913,425 22,594,750
Cash and Cash Equivalents 4 12,808,011 13,865,931 Items in the Course of Collection 16 828,852 459,426
Time Deposits Placed with Financial Institutions 5 24,473,813 49,029,936 Deposits Received from Financial Institutions 17 1,333 1,185
Funds under External Management 6 455,689 - Financial Assets Sold Under Repurchase Agreement 7 5,892,661 8,392,305
Financial Assets Purchased Under Resell Agreement 7 5,858,935 8,383,977 Derivatives 8 2,347 17,119
Derivatives 8 350 23,226 Accounts Payable 18 8,324,770 7,592,285
Securities 9 614,321,929 412,773,953 Deposits Received from International Financial Organizations 19 8,863,307 6,132,430
Receivables 11 2,169,037 1,649,397 Other 155 -
Gold 12 3,102,339 2,529,661
Investments in International Financial Organizations 13 12,310,310 7,852,633
Other 15 - 1,099
ASSETS IN LOCAL CURRENCY 907,911,058 794,189,768 LIABILITIES IN LOCAL CURRENCY 1,377,897,860 1,100,600,826
Cash and Cash Equivalents 4 569 - Items in the Course of Collection 16 19,285 525,721
Deposits 5 623,908 616,462 Deposits Received from Financial Institutions 17 424,925,295 379,441,614
Financial Assets Purchased Under Resell Agreement 7 9,299,998 - Financial Assets Sold Under Repurchase Agreement 7 351,178,116 288,665,899
Federal Government Securities 9 754,543,113 703,175,643 Derivatives 8 11,336 -
Receivables from the Federal Government 10 101,274,835 48,634,152 Payables to the Federal Government 10 578,190,914 410,521,771
Receivables 11 40,157,590 39,073,828 Accounts Payable 18 959,748 1,248,578
Property and Equipment 14 785,223 767,478 Deposits Received from International Financial Organizations 19 2,045 941
Other 15 1,225,822 1,922,205 Provisions 20 22,577,874 20,166,047
Other 33,247 30,255
CURRENCY IN CIRCULATION 21 162,769,670 151,145,368
NET EQUITY 22 18,830,516 15,958,637
Capital 24,675,451 24,675,451
Income Reserve 1,606,019 1,606,019
Revaluation Reserve 453,869 460,155
Gains (Losses) Recognized Directly in Equity (7,904,823) (10,782,988)
TOTAL 1,583,411,471 1,290,299,581 TOTAL 1,583,411,471 1,290,299,581
The Explanatory Notes are an integral part of the Financial Statements.
1
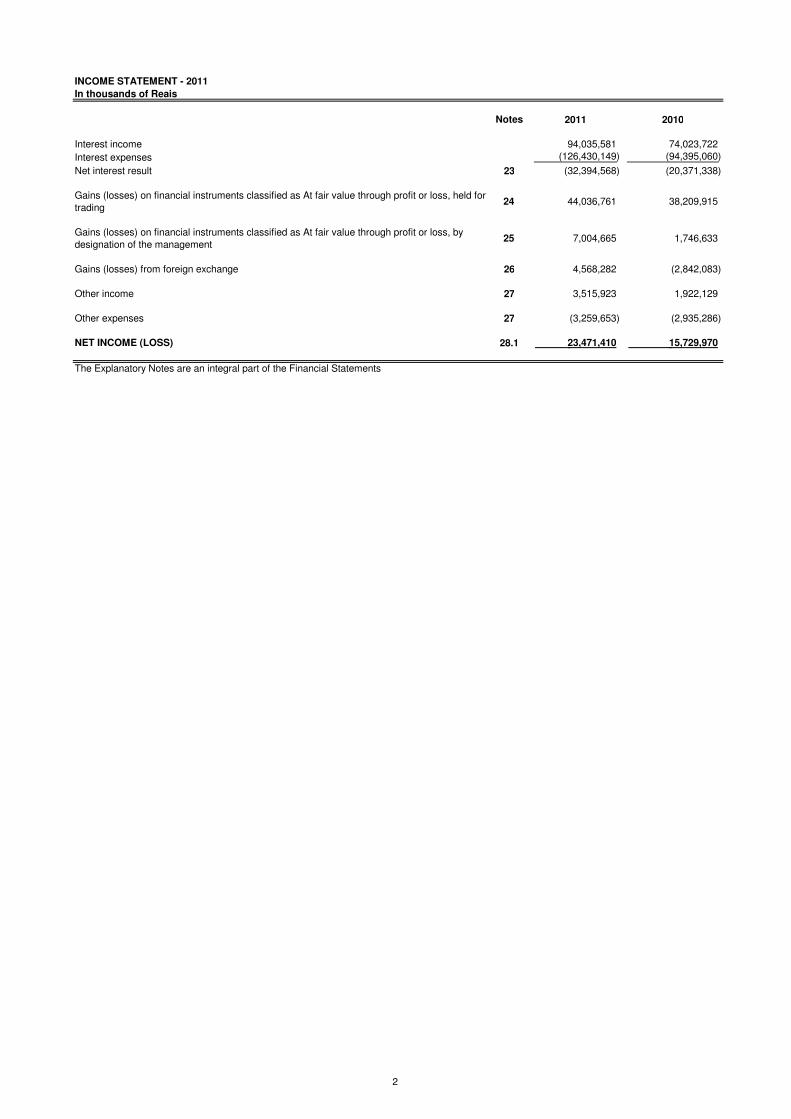
INCOME STATEMENT - 2011
In thousands of Reais
Notes 2011 2010
Interest income 94,035,581 74,023,722
Interest expenses (126,430,149) (94,395,060)
Net interest result 23 (32,394,568) (20,371,338)
Gains (losses) on financial instruments classified as At fair value through profit or loss, held for
trading24 44,036,761 38,209,915
Gains (losses) on financial instruments classified as At fair value through profit or loss, by
designation of the management25 7,004,665 1,746,633
Gains (losses) from foreign exchange 26 4,568,282 (2,842,083)
Other income 27 3,515,923 1,922,129
Other expenses 27 (3,259,653) (2,935,286)
NET INCOME (LOSS) 28.1 23,471,410 15,729,970
The Explanatory Notes are an integral part of the Financial Statements
2

STATEMENT OF COMPREHENSIVE INCOME - 2011In thousands of Reais
Notes 2011 2010
INCOME STATEMENT FOR THE PERIOD 28.1 23,471,410 15,729,970
Available-for-sale Financial Assets 5,202,920 (868,817)
Gains (Losses) Recognized in Equity 5,351,295 (674,448)
(Gains) Losses Transferred to Income (148,375) (194,369)
Actuarial Gains (Losses) on Defined Benefit Plans (2,324,755) (3,264,911)
COMPREHENSIVE INCOME FOR THE PERIOD 28.2 26,349,575 11,596,242
The Explanatory Notes are an integral part of the Financial Statements
3
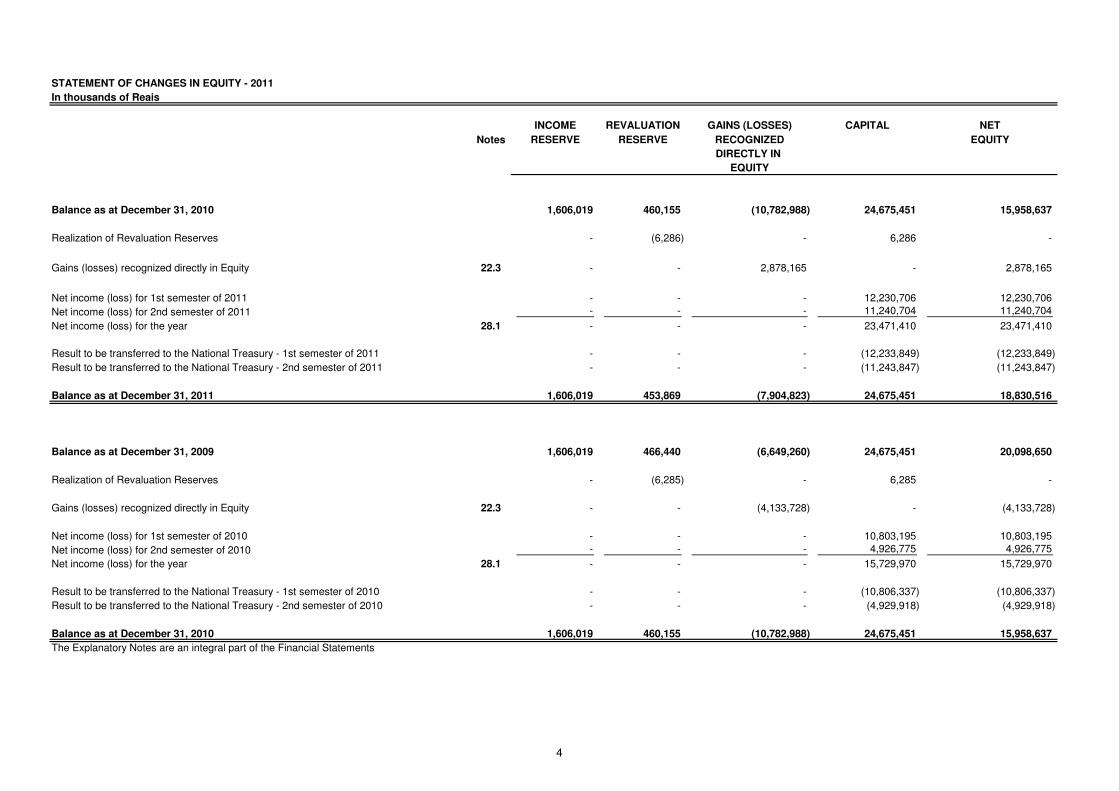
STATEMENT OF CHANGES IN EQUITY - 2011
In thousands of Reais
INCOME REVALUATION GAINS (LOSSES) CAPITAL NET
Notes RESERVE RESERVE RECOGNIZED EQUITY
DIRECTLY IN
EQUITY
Balance as at December 31, 2010 1,606,019 460,155 (10,782,988) 24,675,451 15,958,637
Realization of Revaluation Reserves - (6,286) - 6,286 -
Gains (losses) recognized directly in Equity 22.3 - - 2,878,165 - 2,878,165
Net income (loss) for 1st semester of 2011 - - - 12,230,706 12,230,706
Net income (loss) for 2nd semester of 2011 - - - 11,240,704 11,240,704
Net income (loss) for the year 28.1 - - - 23,471,410 23,471,410
Result to be transferred to the National Treasury - 1st semester of 2011 - - - (12,233,849) (12,233,849)
Result to be transferred to the National Treasury - 2nd semester of 2011 - - - (11,243,847) (11,243,847)
Balance as at December 31, 2011 1,606,019 453,869 (7,904,823) 24,675,451 18,830,516
Balance as at December 31, 2009 1,606,019 466,440 (6,649,260) 24,675,451 20,098,650
Realization of Revaluation Reserves - (6,285) - 6,285 -
Gains (losses) recognized directly in Equity 22.3 - - (4,133,728) - (4,133,728)
Net income (loss) for 1st semester of 2010 - - - 10,803,195 10,803,195
Net income (loss) for 2nd semester of 2010 - - - 4,926,775 4,926,775
Net income (loss) for the year 28.1 - - - 15,729,970 15,729,970
Result to be transferred to the National Treasury - 1st semester of 2010 - - - (10,806,337) (10,806,337)
Result to be transferred to the National Treasury - 2nd semester of 2010 - - - (4,929,918) (4,929,918)
Balance as at December 31, 2010 1,606,019 460,155 (10,782,988) 24,675,451 15,958,637
The Explanatory Notes are an integral part of the Financial Statements
4
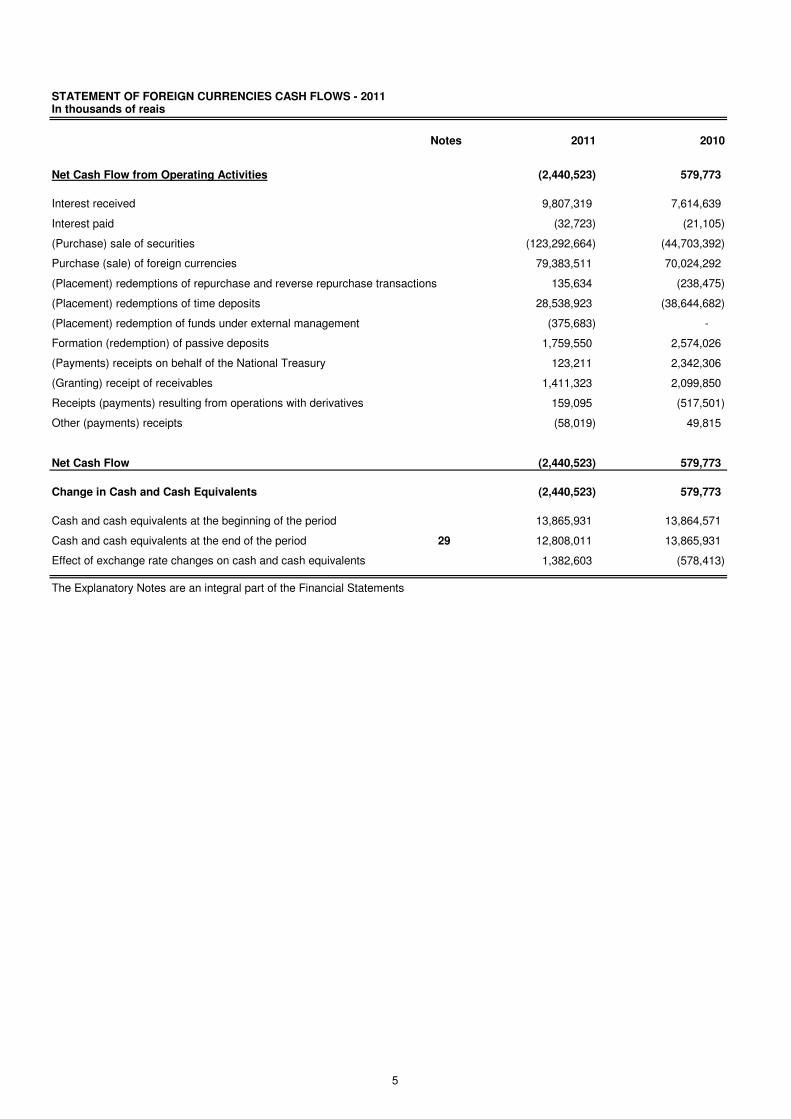
STATEMENT OF FOREIGN CURRENCIES CASH FLOWS - 2011In thousands of reais
Notes 2011 2010
Net Cash Flow from Operating Activities (2,440,523) 579,773
Interest received 9,807,319 7,614,639
Interest paid (32,723) (21,105)
(Purchase) sale of securities (123,292,664) (44,703,392)
Purchase (sale) of foreign currencies 79,383,511 70,024,292
(Placement) redemptions of repurchase and reverse repurchase transactions 135,634 (238,475)
(Placement) redemptions of time deposits 28,538,923 (38,644,682)
(Placement) redemption of funds under external management (375,683) -
Formation (redemption) of passive deposits 1,759,550 2,574,026
(Payments) receipts on behalf of the National Treasury 123,211 2,342,306
(Granting) receipt of receivables 1,411,323 2,099,850
Receipts (payments) resulting from operations with derivatives 159,095 (517,501)
Other (payments) receipts (58,019) 49,815
Net Cash Flow (2,440,523) 579,773
Change in Cash and Cash Equivalents (2,440,523) 579,773
Cash and cash equivalents at the beginning of the period 13,865,931 13,864,571
Cash and cash equivalents at the end of the period 29 12,808,011 13,865,931
Effect of exchange rate changes on cash and cash equivalents 1,382,603 (578,413)
The Explanatory Notes are an integral part of the Financial Statements
5
NOTES TO THE FINANCIAL STATEMENTS – AS AT DECEMBER 31, 2011
(The amounts are expressed in thousands of Reais, except when stated otherwise)
6
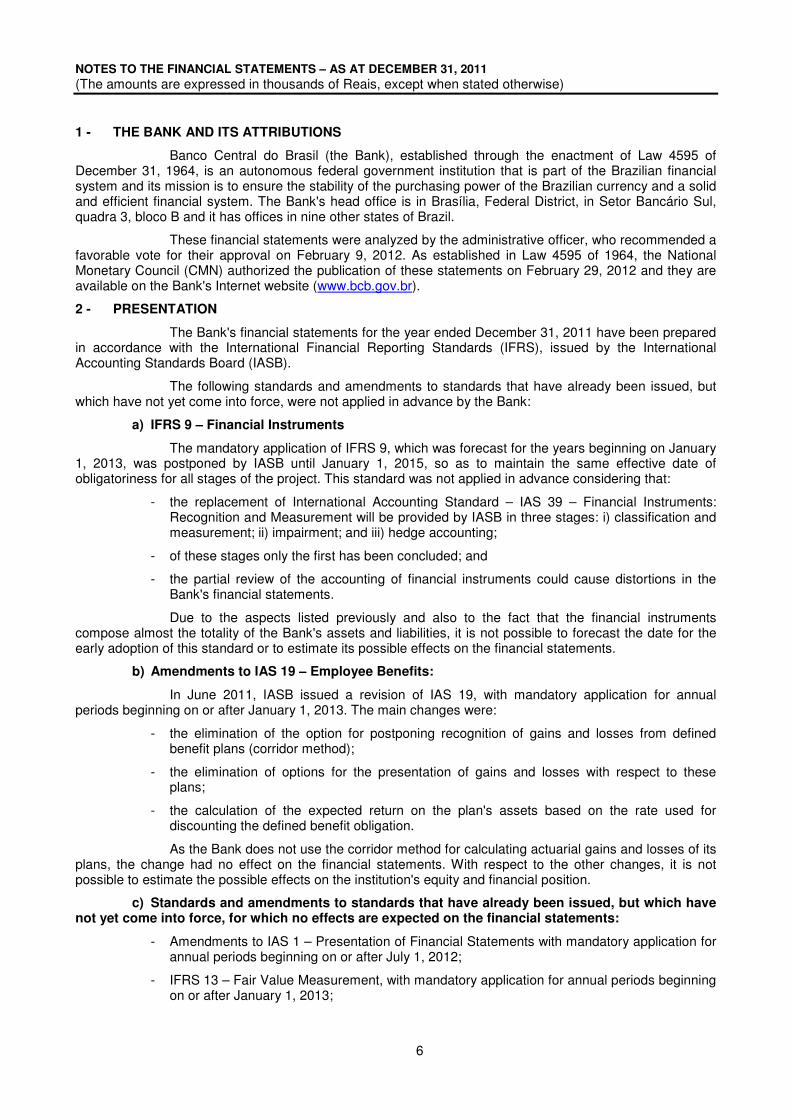
1 - THE BANK AND ITS ATTRIBUTIONS
Banco Central do Brasil (the Bank), established through the enactment of Law 4595 of December 31, 1964, is an autonomous federal government institution that is part of the Brazilian financial system and its mission is to ensure the stability of the purchasing power of the Brazilian currency and a solid and efficient financial system. The Bank's head office is in Brasília, Federal District, in Setor Bancário Sul, quadra 3, bloco B and it has offices in nine other states of Brazil.
These financial statements were analyzed by the administrative officer, who recommended a favorable vote for their approval on February 9, 2012. As established in Law 4595 of 1964, the National Monetary Council (CMN) authorized the publication of these statements on February 29, 2012 and they are available on the Bank's Internet website (www.bcb.gov.br).
2 - PRESENTATION
The Bank's financial statements for the year ended December 31, 2011 have been prepared in accordance with the International Financial Reporting Standards (IFRS), issued by the International Accounting Standards Board (IASB).
The following standards and amendments to standards that have already been issued, but which have not yet come into force, were not applied in advance by the Bank:
a) IFRS 9 – Financial Instruments
The mandatory application of IFRS 9, which was forecast for the years beginning on January 1, 2013, was postponed by IASB until January 1, 2015, so as to maintain the same effective date of obligatoriness for all stages of the project. This standard was not applied in advance considering that:
- the replacement of International Accounting Standard – IAS 39 – Financial Instruments: Recognition and Measurement will be provided by IASB in three stages: i) classification and measurement; ii) impairment; and iii) hedge accounting;
- of these stages only the first has been concluded; and
- the partial review of the accounting of financial instruments could cause distortions in the Bank's financial statements.
Due to the aspects listed previously and also to the fact that the financial instruments compose almost the totality of the Bank's assets and liabilities, it is not possible to forecast the date for the early adoption of this standard or to estimate its possible effects on the financial statements.
b) Amendments to IAS 19 – Employee Benefits:
In June 2011, IASB issued a revision of IAS 19, with mandatory application for annual periods beginning on or after January 1, 2013. The main changes were:
- the elimination of the option for postponing recognition of gains and losses from defined benefit plans (corridor method);
- the elimination of options for the presentation of gains and losses with respect to these plans;
- the calculation of the expected return on the plan's assets based on the rate used for discounting the defined benefit obligation.
As the Bank does not use the corridor method for calculating actuarial gains and losses of its plans, the change had no effect on the financial statements. With respect to the other changes, it is not possible to estimate the possible effects on the institution's equity and financial position.
c) Standards and amendments to standards that have already been issued, but which have not yet come into force, for which no effects are expected on the financial statements:
- Amendments to IAS 1 – Presentation of Financial Statements with mandatory application for annual periods beginning on or after July 1, 2012;
- IFRS 13 – Fair Value Measurement, with mandatory application for annual periods beginning on or after January 1, 2013;
NOTES TO THE FINANCIAL STATEMENTS – AS AT DECEMBER 31, 2011
(The amounts are expressed in thousands of Reais, except when stated otherwise)
7
- Amendments to IFRS 7 – Financial Instruments: Disclosures, with mandatory application for annual periods beginning on or after July 1, 2011.
3 - SIGNIFICANT ACCOUNTING POLICIES
It is presented below a summary of the significant accounting policies used by the Bank, which were applied consistently to the comparative financial information.
3.1. Determination of profit and loss
The Bank's profit and loss is determined semi-annually on an accrual basis and is transferred to the National Treasury in the event of net income or covered by the National Treasury in the event of a net loss (Notes 28.1 and 40.a).
3.2. Recognition of interest income and expenses
Interest income and expenses are recognized using the effective interest yield, which discounts, exactly, the future receipts and payments of financial assets or liabilities to their net carrying amount, according to their contractual terms. This calculation considers all the material amounts paid or received between the parties, such as fees, commissions, discounts and premiums.
Interest income and expenses presented in the income statement include interest income and expenses of the Bank's financial assets and liabilities not classified as At Fair Value Through Profit and Loss.
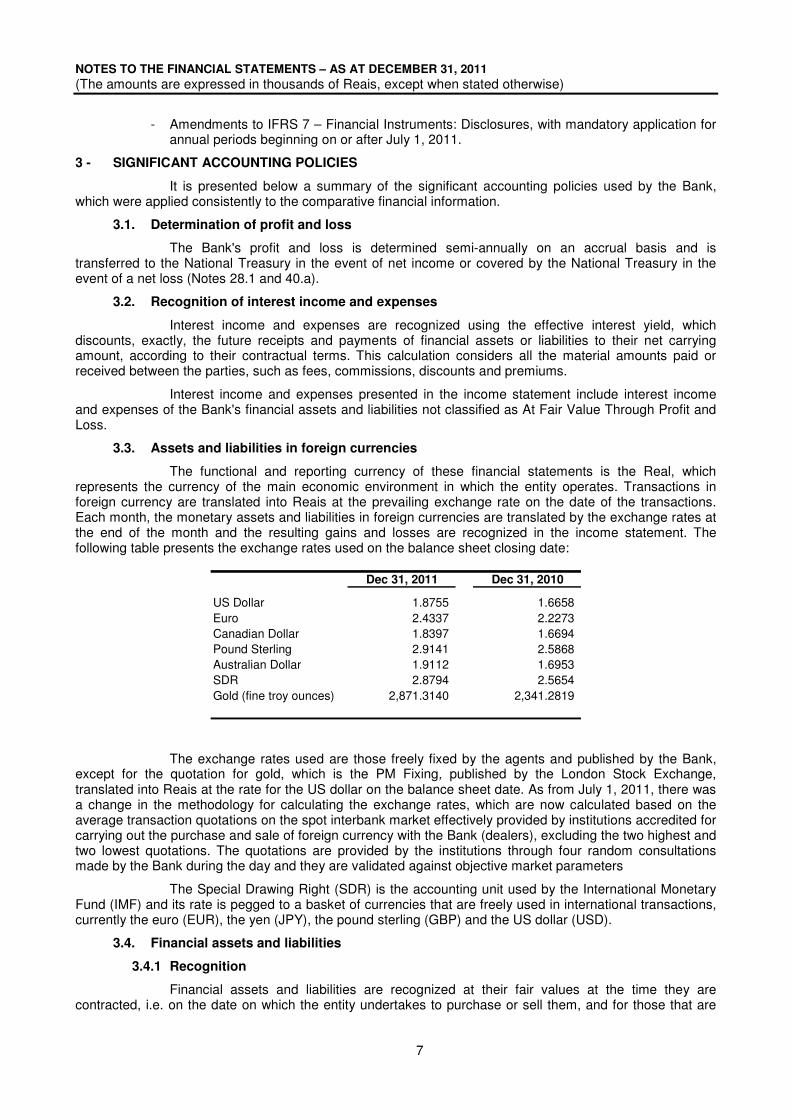
3.3. Assets and liabilities in foreign currencies
The functional and reporting currency of these financial statements is the Real, which represents the currency of the main economic environment in which the entity operates. Transactions in foreign currency are translated into Reais at the prevailing exchange rate on the date of the transactions. Each month, the monetary assets and liabilities in foreign currencies are translated by the exchange rates at the end of the month and the resulting gains and losses are recognized in the income statement. The following table presents the exchange rates used on the balance sheet closing date:
Dec 31, 2011 Dec 31, 2010
US Dollar 1.8755 1.6658 Euro 2.4337 2.2273 Canadian Dollar 1.8397 1.6694 Pound Sterling 2.9141 2.5868 Australian Dollar 1.9112 1.6953 SDR 2.8794 2.5654 Gold (fine troy ounces) 2,871.3140 2,341.2819
The exchange rates used are those freely fixed by the agents and published by the Bank, except for the quotation for gold, which is the PM Fixing, published by the London Stock Exchange, translated into Reais at the rate for the US dollar on the balance sheet date. As from July 1, 2011, there was a change in the methodology for calculating the exchange rates, which are now calculated based on the average transaction quotations on the spot interbank market effectively provided by institutions accredited for carrying out the purchase and sale of foreign currency with the Bank (dealers), excluding the two highest and two lowest quotations. The quotations are provided by the institutions through four random consultations made by the Bank during the day and they are validated against objective market parameters
The Special Drawing Right (SDR) is the accounting unit used by the International Monetary Fund (IMF) and its rate is pegged to a basket of currencies that are freely used in international transactions, currently the euro (EUR), the yen (JPY), the pound sterling (GBP) and the US dollar (USD).
3.4. Financial assets and liabilities
3.4.1 Recognition
Financial assets and liabilities are recognized at their fair values at the time they are contracted, i.e. on the date on which the entity undertakes to purchase or sell them, and for those that are
NOTES TO THE FINANCIAL STATEMENTS – AS AT DECEMBER 31, 2011
(The amounts are expressed in thousands of Reais, except when stated otherwise)
8
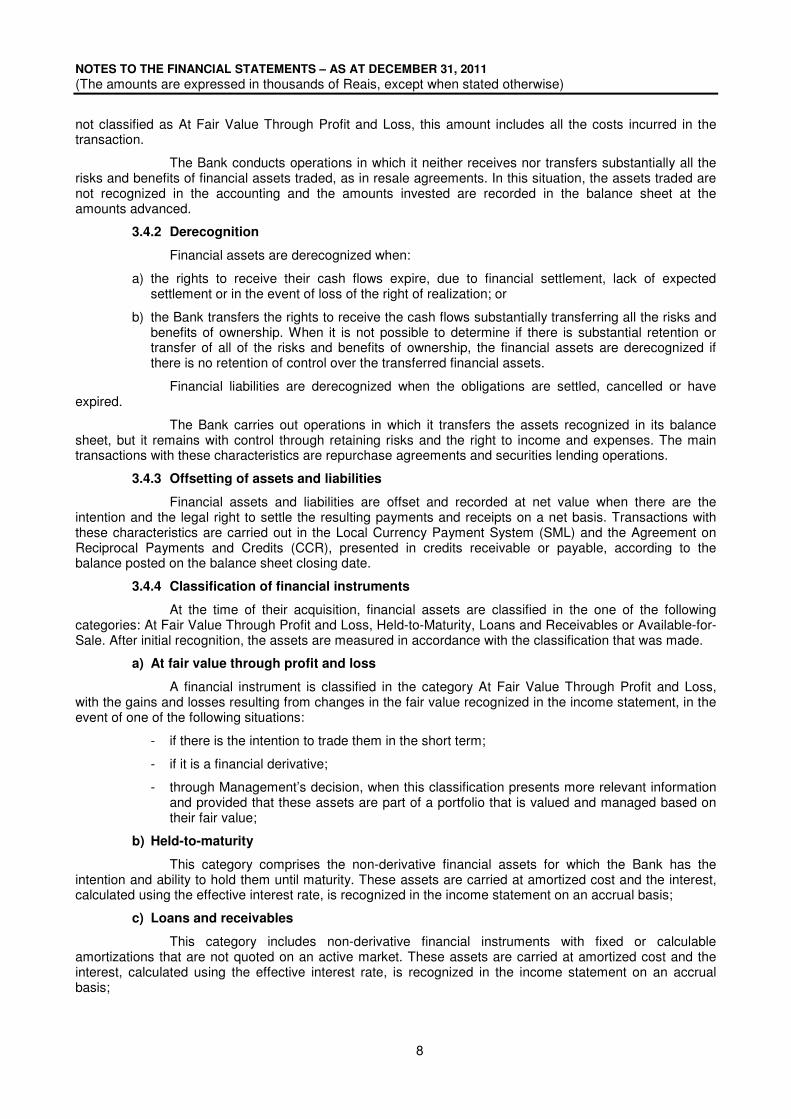
not classified as At Fair Value Through Profit and Loss, this amount includes all the costs incurred in the transaction.
The Bank conducts operations in which it neither receives nor transfers substantially all the risks and benefits of financial assets traded, as in resale agreements. In this situation, the assets traded are not recognized in the accounting and the amounts invested are recorded in the balance sheet at the amounts advanced.
3.4.2 Derecognition
Financial assets are derecognized when:
a) the rights to receive their cash flows expire, due to financial settlement, lack of expected settlement or in the event of loss of the right of realization; or
b) the Bank transfers the rights to receive the cash flows substantially transferring all the risks and benefits of ownership. When it is not possible to determine if there is substantial retention or transfer of all of the risks and benefits of ownership, the financial assets are derecognized if there is no retention of control over the transferred financial assets.
Financial liabilities are derecognized when the obligations are settled, cancelled or have expired.
The Bank carries out operations in which it transfers the assets recognized in its balance sheet, but it remains with control through retaining risks and the right to income and expenses. The main transactions with these characteristics are repurchase agreements and securities lending operations.
3.4.3 Offsetting of assets and liabilities
Financial assets and liabilities are offset and recorded at net value when there are the intention and the legal right to settle the resulting payments and receipts on a net basis. Transactions with these characteristics are carried out in the Local Currency Payment System (SML) and the Agreement on Reciprocal Payments and Credits (CCR), presented in credits receivable or payable, according to the balance posted on the balance sheet closing date.
3.4.4 Classification of financial instruments
At the time of their acquisition, financial assets are classified in the one of the following categories: At Fair Value Through Profit and Loss, Held-to-Maturity, Loans and Receivables or Available-for-Sale. After initial recognition, the assets are measured in accordance with the classification that was made.
a) At fair value through profit and loss
A financial instrument is classified in the category At Fair Value Through Profit and Loss, with the gains and losses resulting from changes in the fair value recognized in the income statement, in the event of one of the following situations:
- if there is the intention to trade them in the short term;
- if it is a financial derivative;
- through Management’s decision, when this classification presents more relevant information and provided that these assets are part of a portfolio that is valued and managed based on their fair value;
b) Held-to-maturity
This category comprises the non-derivative financial assets for which the Bank has the intention and ability to hold them until maturity. These assets are carried at amortized cost and the interest, calculated using the effective interest rate, is recognized in the income statement on an accrual basis;
c) Loans and receivables
This category includes non-derivative financial instruments with fixed or calculable amortizations that are not quoted on an active market. These assets are carried at amortized cost and the interest, calculated using the effective interest rate, is recognized in the income statement on an accrual basis;
NOTES TO THE FINANCIAL STATEMENTS – AS AT DECEMBER 31, 2011
(The amounts are expressed in thousands of Reais, except when stated otherwise)
9
d) Available-for-sale
This category records the non-derivative financial assets that are not classified in the other categories, since Management does not have a specific intention to sell them. These assets are carried at their fair value and their gains and losses are recognized in equity and recognized in the income statement when effectively realized. However, the interest, calculated using the effective interest rate, is recognized in the income statement on an accrual basis.
3.4.5 Measurement
The fair value is the market value published by the main depository trust companies (custodian) and providers of economic information. For instruments with no active market, the fair value is calculated using pricing models which include the value of the most recent tradings, the discounted cash flow and the fair value of similar financial instruments. The models used are assessed by a multi-departmental committee, which is also responsible for suggesting new methodologies or improvements.
The amortized cost is the value on the date of recognition, adjusted by the contractual interest using the effective interest rate, less contingent amortizations and impairment losses.
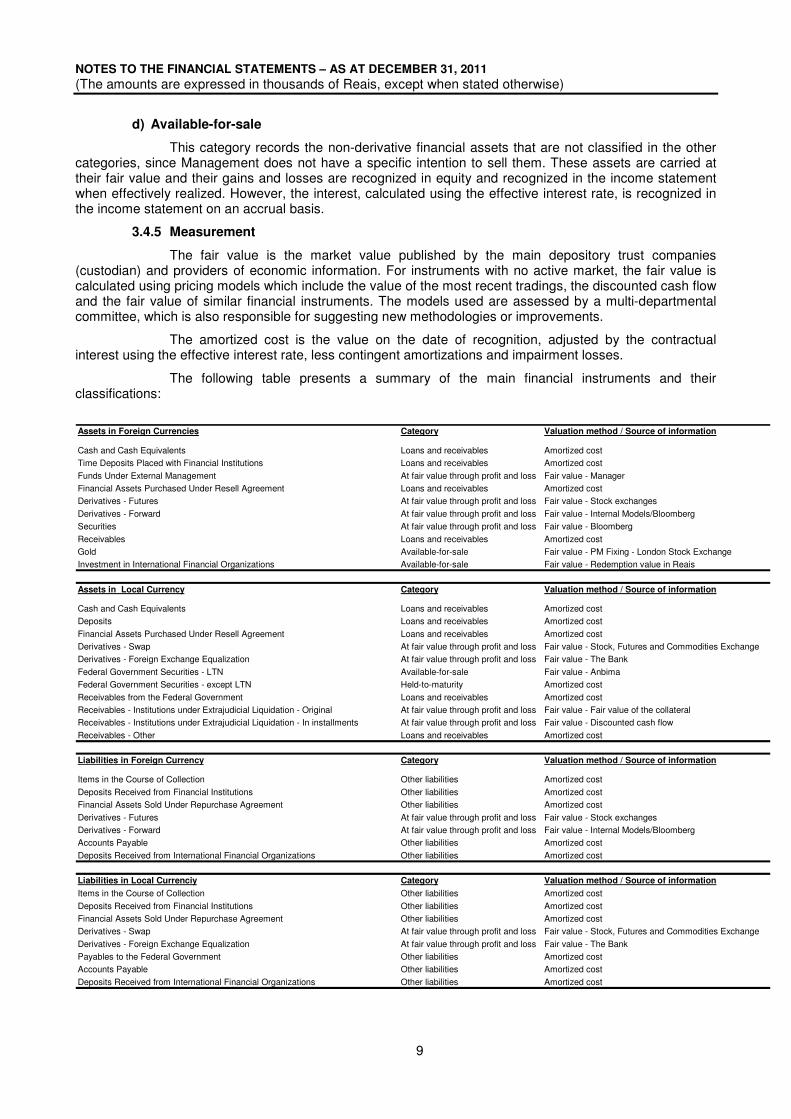
The following table presents a summary of the main financial instruments and their classifications:
Assets in Foreign Currencies Category Valuation method / Source of information
Cash and Cash Equivalents Loans and receivables Amortized costTime Deposits Placed with Financial Institutions Loans and receivables Amortized cost
Funds Under External Management At fair value through profit and loss Fair value - ManagerFinancial Assets Purchased Under Resell Agreement Loans and receivables Amortized costDerivatives - Futures At fair value through profit and loss Fair value - Stock exchanges
Derivatives - Forward At fair value through profit and loss Fair value - Internal Models/BloombergSecurities At fair value through profit and loss Fair value - Bloomberg
Receivables Loans and receivables Amortized costGold Available-for-sale Fair value - PM Fixing - London Stock ExchangeInvestment in International Financial Organizations Available-for-sale Fair value - Redemption value in Reais
Assets in Local Currency Category Valuation method / Source of information
Cash and Cash Equivalents Loans and receivables Amortized costDeposits Loans and receivables Amortized cost
Financial Assets Purchased Under Resell Agreement Loans and receivables Amortized costDerivatives - Swap At fair value through profit and loss Fair value - Stock, Futures and Commodities ExchangeDerivatives - Foreign Exchange Equalization At fair value through profit and loss Fair value - The Bank
Federal Government Securities - LTN Available-for-sale Fair value - AnbimaFederal Government Securities - except LTN Held-to-maturity Amortized cost
Receivables from the Federal Government Loans and receivables Amortized costReceivables - Institutions under Extrajudicial Liquidation - Original At fair value through profit and loss Fair value - Fair value of the collateralReceivables - Institutions under Extrajudicial Liquidation - In installments At fair value through profit and loss Fair value - Discounted cash flow
Receivables - Other Loans and receivables Amortized cost
Liabilities in Foreign Currency Category Valuation method / Source of information
Items in the Course of Collection Other liabilities Amortized cost
Deposits Received from Financial Institutions Other liabilities Amortized costFinancial Assets Sold Under Repurchase Agreement Other liabilities Amortized cost
Derivatives - Futures At fair value through profit and loss Fair value - Stock exchangesDerivatives - Forward At fair value through profit and loss Fair value - Internal Models/BloombergAccounts Payable Other liabilities Amortized cost
Deposits Received from International Financial Organizations Other liabilities Amortized cost
Liabilities in Local Currenciy Category Valuation method / Source of information
Items in the Course of Collection Other liabilities Amortized cost
Deposits Received from Financial Institutions Other liabilities Amortized costFinancial Assets Sold Under Repurchase Agreement Other liabilities Amortized costDerivatives - Swap At fair value through profit and loss Fair value - Stock, Futures and Commodities Exchange
Derivatives - Foreign Exchange Equalization At fair value through profit and loss Fair value - The BankPayables to the Federal Government Other liabilities Amortized costAccounts Payable Other liabilities Amortized cost
Deposits Received from International Financial Organizations Other liabilities Amortized cost
NOTES TO THE FINANCIAL STATEMENTS – AS AT DECEMBER 31, 2011
(The amounts are expressed in thousands of Reais, except when stated otherwise)
10
3.4.6 Impairment of financial assets
The Bank conducts an evaluation, at least semi-annually, in order to verify if there is evidence of impairment of its financial assets.
The Bank considers as objective evidence of impairment only the events occurring after the initial recognition of the asset that had an impact on the estimated cash flow and only when this impact can be reliably estimated. The Bank considers, for example, the following events:
a) financial difficulties of the obligor;
b) default of any payment, whether related to the principal or interest;
c) renegotiation or discounts granted;
d) extrajudicial liquidation, bankruptcy and financial reorganization;
e) disappearance of an active market, due to financial difficulties of the issuer.
If there is objective evidence of impairment for assets carried at amortized cost, the amount of the loss is calculated as the difference between the value of the asset on the date of measurement and the value that is expected to be received, adjusted to present value by the contractual rates. The carrying amount of the asset is adjusted through the use of an allowance account and the amount of the loss is recognized in the income statement.
Provisions for impairment of financial assets are assessed individually by a multi-departmental committee, which is responsible for verifying the appropriateness of the values and the methodologies used.
For the assets classified as Available-for-Sale, when there is objective evidence of impairment, the accumulated loss recognized in equity is transferred to the income statement, even if the asset has not been effectively realized.
When an asset is considered uncollectible, it is written off against the allowance account. Eventual subsequent recoveries of amounts previously written-off are recognized as income.
If, in subsequent periods, there is a change in the conditions of receipt of the asset and this change results in a reversal of an impairment loss recognized previously, the amount of the reversal is recognized as a gain, except for equity investments, where previously recognized impairment cannot be reversed.
3.4.7 Derivatives
Derivatives are recognized at fair value since the date they are contracted and are presented as assets when the fair value is positive and as liabilities when the fair value is negative.
The Bank does not apply hedge accounting as established in IAS 39 and, accordingly, recognizes all gains and losses in the income statement.
3.5. Property and Equipment
This group of accounts consists of land, buildings and equipment acquired by the Bank for its own use, as well as the collection of works of art and precious metals, except monetary gold, and is recorded at cost, less accumulated depreciation, when applicable. All the expenses directly attributable to the acquisition or construction of the asset are included in the cost. Further expenditures are capitalized only when it is probable that future economic benefits associated with the item will flow into the Bank and these estimates can be reliably estimated. Other expenditures for maintenance and repair are recognized in the income statement.
Land, works of art and precious metals are not depreciated. The other assets are depreciated according to the straight line method, recognizing their cost according to the estimated useful life of the assets:
a) buildings: 62.5 years;
b) equipment and furniture:
- computer equipment and vehicles: 5 years;
- other equipment and furniture: 10 years.
NOTES TO THE FINANCIAL STATEMENTS – AS AT DECEMBER 31, 2011
(The amounts are expressed in thousands of Reais, except when stated otherwise)
11
3.6. Provisions
3.6.1 Litigation
The Bank recognizes a provision when an outflow of economic resources is probable and this amount can be estimated reliably. When an outflow of economic resources is not probable, but only possible, no provision is recognized.
3.6.2 Post employment benefits
The Bank sponsors post employment plans with respect to retirement, pension and health care benefits, all in the form of defined benefits.
A defined benefit plan is one where the value of the benefits to which the employees have the right upon retirement is previously established, considering one or more factors, such as age and time of contribution.
The provision recognized in the balance sheet is the present value of the obligations less the fair value of the assets of the plans. The value of the obligations is calculated annually by independent actuaries.
Actuarial gains and losses resulting from adjustments based on experience and on changes in actuarial assumptions are fully recognized in the equity.
The actuarial surplus arises from the excess of assets in relation to the benefits payable of the Centrus Plan – Fundação Banco Central de Previdência Privada, which is recognized in the balance sheet to the extent of the expected benefits (notes 20.2 and 37.2).
3.7. Tax immunity
Pursuant to the Brazilian Federal Constitution, the Bank is immune to the collection of taxes on its equity and on the income and services related to its activities. However, it is obliged to pay fees and contributions and withholding taxes referring to the payment of services provided by third parties.
3.8. Statement of Cash Flows
The purpose of the Statement of Cash Flows is to present an entity's capacity to generate cash in order to meet its liquidity requirements. Considering that the Bank is the institution responsible for the liquidity of the financial system and, therefore, the holder of the right to issue currency, the Banks' management understands that the statement of cash flows referring to its operations should be limited to the transactions in foreign currencies, since these are outside its prerogative to issue.
For purposes of the Statement of Cash Flows, cash and cash equivalents include cash, demand deposits and very short-term time deposits.
4 - CASH AND CASH EQUIVALENTS
It comprises the portion of international reserves held by the Bank as demand deposits and very short-term time deposits, in accordance with its risk management policy, as described in notes 32 to 36. International reserves are the monetary assets available for coverage of imbalances in payments and, in some situations, for other financial requirements of the monetary authorities of a country.
5 - DEPOSITS
5.1. In foreign currencies
They comprise the portion of international reserves held by the Bank as fixed time deposits in financial institutions, in accordance with its risk management policy, as described in notes 32 to 36.
The variation in the balance of these deposits is due to the rebalancing of the investment portfolio of the international reserves, with a decrease in the liquidity portfolio and an increase in the securities portfolio (note 9.1).
5.2. In local currency
The deposits are those constituted by legal determination, bound to legal claims in process, for which there is recognition of a provision (note 20.1) or a court ordered debt payable (note 18.2). They are remunerated by the Referential Rate (TR) and due to this entailment, are unavailable until the court decision on the matter on litigation.
NOTES TO THE FINANCIAL STATEMENTS – AS AT DECEMBER 31, 2011
(The amounts are expressed in thousands of Reais, except when stated otherwise)
12
6 - FUNDS UNDER EXTERNAL MANAGEMENT
They comprise the portion of the international reserves held by the Bank as an investment in an investment fund managed by the Bank for International Settlements (BIS), which began in 2011.
7 - FINANCIAL ASSETS PURCHASED UNDER RESELL AGREEMENT/SOLD UNDER REPURCHASE AGREEMENT
These are transactions in which assets are purchased under an agreement to be sold on a future date (reverse repo) or are sold under an agreement to be repurchased in a future date (repo). In these operations, considering their characteristics, the items traded are recorded as collaterals, except in the event of purchases and sales of foreign currency, since cash settlement occurs only upon payment on the agreed-upon date, that is, receipt of the traded currency settles the operation. On the foreign market, the Bank normally trades with the same counterparty a repo along with a reverse repo, where the cash settlement of these operations occurs independently.
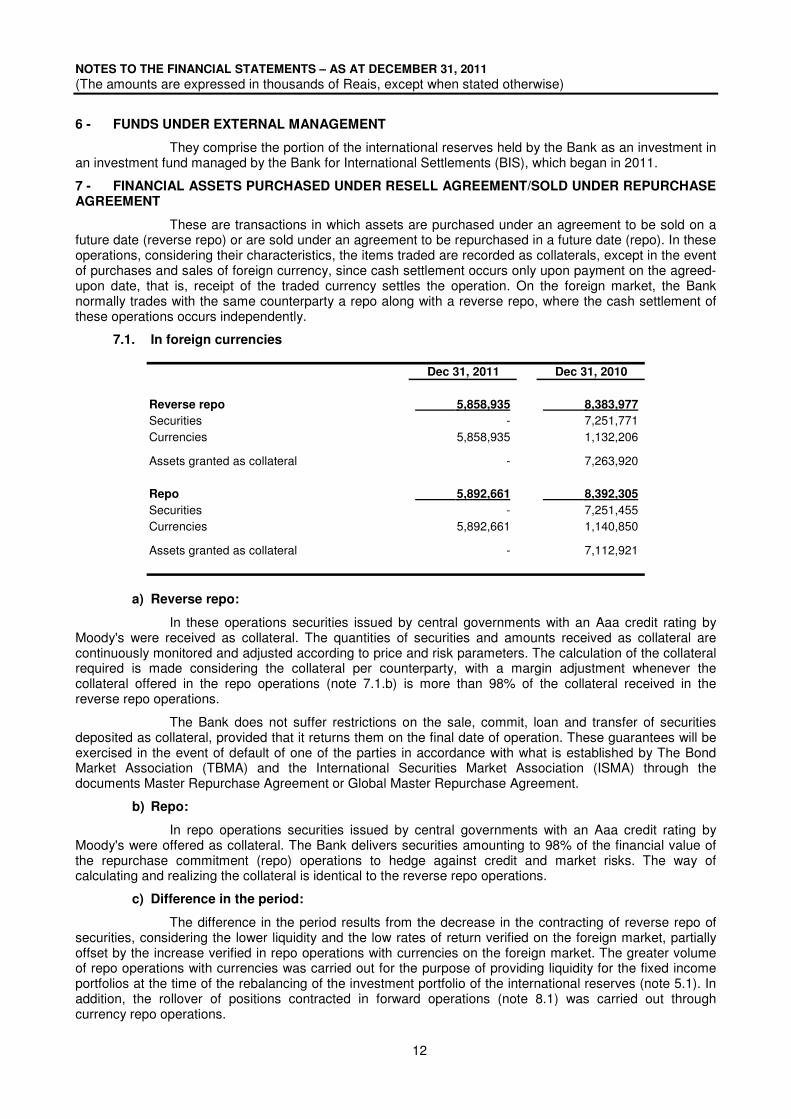
7.1. In foreign currencies
Dec 31, 2011 Dec 31, 2010
Reverse repo 5,858,935 8,383,977
Securities - 7,251,771 Currencies 5,858,935 1,132,206
Assets granted as collateral - 7,263,920
Repo 5,892,661 8,392,305
Securities - 7,251,455 Currencies 5,892,661 1,140,850
Assets granted as collateral - 7,112,921
a) Reverse repo:
In these operations securities issued by central governments with an Aaa credit rating by Moody's were received as collateral. The quantities of securities and amounts received as collateral are continuously monitored and adjusted according to price and risk parameters. The calculation of the collateral required is made considering the collateral per counterparty, with a margin adjustment whenever the collateral offered in the repo operations (note 7.1.b) is more than 98% of the collateral received in the reverse repo operations.
The Bank does not suffer restrictions on the sale, commit, loan and transfer of securities deposited as collateral, provided that it returns them on the final date of operation. These guarantees will be exercised in the event of default of one of the parties in accordance with what is established by The Bond Market Association (TBMA) and the International Securities Market Association (ISMA) through the documents Master Repurchase Agreement or Global Master Repurchase Agreement.
b) Repo:
In repo operations securities issued by central governments with an Aaa credit rating by Moody's were offered as collateral. The Bank delivers securities amounting to 98% of the financial value of the repurchase commitment (repo) operations to hedge against credit and market risks. The way of calculating and realizing the collateral is identical to the reverse repo operations.
c) Difference in the period:
The difference in the period results from the decrease in the contracting of reverse repo of securities, considering the lower liquidity and the low rates of return verified on the foreign market, partially offset by the increase verified in repo operations with currencies on the foreign market. The greater volume of repo operations with currencies was carried out for the purpose of providing liquidity for the fixed income portfolios at the time of the rebalancing of the investment portfolio of the international reserves (note 5.1). In addition, the rollover of positions contracted in forward operations (note 8.1) was carried out through currency repo operations.
NOTES TO THE FINANCIAL STATEMENTS – AS AT DECEMBER 31, 2011
(The amounts are expressed in thousands of Reais, except when stated otherwise)
13
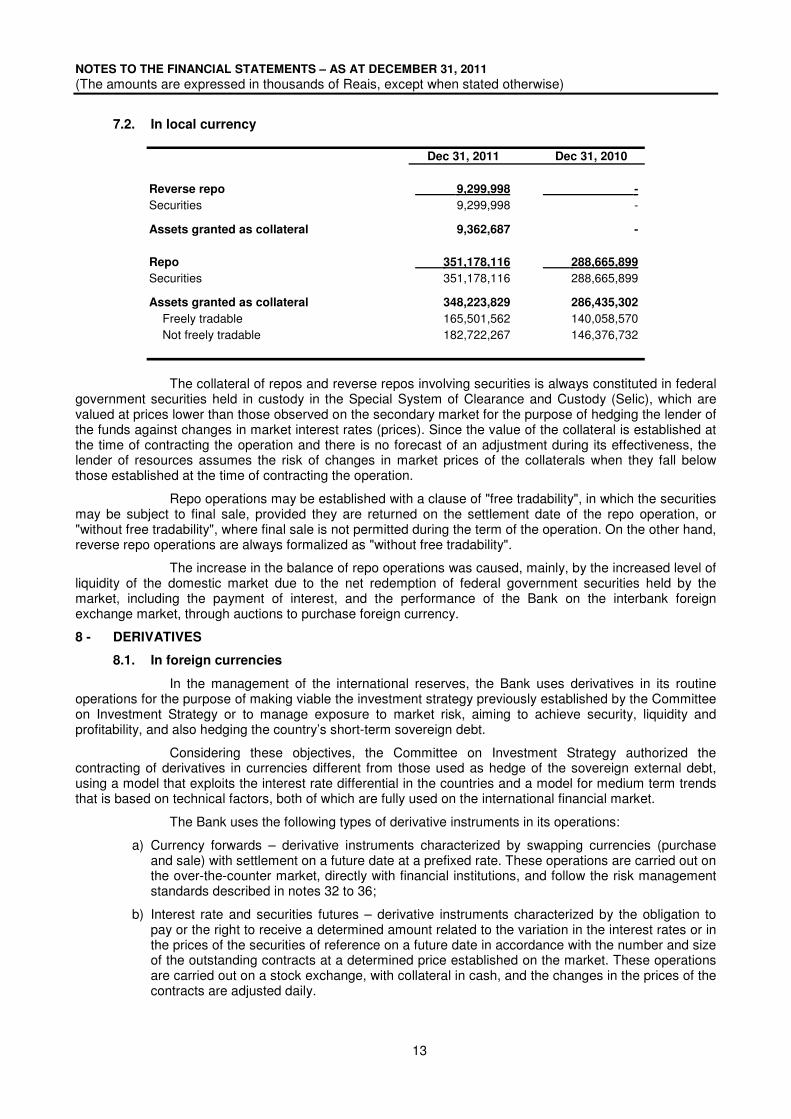
7.2. In local currency
Dec 31, 2011 Dec 31, 2010
Reverse repo 9,299,998 -
Securities 9,299,998 -
Assets granted as collateral 9,362,687 -
Repo 351,178,116 288,665,899
Securities 351,178,116 288,665,899
Assets granted as collateral 348,223,829 286,435,302
Freely tradable 165,501,562 140,058,570 Not freely tradable 182,722,267 146,376,732
The collateral of repos and reverse repos involving securities is always constituted in federal government securities held in custody in the Special System of Clearance and Custody (Selic), which are valued at prices lower than those observed on the secondary market for the purpose of hedging the lender of the funds against changes in market interest rates (prices). Since the value of the collateral is established at the time of contracting the operation and there is no forecast of an adjustment during its effectiveness, the lender of resources assumes the risk of changes in market prices of the collaterals when they fall below those established at the time of contracting the operation.
Repo operations may be established with a clause of "free tradability", in which the securities may be subject to final sale, provided they are returned on the settlement date of the repo operation, or "without free tradability", where final sale is not permitted during the term of the operation. On the other hand, reverse repo operations are always formalized as "without free tradability".
The increase in the balance of repo operations was caused, mainly, by the increased level of liquidity of the domestic market due to the net redemption of federal government securities held by the market, including the payment of interest, and the performance of the Bank on the interbank foreign exchange market, through auctions to purchase foreign currency.
8 - DERIVATIVES
8.1. In foreign currencies
In the management of the international reserves, the Bank uses derivatives in its routine operations for the purpose of making viable the investment strategy previously established by the Committee on Investment Strategy or to manage exposure to market risk, aiming to achieve security, liquidity and profitability, and also hedging the country’s short-term sovereign debt.
Considering these objectives, the Committee on Investment Strategy authorized the contracting of derivatives in currencies different from those used as hedge of the sovereign external debt, using a model that exploits the interest rate differential in the countries and a model for medium term trends that is based on technical factors, both of which are fully used on the international financial market.
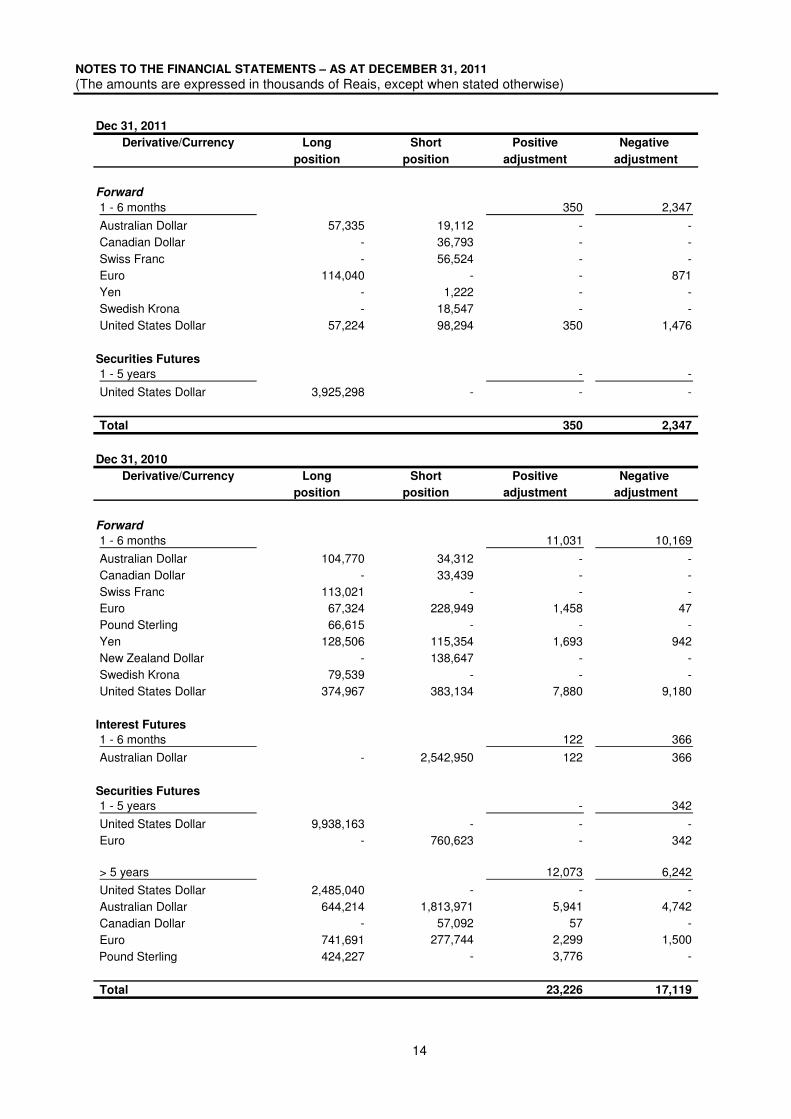
The Bank uses the following types of derivative instruments in its operations:
a) Currency forwards – derivative instruments characterized by swapping currencies (purchase and sale) with settlement on a future date at a prefixed rate. These operations are carried out on the over-the-counter market, directly with financial institutions, and follow the risk management standards described in notes 32 to 36;
b) Interest rate and securities futures – derivative instruments characterized by the obligation to pay or the right to receive a determined amount related to the variation in the interest rates or in the prices of the securities of reference on a future date in accordance with the number and size of the outstanding contracts at a determined price established on the market. These operations are carried out on a stock exchange, with collateral in cash, and the changes in the prices of the contracts are adjusted daily.
NOTES TO THE FINANCIAL STATEMENTS – AS AT DECEMBER 31, 2011
(The amounts are expressed in thousands of Reais, except when stated otherwise)
14
Dec 31, 2011
Derivative/Currency Long Short Positive Negative
position position adjustment adjustment
Forward
1 - 6 months 350 2,347
Australian Dollar 57,335 19,112 - - Canadian Dollar - 36,793 - - Swiss Franc - 56,524 - - Euro 114,040 - - 871 Yen - 1,222 - - Swedish Krona - 18,547 - - United States Dollar 57,224 98,294 350 1,476
Securities Futures
1 - 5 years - -
United States Dollar 3,925,298 - - -
Total 350 2,347
Dec 31, 2010
Derivative/Currency Long Short Positive Negative
position position adjustment adjustment
Forward
1 - 6 months 11,031 10,169
Australian Dollar 104,770 34,312 - - Canadian Dollar - 33,439 - - Swiss Franc 113,021 - - - Euro 67,324 228,949 1,458 47Pound Sterling 66,615 - - - Yen 128,506 115,354 1,693 942New Zealand Dollar - 138,647 - - Swedish Krona 79,539 - - - United States Dollar 374,967 383,134 7,880 9,180
Interest Futures
1 - 6 months 122 366
Australian Dollar - 2,542,950 122 366
Securities Futures
1 - 5 years - 342
United States Dollar 9,938,163 - - - Euro - 760,623 - 342
> 5 years 12,073 6,242
United States Dollar 2,485,040 - - - Australian Dollar 644,214 1,813,971 5,941 4,742 Canadian Dollar - 57,092 57 - Euro 741,691 277,744 2,299 1,500
Pound Sterling 424,227 - 3,776 -
Total 23,226 17,119
NOTES TO THE FINANCIAL STATEMENTS – AS AT DECEMBER 31, 2011
(The amounts are expressed in thousands of Reais, except when stated otherwise)
15
Given their characteristics of a currency swap, no collateral is established in forward operations. In futures operations, the collateral is established by deposits that totaled R$8,899 in 2011 (R$115,513 in 2010).
8.2. In local currency
8.2.1 Swap
In the execution of the monetary and exchange policy, the Bank may perform swaps, referenced in interest rates and in foreign exchange benchmarks, for the purpose of providing foreign exchange hedge for financial institutions and other economic agents.
These operations are contracted through holding auctions in the Bank's electronic system and are recorded on the Stock, Futures and Commodities Exchange (BM&FBovespa), in the form of a standard agreement negotiated on that exchange known as an "Exchange Swap Contract with Periodic Adjustments (SCC)". In the long positions of these contracts, the Bank is on the asset side in a domestic interest rate, represented by the average rate of the Interbank Deposits (DI) for one working day and on the liability side in foreign currency plus an exchange coupon, which is a representative interest rate in US dollars. Inversely, in the short positions, the bank is on the asset side in foreign currency plus an exchange coupon and on the liability side in a domestic interest rate (DI). These contracts have a notional value equivalent to US$50,000 and daily financial adjustment. The amount of collateral is stipulated by BM&FBovespa.
The purchase operations for these contracts by the Bank are known on the financial market as exchange swaps, and the selling operations are identified as reverse exchange swaps.
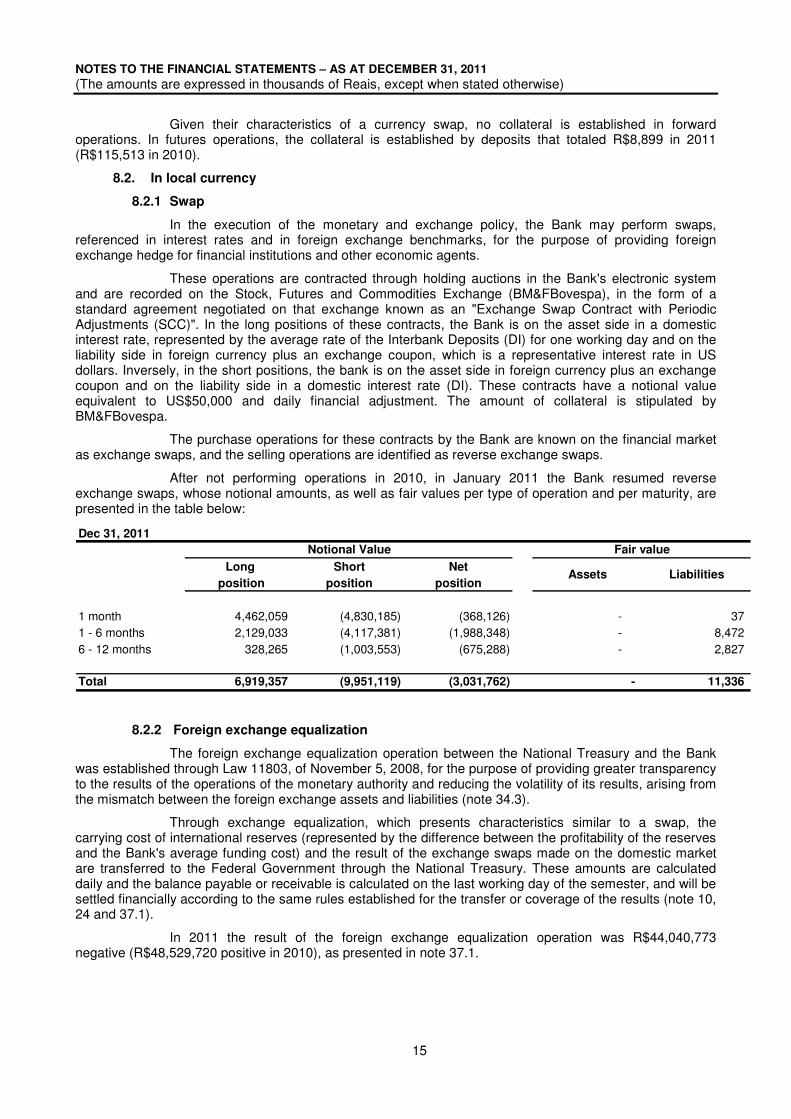
After not performing operations in 2010, in January 2011 the Bank resumed reverse exchange swaps, whose notional amounts, as well as fair values per type of operation and per maturity, are presented in the table below:
Dec 31, 2011
Long Short Net
position position position
1 month 4,462,059 (4,830,185) (368,126) - 37 1 - 6 months 2,129,033 (4,117,381) (1,988,348) - 8,472 6 - 12 months 328,265 (1,003,553) (675,288) - 2,827
Total 6,919,357 (9,951,119) (3,031,762) - 11,336
Fair valueNotional Value
Assets Liabilities
8.2.2 Foreign exchange equalization
The foreign exchange equalization operation between the National Treasury and the Bank was established through Law 11803, of November 5, 2008, for the purpose of providing greater transparency to the results of the operations of the monetary authority and reducing the volatility of its results, arising from the mismatch between the foreign exchange assets and liabilities (note 34.3).
Through exchange equalization, which presents characteristics similar to a swap, the carrying cost of international reserves (represented by the difference between the profitability of the reserves and the Bank's average funding cost) and the result of the exchange swaps made on the domestic market are transferred to the Federal Government through the National Treasury. These amounts are calculated daily and the balance payable or receivable is calculated on the last working day of the semester, and will be settled financially according to the same rules established for the transfer or coverage of the results (note 10, 24 and 37.1).
In 2011 the result of the foreign exchange equalization operation was R$44,040,773 negative (R$48,529,720 positive in 2010), as presented in note 37.1.
NOTES TO THE FINANCIAL STATEMENTS – AS AT DECEMBER 31, 2011
(The amounts are expressed in thousands of Reais, except when stated otherwise)
16
9 - SECURITIES
9.1. In foreign currencies
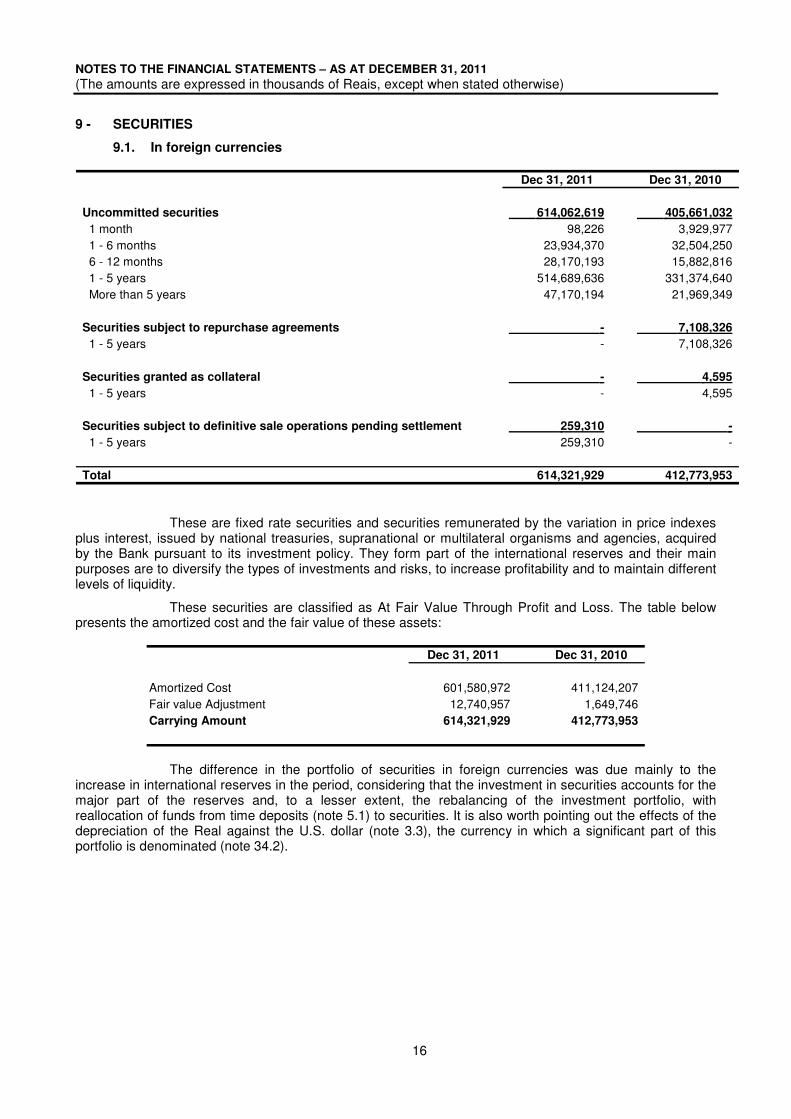
Dec 31, 2011 Dec 31, 2010
Uncommitted securities 614,062,619 405,661,032
1 month 98,226 3,929,977 1 - 6 months 23,934,370 32,504,250 6 - 12 months 28,170,193 15,882,816 1 - 5 years 514,689,636 331,374,640 More than 5 years 47,170,194 21,969,349
Securities subject to repurchase agreements - 7,108,326
1 - 5 years - 7,108,326
Securities granted as collateral - 4,595
1 - 5 years - 4,595
Securities subject to definitive sale operations pending settlement 259,310 -
1 - 5 years 259,310 -
Total 614,321,929 412,773,953
These are fixed rate securities and securities remunerated by the variation in price indexes plus interest, issued by national treasuries, supranational or multilateral organisms and agencies, acquired by the Bank pursuant to its investment policy. They form part of the international reserves and their main purposes are to diversify the types of investments and risks, to increase profitability and to maintain different levels of liquidity.
These securities are classified as At Fair Value Through Profit and Loss. The table below presents the amortized cost and the fair value of these assets:
Dec 31, 2011 Dec 31, 2010
Amortized Cost 601,580,972 411,124,207 Fair value Adjustment 12,740,957 1,649,746 Carrying Amount 614,321,929 412,773,953
The difference in the portfolio of securities in foreign currencies was due mainly to the increase in international reserves in the period, considering that the investment in securities accounts for the major part of the reserves and, to a lesser extent, the rebalancing of the investment portfolio, with reallocation of funds from time deposits (note 5.1) to securities. It is also worth pointing out the effects of the depreciation of the Real against the U.S. dollar (note 3.3), the currency in which a significant part of this portfolio is denominated (note 34.2).
NOTES TO THE FINANCIAL STATEMENTS – AS AT DECEMBER 31, 2011
(The amounts are expressed in thousands of Reais, except when stated otherwise)
17
9.2. In local currency
Dec 31, 2011
up to 1 month 1 - 6 months 6 - 12 months 1 - 5 years > 5 years Total
Uncommitted securities 15,777,152 5 38,144,159 196,067,388 153,965,733 403,954,437
LTN - - 27,404,540 72,554,541 - 99,959,081 LFT - 5 - 41,551,447 234,430 41,785,882 NTN-B - - 10,739,619 45,742,275 134,484,281 190,966,175 NTN-F 15,777,152 - - 36,219,125 19,247,022 71,243,299
Securities subject to repurchase agreements - 53,873,933 17,685,556 204,597,599 72,066,741 348,223,829
LTN - - 13,368,564 38,670,497 - 52,039,061 LFT - 53,873,933 - 128,581,632 266,702 182,722,267 NTN-B - - 4,316,992 26,775,566 37,876,183 68,968,741 NTN-F - - - 10,569,904 33,923,856 44,493,760
Securities granted as collateral - - - 2,364,635 - 2,364,635
LFT - - - 2,364,635 - 2,364,635
Untradeable securities - - - 91 121 212
NTN-P - - - 91 121 212
Total 15,777,152 53,873,938 55,829,715 403,029,713 226,032,595 754,543,113
Dec 31, 2010
up to 1 month 1 - 6 months 6 - 12 months 1 - 5 years > 5 years Total
Uncommitted securities 41,666,386 23,901,233 28,578,997 196,756,851 125,836,676 416,740,143
LTN 30,475,491 - 24,946,611 12,776,566 - 68,198,668 LFT - 14,761,015 4 110,316,411 4,497,817 129,575,247 NTN-B - 9,140,218 3,632,382 42,343,555 98,176,097 153,292,252 NTN-F 11,190,895 - - 31,320,319 23,162,762 65,673,976
Securities subject to repurchase agreements - 28,301,763 69,490,946 149,620,448 39,022,145 286,435,302
LTN - - 30,069,343 13,764,819 - 43,834,162 LFT - 26,408,499 26,988,015 88,004,945 - 141,401,459 NTN-B - 1,893,264 12,433,588 17,733,675 19,360,674 51,421,201 NTN-F - - - 30,117,009 19,661,471 49,778,480
Untradeable securities - - - 3 195 198
NTN-P - - - 3 195 198
Total 41,666,386 52,202,996 98,069,943 346,377,302 164,859,016 703,175,643
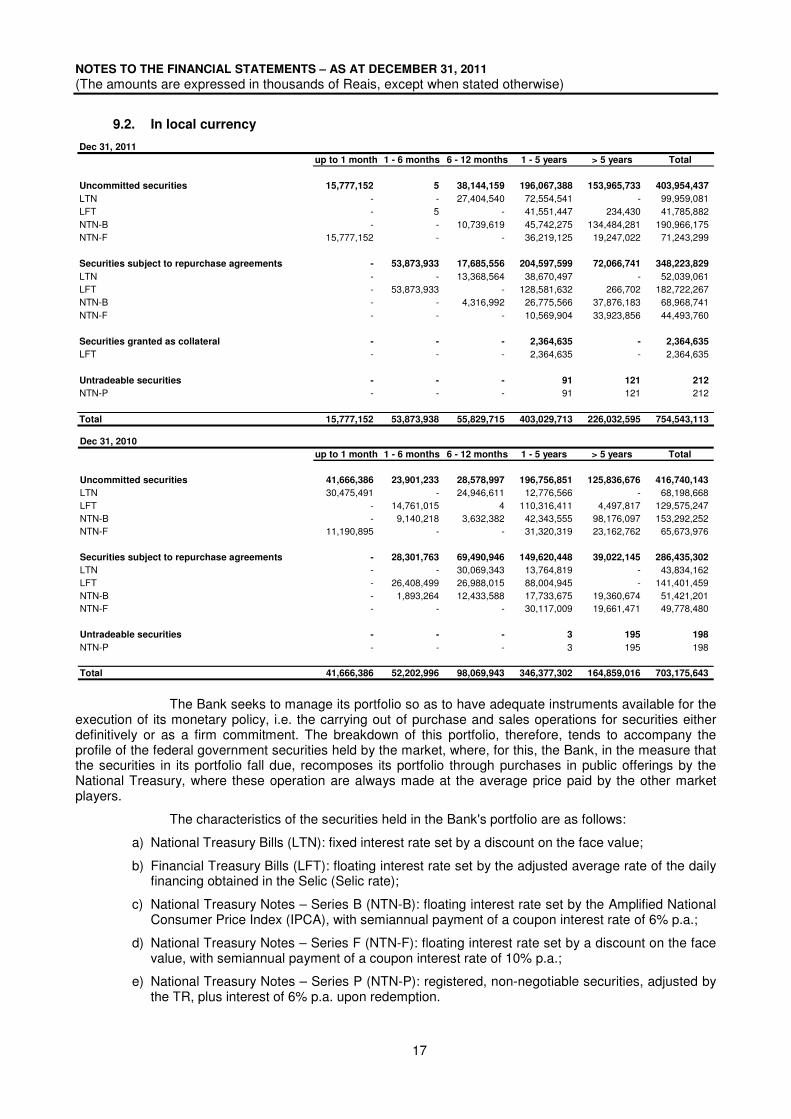
The Bank seeks to manage its portfolio so as to have adequate instruments available for the execution of its monetary policy, i.e. the carrying out of purchase and sales operations for securities either definitively or as a firm commitment. The breakdown of this portfolio, therefore, tends to accompany the profile of the federal government securities held by the market, where, for this, the Bank, in the measure that the securities in its portfolio fall due, recomposes its portfolio through purchases in public offerings by the National Treasury, where these operation are always made at the average price paid by the other market players.
The characteristics of the securities held in the Bank's portfolio are as follows:
a) National Treasury Bills (LTN): fixed interest rate set by a discount on the face value;
b) Financial Treasury Bills (LFT): floating interest rate set by the adjusted average rate of the daily financing obtained in the Selic (Selic rate);
c) National Treasury Notes – Series B (NTN-B): floating interest rate set by the Amplified National Consumer Price Index (IPCA), with semiannual payment of a coupon interest rate of 6% p.a.;
d) National Treasury Notes – Series F (NTN-F): floating interest rate set by a discount on the face value, with semiannual payment of a coupon interest rate of 10% p.a.;
e) National Treasury Notes – Series P (NTN-P): registered, non-negotiable securities, adjusted by the TR, plus interest of 6% p.a. upon redemption.
NOTES TO THE FINANCIAL STATEMENTS – AS AT DECEMBER 31, 2011
(The amounts are expressed in thousands of Reais, except when stated otherwise)
18
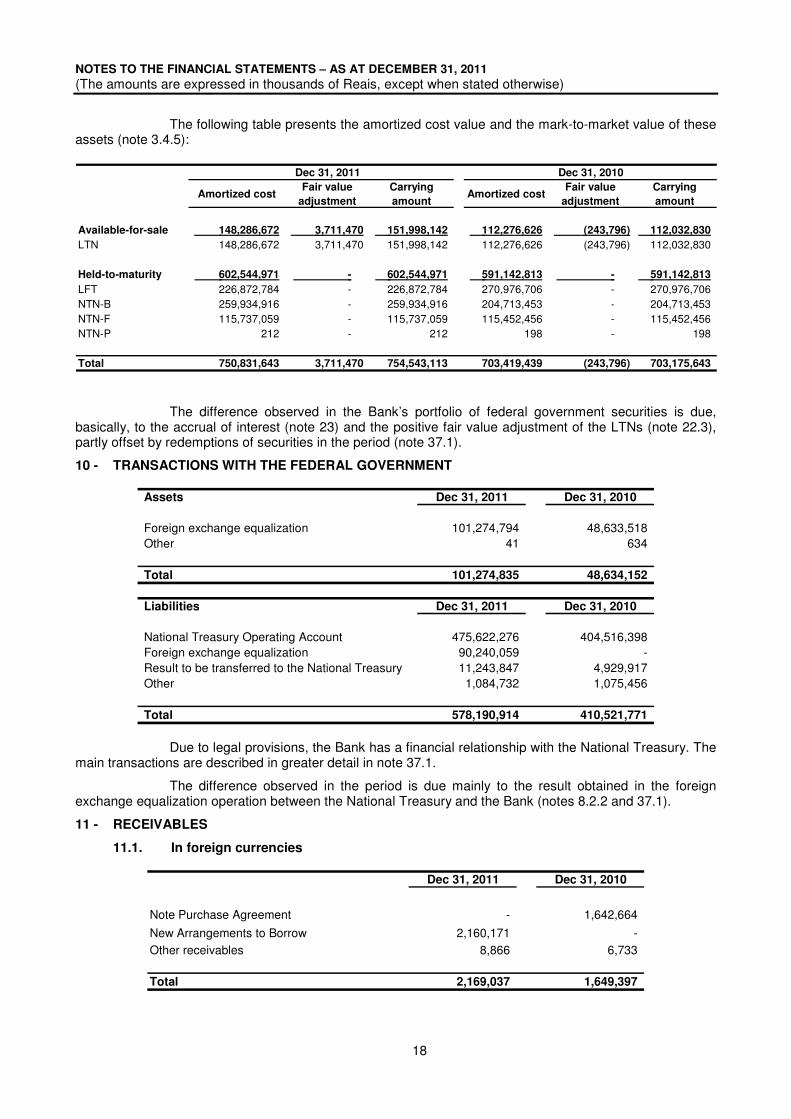
The following table presents the amortized cost value and the mark-to-market value of these assets (note 3.4.5):
Dec 31, 2011 Dec 31, 2010
Amortized costFair value
adjustment
Carrying
amountAmortized cost
Fair value
adjustment
Carrying
amount
Available-for-sale 148,286,672 3,711,470 151,998,142 112,276,626 (243,796) 112,032,830
LTN 148,286,672 3,711,470 151,998,142 112,276,626 (243,796) 112,032,830
Held-to-maturity 602,544,971 - 602,544,971 591,142,813 - 591,142,813
LFT 226,872,784 - 226,872,784 270,976,706 - 270,976,706 NTN-B 259,934,916 - 259,934,916 204,713,453 - 204,713,453 NTN-F 115,737,059 - 115,737,059 115,452,456 - 115,452,456 NTN-P 212 - 212 198 - 198
Total 750,831,643 3,711,470 754,543,113 703,419,439 (243,796) 703,175,643
The difference observed in the Bank’s portfolio of federal government securities is due, basically, to the accrual of interest (note 23) and the positive fair value adjustment of the LTNs (note 22.3), partly offset by redemptions of securities in the period (note 37.1).
10 - TRANSACTIONS WITH THE FEDERAL GOVERNMENT
Assets Dec 31, 2011 Dec 31, 2010
Foreign exchange equalization 101,274,794 48,633,518 Other 41 634
Total 101,274,835 48,634,152
Liabilities Dec 31, 2011 Dec 31, 2010
National Treasury Operating Account 475,622,276 404,516,398 Foreign exchange equalization 90,240,059 - Result to be transferred to the National Treasury 11,243,847 4,929,917 Other 1,084,732 1,075,456
Total 578,190,914 410,521,771
Due to legal provisions, the Bank has a financial relationship with the National Treasury. The main transactions are described in greater detail in note 37.1.
The difference observed in the period is due mainly to the result obtained in the foreign exchange equalization operation between the National Treasury and the Bank (notes 8.2.2 and 37.1).
11 - RECEIVABLES
11.1. In foreign currencies
Dec 31, 2011 Dec 31, 2010
Note Purchase Agreement - 1,642,664
New Arrangements to Borrow 2,160,171 - Other receivables 8,866 6,733
Total 2,169,037 1,649,397
NOTES TO THE FINANCIAL STATEMENTS – AS AT DECEMBER 31, 2011
(The amounts are expressed in thousands of Reais, except when stated otherwise)
19
The balance of receivables in foreign currencies as of December 31, 2011 refers mainly to the Bank's participation in New Arrangements to Borrow (NAB).
NAB is substantiated on article 7 of the Articles of Agreement of the IMF, which authorizes the organization, in the event of scarcity of a certain currency, to propose to the member countries to make loans to the Fund, in a complementary way to their quotas (note 13), under terms and conditions agreed upon between the parties, for the purpose of reinforcing the organization's financial capacity. The agreement is reviewed and renewed on a regular basis.
The agreement entered into on April 1, 2011 establishes the availability of up to SDR8.74 billion for the Fund. For the purpose of reducing the pressure for funds on the countries that have already contributed to the IMF before the activation of the agreement, the IMF permitted the countries that had operations within the scope of the Note Purchase Agreement (NPA) to migrate their balances to NAB. Accordingly, SDR750 million were made available within the scope of NAB, originating from the establishment of the operations of NPA, which were closed on the date of the execution of the abovementioned agreement.
The receivables from NAB are denominated in SDR and remunerated at rates determined weekly, based on the weighted average of the interest rates representative of short-term debts on the monetary market of the countries whose currencies constitute the SDR (note 3.3). The maturity of these operations is five years, with the possibility of settlement before this term in the event of the borrower of funds making early payment to the IMF. The funds made available in NAB do not have secured guarantees.
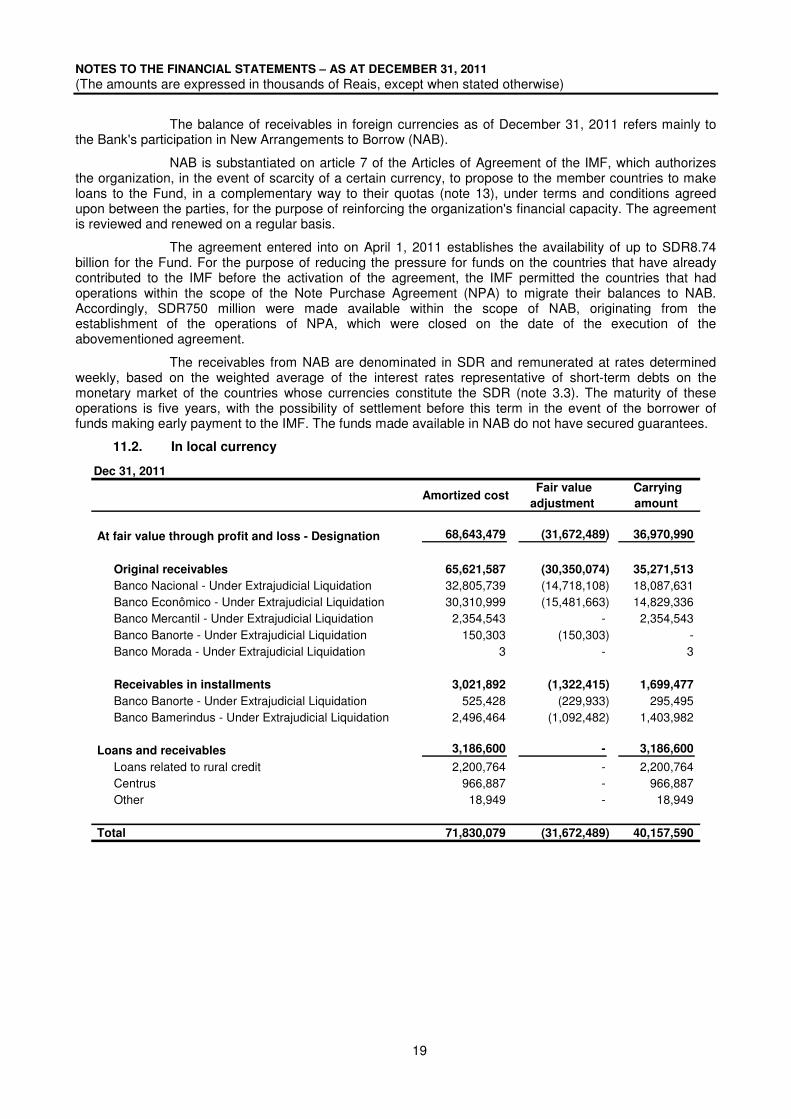
11.2. In local currency
Dec 31, 2011
Amortized cost Fair value
adjustment
Carrying
amount
At fair value through profit and loss - Designation 68,643,479 (31,672,489) 36,970,990
Original receivables 65,621,587 (30,350,074) 35,271,513
Banco Nacional - Under Extrajudicial Liquidation 32,805,739 (14,718,108) 18,087,631 Banco Econômico - Under Extrajudicial Liquidation 30,310,999 (15,481,663) 14,829,336 Banco Mercantil - Under Extrajudicial Liquidation 2,354,543 - 2,354,543 Banco Banorte - Under Extrajudicial Liquidation 150,303 (150,303) - Banco Morada - Under Extrajudicial Liquidation 3 - 3
Receivables in installments 3,021,892 (1,322,415) 1,699,477
Banco Banorte - Under Extrajudicial Liquidation 525,428 (229,933) 295,495 Banco Bamerindus - Under Extrajudicial Liquidation 2,496,464 (1,092,482) 1,403,982
Loans and receivables 3,186,600 - 3,186,600
Loans related to rural credit 2,200,764 - 2,200,764 Centrus 966,887 - 966,887 Other 18,949 - 18,949
Total 71,830,079 (31,672,489) 40,157,590
NOTES TO THE FINANCIAL STATEMENTS – AS AT DECEMBER 31, 2011
(The amounts are expressed in thousands of Reais, except when stated otherwise)
20
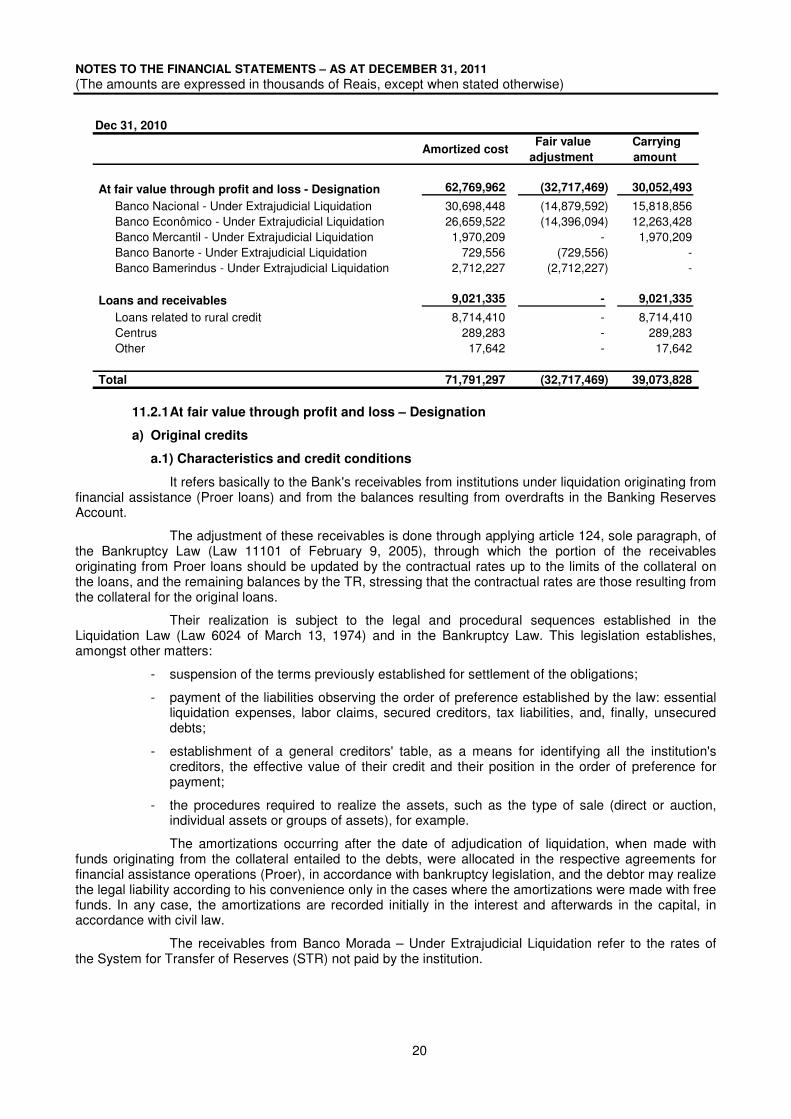
Dec 31, 2010
Amortized cost Fair value
adjustment
Carrying
amount
At fair value through profit and loss - Designation 62,769,962 (32,717,469) 30,052,493
Banco Nacional - Under Extrajudicial Liquidation 30,698,448 (14,879,592) 15,818,856 Banco Econômico - Under Extrajudicial Liquidation 26,659,522 (14,396,094) 12,263,428 Banco Mercantil - Under Extrajudicial Liquidation 1,970,209 - 1,970,209 Banco Banorte - Under Extrajudicial Liquidation 729,556 (729,556) - Banco Bamerindus - Under Extrajudicial Liquidation 2,712,227 (2,712,227) -
Loans and receivables 9,021,335 - 9,021,335
Loans related to rural credit 8,714,410 - 8,714,410 Centrus 289,283 - 289,283 Other 17,642 - 17,642
Total 71,791,297 (32,717,469) 39,073,828
11.2.1 At fair value through profit and loss – Designation
a) Original credits
a.1) Characteristics and credit conditions
It refers basically to the Bank's receivables from institutions under liquidation originating from financial assistance (Proer loans) and from the balances resulting from overdrafts in the Banking Reserves Account.
The adjustment of these receivables is done through applying article 124, sole paragraph, of the Bankruptcy Law (Law 11101 of February 9, 2005), through which the portion of the receivables originating from Proer loans should be updated by the contractual rates up to the limits of the collateral on the loans, and the remaining balances by the TR, stressing that the contractual rates are those resulting from the collateral for the original loans.
Their realization is subject to the legal and procedural sequences established in the Liquidation Law (Law 6024 of March 13, 1974) and in the Bankruptcy Law. This legislation establishes, amongst other matters:
- suspension of the terms previously established for settlement of the obligations;
- payment of the liabilities observing the order of preference established by the law: essential liquidation expenses, labor claims, secured creditors, tax liabilities, and, finally, unsecured debts;
- establishment of a general creditors' table, as a means for identifying all the institution's creditors, the effective value of their credit and their position in the order of preference for payment;
- the procedures required to realize the assets, such as the type of sale (direct or auction, individual assets or groups of assets), for example.
The amortizations occurring after the date of adjudication of liquidation, when made with funds originating from the collateral entailed to the debts, were allocated in the respective agreements for financial assistance operations (Proer), in accordance with bankruptcy legislation, and the debtor may realize the legal liability according to his convenience only in the cases where the amortizations were made with free funds. In any case, the amortizations are recorded initially in the interest and afterwards in the capital, in accordance with civil law.
The receivables from Banco Morada – Under Extrajudicial Liquidation refer to the rates of the System for Transfer of Reserves (STR) not paid by the institution.
NOTES TO THE FINANCIAL STATEMENTS – AS AT DECEMBER 31, 2011
(The amounts are expressed in thousands of Reais, except when stated otherwise)
21
a.2) Classification and measurement
These credits are classified as At Fair Value through Profit and Loss by designation of the Bank's Management, which considered this classification more relevant, considering the following characteristics:
- they comprise a portfolio of assets with the same origin – they arise from the Bank's actions as supervisor of the national financial system;
- for management and accounting purposes, these assets have been stated at their realizable amount since 1999. This form of evaluation reflects the Bank's objectives when addressing extrajudicial liquidation processes, i.e. concluding the processes in the shortest time possible and at the lowest possible cost for the monetary authority and for the depositors and investors.
The fair value of these credits is stated at the fair value of the original collateral, formed by LFT, NTN-A3 and FCVS/CVS, excluding the credits that are preferential for the Bank (payments of expenditures that are essential for the liquidation, wages and tax charges).
b) Requests made based on article 65 of Law 12249, of June 11, 2010
b.1) Characteristics and credit conditions
With the publication of Law 12249, of June 11, 2010, the Bank's credits with the institutions under liquidation became liable for payment in cash or in installments, through petition of the debtor, with discounts from 25% to 45% due on the charges.
Nacional, Econômico, Mercantil, Banorte and Bamerindus presented their petitions to the Bank, in the manner established in article 65 of the aforementioned law. The general principle that guides the settlement of receivables is the admission of federal government securities in payment, whose valuation will be attributed by the Bank for each type of security offered, considering the lower value between face value and market value.
In August 2011, Banorte and Bamerindus signed terms for payment in installments of their debts originating from overdrafts in the Banking Reserves Account with the Bank. Payment will be made in 180 consecutive, monthly installments (of which five were made up till December 2011), adjusted by the TR, as assured to institutions under liquidation by article 9, main clause, of Law 8177 of March 1, 1999, with the wording given by Law 8218, of August 29, 1991. If the extrajudicial liquidation is terminated, if there is surplus bankrupt estate or if there are other legal grounds for removing the incidence of the TR, the monthly installments will be adjusted by the Selic rate.
The term entered into for payment in installments does not imply novation of the debt, and it should be stressed that default by the debtor may imply the rescission of the term, with the debt returning to the original situation. Consummation of the payment in installments does not imply automatic closing of the special regime, which may be evaluated at an opportune moment, if it is the case, in accordance with the conditions established in Law 6024, of March 13, 1974.
The receivables from Banco Mercantil – Under Extrajudicial Liquidation were the subject of a proposal for immediate payment, as evidenced in note 39.
The remaining credits were under analysis on the balance sheet closing date, which is why it is not possible to define the cash flows that will be allocated to Bank upon receipt.
b.2) Classification and measurement
These receivables are classified as At Fair Value through Profit and Loss by designation of the Bank's Management, considering the same characteristics observed for the original receivables (note 11.2.1.a).
The fair value of the receivables corresponds to the present value of the cash flows, calculated through the use of equivalent market rates (note 31). Due to the methodology for evaluation of the original receivables with the institutions under extrajudicial liquidation establishing the recoverability of these assets based on the fair value of the original collateral, excluding the preferential receivable for the Bank, the receivables from Banorte and Bamerindus presented a book value equal to zero at December 31, 2010 (amortized cost less adjustment to fair value). However, with the payment of the debt in installments, cash flows began to flow into the Bank, generating a positive financial effect in the institution's result of
NOTES TO THE FINANCIAL STATEMENTS – AS AT DECEMBER 31, 2011
(The amounts are expressed in thousands of Reais, except when stated otherwise)
22
R$304,287, referring to the receivables from Banorte, and R$1,375,737, referring to the receivables from Bamerindus.
11.2.2 Loans and receivables
a) Loans related to rural credit
They address loans to financial institutions with funds originating from the reserve requirements against rural loan investment deficiencies. These loans are granted at the request of the financial institutions and are limited to the amount of their own compulsory reserve deposits and must be invested in rural loan operations.
These loans have a maximum term of 12 months and, in the case of funds from the rural savings account, they are subject to the levy of financial charges represented by the TR.
The difference in the balance of the loans related to rural credit is due to the decrease in the deficiencies in investment in rural credit in the period, with a consequent decrease in this type of loan.
b) Centrus
They comprise receivables from Centrus resulting:
- from changes introduced in 2009 in the regulation of the Foundation's benefit plan, which consisted of an increase in the basic quota of pensions for death, generating credit for the sponsor in proportion to the benefit granted;
- from the distribution of the surplus of the Foundation's benefit plan, as approved by Ordinance 192, of April 14, 2011, of the National Superintendency of Complementary Social Security (Previc), with reversal of amounts to the sponsor, to the persons supported and to the self sponsored participants.
Pursuant to the term of agreement reached between the Bank and Centrus, the funds are transferred upon request of the sponsor and are remunerated by the rate equivalent to the yield obtained by the Foundation in investments in federal government securities, including short-term funds collateralized in these securities.
The difference observed up till December 31, 2011 is due, basically, to the recognition of the portion owed to the Bank of the surplus of the Centrus benefit plan and the remuneration of the receivables in the period (note 37.2).
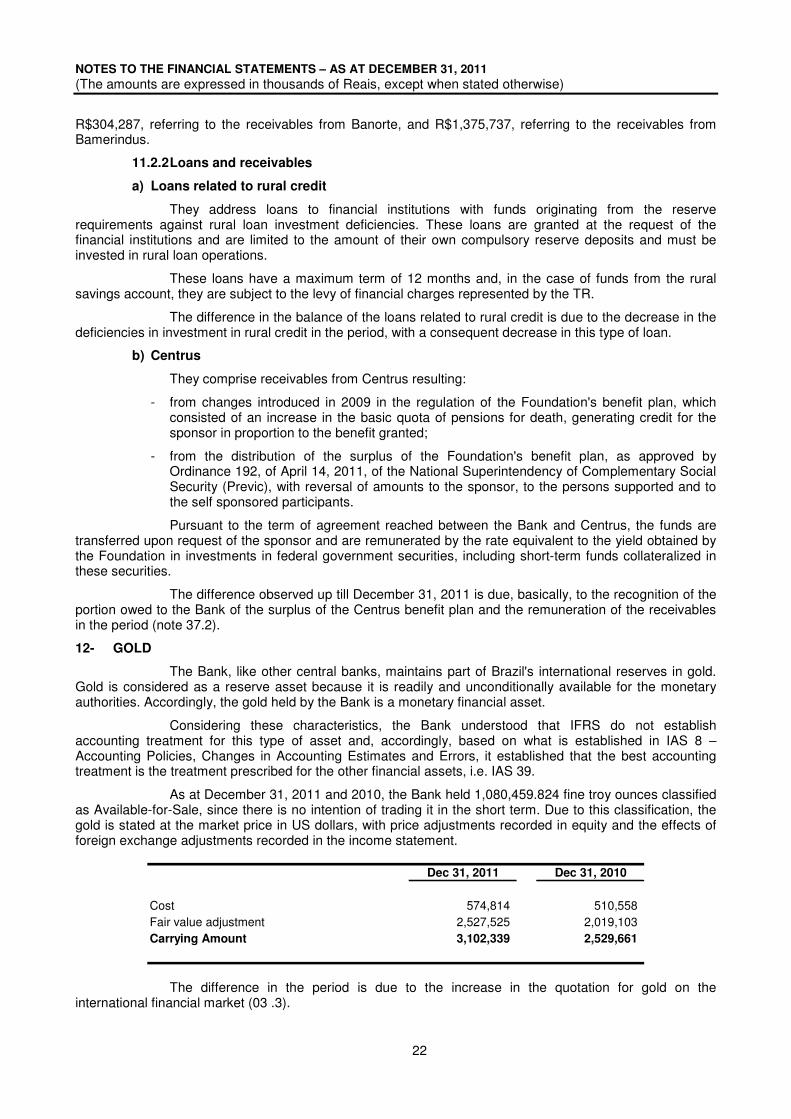
12- GOLD
The Bank, like other central banks, maintains part of Brazil's international reserves in gold. Gold is considered as a reserve asset because it is readily and unconditionally available for the monetary authorities. Accordingly, the gold held by the Bank is a monetary financial asset.
Considering these characteristics, the Bank understood that IFRS do not establish accounting treatment for this type of asset and, accordingly, based on what is established in IAS 8 – Accounting Policies, Changes in Accounting Estimates and Errors, it established that the best accounting treatment is the treatment prescribed for the other financial assets, i.e. IAS 39.
As at December 31, 2011 and 2010, the Bank held 1,080,459.824 fine troy ounces classified as Available-for-Sale, since there is no intention of trading it in the short term. Due to this classification, the gold is stated at the market price in US dollars, with price adjustments recorded in equity and the effects of foreign exchange adjustments recorded in the income statement.
Dec 31, 2011 Dec 31, 2010
Cost 574,814 510,558 Fair value adjustment 2,527,525 2,019,103 Carrying Amount 3,102,339 2,529,661
The difference in the period is due to the increase in the quotation for gold on the international financial market (03 .3).
NOTES TO THE FINANCIAL STATEMENTS – AS AT DECEMBER 31, 2011
(The amounts are expressed in thousands of Reais, except when stated otherwise)
23
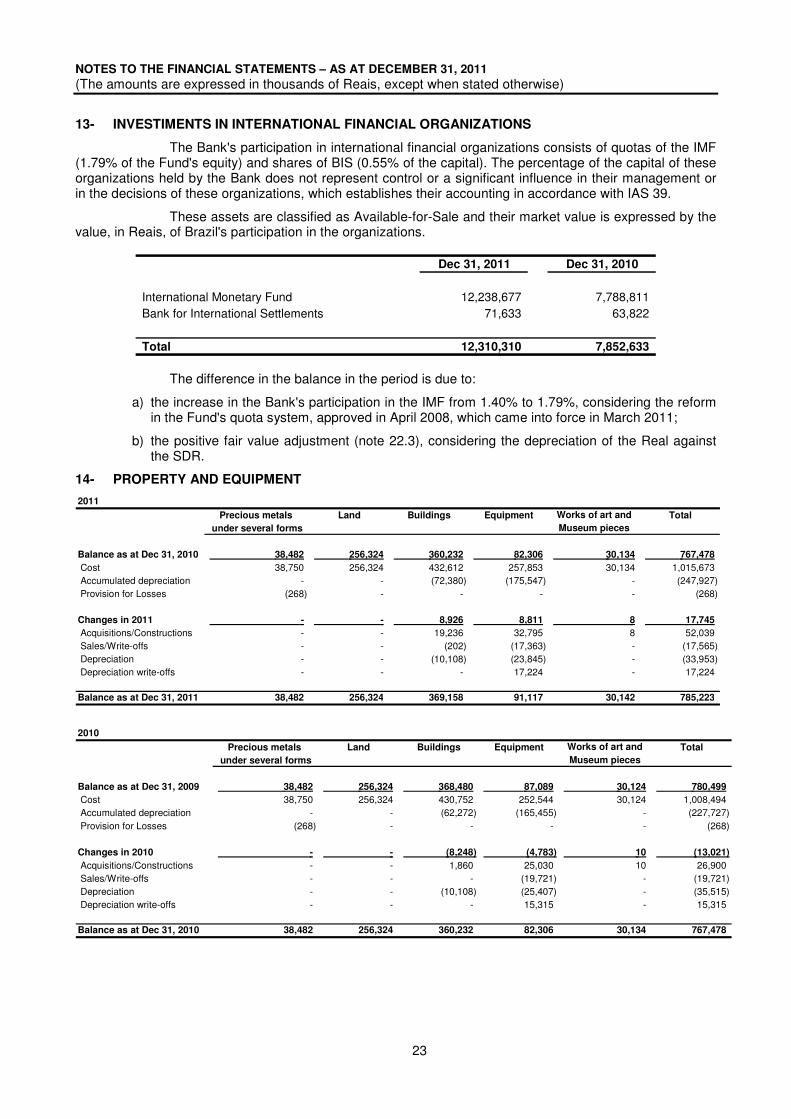
13- INVESTIMENTS IN INTERNATIONAL FINANCIAL ORGANIZATIONS
The Bank's participation in international financial organizations consists of quotas of the IMF (1.79% of the Fund's equity) and shares of BIS (0.55% of the capital). The percentage of the capital of these organizations held by the Bank does not represent control or a significant influence in their management or in the decisions of these organizations, which establishes their accounting in accordance with IAS 39.
These assets are classified as Available-for-Sale and their market value is expressed by the value, in Reais, of Brazil's participation in the organizations.
Dec 31, 2011 Dec 31, 2010
International Monetary Fund 12,238,677 7,788,811 Bank for International Settlements 71,633 63,822
Total 12,310,310 7,852,633
The difference in the balance in the period is due to:
a) the increase in the Bank's participation in the IMF from 1.40% to 1.79%, considering the reform in the Fund's quota system, approved in April 2008, which came into force in March 2011;
b) the positive fair value adjustment (note 22.3), considering the depreciation of the Real against the SDR.
14- PROPERTY AND EQUIPMENT
2011
Precious metals Land Buildings Equipment Works of art and Total
under several forms Museum pieces
Balance as at Dec 31, 2010 38,482 256,324 360,232 82,306 30,134 767,478
Cost 38,750 256,324 432,612 257,853 30,134 1,015,673 Accumulated depreciation - - (72,380) (175,547) - (247,927) Provision for Losses (268) - - - - (268)
Changes in 2011 - - 8,926 8,811 8 17,745
Acquisitions/Constructions - - 19,236 32,795 8 52,039 Sales/Write-offs - - (202) (17,363) - (17,565) Depreciation - - (10,108) (23,845) - (33,953) Depreciation write-offs - - - 17,224 - 17,224 Balance as at Dec 31, 2011 38,482 256,324 369,158 91,117 30,142 785,223
2010
Precious metals Land Buildings Equipment Works of art and Total
under several forms Museum pieces
Balance as at Dec 31, 2009 38,482 256,324 368,480 87,089 30,124 780,499
Cost 38,750 256,324 430,752 252,544 30,124 1,008,494 Accumulated depreciation - - (62,272) (165,455) - (227,727) Provision for Losses (268) - - - - (268)
Changes in 2010 - - (8,248) (4,783) 10 (13,021)
Acquisitions/Constructions - - 1,860 25,030 10 26,900 Sales/Write-offs - - - (19,721) - (19,721) Depreciation - - (10,108) (25,407) - (35,515) Depreciation write-offs - - - 15,315 - 15,315 Balance as at Dec 31, 2010 38,482 256,324 360,232 82,306 30,134 767,478

NOTES TO THE FINANCIAL STATEMENTS – AS AT DECEMBER 31, 2011
(The amounts are expressed in thousands of Reais, except when stated otherwise)
24
15- OTHER ASSETS
Dec 31, 2011 Dec 31, 2010
In Foreign Currencies - 1,099
In Local Currency 1,225,822 1,922,205
Actuarial Surplus - Centrus (Note 20.2) 1,149,284 1,839,249 Other 76,538 82,956
Total 1,225,822 1,923,304
16- ITENS IN THE COURSE OF COLLECTION
They refer basically to contracted operations pending settlement on the balance sheet date, whose financial settlement will occur within three days.
17- DEPOSITS RECEIVED FROM FINANCIAL INSTITUTIONS
Dec 31, 2011 Dec 31, 2010
In Foreign Currencies 1,333 1,185
In Local Currency 424,925,295 379,441,614
Demand deposits 51,465,641 55,707,954 Term deposits 130,616,900 104,150,806 Savings deposits 80,713,232 72,184,979 Additional requirements 157,685,941 135,721,287 Other 4,443,581 11,676,588
Total 424,926,628 379,442,799
The deposits of financial institutions in local currency comprise mainly compulsory reserve requirements, a traditional monetary policy mechanism that acts as a stabilizer for the liquidity of the economy.
These deposits are calculated on the average daily balance of the amounts raised by the banks and may be required in cash or in federal public securities. The deposits made in cash are recognized as demand liabilities of the Bank.
Currently, the main compulsory reserve requirements have the following percentages of deposits and rates of remuneration:
a) demand deposits – 43%, without remuneration;
b) term deposits – 20%, remunerated by the Selic rate;
c) savings deposits – 20% (17% rural savings account), remunerated based on the TR + 6.17% p.a. for free savings, social security savings and rural savings and TR + 3% p.a. for specially earmarked savings;
d) additional requirements – due on the sum of demand deposits (12%), of term deposits (12%) and of savings deposits (10%), remunerated by the Selic rate.
The difference in the balance of deposits received from financial institutions is associated basically with the fluctuation in the amounts subject to collection, since there has been no material change in the rules for the main compulsory reserve requirements in the period.
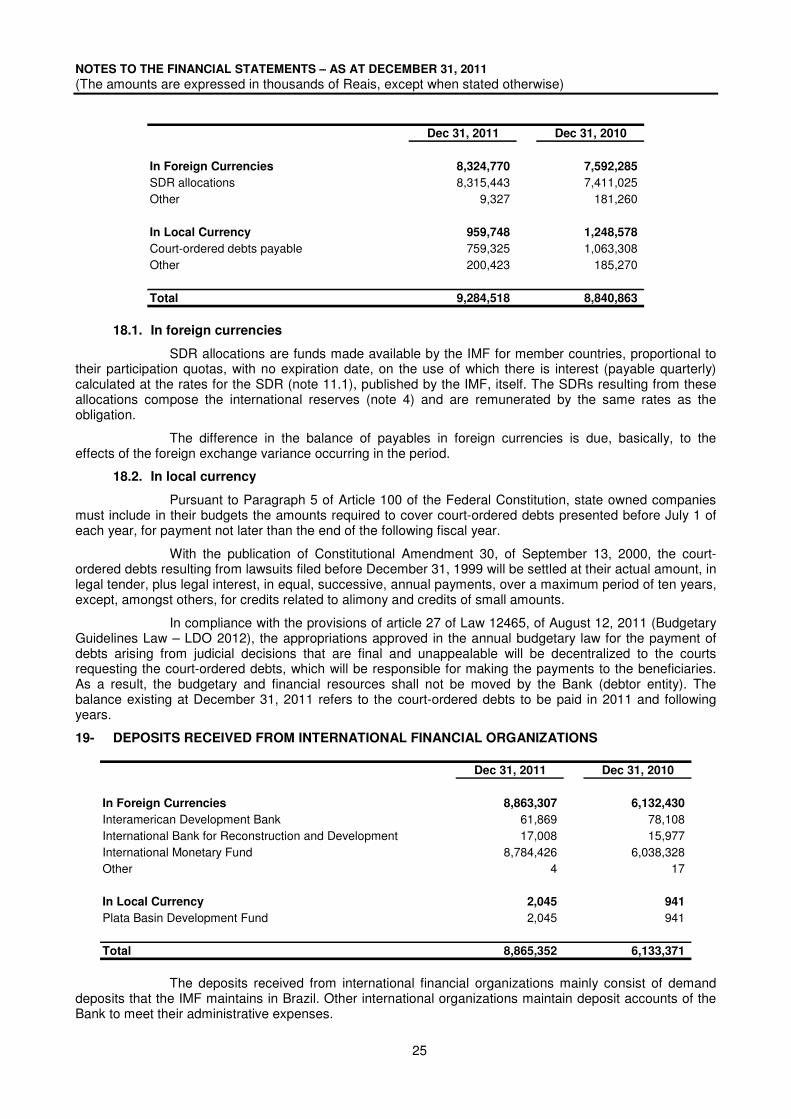
18- ACCOUNTS PAYABLE
The balance of accounts payable comprises:
NOTES TO THE FINANCIAL STATEMENTS – AS AT DECEMBER 31, 2011
(The amounts are expressed in thousands of Reais, except when stated otherwise)
25
Dec 31, 2011 Dec 31, 2010
In Foreign Currencies 8,324,770 7,592,285
SDR allocations 8,315,443 7,411,025 Other 9,327 181,260
In Local Currency 959,748 1,248,578
Court-ordered debts payable 759,325 1,063,308 Other 200,423 185,270
Total 9,284,518 8,840,863
18.1. In foreign currencies
SDR allocations are funds made available by the IMF for member countries, proportional to their participation quotas, with no expiration date, on the use of which there is interest (payable quarterly) calculated at the rates for the SDR (note 11.1), published by the IMF, itself. The SDRs resulting from these allocations compose the international reserves (note 4) and are remunerated by the same rates as the obligation.
The difference in the balance of payables in foreign currencies is due, basically, to the effects of the foreign exchange variance occurring in the period.
18.2. In local currency
Pursuant to Paragraph 5 of Article 100 of the Federal Constitution, state owned companies must include in their budgets the amounts required to cover court-ordered debts presented before July 1 of each year, for payment not later than the end of the following fiscal year.
With the publication of Constitutional Amendment 30, of September 13, 2000, the court-ordered debts resulting from lawsuits filed before December 31, 1999 will be settled at their actual amount, in legal tender, plus legal interest, in equal, successive, annual payments, over a maximum period of ten years, except, amongst others, for credits related to alimony and credits of small amounts.
In compliance with the provisions of article 27 of Law 12465, of August 12, 2011 (Budgetary Guidelines Law – LDO 2012), the appropriations approved in the annual budgetary law for the payment of debts arising from judicial decisions that are final and unappealable will be decentralized to the courts requesting the court-ordered debts, which will be responsible for making the payments to the beneficiaries. As a result, the budgetary and financial resources shall not be moved by the Bank (debtor entity). The balance existing at December 31, 2011 refers to the court-ordered debts to be paid in 2011 and following years.
19- DEPOSITS RECEIVED FROM INTERNATIONAL FINANCIAL ORGANIZATIONS
Dec 31, 2011 Dec 31, 2010
In Foreign Currencies 8,863,307 6,132,430
Interamerican Development Bank 61,869 78,108 International Bank for Reconstruction and Development 17,008 15,977 International Monetary Fund 8,784,426 6,038,328 Other 4 17
In Local Currency 2,045 941
Plata Basin Development Fund 2,045 941
Total 8,865,352 6,133,371
The deposits received from international financial organizations mainly consist of demand deposits that the IMF maintains in Brazil. Other international organizations maintain deposit accounts of the Bank to meet their administrative expenses.
NOTES TO THE FINANCIAL STATEMENTS – AS AT DECEMBER 31, 2011
(The amounts are expressed in thousands of Reais, except when stated otherwise)
26
The difference in the balance of deposits with the IMF refers to the payment of quotas of the Fund (note13) and the depreciation of the Real against the SDR in the period (note 3 .3).
20- PROVISIONS
Dec 31, 2011 Dec 31, 2010
Legal Claims 3,201,941 2,696,925 Actuarial liability 19,375,933 17,469,122
Total 22,577,874 20,166,047
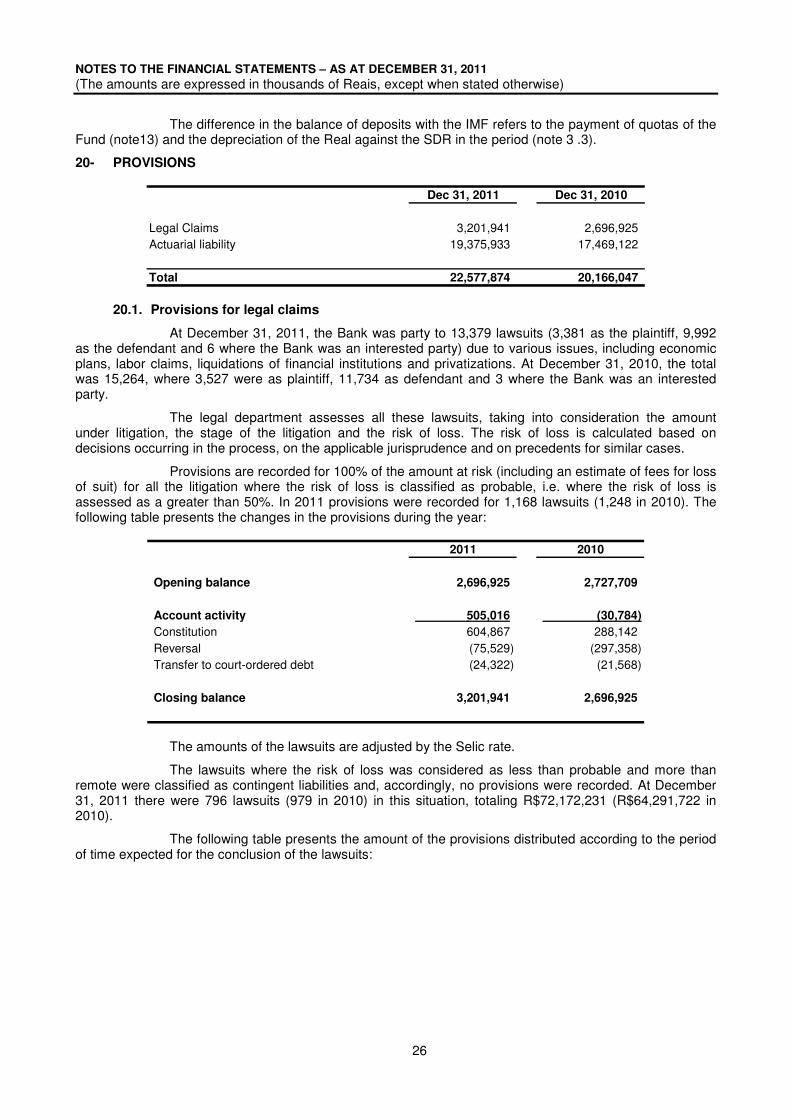
20.1. Provisions for legal claims
At December 31, 2011, the Bank was party to 13,379 lawsuits (3,381 as the plaintiff, 9,992 as the defendant and 6 where the Bank was an interested party) due to various issues, including economic plans, labor claims, liquidations of financial institutions and privatizations. At December 31, 2010, the total was 15,264, where 3,527 were as plaintiff, 11,734 as defendant and 3 where the Bank was an interested party.
The legal department assesses all these lawsuits, taking into consideration the amount under litigation, the stage of the litigation and the risk of loss. The risk of loss is calculated based on decisions occurring in the process, on the applicable jurisprudence and on precedents for similar cases.
Provisions are recorded for 100% of the amount at risk (including an estimate of fees for loss of suit) for all the litigation where the risk of loss is classified as probable, i.e. where the risk of loss is assessed as a greater than 50%. In 2011 provisions were recorded for 1,168 lawsuits (1,248 in 2010). The following table presents the changes in the provisions during the year:
2011 2010
Opening balance 2,696,925 2,727,709
Account activity 505,016 (30,784)
Constitution 604,867 288,142 Reversal (75,529) (297,358) Transfer to court-ordered debt (24,322) (21,568)
Closing balance 3,201,941 2,696,925
The amounts of the lawsuits are adjusted by the Selic rate.
The lawsuits where the risk of loss was considered as less than probable and more than remote were classified as contingent liabilities and, accordingly, no provisions were recorded. At December 31, 2011 there were 796 lawsuits (979 in 2010) in this situation, totaling R$72,172,231 (R$64,291,722 in 2010).
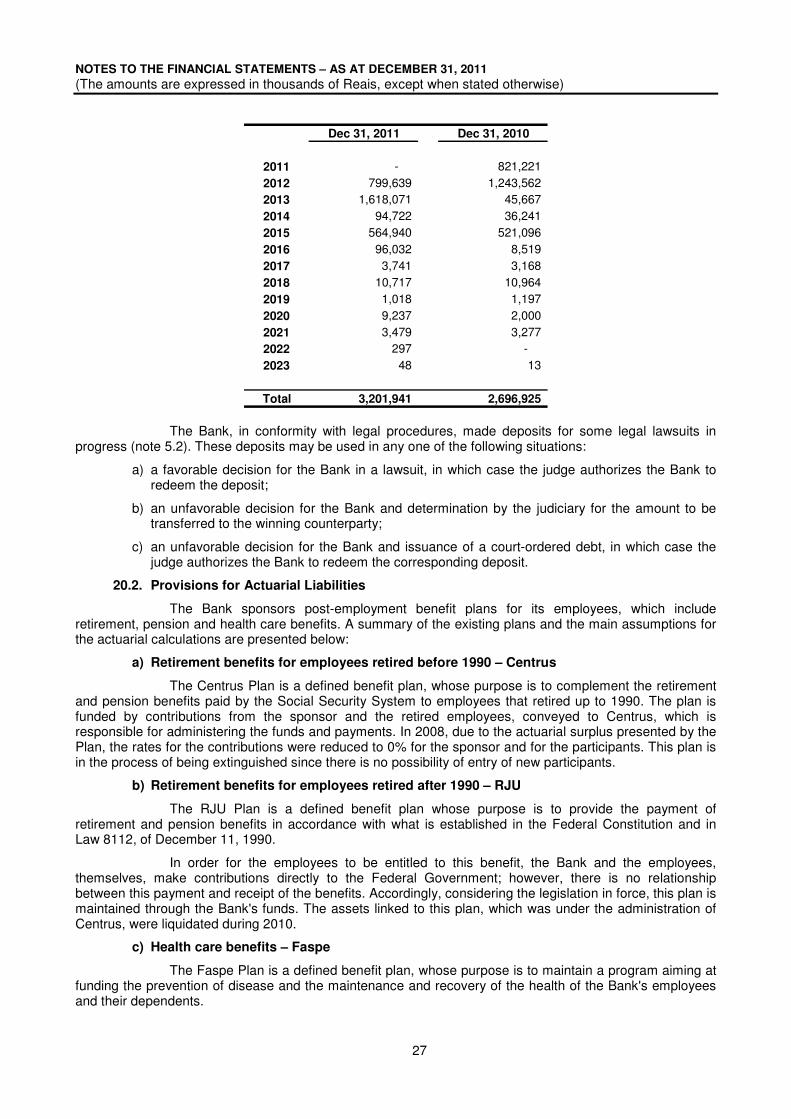
The following table presents the amount of the provisions distributed according to the period of time expected for the conclusion of the lawsuits:
NOTES TO THE FINANCIAL STATEMENTS – AS AT DECEMBER 31, 2011
(The amounts are expressed in thousands of Reais, except when stated otherwise)
27
Dec 31, 2011 Dec 31, 2010
2011 - 821,221 2012 799,639 1,243,562 2013 1,618,071 45,667 2014 94,722 36,241 2015 564,940 521,096 2016 96,032 8,519 2017 3,741 3,168 2018 10,717 10,964 2019 1,018 1,197 2020 9,237 2,000 2021 3,479 3,277 2022 297 - 2023 48 13
Total 3,201,941 2,696,925
The Bank, in conformity with legal procedures, made deposits for some legal lawsuits in progress (note 5.2). These deposits may be used in any one of the following situations:
a) a favorable decision for the Bank in a lawsuit, in which case the judge authorizes the Bank to redeem the deposit;
b) an unfavorable decision for the Bank and determination by the judiciary for the amount to be transferred to the winning counterparty;
c) an unfavorable decision for the Bank and issuance of a court-ordered debt, in which case the judge authorizes the Bank to redeem the corresponding deposit.
20.2. Provisions for Actuarial Liabilities
The Bank sponsors post-employment benefit plans for its employees, which include retirement, pension and health care benefits. A summary of the existing plans and the main assumptions for the actuarial calculations are presented below:
a) Retirement benefits for employees retired before 1990 – Centrus
The Centrus Plan is a defined benefit plan, whose purpose is to complement the retirement and pension benefits paid by the Social Security System to employees that retired up to 1990. The plan is funded by contributions from the sponsor and the retired employees, conveyed to Centrus, which is responsible for administering the funds and payments. In 2008, due to the actuarial surplus presented by the Plan, the rates for the contributions were reduced to 0% for the sponsor and for the participants. This plan is in the process of being extinguished since there is no possibility of entry of new participants.
b) Retirement benefits for employees retired after 1990 – RJU
The RJU Plan is a defined benefit plan whose purpose is to provide the payment of retirement and pension benefits in accordance with what is established in the Federal Constitution and in Law 8112, of December 11, 1990.
In order for the employees to be entitled to this benefit, the Bank and the employees, themselves, make contributions directly to the Federal Government; however, there is no relationship between this payment and receipt of the benefits. Accordingly, considering the legislation in force, this plan is maintained through the Bank's funds. The assets linked to this plan, which was under the administration of Centrus, were liquidated during 2010.
c) Health care benefits – Faspe
The Faspe Plan is a defined benefit plan, whose purpose is to maintain a program aiming at funding the prevention of disease and the maintenance and recovery of the health of the Bank's employees and their dependents.
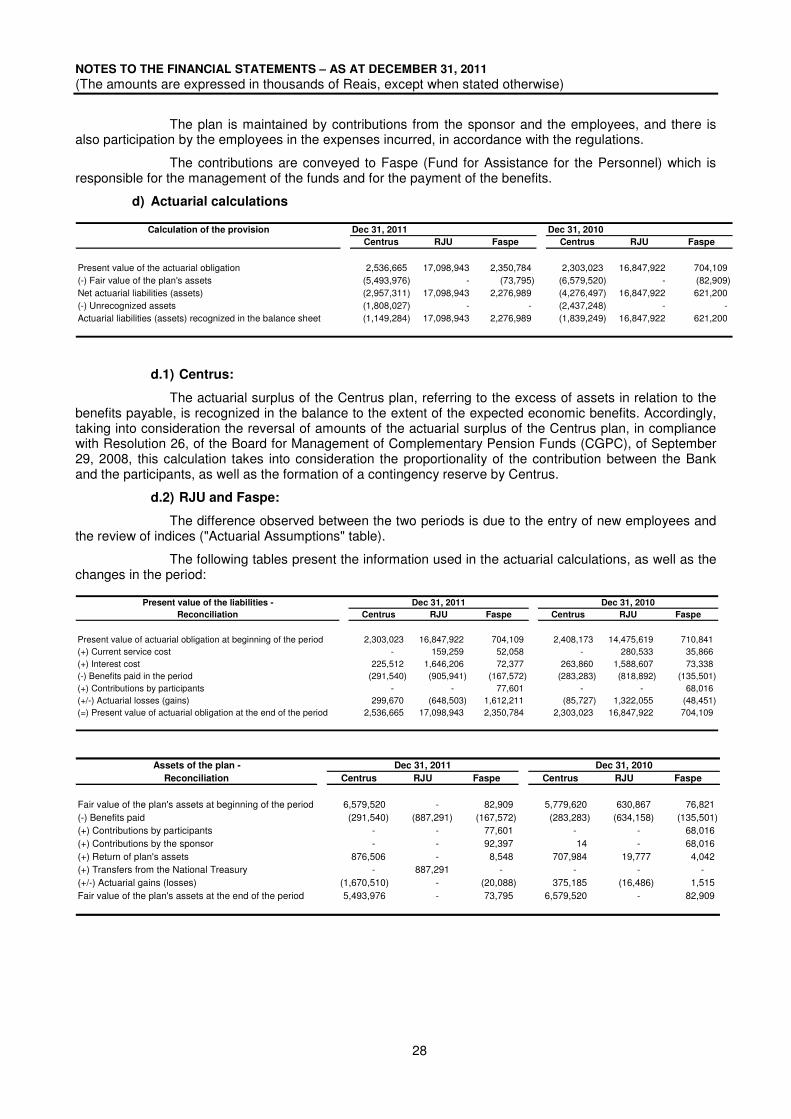
NOTES TO THE FINANCIAL STATEMENTS – AS AT DECEMBER 31, 2011
(The amounts are expressed in thousands of Reais, except when stated otherwise)
28
The plan is maintained by contributions from the sponsor and the employees, and there is also participation by the employees in the expenses incurred, in accordance with the regulations.
The contributions are conveyed to Faspe (Fund for Assistance for the Personnel) which is responsible for the management of the funds and for the payment of the benefits.
d) Actuarial calculations
Calculation of the provision Dec 31, 2011 Dec 31, 2010
Centrus RJU Faspe Centrus RJU Faspe
Present value of the actuarial obligation 2,536,665 17,098,943 2,350,784 2,303,023 16,847,922 704,109 (-) Fair value of the plan's assets (5,493,976) - (73,795) (6,579,520) - (82,909) Net actuarial liabilities (assets) (2,957,311) 17,098,943 2,276,989 (4,276,497) 16,847,922 621,200 (-) Unrecognized assets (1,808,027) - - (2,437,248) - - Actuarial liabilities (assets) recognized in the balance sheet (1,149,284) 17,098,943 2,276,989 (1,839,249) 16,847,922 621,200
d.1) Centrus:
The actuarial surplus of the Centrus plan, referring to the excess of assets in relation to the benefits payable, is recognized in the balance to the extent of the expected economic benefits. Accordingly, taking into consideration the reversal of amounts of the actuarial surplus of the Centrus plan, in compliance with Resolution 26, of the Board for Management of Complementary Pension Funds (CGPC), of September 29, 2008, this calculation takes into consideration the proportionality of the contribution between the Bank and the participants, as well as the formation of a contingency reserve by Centrus.
d.2) RJU and Faspe:
The difference observed between the two periods is due to the entry of new employees and the review of indices ("Actuarial Assumptions" table).
The following tables present the information used in the actuarial calculations, as well as the changes in the period:
Present value of the liabilities -
Reconciliation Centrus RJU Faspe Centrus RJU Faspe
Present value of actuarial obligation at beginning of the period 2,303,023 16,847,922 704,109 2,408,173 14,475,619 710,841 (+) Current service cost - 159,259 52,058 - 280,533 35,866 (+) Interest cost 225,512 1,646,206 72,377 263,860 1,588,607 73,338 (-) Benefits paid in the period (291,540) (905,941) (167,572) (283,283) (818,892) (135,501) (+) Contributions by participants - - 77,601 - - 68,016 (+/-) Actuarial losses (gains) 299,670 (648,503) 1,612,211 (85,727) 1,322,055 (48,451) (=) Present value of actuarial obligation at the end of the period 2,536,665 17,098,943 2,350,784 2,303,023 16,847,922 704,109
Dec 31, 2011 Dec 31, 2010
Assets of the plan -
Reconciliation Centrus RJU Faspe Centrus RJU Faspe
Fair value of the plan's assets at beginning of the period 6,579,520 - 82,909 5,779,620 630,867 76,821 (-) Benefits paid (291,540) (887,291) (167,572) (283,283) (634,158) (135,501) (+) Contributions by participants - - 77,601 - - 68,016 (+) Contributions by the sponsor - - 92,397 14 - 68,016 (+) Return of plan's assets 876,506 - 8,548 707,984 19,777 4,042 (+) Transfers from the National Treasury - 887,291 - - - - (+/-) Actuarial gains (losses) (1,670,510) - (20,088) 375,185 (16,486) 1,515 Fair value of the plan's assets at the end of the period 5,493,976 - 73,795 6,579,520 - 82,909
Dec 31, 2011 Dec 31, 2010
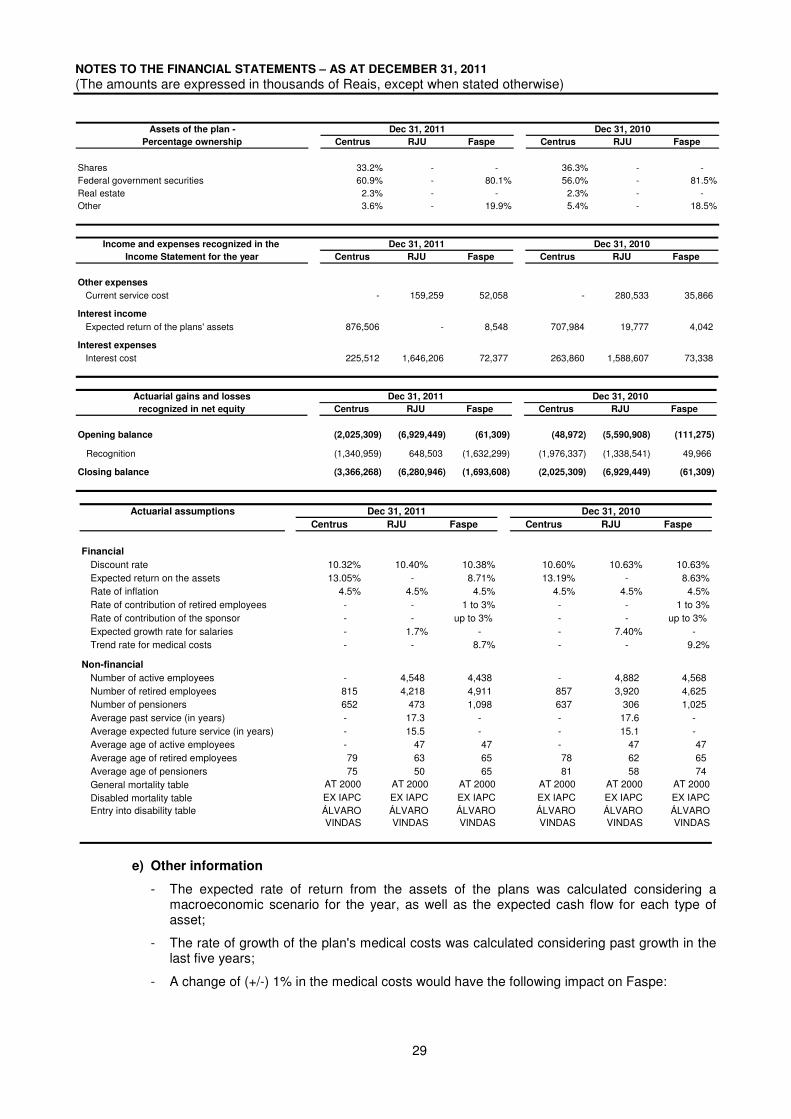
NOTES TO THE FINANCIAL STATEMENTS – AS AT DECEMBER 31, 2011
(The amounts are expressed in thousands of Reais, except when stated otherwise)
29
Assets of the plan -
Percentage ownership Centrus RJU Faspe Centrus RJU Faspe
Shares 33.2% - - 36.3% - - Federal government securities 60.9% - 80.1% 56.0% - 81.5%Real estate 2.3% - - 2.3% - - Other 3.6% - 19.9% 5.4% - 18.5%
Dec 31, 2011 Dec 31, 2010
Income and expenses recognized in the
Income Statement for the year Centrus RJU Faspe Centrus RJU Faspe
Other expenses
Current service cost - 159,259 52,058 - 280,533 35,866
Interest income
Expected return of the plans' assets 876,506 - 8,548 707,984 19,777 4,042
Interest expenses
Interest cost 225,512 1,646,206 72,377 263,860 1,588,607 73,338
Dec 31, 2011 Dec 31, 2010
Actuarial gains and losses
recognized in net equity Centrus RJU Faspe Centrus RJU Faspe
Opening balance (2,025,309) (6,929,449) (61,309) (48,972) (5,590,908) (111,275)
Recognition (1,340,959) 648,503 (1,632,299) (1,976,337) (1,338,541) 49,966
Closing balance (3,366,268) (6,280,946) (1,693,608) (2,025,309) (6,929,449) (61,309)
Dec 31, 2011 Dec 31, 2010
Actuarial assumptions
Centrus RJU Faspe Centrus RJU Faspe
Financial
Discount rate 10.32% 10.40% 10.38% 10.60% 10.63% 10.63%Expected return on the assets 13.05% - 8.71% 13.19% - 8.63%Rate of inflation 4.5% 4.5% 4.5% 4.5% 4.5% 4.5%Rate of contribution of retired employees - - 1 to 3% - - 1 to 3%Rate of contribution of the sponsor - - up to 3% - - up to 3% Expected growth rate for salaries - 1.7% - - 7.40% - Trend rate for medical costs - - 8.7% - - 9.2%
Non-financial
Number of active employees - 4,548 4,438 - 4,882 4,568 Number of retired employees 815 4,218 4,911 857 3,920 4,625 Number of pensioners 652 473 1,098 637 306 1,025 Average past service (in years) - 17.3 - - 17.6 - Average expected future service (in years) - 15.5 - - 15.1 - Average age of active employees - 47 47 - 47 47 Average age of retired employees 79 63 65 78 62 65 Average age of pensioners 75 50 65 81 58 74 General mortality table AT 2000 AT 2000 AT 2000 AT 2000 AT 2000 AT 2000 Disabled mortality table EX IAPC EX IAPC EX IAPC EX IAPC EX IAPC EX IAPC Entry into disability table ÁLVARO
VINDAS ÁLVARO
VINDAS ÁLVARO
VINDAS ÁLVARO
VINDAS ÁLVARO
VINDAS ÁLVARO
VINDAS
Dec 31, 2010Dec 31, 2011
e) Other information
- The expected rate of return from the assets of the plans was calculated considering a macroeconomic scenario for the year, as well as the expected cash flow for each type of asset;
- The rate of growth of the plan's medical costs was calculated considering past growth in the last five years;
- A change of (+/-) 1% in the medical costs would have the following impact on Faspe:
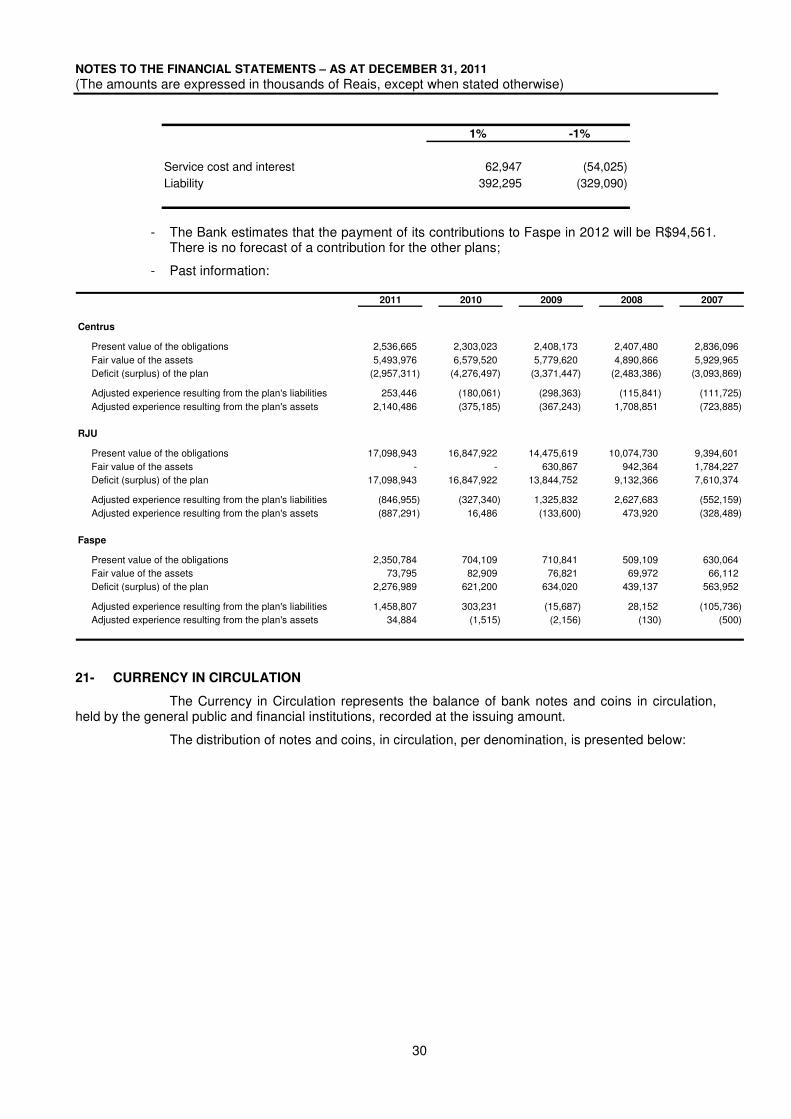
NOTES TO THE FINANCIAL STATEMENTS – AS AT DECEMBER 31, 2011
(The amounts are expressed in thousands of Reais, except when stated otherwise)
30
1% -1%
Service cost and interest 62,947 (54,025) Liability 392,295 (329,090)
- The Bank estimates that the payment of its contributions to Faspe in 2012 will be R$94,561. There is no forecast of a contribution for the other plans;
- Past information:
2011 2010 2009 2008 2007
Centrus
Present value of the obligations 2,536,665 2,303,023 2,408,173 2,407,480 2,836,096 Fair value of the assets 5,493,976 6,579,520 5,779,620 4,890,866 5,929,965 Deficit (surplus) of the plan (2,957,311) (4,276,497) (3,371,447) (2,483,386) (3,093,869)
Adjusted experience resulting from the plan's liabilities 253,446 (180,061) (298,363) (115,841) (111,725) Adjusted experience resulting from the plan's assets 2,140,486 (375,185) (367,243) 1,708,851 (723,885)
RJU
Present value of the obligations 17,098,943 16,847,922 14,475,619 10,074,730 9,394,601 Fair value of the assets - - 630,867 942,364 1,784,227 Deficit (surplus) of the plan 17,098,943 16,847,922 13,844,752 9,132,366 7,610,374
Adjusted experience resulting from the plan's liabilities (846,955) (327,340) 1,325,832 2,627,683 (552,159) Adjusted experience resulting from the plan's assets (887,291) 16,486 (133,600) 473,920 (328,489)
Faspe
Present value of the obligations 2,350,784 704,109 710,841 509,109 630,064 Fair value of the assets 73,795 82,909 76,821 69,972 66,112 Deficit (surplus) of the plan 2,276,989 621,200 634,020 439,137 563,952
Adjusted experience resulting from the plan's liabilities 1,458,807 303,231 (15,687) 28,152 (105,736) Adjusted experience resulting from the plan's assets 34,884 (1,515) (2,156) (130) (500)
21- CURRENCY IN CIRCULATION
The Currency in Circulation represents the balance of bank notes and coins in circulation, held by the general public and financial institutions, recorded at the issuing amount.
The distribution of notes and coins, in circulation, per denomination, is presented below:
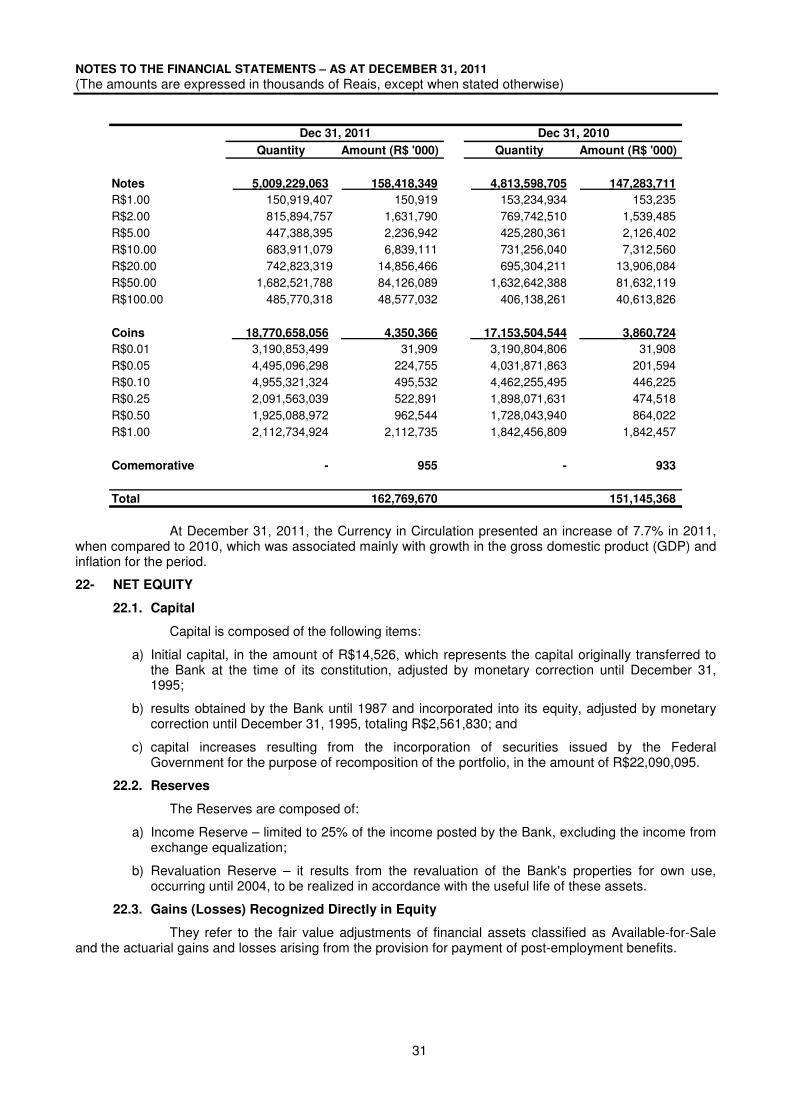
NOTES TO THE FINANCIAL STATEMENTS – AS AT DECEMBER 31, 2011
(The amounts are expressed in thousands of Reais, except when stated otherwise)
31
Quantity Amount (R$ '000) Quantity Amount (R$ '000)
Notes 5,009,229,063 158,418,349 4,813,598,705 147,283,711
R$1.00 150,919,407 150,919 153,234,934 153,235 R$2.00 815,894,757 1,631,790 769,742,510 1,539,485 R$5.00 447,388,395 2,236,942 425,280,361 2,126,402 R$10.00 683,911,079 6,839,111 731,256,040 7,312,560 R$20.00 742,823,319 14,856,466 695,304,211 13,906,084 R$50.00 1,682,521,788 84,126,089 1,632,642,388 81,632,119 R$100.00 485,770,318 48,577,032 406,138,261 40,613,826
Coins 18,770,658,056 4,350,366 17,153,504,544 3,860,724
R$0.01 3,190,853,499 31,909 3,190,804,806 31,908 R$0.05 4,495,096,298 224,755 4,031,871,863 201,594 R$0.10 4,955,321,324 495,532 4,462,255,495 446,225 R$0.25 2,091,563,039 522,891 1,898,071,631 474,518 R$0.50 1,925,088,972 962,544 1,728,043,940 864,022 R$1.00 2,112,734,924 2,112,735 1,842,456,809 1,842,457
Comemorative - 955 - 933
Total 162,769,670 151,145,368
Dec 31, 2011 Dec 31, 2010
At December 31, 2011, the Currency in Circulation presented an increase of 7.7% in 2011, when compared to 2010, which was associated mainly with growth in the gross domestic product (GDP) and inflation for the period.
22- NET EQUITY
22.1. Capital
Capital is composed of the following items:
a) Initial capital, in the amount of R$14,526, which represents the capital originally transferred to the Bank at the time of its constitution, adjusted by monetary correction until December 31, 1995;
b) results obtained by the Bank until 1987 and incorporated into its equity, adjusted by monetary correction until December 31, 1995, totaling R$2,561,830; and
c) capital increases resulting from the incorporation of securities issued by the Federal Government for the purpose of recomposition of the portfolio, in the amount of R$22,090,095.
22.2. Reserves
The Reserves are composed of:
a) Income Reserve – limited to 25% of the income posted by the Bank, excluding the income from exchange equalization;
b) Revaluation Reserve – it results from the revaluation of the Bank's properties for own use, occurring until 2004, to be realized in accordance with the useful life of these assets.
22.3. Gains (Losses) Recognized Directly in Equity
They refer to the fair value adjustments of financial assets classified as Available-for-Sale and the actuarial gains and losses arising from the provision for payment of post-employment benefits.
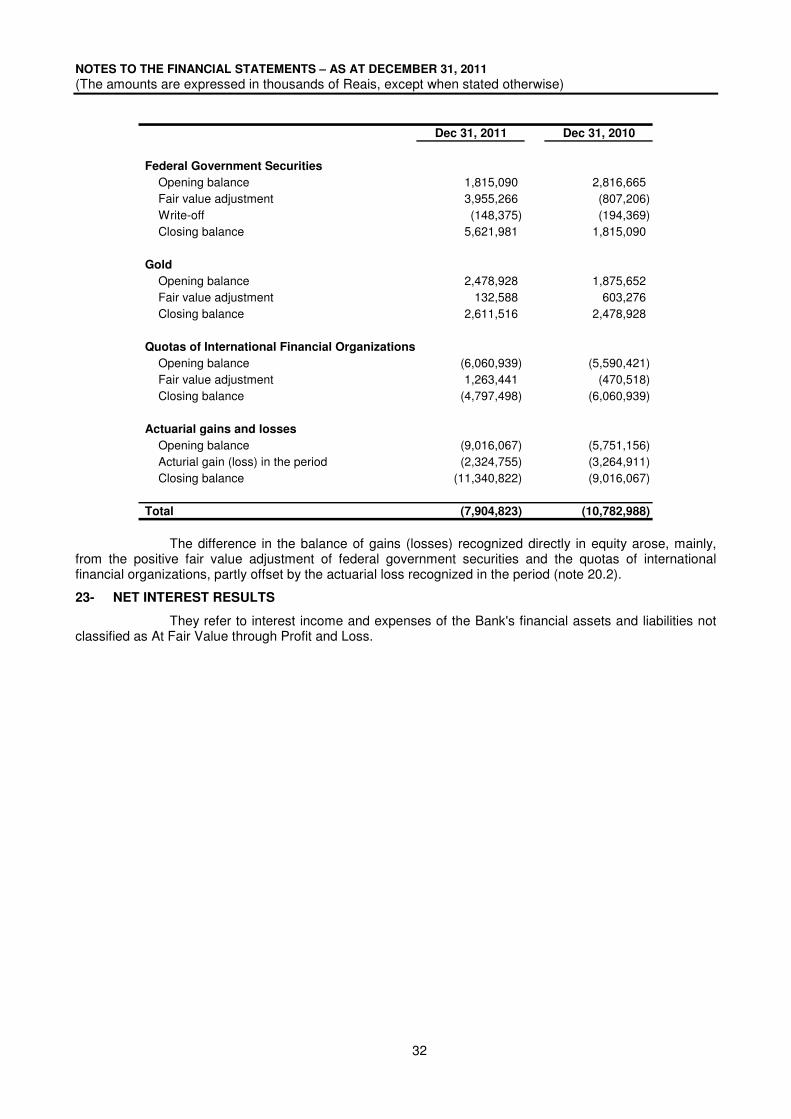
NOTES TO THE FINANCIAL STATEMENTS – AS AT DECEMBER 31, 2011
(The amounts are expressed in thousands of Reais, except when stated otherwise)
32
Dec 31, 2011 Dec 31, 2010
Federal Government Securities
Opening balance 1,815,090 2,816,665 Fair value adjustment 3,955,266 (807,206) Write-off (148,375) (194,369) Closing balance 5,621,981 1,815,090
Gold
Opening balance 2,478,928 1,875,652 Fair value adjustment 132,588 603,276 Closing balance 2,611,516 2,478,928
Quotas of International Financial Organizations
Opening balance (6,060,939) (5,590,421) Fair value adjustment 1,263,441 (470,518) Closing balance (4,797,498) (6,060,939)
Actuarial gains and losses
Opening balance (9,016,067) (5,751,156) Acturial gain (loss) in the period (2,324,755) (3,264,911) Closing balance (11,340,822) (9,016,067)
Total (7,904,823) (10,782,988)
The difference in the balance of gains (losses) recognized directly in equity arose, mainly, from the positive fair value adjustment of federal government securities and the quotas of international financial organizations, partly offset by the actuarial loss recognized in the period (note 20.2).
23- NET INTEREST RESULTS
They refer to interest income and expenses of the Bank's financial assets and liabilities not classified as At Fair Value through Profit and Loss.
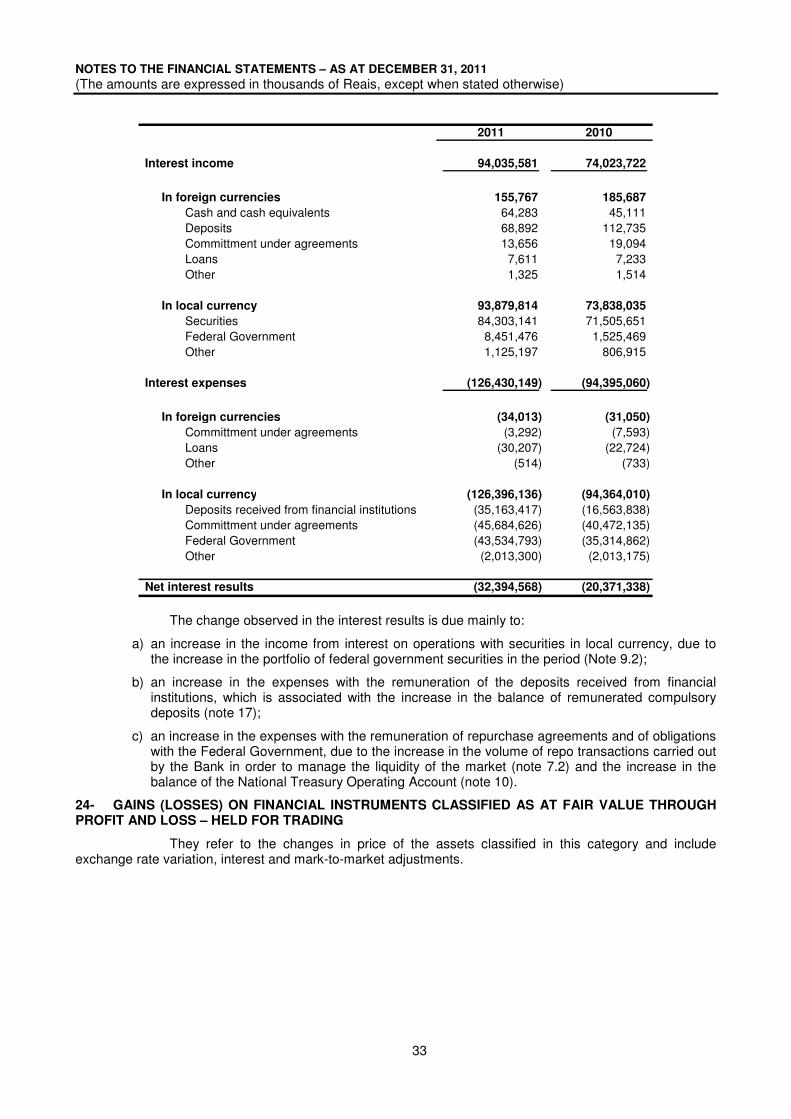
NOTES TO THE FINANCIAL STATEMENTS – AS AT DECEMBER 31, 2011
(The amounts are expressed in thousands of Reais, except when stated otherwise)
33
2011 2010
Interest income 94,035,581 74,023,722
In foreign currencies 155,767 185,687
Cash and cash equivalents 64,283 45,111 Deposits 68,892 112,735 Committment under agreements 13,656 19,094 Loans 7,611 7,233 Other 1,325 1,514
In local currency 93,879,814 73,838,035
Securities 84,303,141 71,505,651 Federal Government 8,451,476 1,525,469 Other 1,125,197 806,915
Interest expenses (126,430,149) (94,395,060)
In foreign currencies (34,013) (31,050)
Committment under agreements (3,292) (7,593) Loans (30,207) (22,724) Other (514) (733)
In local currency (126,396,136) (94,364,010)
Deposits received from financial institutions (35,163,417) (16,563,838) Committment under agreements (45,684,626) (40,472,135) Federal Government (43,534,793) (35,314,862) Other (2,013,300) (2,013,175)
Net interest results (32,394,568) (20,371,338)
The change observed in the interest results is due mainly to:
a) an increase in the income from interest on operations with securities in local currency, due to the increase in the portfolio of federal government securities in the period (Note 9.2);
b) an increase in the expenses with the remuneration of the deposits received from financial institutions, which is associated with the increase in the balance of remunerated compulsory deposits (note 17);
c) an increase in the expenses with the remuneration of repurchase agreements and of obligations with the Federal Government, due to the increase in the volume of repo transactions carried out by the Bank in order to manage the liquidity of the market (note 7.2) and the increase in the balance of the National Treasury Operating Account (note 10).
24- GAINS (LOSSES) ON FINANCIAL INSTRUMENTS CLASSIFIED AS AT FAIR VALUE THROUGH PROFIT AND LOSS – HELD FOR TRADING
They refer to the changes in price of the assets classified in this category and include exchange rate variation, interest and mark-to-market adjustments.
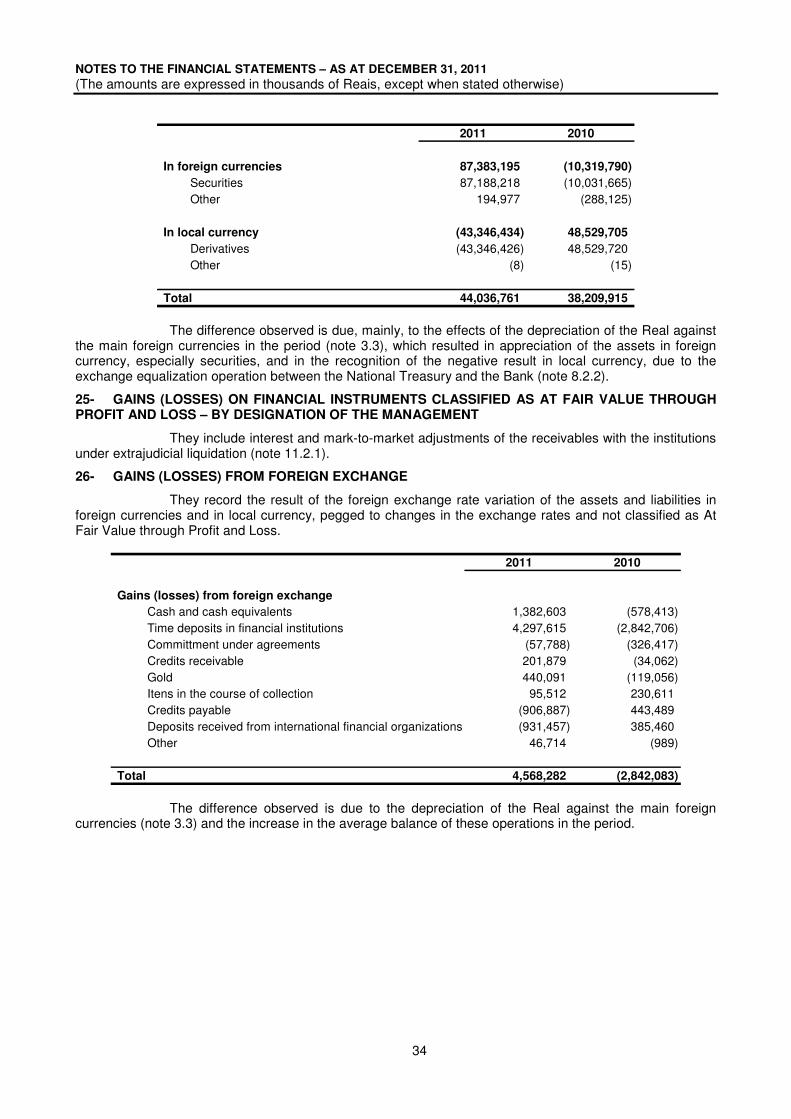
NOTES TO THE FINANCIAL STATEMENTS – AS AT DECEMBER 31, 2011
(The amounts are expressed in thousands of Reais, except when stated otherwise)
34
2011 2010
In foreign currencies 87,383,195 (10,319,790)
Securities 87,188,218 (10,031,665) Other 194,977 (288,125)
In local currency (43,346,434) 48,529,705
Derivatives (43,346,426) 48,529,720 Other (8) (15)
Total 44,036,761 38,209,915
The difference observed is due, mainly, to the effects of the depreciation of the Real against the main foreign currencies in the period (note 3.3), which resulted in appreciation of the assets in foreign currency, especially securities, and in the recognition of the negative result in local currency, due to the exchange equalization operation between the National Treasury and the Bank (note 8.2.2).
25- GAINS (LOSSES) ON FINANCIAL INSTRUMENTS CLASSIFIED AS AT FAIR VALUE THROUGH PROFIT AND LOSS – BY DESIGNATION OF THE MANAGEMENT
They include interest and mark-to-market adjustments of the receivables with the institutions under extrajudicial liquidation (note 11.2.1).
26- GAINS (LOSSES) FROM FOREIGN EXCHANGE
They record the result of the foreign exchange rate variation of the assets and liabilities in foreign currencies and in local currency, pegged to changes in the exchange rates and not classified as At Fair Value through Profit and Loss.
2011 2010
Gains (losses) from foreign exchange
Cash and cash equivalents 1,382,603 (578,413) Time deposits in financial institutions 4,297,615 (2,842,706) Committment under agreements (57,788) (326,417) Credits receivable 201,879 (34,062) Gold 440,091 (119,056) Itens in the course of collection 95,512 230,611 Credits payable (906,887) 443,489 Deposits received from international financial organizations (931,457) 385,460 Other 46,714 (989)
Total 4,568,282 (2,842,083)
The difference observed is due to the depreciation of the Real against the main foreign currencies (note 3.3) and the increase in the average balance of these operations in the period.

NOTES TO THE FINANCIAL STATEMENTS – AS AT DECEMBER 31, 2011
(The amounts are expressed in thousands of Reais, except when stated otherwise)
35
27- OTHER INCOME AND EXPENSES
2011 2010
Other income 3,515,923 1,922,129
Fines 92,066 104,206 Transfers under the budget law by the National Treasury 2,135,717 1,241,951 Court-ordered debts payables 396,454 52,266 Reversal of provision for legal claims 75,529 297,358 Fees 206,938 181,814 Surplus from Centrus (note 11.2.2.b) 532,458 - Other 76,761 44,534
Other expenses (3,259,653) (2,935,286)
Personnel (1,473,093) (1,563,814) Manufacturing and distribution of cash (914,063) (803,091) Provision for legal claims (604,867) (288,142) Depreciation (33,954) (35,515) Other administrative expenses (233,676) (244,724)
28- NET INCOME
28.1. Profit and loss for the period
The result of the period was positive in R$23,471,410 (R$15,729,970 in 2010) and resulted mainly from the net interest result on the operations in local currency and the mark-to-the market of the receivables from the institutions under extrajudicial liquidation, since the result on the international reserves and part of the funding cost of the liabilities, proportional to the amount of the reserves, were neutralized through the exchange equalization operation, as presented in the table below:
2011 2010
International Reserves Operations and Swaps - -
Profitability of the foreign exchange reserves 93,605,377 (13,282,563) Foreign exchange derivatives - Swaps in local currency 694,347 - Foreign exchange equalization of reserves and derivatives (Profitability) (94,299,724) 13,282,563
Other transactions in foreign currencies (1,532,147) 275,327
Transactions in local currency 24,747,295 16,467,814
Interest income 93,879,814 73,838,034 Interest expenses (126,396,136) (94,364,010) Foreign exchange equalization (Funding cost) 50,258,952 35,247,157 Mark-to-market - Institutions under liquidation 7,004,665 1,746,633
Other transactions in local currency 256,262 (1,013,171)
Net income for the period 23,471,410 15,729,970
The result for the first semester (R$12,230,706) was transferred to the National Treasury in August 2011 and the result for the second semester (R$11,240,704) will be transferred not later than the 10th working day after the approval of these financial statements by the CMN (note 1).
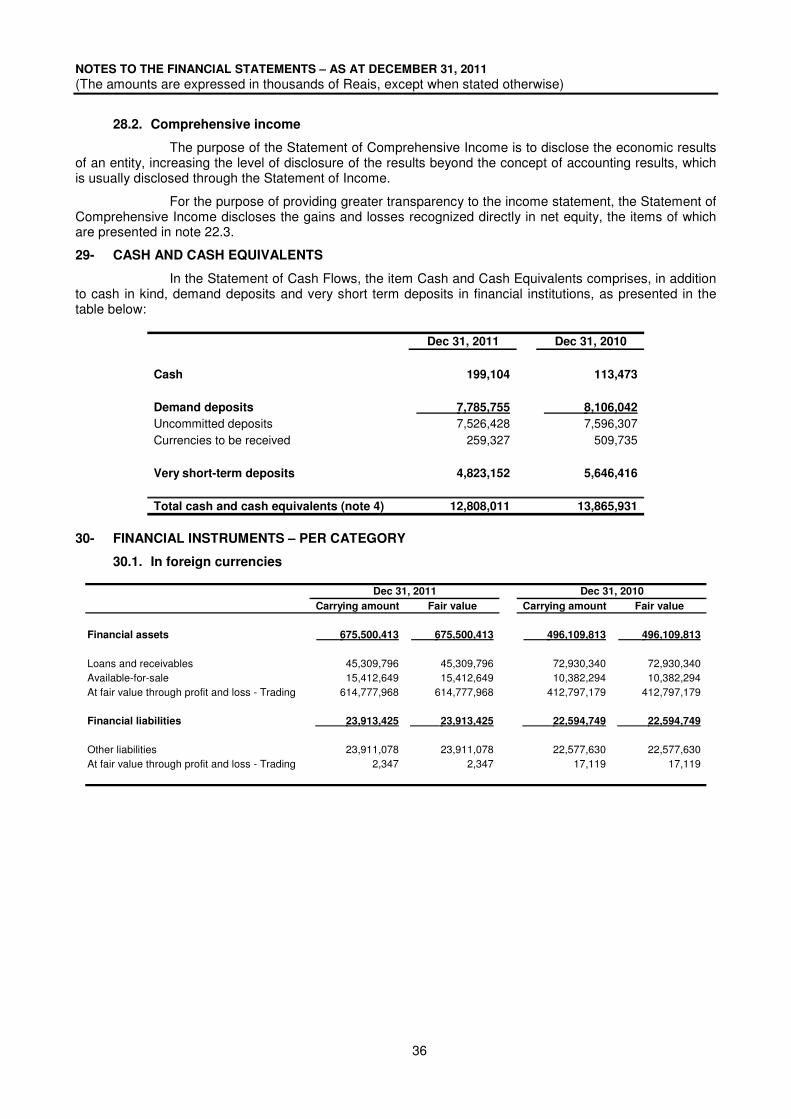
NOTES TO THE FINANCIAL STATEMENTS – AS AT DECEMBER 31, 2011
(The amounts are expressed in thousands of Reais, except when stated otherwise)
36
28.2. Comprehensive income
The purpose of the Statement of Comprehensive Income is to disclose the economic results of an entity, increasing the level of disclosure of the results beyond the concept of accounting results, which is usually disclosed through the Statement of Income.
For the purpose of providing greater transparency to the income statement, the Statement of Comprehensive Income discloses the gains and losses recognized directly in net equity, the items of which are presented in note 22.3.
29- CASH AND CASH EQUIVALENTS
In the Statement of Cash Flows, the item Cash and Cash Equivalents comprises, in addition to cash in kind, demand deposits and very short term deposits in financial institutions, as presented in the table below:
Dec 31, 2011 Dec 31, 2010
Cash 199,104 113,473
Demand deposits 7,785,755 8,106,042
Uncommitted deposits 7,526,428 7,596,307 Currencies to be received 259,327 509,735
Very short-term deposits 4,823,152 5,646,416
Total cash and cash equivalents (note 4) 12,808,011 13,865,931
30- FINANCIAL INSTRUMENTS – PER CATEGORY
30.1. In foreign currencies
Carrying amount Fair value Carrying amount Fair value
Financial assets 675,500,413 675,500,413 496,109,813 496,109,813
Loans and receivables 45,309,796 45,309,796 72,930,340 72,930,340 Available-for-sale 15,412,649 15,412,649 10,382,294 10,382,294 At fair value through profit and loss - Trading 614,777,968 614,777,968 412,797,179 412,797,179
Financial liabilities 23,913,425 23,913,425 22,594,749 22,594,749
Other liabilities 23,911,078 23,911,078 22,577,630 22,577,630 At fair value through profit and loss - Trading 2,347 2,347 17,119 17,119
Dec 31, 2011 Dec 31, 2010
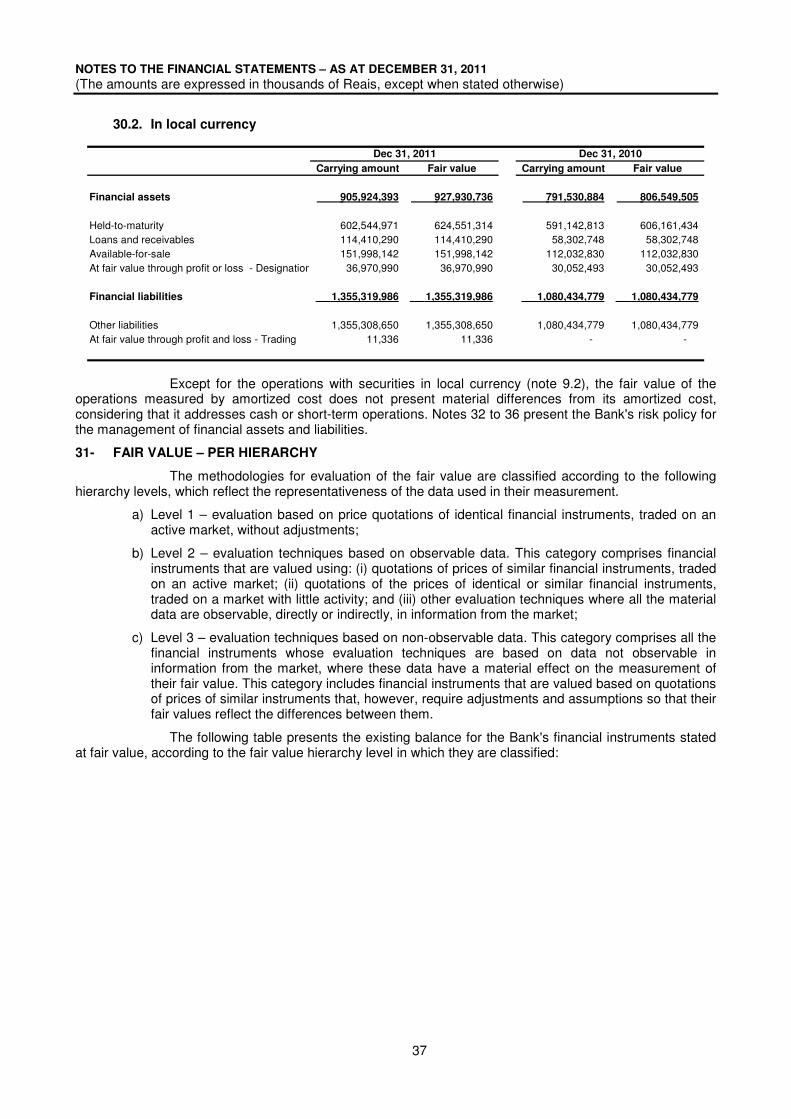
NOTES TO THE FINANCIAL STATEMENTS – AS AT DECEMBER 31, 2011
(The amounts are expressed in thousands of Reais, except when stated otherwise)
37
30.2. In local currency
Carrying amount Fair value Carrying amount Fair value
Financial assets 905,924,393 927,930,736 791,530,884 806,549,505
Held-to-maturity 602,544,971 624,551,314 591,142,813 606,161,434 Loans and receivables 114,410,290 114,410,290 58,302,748 58,302,748 Available-for-sale 151,998,142 151,998,142 112,032,830 112,032,830 At fair value through profit or loss - Designation 36,970,990 36,970,990 30,052,493 30,052,493
Financial liabilities 1,355,319,986 1,355,319,986 1,080,434,779 1,080,434,779
Other liabilities 1,355,308,650 1,355,308,650 1,080,434,779 1,080,434,779 At fair value through profit and loss - Trading 11,336 11,336 - -
Dec 31, 2011 Dec 31, 2010
Except for the operations with securities in local currency (note 9.2), the fair value of the operations measured by amortized cost does not present material differences from its amortized cost, considering that it addresses cash or short-term operations. Notes 32 to 36 present the Bank's risk policy for the management of financial assets and liabilities.
31- FAIR VALUE – PER HIERARCHY
The methodologies for evaluation of the fair value are classified according to the following hierarchy levels, which reflect the representativeness of the data used in their measurement.
a) Level 1 – evaluation based on price quotations of identical financial instruments, traded on an active market, without adjustments;
b) Level 2 – evaluation techniques based on observable data. This category comprises financial instruments that are valued using: (i) quotations of prices of similar financial instruments, traded on an active market; (ii) quotations of the prices of identical or similar financial instruments, traded on a market with little activity; and (iii) other evaluation techniques where all the material data are observable, directly or indirectly, in information from the market;
c) Level 3 – evaluation techniques based on non-observable data. This category comprises all the financial instruments whose evaluation techniques are based on data not observable in information from the market, where these data have a material effect on the measurement of their fair value. This category includes financial instruments that are valued based on quotations of prices of similar instruments that, however, require adjustments and assumptions so that their fair values reflect the differences between them.
The following table presents the existing balance for the Bank's financial instruments stated at fair value, according to the fair value hierarchy level in which they are classified:
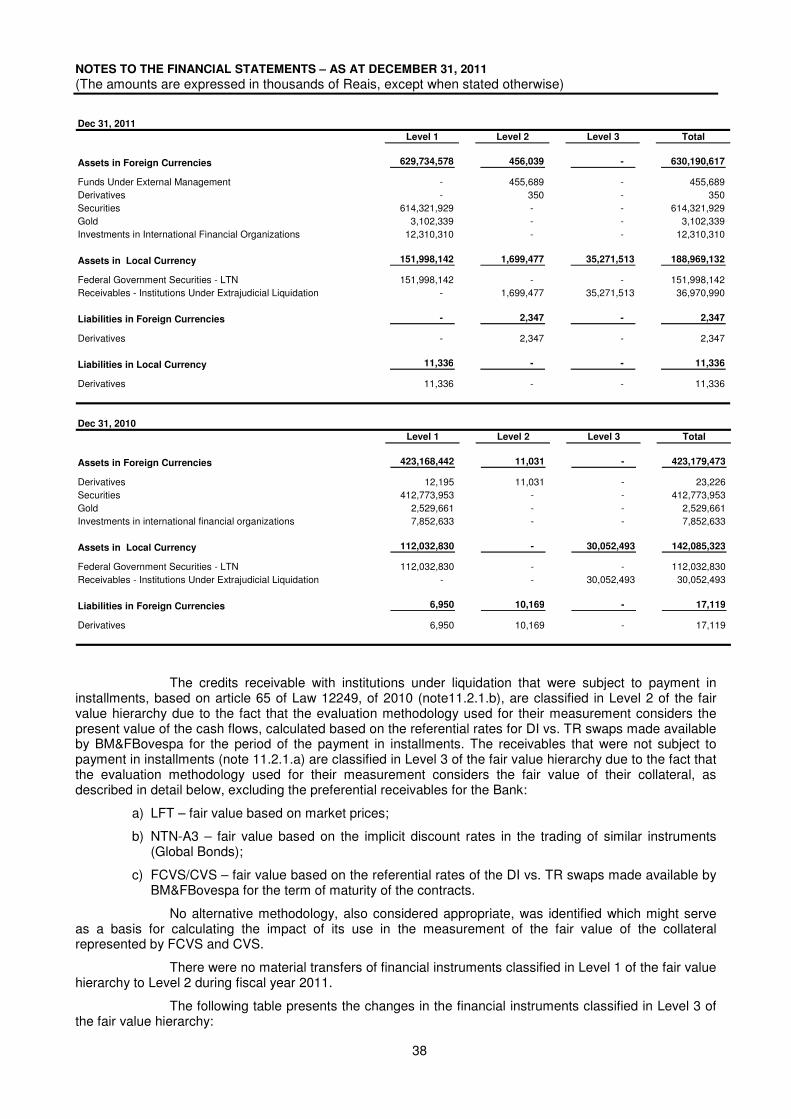
NOTES TO THE FINANCIAL STATEMENTS – AS AT DECEMBER 31, 2011
(The amounts are expressed in thousands of Reais, except when stated otherwise)
38
Dec 31, 2011
Level 1 Level 2 Level 3 Total
Assets in Foreign Currencies 629,734,578 456,039 - 630,190,617
Funds Under External Management - 455,689 - 455,689 Derivatives - 350 - 350 Securities 614,321,929 - - 614,321,929 Gold 3,102,339 - - 3,102,339 Investments in International Financial Organizations 12,310,310 - - 12,310,310
Assets in Local Currency 151,998,142 1,699,477 35,271,513 188,969,132
Federal Government Securities - LTN 151,998,142 - - 151,998,142 Receivables - Institutions Under Extrajudicial Liquidation - 1,699,477 35,271,513 36,970,990
Liabilities in Foreign Currencies - 2,347 - 2,347
Derivatives - 2,347 - 2,347
Liabilities in Local Currency 11,336 - - 11,336
Derivatives 11,336 - - 11,336
Dec 31, 2010
Level 1 Level 2 Level 3 Total
Assets in Foreign Currencies 423,168,442 11,031 - 423,179,473
Derivatives 12,195 11,031 - 23,226 Securities 412,773,953 - - 412,773,953 Gold 2,529,661 - - 2,529,661 Investments in international financial organizations 7,852,633 - - 7,852,633
Assets in Local Currency 112,032,830 - 30,052,493 142,085,323
Federal Government Securities - LTN 112,032,830 - - 112,032,830 Receivables - Institutions Under Extrajudicial Liquidation - - 30,052,493 30,052,493
Liabilities in Foreign Currencies 6,950 10,169 - 17,119
Derivatives 6,950 10,169 - 17,119
The credits receivable with institutions under liquidation that were subject to payment in installments, based on article 65 of Law 12249, of 2010 (note11.2.1.b), are classified in Level 2 of the fair value hierarchy due to the fact that the evaluation methodology used for their measurement considers the present value of the cash flows, calculated based on the referential rates for DI vs. TR swaps made available by BM&FBovespa for the period of the payment in installments. The receivables that were not subject to payment in installments (note 11.2.1.a) are classified in Level 3 of the fair value hierarchy due to the fact that the evaluation methodology used for their measurement considers the fair value of their collateral, as described in detail below, excluding the preferential receivables for the Bank:
a) LFT – fair value based on market prices;
b) NTN-A3 – fair value based on the implicit discount rates in the trading of similar instruments (Global Bonds);
c) FCVS/CVS – fair value based on the referential rates of the DI vs. TR swaps made available by BM&FBovespa for the term of maturity of the contracts.
No alternative methodology, also considered appropriate, was identified which might serve as a basis for calculating the impact of its use in the measurement of the fair value of the collateral represented by FCVS and CVS.
There were no material transfers of financial instruments classified in Level 1 of the fair value hierarchy to Level 2 during fiscal year 2011.
The following table presents the changes in the financial instruments classified in Level 3 of the fair value hierarchy:
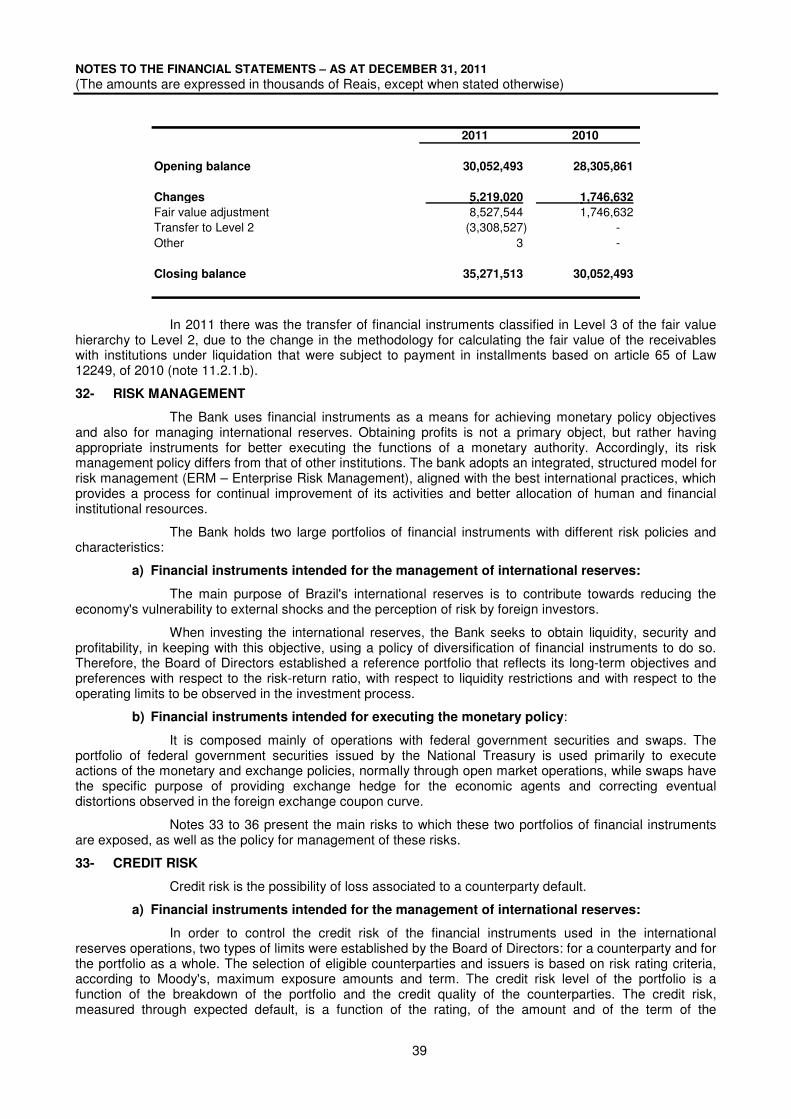
NOTES TO THE FINANCIAL STATEMENTS – AS AT DECEMBER 31, 2011
(The amounts are expressed in thousands of Reais, except when stated otherwise)
39
2011 2010
Opening balance 30,052,493 28,305,861
Changes 5,219,020 1,746,632
Fair value adjustment 8,527,544 1,746,632 Transfer to Level 2 (3,308,527) - Other 3 -
Closing balance 35,271,513 30,052,493
In 2011 there was the transfer of financial instruments classified in Level 3 of the fair value hierarchy to Level 2, due to the change in the methodology for calculating the fair value of the receivables with institutions under liquidation that were subject to payment in installments based on article 65 of Law 12249, of 2010 (note 11.2.1.b).
32- RISK MANAGEMENT
The Bank uses financial instruments as a means for achieving monetary policy objectives and also for managing international reserves. Obtaining profits is not a primary object, but rather having appropriate instruments for better executing the functions of a monetary authority. Accordingly, its risk management policy differs from that of other institutions. The bank adopts an integrated, structured model for risk management (ERM – Enterprise Risk Management), aligned with the best international practices, which provides a process for continual improvement of its activities and better allocation of human and financial institutional resources.
The Bank holds two large portfolios of financial instruments with different risk policies and characteristics:
a) Financial instruments intended for the management of international reserves:
The main purpose of Brazil's international reserves is to contribute towards reducing the economy's vulnerability to external shocks and the perception of risk by foreign investors.
When investing the international reserves, the Bank seeks to obtain liquidity, security and profitability, in keeping with this objective, using a policy of diversification of financial instruments to do so. Therefore, the Board of Directors established a reference portfolio that reflects its long-term objectives and preferences with respect to the risk-return ratio, with respect to liquidity restrictions and with respect to the operating limits to be observed in the investment process.
b) Financial instruments intended for executing the monetary policy:
It is composed mainly of operations with federal government securities and swaps. The portfolio of federal government securities issued by the National Treasury is used primarily to execute actions of the monetary and exchange policies, normally through open market operations, while swaps have the specific purpose of providing exchange hedge for the economic agents and correcting eventual distortions observed in the foreign exchange coupon curve.
Notes 33 to 36 present the main risks to which these two portfolios of financial instruments are exposed, as well as the policy for management of these risks.
33- CREDIT RISK
Credit risk is the possibility of loss associated to a counterparty default.
a) Financial instruments intended for the management of international reserves:
In order to control the credit risk of the financial instruments used in the international reserves operations, two types of limits were established by the Board of Directors: for a counterparty and for the portfolio as a whole. The selection of eligible counterparties and issuers is based on risk rating criteria, according to Moody's, maximum exposure amounts and term. The credit risk level of the portfolio is a function of the breakdown of the portfolio and the credit quality of the counterparties. The credit risk, measured through expected default, is a function of the rating, of the amount and of the term of the

NOTES TO THE FINANCIAL STATEMENTS – AS AT DECEMBER 31, 2011
(The amounts are expressed in thousands of Reais, except when stated otherwise)
40
investments. The main credit risk policies are listed below, and it worth noting that internal analyses of the credit conditions of the counterparties may generate further restrictions in addition to those listed:
a.1) Minimum ratings
Operations subject to bank credit risk, such as deposits, repos, reverse repos, swaps and forwards, should be contracted with counterparties belonging to groups with a short term rating of P-1 and a minimum long-term rating of Aa, except for repos and reverse repos, for which the carrying out of operations with counterparties belonging to groups with a minimum long-term rating equal to A is permitted.
In operations with securities, the Bank operates with sovereign securities, where the minimum admissible rating for the issuer is Aa, with securities issued by agencies and supranational organizations, whose minimum rating is Aaa, and with securities issued by the BIS.
a.2) Maximum amounts of exposure
The maximum exposure per group is equivalent to the lower amount between US$0.5 billion and 0.5% of the group's assets, for operations taken out with counterparties with a minimum long-term rating of Aa, and US$0.25 billion and 0.25% of the group's assets, for operations taken out with counterparties with a long-term rating of A.
Operations with bank credit risk whose counterparties are the BIS, the European Central Bank or central banks of countries with a long-term rating of Aaa have no exposure limits.
Funds invested in deposits in commercial banks have a volume limited to 1% of the international reserves to accommodate the operations required for daily cash flow management.
With respect to investments in securities, sovereign securities must represent at least 65% of the portfolio, where the securities of agencies may represent a maximum of 25% of the portfolio and the securities of supranational, multilateral organizations and of the BIS may represent a maximum of 25% of the portfolio. Furthermore, a limit is established of a 20% stake in each issuing of securities belonging to the reference portfolio and of 15% for the securities that are not part of this portfolio.
a.3) Maximum terms
The maximum term for operations with bank credit risk is six months, except for deposits. In this case, deposits with counterparties belonging to groups classified with a rating of Aa may be contracted for a maximum term of one working day and deposit operations with counterparties belonging to groups with a rating of Aaa may be contracted for a maximum term of one week.
Operations with bank credit risk whose counterparties are the BIS, the European Central Bank or central banks of countries with a long-term rating of Aaa shall respect the maximum term of six months for the investment.
b) Financial instruments intended for executing the monetary policy:
The Bank's securities portfolio is composed exclusively of securities issued by the National Treasury (note 9 .2), considered as without credit risk, which are used mainly for the carrying out of repo and reverse repo operations (note 7.2).
Swaps are contracted on BM&FBovespa, a clearing house which is the central counterparty of the operations. BM&FBovespa has a policy for control of the credit risk through collateral requirement from all the members.
The amount of these guarantees is calculated using stress tests, which consider the total possible loss until the date of the settlement of the contracts. The collaterals may be established in federal government securities, bank guarantees, bank deposit certificates, shares, gold or in money, amongst others. The majority of the members of the clearinghouse, including the Bank, establish the collaterals through the delivery of federal government securities, which are assessed at a defensive price, lower than the market quotation.

NOTES TO THE FINANCIAL STATEMENTS – AS AT DECEMBER 31, 2011
(The amounts are expressed in thousands of Reais, except when stated otherwise)
41
c) Concentration of financial assets per geographic area:
Dec 31, 2011 Dec 31, 2010
Brazil 907,381,538 793,180,973 European Economic Community 149,995,509 119,658,915 United States 453,702,133 329,481,025 Other 70,345,626 45,319,784
Total 1,581,424,806 1,287,640,697
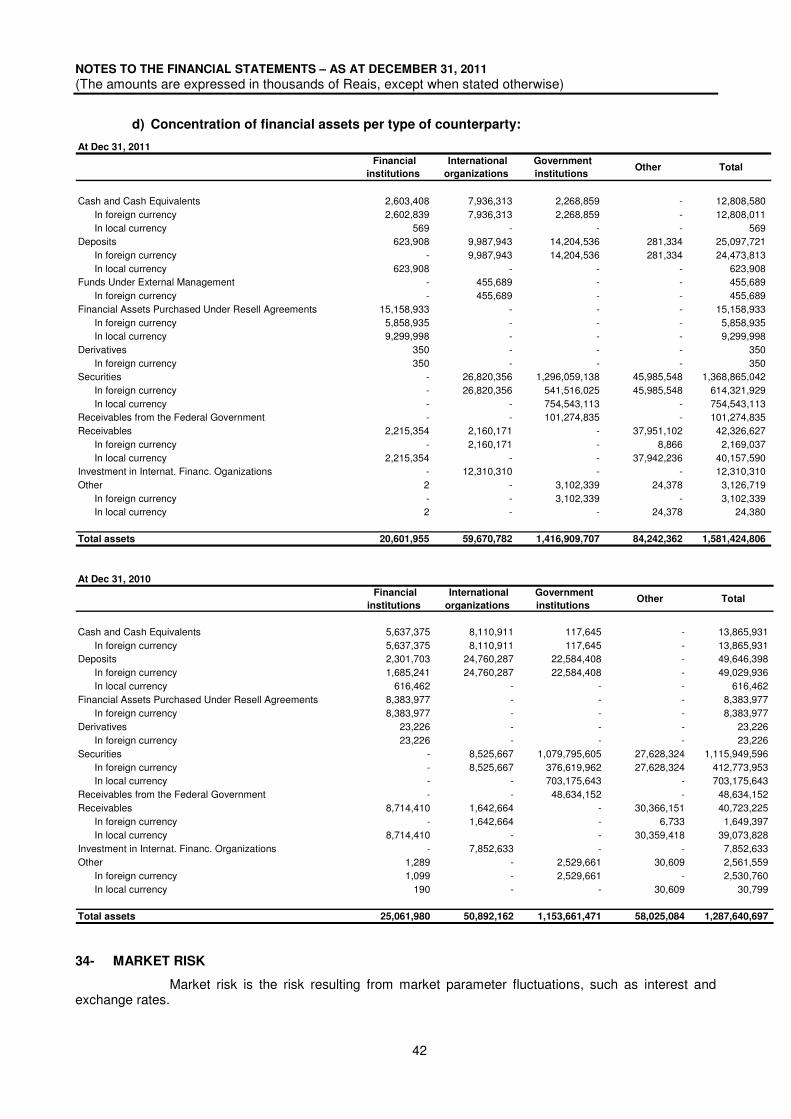
NOTES TO THE FINANCIAL STATEMENTS – AS AT DECEMBER 31, 2011
(The amounts are expressed in thousands of Reais, except when stated otherwise)
42
d) Concentration of financial assets per type of counterparty:
At Dec 31, 2011
Financial
institutions
International
organizations
Government
institutions Other Total
Cash and Cash Equivalents 2,603,408 7,936,313 2,268,859 - 12,808,580 In foreign currency 2,602,839 7,936,313 2,268,859 - 12,808,011 In local currency 569 - - - 569 Deposits 623,908 9,987,943 14,204,536 281,334 25,097,721 In foreign currency - 9,987,943 14,204,536 281,334 24,473,813 In local currency 623,908 - - - 623,908 Funds Under External Management - 455,689 - - 455,689 In foreign currency - 455,689 - - 455,689 Financial Assets Purchased Under Resell Agreements 15,158,933 - - - 15,158,933 In foreign currency 5,858,935 - - - 5,858,935 In local currency 9,299,998 - - - 9,299,998 Derivatives 350 - - - 350 In foreign currency 350 - - - 350 Securities - 26,820,356 1,296,059,138 45,985,548 1,368,865,042 In foreign currency - 26,820,356 541,516,025 45,985,548 614,321,929 In local currency - - 754,543,113 - 754,543,113 Receivables from the Federal Government - - 101,274,835 - 101,274,835 Receivables 2,215,354 2,160,171 - 37,951,102 42,326,627 In foreign currency - 2,160,171 - 8,866 2,169,037 In local currency 2,215,354 - - 37,942,236 40,157,590 Investment in Internat. Financ. Oganizations - 12,310,310 - - 12,310,310 Other 2 - 3,102,339 24,378 3,126,719 In foreign currency - - 3,102,339 - 3,102,339 In local currency 2 - - 24,378 24,380
Total assets 20,601,955 59,670,782 1,416,909,707 84,242,362 1,581,424,806
At Dec 31, 2010
Financial
institutions
International
organizations
Government
institutions Other Total
Cash and Cash Equivalents 5,637,375 8,110,911 117,645 - 13,865,931 In foreign currency 5,637,375 8,110,911 117,645 - 13,865,931 Deposits 2,301,703 24,760,287 22,584,408 - 49,646,398 In foreign currency 1,685,241 24,760,287 22,584,408 - 49,029,936 In local currency 616,462 - - - 616,462 Financial Assets Purchased Under Resell Agreements 8,383,977 - - - 8,383,977 In foreign currency 8,383,977 - - - 8,383,977 Derivatives 23,226 - - - 23,226 In foreign currency 23,226 - - - 23,226 Securities - 8,525,667 1,079,795,605 27,628,324 1,115,949,596 In foreign currency - 8,525,667 376,619,962 27,628,324 412,773,953 In local currency - - 703,175,643 - 703,175,643 Receivables from the Federal Government - - 48,634,152 - 48,634,152 Receivables 8,714,410 1,642,664 - 30,366,151 40,723,225 In foreign currency - 1,642,664 - 6,733 1,649,397 In local currency 8,714,410 - - 30,359,418 39,073,828 Investment in Internat. Financ. Organizations - 7,852,633 - - 7,852,633 Other 1,289 - 2,529,661 30,609 2,561,559 In foreign currency 1,099 - 2,529,661 - 2,530,760 In local currency 190 - - 30,609 30,799
Total assets 25,061,980 50,892,162 1,153,661,471 58,025,084 1,287,640,697
34- MARKET RISK
Market risk is the risk resulting from market parameter fluctuations, such as interest and exchange rates.
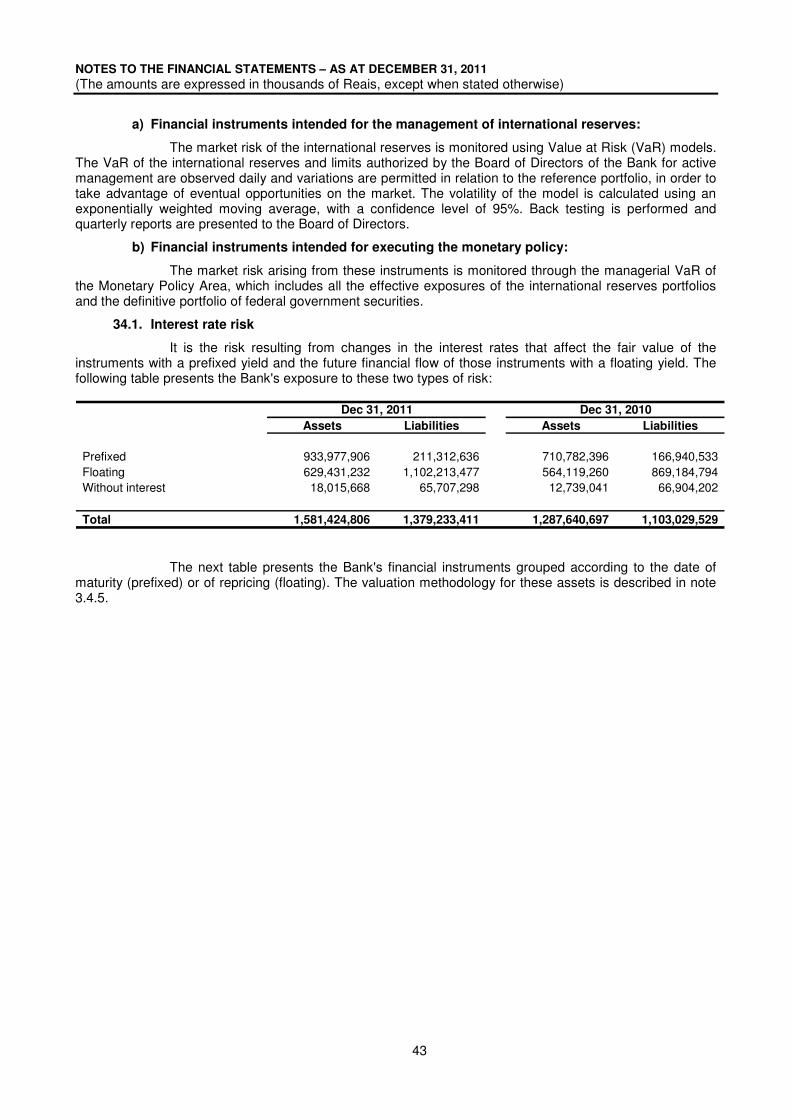
NOTES TO THE FINANCIAL STATEMENTS – AS AT DECEMBER 31, 2011
(The amounts are expressed in thousands of Reais, except when stated otherwise)
43
a) Financial instruments intended for the management of international reserves:
The market risk of the international reserves is monitored using Value at Risk (VaR) models. The VaR of the international reserves and limits authorized by the Board of Directors of the Bank for active management are observed daily and variations are permitted in relation to the reference portfolio, in order to take advantage of eventual opportunities on the market. The volatility of the model is calculated using an exponentially weighted moving average, with a confidence level of 95%. Back testing is performed and quarterly reports are presented to the Board of Directors.
b) Financial instruments intended for executing the monetary policy:
The market risk arising from these instruments is monitored through the managerial VaR of the Monetary Policy Area, which includes all the effective exposures of the international reserves portfolios and the definitive portfolio of federal government securities.
34.1. Interest rate risk
It is the risk resulting from changes in the interest rates that affect the fair value of the instruments with a prefixed yield and the future financial flow of those instruments with a floating yield. The following table presents the Bank's exposure to these two types of risk:
Assets Liabilities Assets Liabilities
Prefixed 933,977,906 211,312,636 710,782,396 166,940,533 Floating 629,431,232 1,102,213,477 564,119,260 869,184,794 Without interest 18,015,668 65,707,298 12,739,041 66,904,202
Total 1,581,424,806 1,379,233,411 1,287,640,697 1,103,029,529
Dec 31, 2011 Dec 31, 2010
The next table presents the Bank's financial instruments grouped according to the date of maturity (prefixed) or of repricing (floating). The valuation methodology for these assets is described in note 3.4.5.
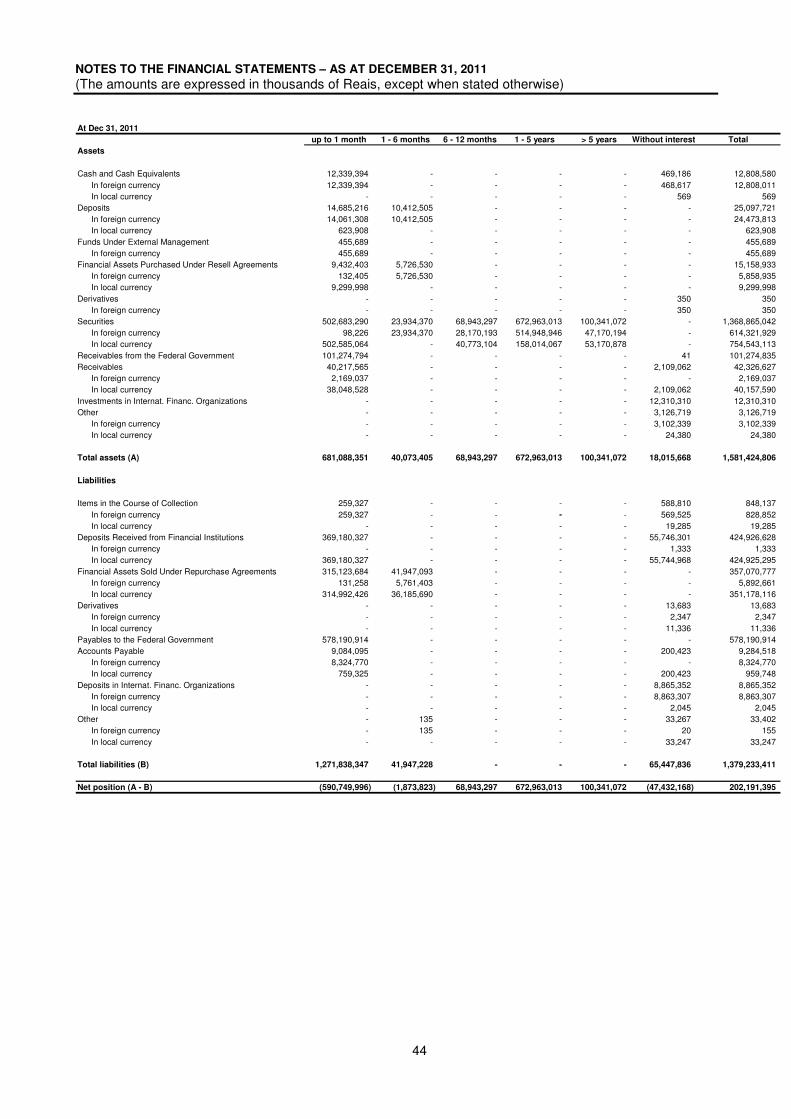
NOTES TO THE FINANCIAL STATEMENTS – AS AT DECEMBER 31, 2011
(The amounts are expressed in thousands of Reais, except when stated otherwise)
44
At Dec 31, 2011
up to 1 month 1 - 6 months 6 - 12 months 1 - 5 years > 5 years Without interest Total
Assets
Cash and Cash Equivalents 12,339,394 - - - - 469,186 12,808,580 In foreign currency 12,339,394 - - - - 468,617 12,808,011 In local currency - - - - - 569 569 Deposits 14,685,216 10,412,505 - - - - 25,097,721 In foreign currency 14,061,308 10,412,505 - - - - 24,473,813 In local currency 623,908 - - - - - 623,908 Funds Under External Management 455,689 - - - - - 455,689 In foreign currency 455,689 - - - - - 455,689 Financial Assets Purchased Under Resell Agreements 9,432,403 5,726,530 - - - - 15,158,933 In foreign currency 132,405 5,726,530 - - - - 5,858,935 In local currency 9,299,998 - - - - - 9,299,998 Derivatives - - - - - 350 350 In foreign currency - - - - - 350 350 Securities 502,683,290 23,934,370 68,943,297 672,963,013 100,341,072 - 1,368,865,042 In foreign currency 98,226 23,934,370 28,170,193 514,948,946 47,170,194 - 614,321,929 In local currency 502,585,064 - 40,773,104 158,014,067 53,170,878 - 754,543,113 Receivables from the Federal Government 101,274,794 - - - - 41 101,274,835 Receivables 40,217,565 - - - - 2,109,062 42,326,627 In foreign currency 2,169,037 - - - - - 2,169,037 In local currency 38,048,528 - - - - 2,109,062 40,157,590 Investments in Internat. Financ. Organizations - - - - - 12,310,310 12,310,310 Other - - - - - 3,126,719 3,126,719 In foreign currency - - - - - 3,102,339 3,102,339 In local currency - - - - - 24,380 24,380
Total assets (A) 681,088,351 40,073,405 68,943,297 672,963,013 100,341,072 18,015,668 1,581,424,806
Liabilities
Items in the Course of Collection 259,327 - - - - 588,810 848,137 In foreign currency 259,327 - - - - 569,525 828,852 In local currency - - - - - 19,285 19,285 Deposits Received from Financial Institutions 369,180,327 - - - - 55,746,301 424,926,628 In foreign currency - - - - - 1,333 1,333 In local currency 369,180,327 - - - - 55,744,968 424,925,295 Financial Assets Sold Under Repurchase Agreements 315,123,684 41,947,093 - - - - 357,070,777 In foreign currency 131,258 5,761,403 - - - - 5,892,661 In local currency 314,992,426 36,185,690 - - - - 351,178,116 Derivatives - - - - - 13,683 13,683 In foreign currency - - - - - 2,347 2,347 In local currency - - - - - 11,336 11,336 Payables to the Federal Government 578,190,914 - - - - - 578,190,914 Accounts Payable 9,084,095 - - - - 200,423 9,284,518 In foreign currency 8,324,770 - - - - - 8,324,770 In local currency 759,325 - - - - 200,423 959,748 Deposits in Internat. Financ. Organizations - - - - - 8,865,352 8,865,352 In foreign currency - - - - - 8,863,307 8,863,307 In local currency - - - - - 2,045 2,045 Other - 135 - - - 33,267 33,402 In foreign currency - 135 - - - 20 155 In local currency - - - - - 33,247 33,247
Total liabilities (B) 1,271,838,347 41,947,228 - - - 65,447,836 1,379,233,411
Net position (A - B) (590,749,996) (1,873,823) 68,943,297 672,963,013 100,341,072 (47,432,168) 202,191,395
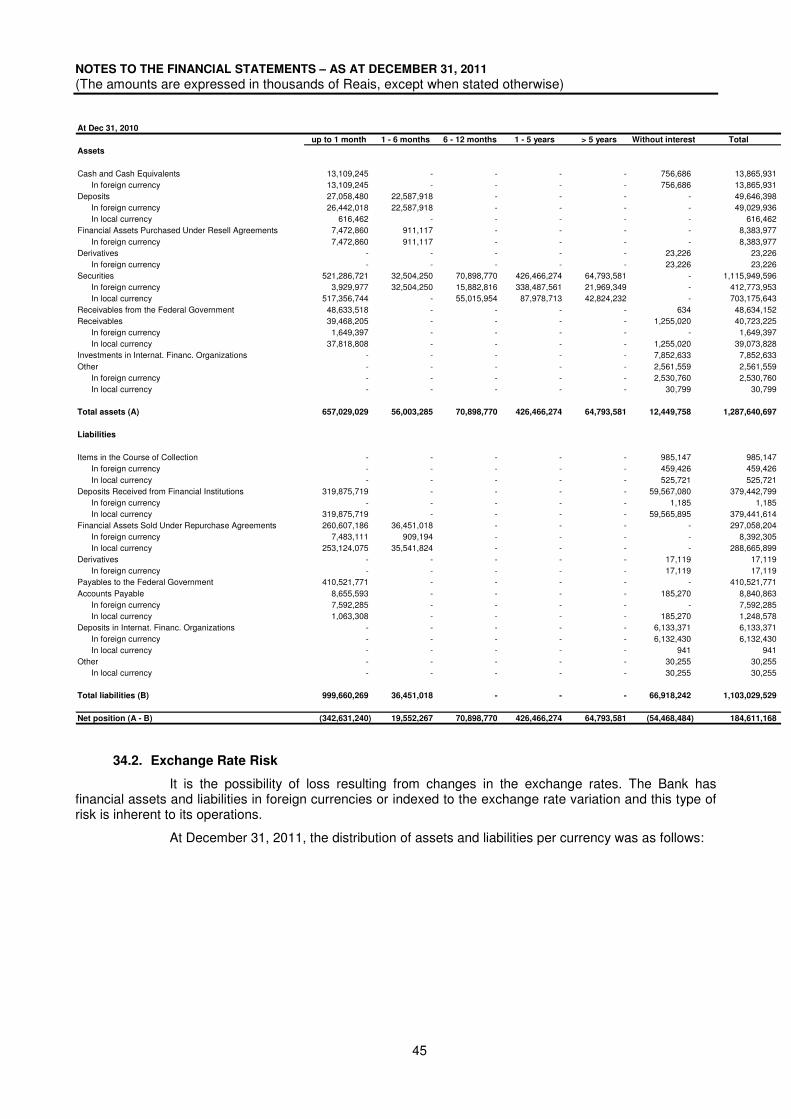
NOTES TO THE FINANCIAL STATEMENTS – AS AT DECEMBER 31, 2011
(The amounts are expressed in thousands of Reais, except when stated otherwise)
45
At Dec 31, 2010
up to 1 month 1 - 6 months 6 - 12 months 1 - 5 years > 5 years Without interest Total
Assets
Cash and Cash Equivalents 13,109,245 - - - - 756,686 13,865,931 In foreign currency 13,109,245 - - - - 756,686 13,865,931 Deposits 27,058,480 22,587,918 - - - - 49,646,398 In foreign currency 26,442,018 22,587,918 - - - - 49,029,936 In local currency 616,462 - - - - - 616,462 Financial Assets Purchased Under Resell Agreements 7,472,860 911,117 - - - - 8,383,977 In foreign currency 7,472,860 911,117 - - - - 8,383,977 Derivatives - - - - - 23,226 23,226 In foreign currency - - - - - 23,226 23,226 Securities 521,286,721 32,504,250 70,898,770 426,466,274 64,793,581 - 1,115,949,596 In foreign currency 3,929,977 32,504,250 15,882,816 338,487,561 21,969,349 - 412,773,953 In local currency 517,356,744 - 55,015,954 87,978,713 42,824,232 - 703,175,643 Receivables from the Federal Government 48,633,518 - - - - 634 48,634,152 Receivables 39,468,205 - - - - 1,255,020 40,723,225 In foreign currency 1,649,397 - - - - - 1,649,397 In local currency 37,818,808 - - - - 1,255,020 39,073,828 Investments in Internat. Financ. Organizations - - - - - 7,852,633 7,852,633 Other - - - - - 2,561,559 2,561,559 In foreign currency - - - - - 2,530,760 2,530,760 In local currency - - - - - 30,799 30,799
Total assets (A) 657,029,029 56,003,285 70,898,770 426,466,274 64,793,581 12,449,758 1,287,640,697
Liabilities
Items in the Course of Collection - - - - - 985,147 985,147 In foreign currency - - - - - 459,426 459,426 In local currency - - - - - 525,721 525,721 Deposits Received from Financial Institutions 319,875,719 - - - - 59,567,080 379,442,799 In foreign currency - - - - - 1,185 1,185 In local currency 319,875,719 - - - - 59,565,895 379,441,614 Financial Assets Sold Under Repurchase Agreements 260,607,186 36,451,018 - - - - 297,058,204 In foreign currency 7,483,111 909,194 - - - - 8,392,305 In local currency 253,124,075 35,541,824 - - - - 288,665,899 Derivatives - - - - - 17,119 17,119 In foreign currency - - - - - 17,119 17,119 Payables to the Federal Government 410,521,771 - - - - - 410,521,771 Accounts Payable 8,655,593 - - - - 185,270 8,840,863 In foreign currency 7,592,285 - - - - - 7,592,285 In local currency 1,063,308 - - - - 185,270 1,248,578 Deposits in Internat. Financ. Organizations - - - - - 6,133,371 6,133,371 In foreign currency - - - - - 6,132,430 6,132,430 In local currency - - - - - 941 941 Other - - - - - 30,255 30,255 In local currency - - - - - 30,255 30,255
Total liabilities (B) 999,660,269 36,451,018 - - - 66,918,242 1,103,029,529
Net position (A - B) (342,631,240) 19,552,267 70,898,770 426,466,274 64,793,581 (54,468,484) 184,611,168
34.2. Exchange Rate Risk
It is the possibility of loss resulting from changes in the exchange rates. The Bank has financial assets and liabilities in foreign currencies or indexed to the exchange rate variation and this type of risk is inherent to its operations.
At December 31, 2011, the distribution of assets and liabilities per currency was as follows:

NOTES TO THE FINANCIAL STATEMENTS – AS AT DECEMBER 31, 2011
(The amounts are expressed in thousands of Reais, except when stated otherwise)
46
At Dec 31, 2011
US Dollar Euro Canadian
Dollar
Pound
Sterling
Australian
Dollar
SDR Other Total
Assets
Cash and Cash Equivalents 4,013,440 544,756 272,728 185,447 288,942 7,464,878 37,820 12,808,011 Time Deposits Placed with Financial Institutions 22,699,602 608,415 - 1,165,796 - - - 24,473,813 Funds Under External Management 455,689 - - - - - - 455,689 Financial Assets Purchased Under Resell Agreements 5,506,318 135,554 8,278 - 157,670 - 51,115 5,858,935 Derivatives 350 - - - - - - 350 Securities 482,797,439 31,278,460 38,559,553 17,885,156 19,728,750 - 24,072,571 614,321,929 Receivables 8,866 - - - - 2,160,171 - 2,169,037 Investments in Internat. Financ. Organizations - - - - - 12,310,310 - 12,310,310 Other 3,102,339 - - - - - - 3,102,339 Total assets (A) 518,584,043 32,567,185 38,840,559 19,236,399 20,175,362 21,935,359 24,161,506 675,500,413
Liabilities
Items in the Course of Collection - 637,737 - - 191,115 - - 828,852 Deposits Received from Financial Institutions 1,333 - - - - - - 1,333 Financial Assets Sold Under Repurchase Agreements 358,044 54,416 - - 38,223 - 5,441,978 5,892,661 Derivatives 1,476 871 - - - - - 2,347 Accounts Payable 9,327 - - - - 8,315,443 - 8,324,770 Deposits in Internat. Financ. Organizations 78,877 - - - - 8,784,426 4 8,863,307 Other 155 - - - 155 Total liabilities (B) 449,212 693,024 - - 229,338 17,099,869 5,441,982 23,913,425
Net position (A - B) 518,134,831 31,874,161 38,840,559 19,236,399 19,946,024 4,835,490 18,719,524 651,586,988
At Dec 31, 2010
US Dollar Euro Canadian
Dollar
Pound
Sterling
Australian
Dollar
SDR Other Total
Assets
Cash and Cash Equivalents 4,645,016 575,724 335,550 144,546 705,142 7,417,534 42,419 13,865,931 Time Deposits Placed with Financial Institutions 46,826,199 - 659,317 1,544,420 - - - 49,029,936 Financial Assets Purchased Under Resell Agreements 7,872,133 18,453 216,970 - 211,594 - 64,827 8,383,977 Derivatives 7,880 3,757 57 3,776 6,063 - 1,693 23,226 Securities 333,250,223 20,765,783 27,223,755 11,075,059 14,226,685 - 6,232,448 412,773,953 Receivables 6,733 - - - - 1,642,664 - 1,649,397 Investment in Internat. Financ. Organizations - - - - - 7,852,633 - 7,852,633 Other 2,530,760 - - - - - - 2,530,760 Total assets (A) 395,138,944 21,363,717 28,435,649 12,767,801 15,149,484 16,912,831 6,341,387 496,109,813
Liabilities
Items in the course of collection - - - - 459,426 - - 459,426 Deposits Received from Financial Institutions 1,185 - - - - - - 1,185 Financial Assets Sold Under Repurchase Agreements 7,670,685 117,251 - 18,107 210,217 - 376,045 8,392,305 Derivatives 9,180 1,889 - - 5,108 - 942 17,119 Accounts Payable 181,260 - - - - 7,411,025 - 7,592,285 Deposits in Internat. Financ. Organizations 94,085 - - - - 6,038,328 17 6,132,430 Total liabilities (B) 7,956,395 119,140 - 18,107 674,751 13,449,353 377,004 22,594,750
Net position (A - B) 387,182,549 21,244,577 28,435,649 12,749,694 14,474,733 3,463,478 5,964,383 473,515,063
34.3. Foreign exchange equalization
The foreign exchange equalization operation (note 8.2.2) aims at providing greater transparency to the results of the operations of the monetary authority and at reducing the volatility of the Bank's result, resulting from the mismatch between foreign currency assets and liabilities, the volatility of which adversely affects the analysis, on the part of local and international economic agents, of the result of monetary policy operations, one of the main functions of the institution.
a) Equalization of the carrying cost of the reserves:
The Bank assumes an asset position in the funding cost of the reserves, represented by the funding rate of the total liabilities, in contrast to a liability position in exchange rate variance and interest of the international reserves. As a result the equalization operates as an exchange and interest rate hedge for the Bank, reducing the Bank's exposure in foreign currency and assuring coverage of the maintenance costs of the reserves.
The table below presents the Bank's net position in foreign currency, as at December 31, 2011, adjusted by the position assumed in the foreign exchange equalization:
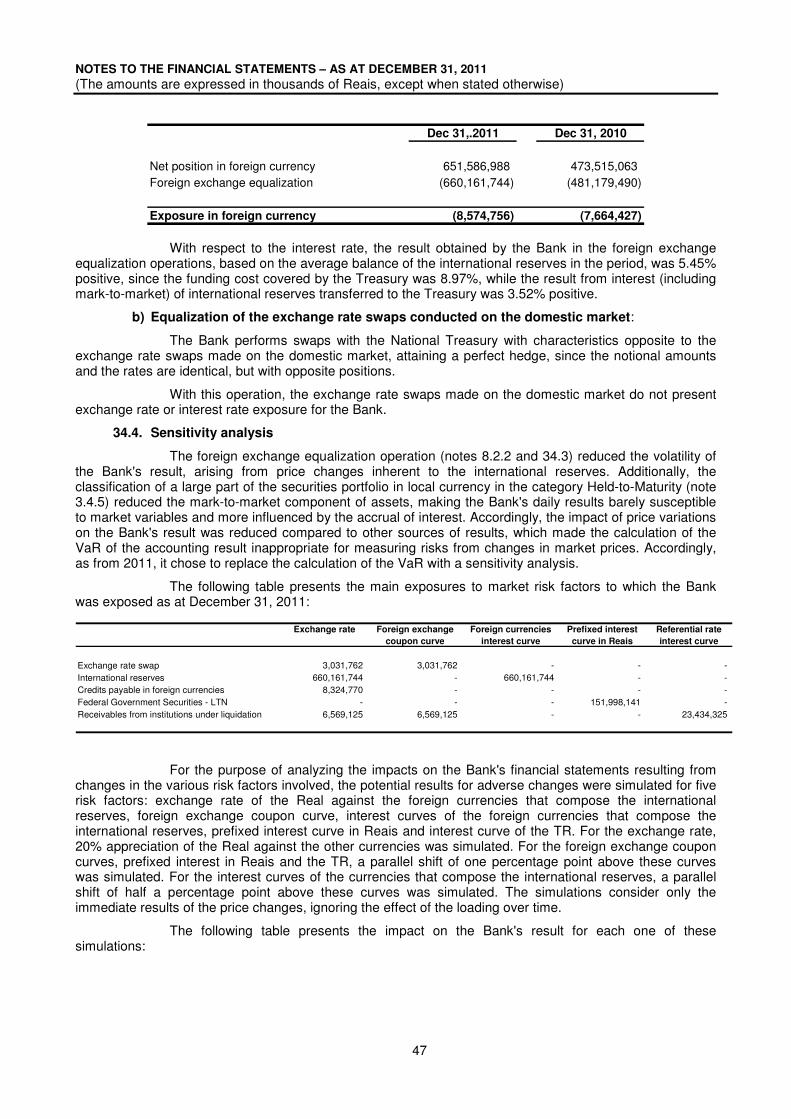
NOTES TO THE FINANCIAL STATEMENTS – AS AT DECEMBER 31, 2011
(The amounts are expressed in thousands of Reais, except when stated otherwise)
47
Dec 31,.2011 Dec 31, 2010
Net position in foreign currency 651,586,988 473,515,063 Foreign exchange equalization (660,161,744) (481,179,490)
Exposure in foreign currency (8,574,756) (7,664,427)
With respect to the interest rate, the result obtained by the Bank in the foreign exchange equalization operations, based on the average balance of the international reserves in the period, was 5.45% positive, since the funding cost covered by the Treasury was 8.97%, while the result from interest (including mark-to-market) of international reserves transferred to the Treasury was 3.52% positive.
b) Equalization of the exchange rate swaps conducted on the domestic market:
The Bank performs swaps with the National Treasury with characteristics opposite to the exchange rate swaps made on the domestic market, attaining a perfect hedge, since the notional amounts and the rates are identical, but with opposite positions.
With this operation, the exchange rate swaps made on the domestic market do not present exchange rate or interest rate exposure for the Bank.
34.4. Sensitivity analysis
The foreign exchange equalization operation (notes 8.2.2 and 34.3) reduced the volatility of the Bank's result, arising from price changes inherent to the international reserves. Additionally, the classification of a large part of the securities portfolio in local currency in the category Held-to-Maturity (note 3.4.5) reduced the mark-to-market component of assets, making the Bank's daily results barely susceptible to market variables and more influenced by the accrual of interest. Accordingly, the impact of price variations on the Bank's result was reduced compared to other sources of results, which made the calculation of the VaR of the accounting result inappropriate for measuring risks from changes in market prices. Accordingly, as from 2011, it chose to replace the calculation of the VaR with a sensitivity analysis.
The following table presents the main exposures to market risk factors to which the Bank was exposed as at December 31, 2011:
Exchange rate Foreign exchange
coupon curve
Foreign currencies
interest curve
Prefixed interest
curve in Reais
Referential rate
interest curve
Exchange rate swap 3,031,762 3,031,762 - - - International reserves 660,161,744 - 660,161,744 - - Credits payable in foreign currencies 8,324,770 - - - - Federal Government Securities - LTN - - - 151,998,141 - Receivables from institutions under liquidation 6,569,125 6,569,125 - - 23,434,325
For the purpose of analyzing the impacts on the Bank's financial statements resulting from changes in the various risk factors involved, the potential results for adverse changes were simulated for five risk factors: exchange rate of the Real against the foreign currencies that compose the international reserves, foreign exchange coupon curve, interest curves of the foreign currencies that compose the international reserves, prefixed interest curve in Reais and interest curve of the TR. For the exchange rate, 20% appreciation of the Real against the other currencies was simulated. For the foreign exchange coupon curves, prefixed interest in Reais and the TR, a parallel shift of one percentage point above these curves was simulated. For the interest curves of the currencies that compose the international reserves, a parallel shift of half a percentage point above these curves was simulated. The simulations consider only the immediate results of the price changes, ignoring the effect of the loading over time.
The following table presents the impact on the Bank's result for each one of these simulations:
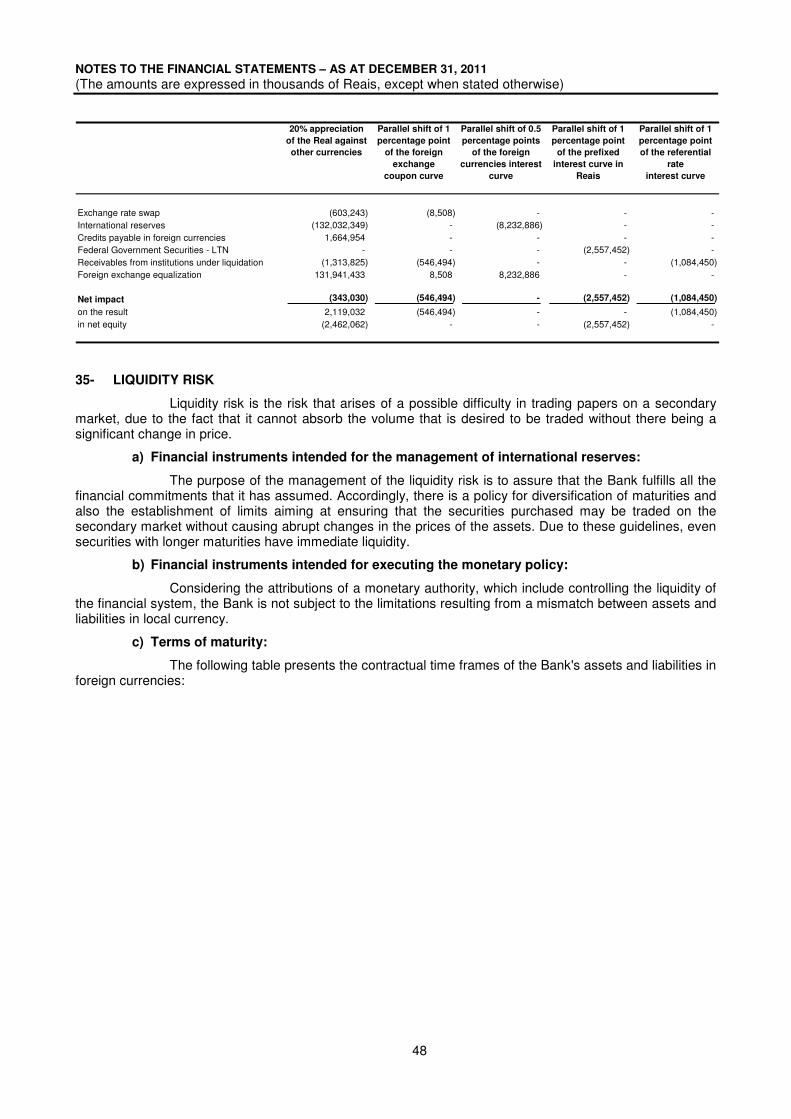
NOTES TO THE FINANCIAL STATEMENTS – AS AT DECEMBER 31, 2011
(The amounts are expressed in thousands of Reais, except when stated otherwise)
48
20% appreciation
of the Real against
other currencies
Parallel shift of 1
percentage point
of the foreign
exchange
coupon curve
Parallel shift of 0.5
percentage points
of the foreign
currencies interest
curve
Parallel shift of 1
percentage point
of the prefixed
interest curve in
Reais
Parallel shift of 1
percentage point
of the referential
rate
interest curve
Exchange rate swap (603,243) (8,508) - - - International reserves (132,032,349) - (8,232,886) - - Credits payable in foreign currencies 1,664,954 - - - - Federal Government Securities - LTN - - - (2,557,452) - Receivables from institutions under liquidation (1,313,825) (546,494) - - (1,084,450) Foreign exchange equalization 131,941,433 8,508 8,232,886 - -
Net impact (343,030) (546,494) - (2,557,452) (1,084,450)
on the result 2,119,032 (546,494) - - (1,084,450) in net equity (2,462,062) - - (2,557,452) -
35- LIQUIDITY RISK
Liquidity risk is the risk that arises of a possible difficulty in trading papers on a secondary market, due to the fact that it cannot absorb the volume that is desired to be traded without there being a significant change in price.
a) Financial instruments intended for the management of international reserves:
The purpose of the management of the liquidity risk is to assure that the Bank fulfills all the financial commitments that it has assumed. Accordingly, there is a policy for diversification of maturities and also the establishment of limits aiming at ensuring that the securities purchased may be traded on the secondary market without causing abrupt changes in the prices of the assets. Due to these guidelines, even securities with longer maturities have immediate liquidity.
b) Financial instruments intended for executing the monetary policy:
Considering the attributions of a monetary authority, which include controlling the liquidity of the financial system, the Bank is not subject to the limitations resulting from a mismatch between assets and liabilities in local currency.
c) Terms of maturity:
The following table presents the contractual time frames of the Bank's assets and liabilities in foreign currencies:
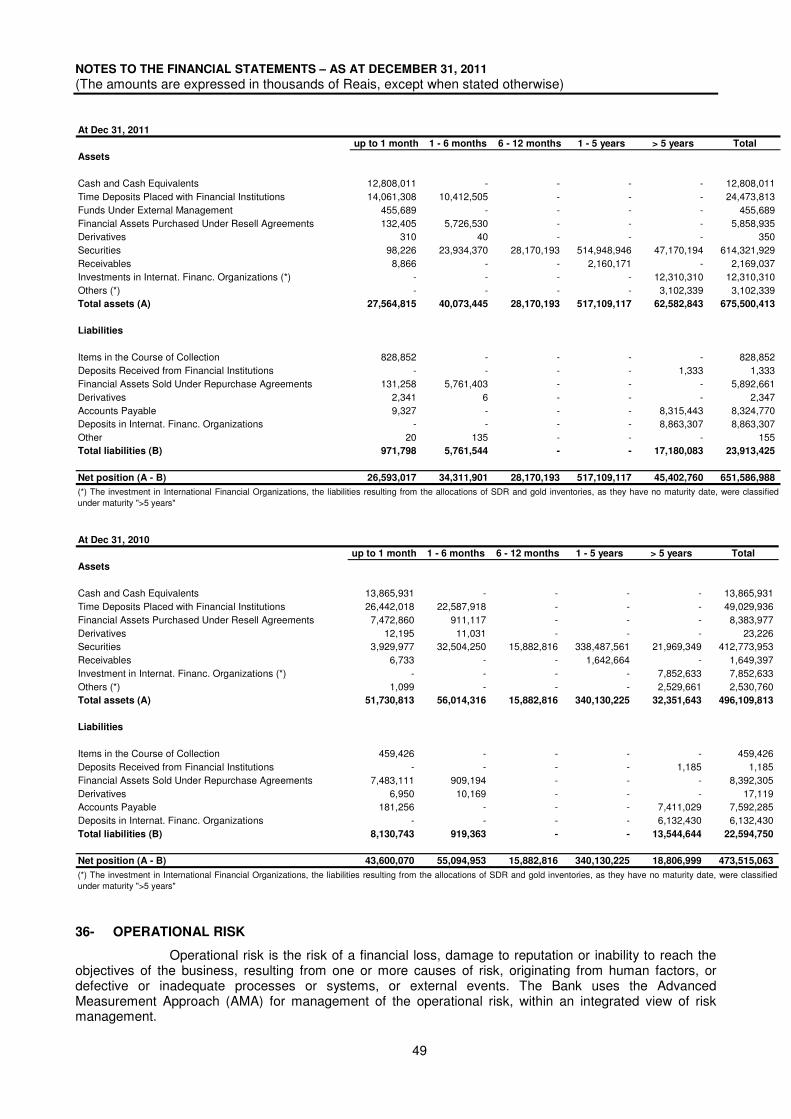
NOTES TO THE FINANCIAL STATEMENTS – AS AT DECEMBER 31, 2011
(The amounts are expressed in thousands of Reais, except when stated otherwise)
49
At Dec 31, 2011
up to 1 month 1 - 6 months 6 - 12 months 1 - 5 years > 5 years Total
Assets
Cash and Cash Equivalents 12,808,011 - - - - 12,808,011 Time Deposits Placed with Financial Institutions 14,061,308 10,412,505 - - - 24,473,813 Funds Under External Management 455,689 - - - - 455,689 Financial Assets Purchased Under Resell Agreements 132,405 5,726,530 - - - 5,858,935 Derivatives 310 40 - - - 350 Securities 98,226 23,934,370 28,170,193 514,948,946 47,170,194 614,321,929 Receivables 8,866 - - 2,160,171 - 2,169,037 Investments in Internat. Financ. Organizations (*) - - - - 12,310,310 12,310,310 Others (*) - - - - 3,102,339 3,102,339 Total assets (A) 27,564,815 40,073,445 28,170,193 517,109,117 62,582,843 675,500,413
Liabilities
Items in the Course of Collection 828,852 - - - - 828,852 Deposits Received from Financial Institutions - - - - 1,333 1,333 Financial Assets Sold Under Repurchase Agreements 131,258 5,761,403 - - - 5,892,661 Derivatives 2,341 6 - - - 2,347 Accounts Payable 9,327 - - - 8,315,443 8,324,770 Deposits in Internat. Financ. Organizations - - - - 8,863,307 8,863,307 Other 20 135 - - - 155 Total liabilities (B) 971,798 5,761,544 - - 17,180,083 23,913,425
Net position (A - B) 26,593,017 34,311,901 28,170,193 517,109,117 45,402,760 651,586,988
(*) The investment in International Financial Organizations, the liabilities resulting from the allocations of SDR and gold inventories, as they have no maturity date, were classifiedunder maturity ">5 years"
At Dec 31, 2010
up to 1 month 1 - 6 months 6 - 12 months 1 - 5 years > 5 years Total
Assets
Cash and Cash Equivalents 13,865,931 - - - - 13,865,931 Time Deposits Placed with Financial Institutions 26,442,018 22,587,918 - - - 49,029,936 Financial Assets Purchased Under Resell Agreements 7,472,860 911,117 - - - 8,383,977 Derivatives 12,195 11,031 - - - 23,226 Securities 3,929,977 32,504,250 15,882,816 338,487,561 21,969,349 412,773,953 Receivables 6,733 - - 1,642,664 - 1,649,397 Investment in Internat. Financ. Organizations (*) - - - - 7,852,633 7,852,633 Others (*) 1,099 - - - 2,529,661 2,530,760 Total assets (A) 51,730,813 56,014,316 15,882,816 340,130,225 32,351,643 496,109,813
Liabilities
Items in the Course of Collection 459,426 - - - - 459,426 Deposits Received from Financial Institutions - - - - 1,185 1,185 Financial Assets Sold Under Repurchase Agreements 7,483,111 909,194 - - - 8,392,305 Derivatives 6,950 10,169 - - - 17,119 Accounts Payable 181,256 - - - 7,411,029 7,592,285 Deposits in Internat. Financ. Organizations - - - - 6,132,430 6,132,430 Total liabilities (B) 8,130,743 919,363 - - 13,544,644 22,594,750
Net position (A - B) 43,600,070 55,094,953 15,882,816 340,130,225 18,806,999 473,515,063
(*) The investment in International Financial Organizations, the liabilities resulting from the allocations of SDR and gold inventories, as they have no maturity date, were classifiedunder maturity ">5 years"
36- OPERATIONAL RISK
Operational risk is the risk of a financial loss, damage to reputation or inability to reach the objectives of the business, resulting from one or more causes of risk, originating from human factors, or defective or inadequate processes or systems, or external events. The Bank uses the Advanced Measurement Approach (AMA) for management of the operational risk, within an integrated view of risk management.
NOTES TO THE FINANCIAL STATEMENTS – AS AT DECEMBER 31, 2011
(The amounts are expressed in thousands of Reais, except when stated otherwise)
50
For preventing and controlling the operational risk, the Bank has internal control systems in accordance with the characteristics of its activities, in addition to regulations that establish the competencies of each department and the attributions of their managers (Internal Rules and Manual of Administrative Organization) and it also has norms that define the criteria and procedures for all the Institution's activities.
Compliance with these regulations and observance of the internal control systems is monitored by the Bank's Internal Audit, which is responsible for ensuring the strict observance of these actions.
Additionally, each semester, the Institution's heads of department attest to the consistency of the internal controls referring to the operations under their responsibility, which permits the Director of Administration and the Head of the Department of Accounting and Financial Execution to sign, on behalf of the Institution, a declaration of responsibility on their internal controls to the independent audit firm.
37- RELATED PARTY TRANSACTIONS
In accordance with IAS 24 – Related Party Disclosures, the following institutions are defined as related parties:
37.1. Federal Government
The Bank is an autonomous federal government agency linked to the Ministry of Finance (MF) and a member of National Financial System (SFN) and, as such, is subject to the guidelines of the CMN, the highest deliberative body of the National Financial System. The CMN is responsible for establishing the general guidelines of the monetary, foreign exchange and credit policies, for regulating the functioning and supervision of the financial institutions and disciplining the instruments for monetary and foreign exchange policy, as well as approving the Bank's financial statements and accounting system.
The Bank's Governor and Directors do not have a fixed term mandate and are appointed by the President of the Republic and approved by the Federal Senate.
The Bank's budget for maintenance expenses is approved by the National Congress and its financial execution must observe the limits established by the Executive Power.
All the operations between the Bank and the National Treasury are governed by constitutional and legal provisions, where the main provisions are listed below. Operations with other entities related to the Federal Government are carried out under market conditions and in the course of normal day to day transactions and, therefore, are not considered within the context of this note.
a) Deposits to the Order of the Federal Government:
The financial resources of the federal government are deposited in the Bank (National Treasury Operating Account), have free account activity and are remunerated by the average yield of the federal government securities that exist in the Bank's portfolio (note 10), excluding the result from mark-to-market. In 2011 the yield was 12.55% (11.44% in 2010).
b) The Bank's results:
A positive result posted by the Bank, after the formation or reversal of reserves, creates an obligation by the Bank to the Federal Government, which must be transferred not later than the 10th working day after the approval of the financial statements by the CMN. If it is negative, this result creates a credit for the Bank against the Federal Government, which must be paid not later than the 10th working day of the year subsequent to the approval of the financial statements. In both situations, these amounts must be adjusted by the same indexes applied to the account Deposits to the Order of the Federal Government, until the date of the actual transfer or payment (notes 10 and 40.a).
c) Foreign exchange equalization:
Through the foreign exchange equalization operation (note 8.2.2 and 34.3), the carrying cost of the international reserves and the result of the exchange rate swaps carried out on the domestic market are transferred to the Federal Government, through the National Treasury. These amounts are calculated daily and the balance payable or receivable is calculated on the last day of the semester, and will be settled financially according to the same rules established for the transfer or coverage of the results, inclusively with respect to their adjustment (notes 10 and 40.a).
NOTES TO THE FINANCIAL STATEMENTS – AS AT DECEMBER 31, 2011
(The amounts are expressed in thousands of Reais, except when stated otherwise)
51
d) Transfer from the National Treasury:
The Bank uses funds transferred by the Federal Government for the payment of part of its administrative expenses.
e) Payment of lawsuits:
The payments resulting from res judicata legal decisions in which the Federal Government and its autonomous agencies have been sentenced, have been made by competent courts, which are responsible for requesting budgetary and financial authorization (notes 18.2 and 20.1). In 2011 court-ordered debts were paid in the amount of R$396,454, referring to lawsuits where the Bank was sentenced.
f) Use of securities as a monetary policy instrument:
The Bank uses securities issued by the National Treasury to carry out its monetary policy. All the purchases and sales of securities that take place between the Bank and the National Treasury are performed at market price.
g) Providing of services for the placement of securities:
The Bank provides services for the placement of government securities on the financial market, leaving, however, the definition of characteristics, price and term of the papers placed to the National Treasury. Fees are not charged for providing this service.
h) Fundo Soberano do Brasil:
The Fundo Soberano do Brasil (FSB), created by Law 11887, of December 24, 2008, is a special fund of an accounting and financial nature linked to the MF for the purpose of: (i) encouraging investments in assets in Brazil and abroad; (ii) forming public savings; (iii) mitigating the effects of economic cycles; and (iv) encouraging projects of strategic interest for Brazil located abroad. The form, term and nature of the investments of the FSB are approved by the Deliberative Council of the FSB (CDFSB), which comprises the State Minister of Finance, State Minister of Planning, Budget and Management, and the Governor of the Bank. Pursuant to Resolution 2, of September 17, 2010, of the CDFSB, the National Treasury was authorized to invest the fund's resources in the purchase and sale of foreign currencies or in carrying out other foreign exchange operations, including derivative contracts, through an agreement to be entered into with the Bank. However, up till December 31, 2011 no agreement had been entered into between the National Treasury and the Bank for this purpose.
The following table presents the main transactions that took place between the Bank and the Federal Government in the period.
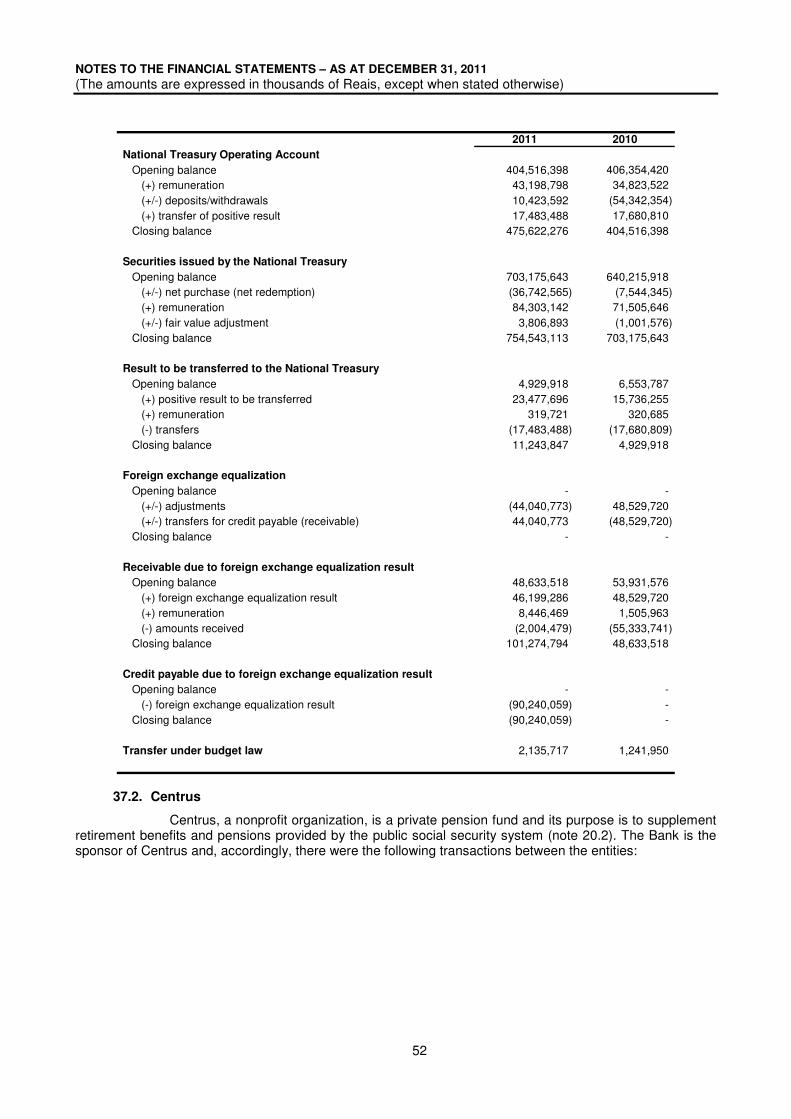
NOTES TO THE FINANCIAL STATEMENTS – AS AT DECEMBER 31, 2011
(The amounts are expressed in thousands of Reais, except when stated otherwise)
52
2011 2010
National Treasury Operating Account
Opening balance 404,516,398 406,354,420 (+) remuneration 43,198,798 34,823,522 (+/-) deposits/withdrawals 10,423,592 (54,342,354) (+) transfer of positive result 17,483,488 17,680,810 Closing balance 475,622,276 404,516,398
Securities issued by the National Treasury
Opening balance 703,175,643 640,215,918 (+/-) net purchase (net redemption) (36,742,565) (7,544,345) (+) remuneration 84,303,142 71,505,646 (+/-) fair value adjustment 3,806,893 (1,001,576) Closing balance 754,543,113 703,175,643
Result to be transferred to the National Treasury
Opening balance 4,929,918 6,553,787 (+) positive result to be transferred 23,477,696 15,736,255 (+) remuneration 319,721 320,685 (-) transfers (17,483,488) (17,680,809) Closing balance 11,243,847 4,929,918
Foreign exchange equalization
Opening balance - - (+/-) adjustments (44,040,773) 48,529,720 (+/-) transfers for credit payable (receivable) 44,040,773 (48,529,720) Closing balance - -
Receivable due to foreign exchange equalization result
Opening balance 48,633,518 53,931,576 (+) foreign exchange equalization result 46,199,286 48,529,720 (+) remuneration 8,446,469 1,505,963 (-) amounts received (2,004,479) (55,333,741) Closing balance 101,274,794 48,633,518
Credit payable due to foreign exchange equalization result
Opening balance - - (-) foreign exchange equalization result (90,240,059) - Closing balance (90,240,059) -
Transfer under budget law 2,135,717 1,241,950
37.2. Centrus
Centrus, a nonprofit organization, is a private pension fund and its purpose is to supplement retirement benefits and pensions provided by the public social security system (note 20.2). The Bank is the sponsor of Centrus and, accordingly, there were the following transactions between the entities:
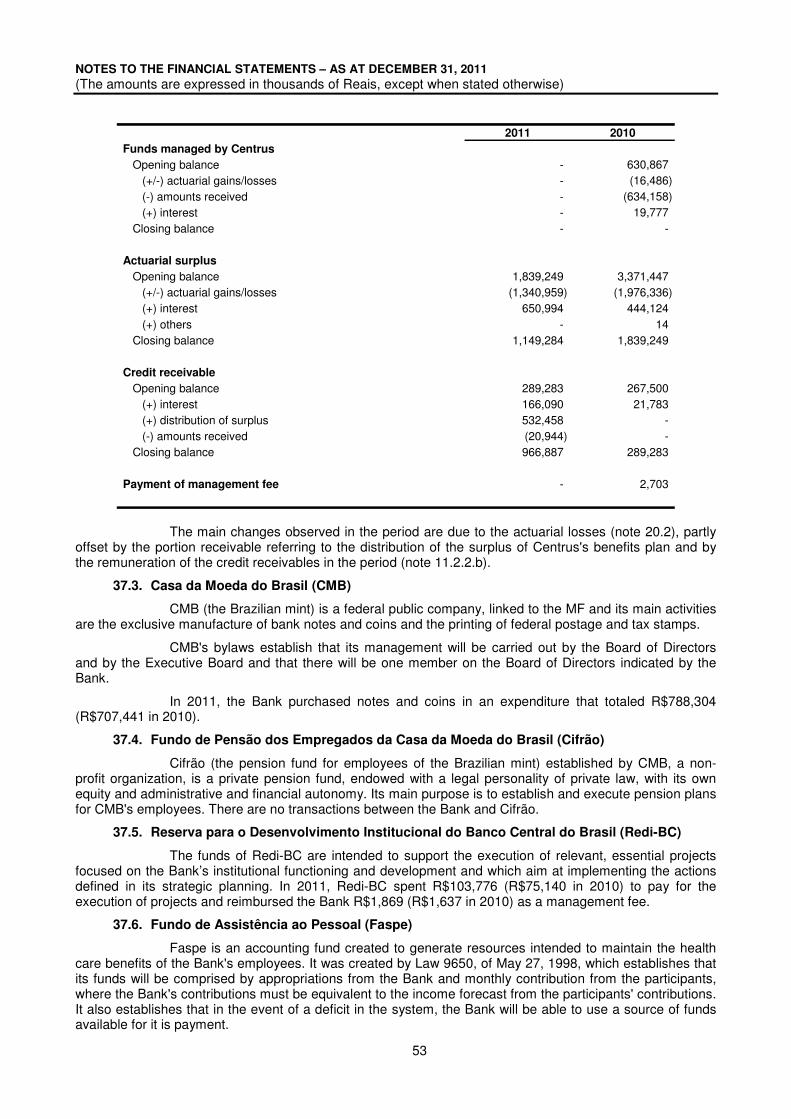
NOTES TO THE FINANCIAL STATEMENTS – AS AT DECEMBER 31, 2011
(The amounts are expressed in thousands of Reais, except when stated otherwise)
53
2011 2010
Funds managed by Centrus
Opening balance - 630,867 (+/-) actuarial gains/losses - (16,486) (-) amounts received - (634,158) (+) interest - 19,777 Closing balance - -
Actuarial surplus
Opening balance 1,839,249 3,371,447 (+/-) actuarial gains/losses (1,340,959) (1,976,336) (+) interest 650,994 444,124 (+) others - 14 Closing balance 1,149,284 1,839,249
Credit receivable
Opening balance 289,283 267,500 (+) interest 166,090 21,783 (+) distribution of surplus 532,458 - (-) amounts received (20,944) - Closing balance 966,887 289,283
Payment of management fee - 2,703
The main changes observed in the period are due to the actuarial losses (note 20.2), partly offset by the portion receivable referring to the distribution of the surplus of Centrus's benefits plan and by the remuneration of the credit receivables in the period (note 11.2.2.b).
37.3. Casa da Moeda do Brasil (CMB)
CMB (the Brazilian mint) is a federal public company, linked to the MF and its main activities are the exclusive manufacture of bank notes and coins and the printing of federal postage and tax stamps.
CMB's bylaws establish that its management will be carried out by the Board of Directors and by the Executive Board and that there will be one member on the Board of Directors indicated by the Bank.
In 2011, the Bank purchased notes and coins in an expenditure that totaled R$788,304 (R$707,441 in 2010).
37.4. Fundo de Pensão dos Empregados da Casa da Moeda do Brasil (Cifrão)
Cifrão (the pension fund for employees of the Brazilian mint) established by CMB, a non-profit organization, is a private pension fund, endowed with a legal personality of private law, with its own equity and administrative and financial autonomy. Its main purpose is to establish and execute pension plans for CMB's employees. There are no transactions between the Bank and Cifrão.
37.5. Reserva para o Desenvolvimento Institucional do Banco Central do Brasil (Redi-BC)
The funds of Redi-BC are intended to support the execution of relevant, essential projects focused on the Bank’s institutional functioning and development and which aim at implementing the actions defined in its strategic planning. In 2011, Redi-BC spent R$103,776 (R$75,140 in 2010) to pay for the execution of projects and reimbursed the Bank R$1,869 (R$1,637 in 2010) as a management fee.
37.6. Fundo de Assistência ao Pessoal (Faspe)
Faspe is an accounting fund created to generate resources intended to maintain the health care benefits of the Bank's employees. It was created by Law 9650, of May 27, 1998, which establishes that its funds will be comprised by appropriations from the Bank and monthly contribution from the participants, where the Bank's contributions must be equivalent to the income forecast from the participants' contributions. It also establishes that in the event of a deficit in the system, the Bank will be able to use a source of funds available for it is payment.
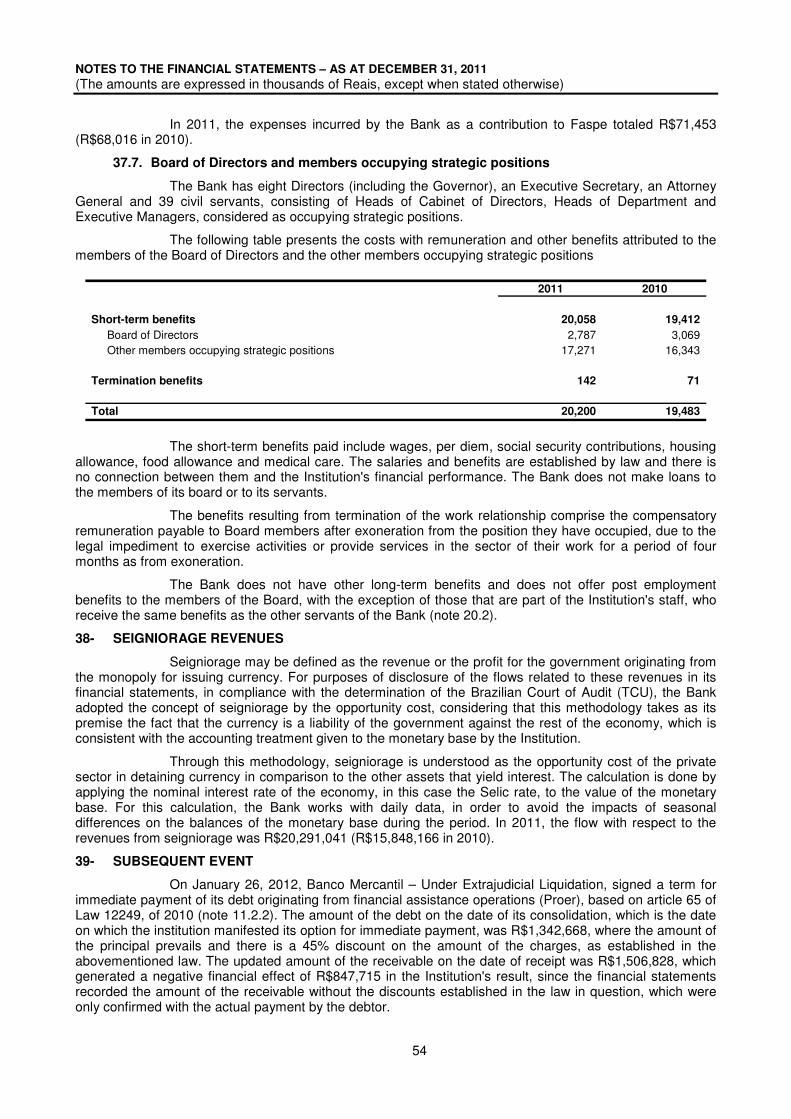
NOTES TO THE FINANCIAL STATEMENTS – AS AT DECEMBER 31, 2011
(The amounts are expressed in thousands of Reais, except when stated otherwise)
54
In 2011, the expenses incurred by the Bank as a contribution to Faspe totaled R$71,453 (R$68,016 in 2010).
37.7. Board of Directors and members occupying strategic positions
The Bank has eight Directors (including the Governor), an Executive Secretary, an Attorney General and 39 civil servants, consisting of Heads of Cabinet of Directors, Heads of Department and Executive Managers, considered as occupying strategic positions.
The following table presents the costs with remuneration and other benefits attributed to the members of the Board of Directors and the other members occupying strategic positions
2011 2010
Short-term benefits 20,058 19,412
Board of Directors 2,787 3,069 Other members occupying strategic positions 17,271 16,343
Termination benefits 142 71
Total 20,200 19,483
The short-term benefits paid include wages, per diem, social security contributions, housing allowance, food allowance and medical care. The salaries and benefits are established by law and there is no connection between them and the Institution's financial performance. The Bank does not make loans to the members of its board or to its servants.
The benefits resulting from termination of the work relationship comprise the compensatory remuneration payable to Board members after exoneration from the position they have occupied, due to the legal impediment to exercise activities or provide services in the sector of their work for a period of four months as from exoneration.
The Bank does not have other long-term benefits and does not offer post employment benefits to the members of the Board, with the exception of those that are part of the Institution's staff, who receive the same benefits as the other servants of the Bank (note 20.2).
38- SEIGNIORAGE REVENUES
Seigniorage may be defined as the revenue or the profit for the government originating from the monopoly for issuing currency. For purposes of disclosure of the flows related to these revenues in its financial statements, in compliance with the determination of the Brazilian Court of Audit (TCU), the Bank adopted the concept of seigniorage by the opportunity cost, considering that this methodology takes as its premise the fact that the currency is a liability of the government against the rest of the economy, which is consistent with the accounting treatment given to the monetary base by the Institution.
Through this methodology, seigniorage is understood as the opportunity cost of the private sector in detaining currency in comparison to the other assets that yield interest. The calculation is done by applying the nominal interest rate of the economy, in this case the Selic rate, to the value of the monetary base. For this calculation, the Bank works with daily data, in order to avoid the impacts of seasonal differences on the balances of the monetary base during the period. In 2011, the flow with respect to the revenues from seigniorage was R$20,291,041 (R$15,848,166 in 2010).
39- SUBSEQUENT EVENT
On January 26, 2012, Banco Mercantil – Under Extrajudicial Liquidation, signed a term for immediate payment of its debt originating from financial assistance operations (Proer), based on article 65 of Law 12249, of 2010 (note 11.2.2). The amount of the debt on the date of its consolidation, which is the date on which the institution manifested its option for immediate payment, was R$1,342,668, where the amount of the principal prevails and there is a 45% discount on the amount of the charges, as established in the abovementioned law. The updated amount of the receivable on the date of receipt was R$1,506,828, which generated a negative financial effect of R$847,715 in the Institution's result, since the financial statements recorded the amount of the receivable without the discounts established in the law in question, which were only confirmed with the actual payment by the debtor.

NOTES TO THE FINANCIAL STATEMENTS – AS AT DECEMBER 31, 2011
(The amounts are expressed in thousands of Reais, except when stated otherwise)
55
40- FISCAL RESPONSIBILITY LAW – MANDATORY INFORMATION
a) Impact and fiscal cost of operations – Fiscal Responsibility Law, paragraph 2 of article 7:
The sole paragraph of article 8 of Law 4595, of 1964, with the wording given by Decree Law 2376, of November 25, 1987, establishes that "as from January 1, 1988, the results obtained by the Bank, considering the income and expenses of all its operations, will be calculated according to the accrual basis and transferred to the National Treasury, after offsetting any losses from prior years."
This provision was partially amended by the Fiscal Responsibility Law (Complementary Law 101, of May 4, 2000):
"Article 7. The positive results of the Central Bank, calculated after the recording or reversal of reserves, constitutes revenue of the National Treasury and will be transferred not later than the 10th working day subsequent to approval of the half-yearly balance sheets.
Paragraph 1. The negative results will constitute a liability of the Treasury to the Central Bank and will be consigned in a specific budget allocation account."
Pursuant to clause II of article 2 of Provisional Measure 2179-36 of August 24, 2001, these negative results must be covered not later than the 10th working day of the year subsequent to the year of approval of the balance sheet by the CMN.
Accordingly:
I - the Bank's results consider the revenues and expenses related to all its operations;
II - the positive results are transferred as income to the National Treasury and the negative results are paid as expenses of the National Treasury;
III - these results are included in the Fiscal Budget in the National Treasury account.
The Bank presented a positive result of R$4,362,860 in the third quarter and R$6,877,844 in the fourth quarter, giving a total positive result of R$11,240,704 in the second semester of 2011, which, after the realization of reserves, will be transferred to the National Treasury not later than the 10th working day after the approval of the financial statements by the CMN. In conformity with paragraph 5 of article 9 of the Fiscal Responsibility Law, within ninety days of the closing of the semester, the Bank shall present in a joint meeting of the pertinent thematic committees of the National Congress (including the Economic Affairs, Finances and Taxation and Public Budget Commissions), an evaluation report on the fulfillment of the objectives and goals of the monetary, credit and foreign exchange policies, clearly showing the impact and the fiscal cost of its operations and the results presented in the balance sheets.
b) Cost of remunerating the deposits of the National Treasury – Fiscal Responsibility Law, Paragraph 3 of article 7
In the third quarter of 2011, the cost corresponding to the remuneration of the deposits of the National Treasury was R$9,723,322 and in the fourth quarter it was R$12,180,093 (R$21,903,415 in the semester).
c) Cost of maintaining the foreign exchange reserves – Fiscal Responsibility Law, Paragraph 3 of article 7
The cost of maintaining the foreign exchange reserve is calculated daily by the difference between the yield on the international reserves, including foreign exchange variation, and the average rate of funding calculated by the Bank.
At December 31, 2011, 93.08% of the reserve assets were composed of securities, as published in the Press Release of the External Sector (table 49), available on the Bank's website (www.bcb.gov.br).
In the third quarter of 2011, the international reserves presented positive returns of 18.37%. After deducting the Bank's funding costs, the net result of the reserves was positive by 15.99% (R$90,957,859). In the fourth quarter, the return from the reserves was 1.55% positive, totaling 0.50% negative (R$3,144,940) after considering the funding costs.
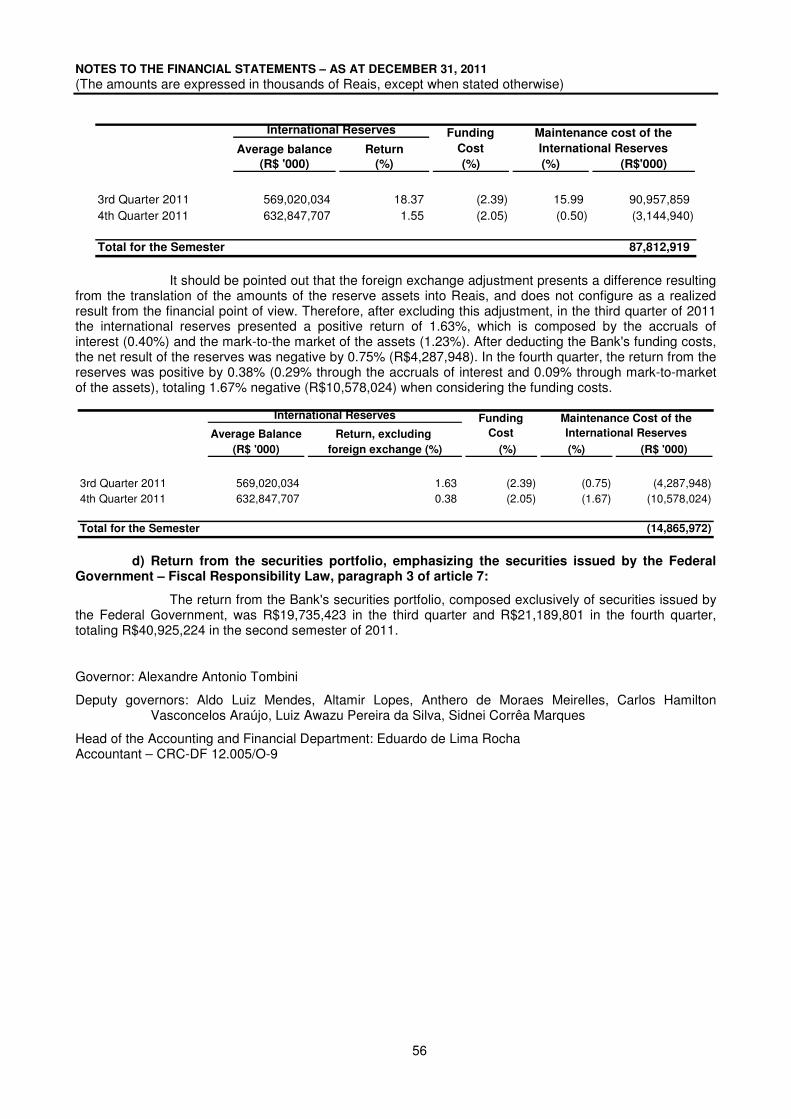
NOTES TO THE FINANCIAL STATEMENTS – AS AT DECEMBER 31, 2011
(The amounts are expressed in thousands of Reais, except when stated otherwise)
56
Average balance Return
(R$ '000) (%) (%) (%) (R$'000)
3rd Quarter 2011 569,020,034 18.37 (2.39) 15.99 90,957,859 4th Quarter 2011 632,847,707 1.55 (2.05) (0.50) (3,144,940)
Total for the Semester 87,812,919
International Reserves Funding
Cost
Maintenance cost of the
International Reserves
It should be pointed out that the foreign exchange adjustment presents a difference resulting from the translation of the amounts of the reserve assets into Reais, and does not configure as a realized result from the financial point of view. Therefore, after excluding this adjustment, in the third quarter of 2011 the international reserves presented a positive return of 1.63%, which is composed by the accruals of interest (0.40%) and the mark-to-the market of the assets (1.23%). After deducting the Bank's funding costs, the net result of the reserves was negative by 0.75% (R$4,287,948). In the fourth quarter, the return from the reserves was positive by 0.38% (0.29% through the accruals of interest and 0.09% through mark-to-market of the assets), totaling 1.67% negative (R$10,578,024) when considering the funding costs.
Average Balance Return, excluding
(R$ '000) foreign exchange (%) (%) (%) (R$ '000)
3rd Quarter 2011 569,020,034 1.63 (2.39) (0.75) (4,287,948) 4th Quarter 2011 632,847,707 0.38 (2.05) (1.67) (10,578,024)
Total for the Semester (14,865,972)
International Reserves Funding
Cost
Maintenance Cost of the
International Reserves
d) Return from the securities portfolio, emphasizing the securities issued by the Federal Government – Fiscal Responsibility Law, paragraph 3 of article 7:
The return from the Bank's securities portfolio, composed exclusively of securities issued by the Federal Government, was R$19,735,423 in the third quarter and R$21,189,801 in the fourth quarter, totaling R$40,925,224 in the second semester of 2011.
Governor: Alexandre Antonio Tombini
Deputy governors: Aldo Luiz Mendes, Altamir Lopes, Anthero de Moraes Meirelles, Carlos Hamilton Vasconcelos Araújo, Luiz Awazu Pereira da Silva, Sidnei Corrêa Marques
Head of the Accounting and Financial Department: Eduardo de Lima Rocha Accountant – CRC-DF 12.005/O-9

Independent auditors' report on the financial statements To The Governor and Deputy Governors Banco Central do Brasil Brasília - DF We have examined the financial statements of Banco Central do Brasil (the Bank), which comprise the balance sheet as of December 31, 2011 and the respective statements of income, comprehensive income, changes in net equity and cash flows for the year then ended, as well as a summary of the main accounting practices and other notes to the financial statements. Management’s responsibility for the financial statements The Bank’s management is responsible for the preparation and adequate presentation of these financial statements in accordance with international financial reporting standards (IFRS), issued by the International Accounting Standards Board (IASB), as well as for the internal controls that it considered necessary for enabling the preparation of these financial statements free of material misstatement, regardless of whether caused by fraud or error. Responsibility of the independent auditors Our responsibility is to express an opinion on these financial statements based on our audit, conducted in accordance with Brazilian and international auditing standards. These standards demand compliance with ethical requirements by the auditors and that the audit is planned and conducted for the purpose of obtaining reasonable assurance that the financial statements are free of material misstatement. An audit involves the performance of selected procedures in order to obtain evidence with respect to the amounts and disclosures presented in the financial statements. The procedures selected depend on the auditor’s judgment and include an assessment of the risks of material misstatement in the financial statements, regardless of whether caused by fraud or error. In the assessment of these risks, the auditor considers the relevant internal controls for the preparation and adequate presentation of the Bank’s financial statements, in order to plan the audit procedures that are appropriate in the circumstances, but not for purposes of expressing an opinion on the effectiveness of the Bank’s internal controls. An audit also includes the evaluation of the adequacy of the accounting practices used and the reasonableness of the accounting estimates made by management, as well as evaluating the overall presentation of the financial statements taken as a whole. We believe that the audit evidence obtained is sufficient and appropriate for expressing our opinion.
KPMG Auditores Independentes Financial Services SBS - Qd. 02 - Bl. Q - Lote 03 - Salas 708 a 711 Edifício João Carlos Saad 70070-120 - Brasília, DF - Brasil Caixa Postal 8723 70312-970 - Brasília, DF - Brasil
Central Tel 55 (61) 2104-2400 Fax 55 (61) 2104-2406 Internet www.kpmg.com.br
KPMG Auditores Independentes, uma sociedade simples brasileira e firma-membro da rede KPMG de firmas-membro independentes e afiliadas à KPMG International Cooperative (“KPMG International”), uma entidade suíça.
KPMG Auditores Independentes, a Brazilian entity and a member firm of the KPMG network of independent member firms affiliated with KPMG International Cooperative (“KPMG International”), a Swiss entity.

3
Opinion In our opinion, the aforementioned financial statements present fairly, in all material respects, the financial position of Banco Central do Brasil as of December 31, 2011, and the results of its operations and its cash flows for the year then ended, in conformity with international financial reporting standards (IFRS) issued by the International Accounting Standards Board (IASB). Emphasis of matter The supplementary information included in Notes 38 and 40, which is the responsibility of the Bank's management, is not required by international reporting standards (IFRS). This supplementary information, except for the management information corresponding to the seigniorage revenues described in Note 38, were submitted to the audit procedures described in the paragraph “Responsibility of the independent auditors” and, in our opinion, is fairly presented in all material respects in relation to the financial statements taken as a whole. Brasília, February 9, 2012 KPMG Auditores Independentes CRC SP-014428/O-6 F-DF (Original report in Portuguese signed by) Jubran Pereira Pinto Coelho Accountant CRC MG-077045/O-0 S-DF
ABCD