statement on quarterly review of the trends in receipts
TRANSCRIPT

GOVERNMENT OF INDIA
Statement on Quarterly Review of thetrends in receipts and expenditure inrelation to the budget at the end of
third quarter of financial year2012-2013
(As required under Section 7(1) of theFiscal Responsibility and Budget Management Act, 2003)
Ministry of Finance

CONTENTS
Page
Macroeconomic backdrop 1
Review of trends in receipts and expenditure 1
Receipts 3
Gross Tax Revenue 3
Direct Taxes 4
Indirect Taxes 5
Non Tax Revenue 7
Non Debt Capital Receipts 7
Expenditure 7
Plan Expenditure 8
Non Plan Expenditure 8
Resources transferred to States/UTs 9
Deficits 9
Financing of Deficit 9
Cash Management 10
National Small Savings Fund 10
Review of trends in receipts and expenditure of Railways 10
Conclusion 11
Annex I – Accounts at a Glance 13
Annex II – Tax Revenue 14
Annex III – Non Tax Revenue 15
Annex IV – Capital Receipts 16
Annex V - Plan Expenditure 17
Annex VI – Non Plan Expenditure 22
Annex VII - Resources transferred to State & UT Governments 31
Annex VIII - Departmental Commercial Undertakings 32

1
STATEMENT ON QUARTERLY REVIEW OF THE TRENDS IN RECEIPTS ANDEXPENDITURE IN RELATION TO THE BUDGET AT THE END OF FIRST QUARTER OF
FINANCIAL YEAR 2012-13Macroeconomic backdrop
A combination of global and domestic factors has led to a slowdown in the growth of Gross DomesticProduct (GDP) in India in 2011-12 and 2012-13. As per the data released by Central Statistics Office(CSO), the growth for the year 2012-13 is estimated to be 5.0 per cent (advance estimates), as against 6.2per cent in 2011-12. The economy registered a growth of 5.5 per cent, 5.3 per cent and 4.5 per centrespectively in the first, second and third quarters of 2012-13. During the third quarter of 2012-13, thegrowth rate has been 4.5 per cent as against 6.0 per cent in the corresponding quarter of 2011-12. The thirdquarter of 2012-13 witnessed a growth rate of 1.1 per cent in agriculture and allied sectors, 3.3 per cent inthe industry sector and 6.1 per cent in the services sector.
Year-on-year inflation based on the Wholesale Price Index, in the third quarter of 2012-13, was 7.29 per centas compared to 9.01 per cent during the corresponding quarter of 2011-12. The average inflation during April-December 2012-13 was 7.56 per cent vis-à-vis 9.44 per cent during the corresponding period of 2011-12.
Agriculture and allied sectors have grown at 1.1 per cent in the third quarter of 2012-13 compared to4.1 per cent in the corresponding quarter of 2011-12. The growth in agriculture sector for the year 2011-12was 3.6 per cent and is estimated to be 1.8 per cent in 2012-13 (advance estimates of CSO). As per theSecond Advance Estimates released by Department of Agriculture and Cooperation on 08.02.2013, thetotal production of food grains during 2012-13 is estimated at 250.14 million tonnes, as compared to thefinal estimate of 259.32 million tonnes in 2011-12.
During 2012-13 (April-December), exports were valued at US$ 218.1 billion, which was 3.6 per centlower than the level of US$ 226.2 billion in 2011-12 (April-December). Imports during 2012-13 (April-December), were valued at US$ 363.1 billion, which was 0.2 per cent lower than the level of US$ 363.7billion in 2011-12 (April-December). Trade deficit for 2012-13 (April-December) was US$ 145.0 billionas against US$ 137.5 billion in corresponding period of 2011-12.
The net invisibles balance (invisibles receipts minus invisibles payments) stood at US$ 78.3 billion during2012-13 (April-December) as compared to US$ 81.9 billion during 2011-12. The current account deficitincreased to US$ 72.0 billion in 2012-13 (April-December), as compared to US$ 56.4 billion during 2011-12.Net capital inflows (including errors and omissions) were US$ 73.1 billion in 2012-13 (April-December) ascompared to US$ 49.3 billion in 2011-12. Net FDI flows were US$ 15.3 billion during 2012-13 (April-December) as against US$ 20.7 billion during the corresponding period of 2011-12. Net FII flows investmentstood at US$ 16.0 billion in 2012-13 (April-December) vis-à-vis US$ 2.7 billion in 2011-12.
India’s foreign exchange reserves increased to US$ 295.6 billion at end December 2012 from a level ofUS$ 294.8 billion at end-September 2012, and US$ 294.4 billion at end-March, 2012. The value of Rupeedepreciated by 7.9 per cent from the level of ` 50.32 per US$ in March 2012 to ` 54.65 per US$ inDecember 2012. The average exchange rate for the Rupee vis-à-vis the US$ was ` 54.49 per US$ in 2012-13 (April-December) as compared to ` 47.14 per US$ in the corresponding period of 2011-12.Review of trends in receipts and expenditure during April-December 2012
Budget 2012-13 was presented against the backdrop of slowdown in the economy and worsening fiscalposition in 2011-12. Fiscal expansionary response of Government led to increase in fiscal deficit by morethan percentage point. The pressure of expansionary policy with downward trend of growth put the economyunder stress. Government responded with mid-year policy review and path of fiscal consolidation wasadopted in the second quarter. An extensive exercise was taken to rationalize expenditure under variousplan and non-plan items as a part of the exercise for finalization of Revised Estimates for 2012-13. Effortswere also made to minimize the tax shortfall vis-à-vis the Budget Estimates. The impact was evidenced by

2end of third quarter. The fiscal deficit which appeared to be increasing like last year was revised downwardsat RE stage to 5.2 percent, Government is committed to meet the targets. While the positive impact of thechange in policy stance came in later part of the year, for review of performance, figures of BE 2012-13 havebeen taken into account.
Summarised position on trends in receipts and expenditure as at the end of third quarter of year 2012-13 (April-December, 2012) is given below in Table 1. The figures therein are unaudited and may undergorevision subsequent to audit. The receipts and recoveries, wherever directly linked to expenditure, havebeen netted out.
Table-1: Key Fiscal Aggregates(` crore)
(` /crores) (Percentage)Particulars ACTUALS up to December Percentage to BE 5 years
B.E. 2012-13 2011-12 Upto COPPY moving2012-13 12/2012 average
1 2 3 4 5 6 71 Revenue Receipts 935685 570536 498491 61.0 63.1 69.52 Tax Revenue (Net) 771071 484156 420414 62.8 63.3 67.23 Non-Tax Revenue 164614 86380 78077 52.5 62.2 78.44 Capital Receipts (5+6+7) 555240 420587 397870 75.7 85.0 84.3
Non Debt Capital Receipts 41650 15888 16858 38.1 30.6 74.25 Recovery of Loans 11650 7710 14115 66.2 94.0 128.46 Other Receipts 30000 8178 2743 27.3 6.9 107.97 Borrowings and other
liabilities 513590 404699 381012 78.8 92.3 85.98 Total Receipts (1+4) 1490925 991123 896361 66.5 71.3 72.29 Non-Plan Expenditure 969900 695233 619457 71.7 75.9 75.110 On Revenue Account 865596 625598 550692 72.3 75.1 77.711 of which Interest Payments 319759 201959 179429 63.2 67.0 63.712 On Capital Account 104304 69635 68765 66.8 83.2 56.913 Plan Expenditure 521025 295890 276904 56.8 62.7 66.314 On Revenue Account 420513 242975 233903 57.8 64.3 66.415 On Capital Account 100512 52915 43001 52.6 55.2 66.216 Total Expenditure (9+13) 1490925 991123 896361 66.5 71.3 72.217 Revenue Expenditure (10+14) 1286109 868573 784595 67.5 71.5 74.118 Of which Grants for
creation of Capital Assets 164672 74283 84149 45.1 57.3 0.019 Capital Expenditure (12+15) 204816 122550 111766 59.8 69.6 59.420 Revenue Deficit (17-1) 350424 298037 286104 85.1 93.1 118.821 Effective Revenue Deficit
(20-18) 185752 223754 201955 120.5 125.9 0.022 Fiscal Deficit {16 -(1+5+6)} 513590 404699 381012 78.8 92.3 85.923 Primary Deficit (22 – 11) 193831 202740 201583 104.6 139.2 104.2Notes: 1. The figures of Railways have been netted as in Budget Estimates.
2. COPPY – Corresponding Period of Previous Year.3. # Excluding Grants for creation of Capital Assets
3Receipts
Revenue receipts
The revenue receipts (net tax revenue and non tax revenue) were estimated at ` 9,35,685 crore in BE2012-13 reflecting growth of 24.5 per cent over actuals for 2011-12. Revenue receipts up to December,2012 are ` 5,70,536 crore as compared to ` 4,98,491 crore during the same period in the previous financialyear reflecting a reduction of 14.5 per cent during the period of April-December, 2012. Total revenuereceipts are 61.0 per cent of B.E. as compared to 63.1 per cent during April-December, 2011 and 69.5 percent which is five year moving average of revenue receipts (April-December) as percentage of B.E. Thedetailed analysis of various components of tax revenue is given in the following section.
2. Following table shows the trend in revenue receipts as percentage of BE as well as ratio of GDP duringFRBM Act regime:
Table 2
RECEIPTS ON QUARTERLY BASIS FROM 2007-08 TO 2012-13(` crore)
REVENUE RECEIPTS 2007-08 2008-09 2009-10 2010-11 2011-12 2012-13
Tax Revenue (Net) 295994 309927 307591 391148 420414 484156Non-Tax Revenue 59652 66010 81680 193120 78077 86380Total 355646 375937 389271 584268 498491 570536BE for the year 486422 602935 614497 682212 789892 935685 Percentage of BE 73.1 62.4 63.3 85.6 63.1 61.0 Percentage of GDP 7.1 6.7 6.0 7.5 5.6 5.7
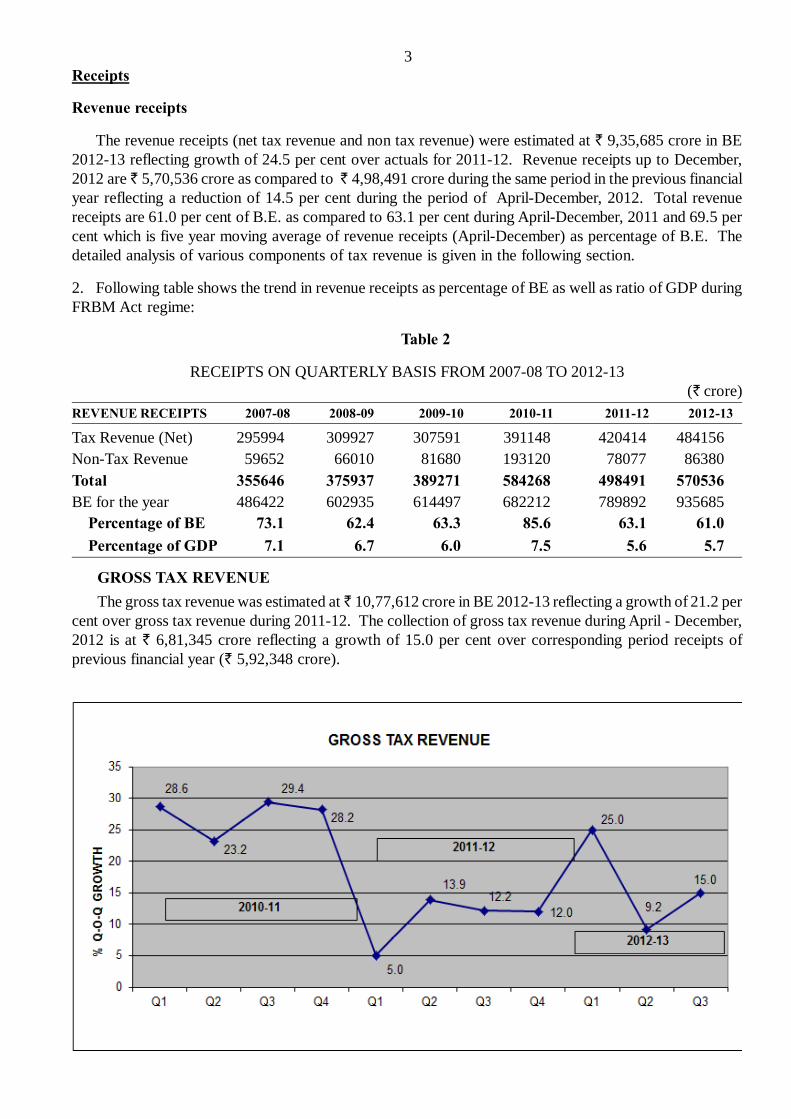
GROSS TAX REVENUEThe gross tax revenue was estimated at ̀ 10,77,612 crore in BE 2012-13 reflecting a growth of 21.2 per
cent over gross tax revenue during 2011-12. The collection of gross tax revenue during April - December,2012 is at ` 6,81,345 crore reflecting a growth of 15.0 per cent over corresponding period receipts ofprevious financial year (` 5,92,348 crore).

4Table 3 shows the details of gross tax revenue at the end of the third quarter of 2012-13 as compared
to the corresponding period of 2011-12.Table 3
2012-2013 2011-12B.E. Actuals % of % growth B.E. Actuals % of
upto B.E. over upto B.E.December 2012 December 2011 December 2011
(` crore) (` crore)
1. Corporation Tax 373227 237626 63.7 10.6 359990 214837 59.72. Taxes on income other
than Corporation Tax 189866 128273 67.6 22.5 164526 104701 63.63. Customs 186694 118781 63.6 6.0 151700 112008 73.84. Union Excise Duties 194350 109211 56.2 17.4 164116 93064 56.75. Service Tax 124000 80927 65.3 33.0 82000 60860 74.26. Other taxes 9475 6527 68.9 -5.1 10108 6877 68.0Total Gross Tax Revenue 1077612 681345 63.2 15.0 932440 592348 63.5
Direct Taxes
CORPORATION TAX
The Corporation Tax was estimated at ` 3,73,227 crore in BE 2012-13 and continued to be the largestcomponent of total tax revenue. The BE 2012-13 was estimated at 15.5 per cent over the actual receipts ofCorporate tax collection during 2011-12. Receipts under this component is ` 2,37,626 crore during theperiod April-December, 2012 and shows growth of 10.6 per cent over collections during the same period in2011-12 (` 2,14,837 crore). This lower than estimated growth could be attributed to two factors, namely,moderation in growth in Indian economy from the estimated level and front loading of refunds of corporationTax during 2012-13. Prior to refunds, growth in Corporation tax receipts is -1.02 per cent during the periodApril-December, 2012 when compared to the same in 2011.

5INCOME TAX OTHER THAN CORPORATION TAX
This is estimated at ` 1,89,866 crore in BE 2012-13 showing a growth of 15.4 per cent over thecollections during 2011-12. The actual collection of ` 128273 crore during the period April-December,2012 shows a growth of 22.5 per cent when compared to corresponding period in 2011-12. However, priorto refunds, growth is 11.9 per cent during the above mentioned period.
Indirect Taxes
CUSTOMS
BE 2012-13 was estimated at ̀ 1,86,694 crore reflecting a growth of 25.0 per cent over actual collectionof 2011-12. Receipts under this component at ` 1,18,781 crore during the period April-December, 2012have shown a growth of 6.0 per cent over the corresponding period in 2011-12. The collection of ̀ 1,18,781crore up to the third quarter of 2012-13 is 63.6 per cent of BE 2012-13. The above rate of growth may alsobe seen in the context of duty reduction for petroleum products during the first quarter of 2012-13. Slowdown in GDP growth has impacted non-petroleum imports leading to lower than expected growth in Customs.

6
SERVICE TAX
Service Tax in BE 2012-13 is estimated at ` 1,24,000 crore reflecting a growth of 27.2 per cent overreceipts in 2011-12. The collection of ` 80,927 crore during the period April-December, 2012 shows agrowth of 33.0 per cent over the collections made in the corresponding period of 2011-12. The amountcollected during April – December, 2012 is 65.3 per cent of BE 2012-13. There is higher than expectedgrowth and increase has partly covered shortfall under other taxes.
UNION EXCISE DUTIES
BE 2012-13 was estimated at ̀ 1,94,350 crore reflecting a growth of 34.1 per cent over actual collectionof 2011-12. During the period April-December, 2012, the receipts under this component amounting to `1,09,211 crore is 56.2 per cent of BE 2012-13 and it reflects a growth of 17.4 per cent over the collectionsmade in the corresponding period of 2011-12. Lower than estimated growth in largely on account ofslowdown in economy as a whole and industrial sector in particular during this period.
7NON TAX REVENUE
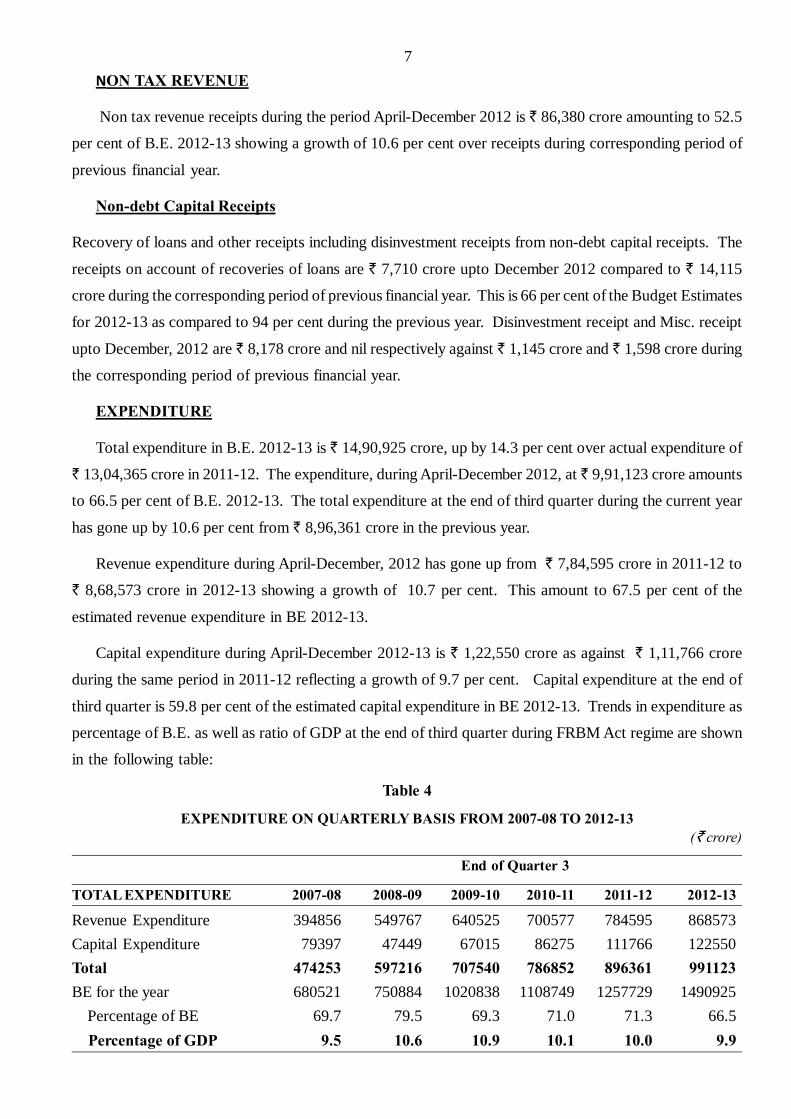
Non tax revenue receipts during the period April-December 2012 is ` 86,380 crore amounting to 52.5
per cent of B.E. 2012-13 showing a growth of 10.6 per cent over receipts during corresponding period of
previous financial year.
Non-debt Capital Receipts
Recovery of loans and other receipts including disinvestment receipts from non-debt capital receipts. The
receipts on account of recoveries of loans are ` 7,710 crore upto December 2012 compared to ` 14,115
crore during the corresponding period of previous financial year. This is 66 per cent of the Budget Estimates
for 2012-13 as compared to 94 per cent during the previous year. Disinvestment receipt and Misc. receipt
upto December, 2012 are ` 8,178 crore and nil respectively against ` 1,145 crore and ` 1,598 crore during
the corresponding period of previous financial year.
EXPENDITURE
Total expenditure in B.E. 2012-13 is ` 14,90,925 crore, up by 14.3 per cent over actual expenditure of
` 13,04,365 crore in 2011-12. The expenditure, during April-December 2012, at ` 9,91,123 crore amounts
to 66.5 per cent of B.E. 2012-13. The total expenditure at the end of third quarter during the current year
has gone up by 10.6 per cent from ` 8,96,361 crore in the previous year.
Revenue expenditure during April-December, 2012 has gone up from ` 7,84,595 crore in 2011-12 to
` 8,68,573 crore in 2012-13 showing a growth of 10.7 per cent. This amount to 67.5 per cent of the
estimated revenue expenditure in BE 2012-13.
Capital expenditure during April-December 2012-13 is ` 1,22,550 crore as against ` 1,11,766 crore
during the same period in 2011-12 reflecting a growth of 9.7 per cent. Capital expenditure at the end of
third quarter is 59.8 per cent of the estimated capital expenditure in BE 2012-13. Trends in expenditure as
percentage of B.E. as well as ratio of GDP at the end of third quarter during FRBM Act regime are shown
in the following table:
Table 4
EXPENDITURE ON QUARTERLY BASIS FROM 2007-08 TO 2012-13 (` crore)
End of Quarter 3
TOTAL EXPENDITURE 2007-08 2008-09 2009-10 2010-11 2011-12 2012-13
Revenue Expenditure 394856 549767 640525 700577 784595 868573Capital Expenditure 79397 47449 67015 86275 111766 122550Total 474253 597216 707540 786852 896361 991123BE for the year 680521 750884 1020838 1108749 1257729 1490925 Percentage of BE 69.7 79.5 69.3 71.0 71.3 66.5 Percentage of GDP 9.5 10.6 10.9 10.1 10.0 9.9

8Plan Expenditure
Plan Expenditure is estimated at ` 5,21,025 crore in BE 2012-13 reflecting a growth of 26.3 per centover the actuals of 2011-12. Plan expenditure of ` 2,95,890 crore during April-December, 2012 accountsfor 56.8 per cent of BE 2012-13 and reflects a growth of 6.9 per cent over the previous year plan expenditureduring the same period. It being first year of the plan period, the growth in plan expenditure is slower thanexpected. Trends in plan expenditure as percentage of GDP and as percentage of B.E at the end of thirdquarter of respective financial years are shown below:
Table 5PLAN EXPENDITURE ON QUARTERLY BASIS FROM 2007-08 TO 2012-13
(` crore)End of Quarter 3
PLAN EXPENDITURE 2007-08 2008-09 2009-10 2010-11 2011-12 2012-13
On Revenue Account 114806 146009 179555 212885 233903 242975On Capital Account 22357 24788 30604 37069 43001 52915Total 137163 170797 210159 249954 276904 295890BE for the year 205100 243386 325149 373092 441547 521025 Percentage of BE 66.9 70.2 64.6 67.0 62.7 56.8 Percentage of GDP 2.8 3.0 3.2 3.2 3.1 3.0
Non Plan Expenditure
Non-plan expenditure is estimated in B.E. 2012-13 at ` 9,69,900 crore which constitutes 74.4 per centof total expenditure during 2011-12 and reflects a growth of 8.7 per cent over the actual non-plan expenditurein 2011-12. The Non-plan expenditure at the end of third quarter has increased from ` 6,19,457 crore in2011-12 to ` 6,95,233 crore in 2012-13 reflecting growth of 12.2 per cent. The Non-plan expenditureduring April-December, 2012 is 71.7 per cent of the estimated non plan expenditure in BE 2012-13.
Major subsidies, accounted for under non-plan expenditure, have shown higher outgo at the end ofthird quarter of the current financial year when compared to the same period during the previous financialyear. The outgo on food subsidy has increased from a level of ` 46,617 crore in April-December, 2011 to` 66,744 crore in April-December, 2012, various subsidies on fertiliser have increased from ` 55,367 croreto ` 59,626 crore at the end of third quarter. The compensation for under-recoveries to Oil MarketingCompanies have also increased during this period to ` 40,544 crore.
Expenditure on interest payments, defence services, pensions, major subsidies and grants and loans toStates taken together and amounting to ̀ 5,80,252 crore continue to share high proportion of total non-planexpenditure at 83.5 per cent during April-December 2012. Trends in non-plan expenditure as percentageof GDP and as percentage of B.E at the end of third quarter of respective financial years are shown below:
Table 6
EXPENDITURE ON QUARTERLY BASIS FROM 2007-08 TO 2012-13 (` crore)
End of Quarter 3
NON-PLAN EXPENDITURE 2007-08 2008-09 2009-10 2010-11 2011-12 2012-13
On Revenue Account 280050 403758 460970 487692 550692 625598 Of which Interest Payments 111764 123735 130005 146304 179429 201959On Capital Account 57040 22661 36411 49206 68765 69635Total 337090 426419 497381 536898 619457 695233BE for the year 475421 507498 695689 735657 816182 969900 Percentage of BE 70.9 84.0 71.5 73.0 75.9 71.7 Percentage of GDP 6.8 7.6 7.7 6.9 6.9 6.9

9Resources transferred to States/UTs
Against the BE of ̀ 5,21,294 crore for transfer to States/UTs, the actual resources transferred to States/UTs up to December 2012 are ` 3,19,590 crore constituting 61 per cent of BE 2012-13 reflecting a growthof 9.6 per cent over ` 2,91,571 crore (64 per cent of BE) transferred during the corresponding period in theprevious financial year. Out of the above amount, ̀ 3,17,958 crore has been transferred to State Governmentsand ` 1,632 crore has been transferred to UT Governments.
DEFICIT
Fiscal deficit for the year is estimated at ` 5,13,590 crore amounting to 5.1 per cent of GDP. However,due to moderation in growth in the economy and increase in subsidy related expenditure due to higherinternational crude prices, it has been estimated at 5.2 per cent of GDP in RE 2012-13. For the period uptoDecember, 2012 fiscal deficit at ` 4,04,699 crore which is 78.8 per cent of B.E. 2012-13. In terms of ratioto GDP, fiscal deficit for the period up to December, 2012 is 4.0 per cent whereas this was 4.3 per centduring corresponding period of previous year.
Revenue deficit was estimated at ` 3,50,424 crore in BE 2012-13 amounting to 3.4 per cent of GDP.However, due to lower tax collection and higher outgo on subsidies, it is estimated at 3.9 per cent of GDPin RE 2012-13. During the period April-December 2012 revenue deficit is at ` 2,98,037 crore constituting85.1 per cent of B.E. 2012-13 (this was 93.1 per cent of BE during 2011-12).
Trends in deficit as percentage of GDP and as percentage of B.E. at the end of third quarter of respectivefinancial years are shown below:
Table 7DEFICIT ON QUARTERLY BASIS FROM 2007-08 TO 2012-13
(` crore)Quarter 3
2007-08 2008-09 2009-10 2010-11 2011-12 2012-13Revenue Deficit (actuals) 39210 173830 251254 116309 286104 298037Revenue Deficit (BE) 71478 55184 282735 276512 307270 350424 Percentage of BE 54.9 315.0 88.9 42.1 93.1 85.1 Percentage of GDP 0.8 3.1 3.9 1.5 3.2 3.0Fiscal Deficit (Actuals) 77578 218262 309980 171249 381012 404699Fiscal Deficit (BE) 150948 133287 400996 381408 412817 513590 Percentage of BE 51.4 163.8 77.3 44.9 92.3 78.8 Percentage of GDP 1.6 3.9 4.8 2.2 4.3 4.0Primary Deficit (Actuals) -34186 94527 179975 24945 201583 202740Primary Deficit (BE) -8047 -57520 175485 132744 144831 193831 Percentage of BE 424.8 -164.3 102.6 18.8 139.2 104.6 Percentage of GDP -0.7 1.7 2.8 0.3 2.2 2.0Financing of deficit
The deficit of ` 4,04,699 crore on Consolidated Fund of India and increase of ` 67,303 crore in cashbalance were financed by raising internal debt of ` 4,56,280 crore, External Assistance of ` 850 crore and` 14,872 crore from Public Accounts surplus cash.
Gross and net market borrowings up to the third quarter of 2012-13 amounted to ` 5,10,000 crore and` 4,19,384 crore respectively, accounting for 89.5 per cent and 87.6 per cent of the Budget Estimate undermarket borrowings for the year. During the corresponding period of the previous financial year, gross andnet borrowings accounted for 91 per cent and 89 per cent respectively of the total borrowings for the year.The weighted average maturity of dated securities issued by the end of Q3 of the fiscal year 2012-13 (April-December) at 13.5 years was higher than 12.5 years during the corresponding period of the previous year.The weighted average yield of dated securities issued during the same period was decreased to 8.4 per centfrom 8.5 per cent. This reduction in the borrowing cost has to be seen in the context of change in monetarypolicy stance of RBI.

10Details of financing the deficit for the period April-December 2012 are shown in Table 8 below.
Table 8FINANCING OF DEFICIT
(` crore)April - December-11 April - December-12
Fiscal Deficit 3,81,012 404699Sources of Financing1.Internal Debt 3,41,206 456280(a) Market Loans & Short Term Borrowings 3,84,147 468357(b) Treasury Bills (14 days ) -33184 -9484(c) Compensation and Other Bonds -9,645 -4467(d) Others -112 18742. External Assistance including Revolving fund 7,058 8503. Cash Draw Down Decrease(+)/Increase(-) 1,924 (-)673034. Investment of Surplus Cash(-) / WMA/ disinvestments(+) 41557 05. Borrowings(-)/Surplus(+) on Public Account* -10,733 14872*Includes Suspense & Remittances.Cash Management
The year 2012-13 commenced with surplus cash position of ` 26,022 crore and investment surplus of` 50,000 crore. At the end of the first quarter, Cash balance has reduced to ` 100 crore and an investmentof ` 19,154 crore. The second quarter ended with a cash balance of ` 10 crore and investment of ` 35,412crore. The third quarter ended with cash balance of ` 85,723 crore and an investment of ` 50,000 crore.Government is committed to better cash management and optimize borrowings.National Small Savings Fund
Net accretion under National Small Savings Fund (NSSF) has shown increasing trend during the firstthree quarters of 2012-13 when compared to 2011-12. At the end of third quarter, net accretion has increasedfrom ` 8,211 crore in 2011-12 to ` 22,219 crore in 2012-13.
Review of trends in receipts and expenditure of Railways during October- December 2012
The Railways receipts comprise mainly of traffic earnings from passenger, other coaching services,freight services, and sundry other earnings. The traffic earnings comprise 67 percent from freight and 27percent from passenger segment. Balance 6 percent is from other coaching and Sundry other earnings.
Railways budgeted to carry 1025 Million Tonne (MT) of freight traffic in 2012-13 as against 969.8 MTcarried last year representing a growth of 5.7 percent. The passengers budgeted to be carried in 2012-13were 8741 million as against 8224 million carried in the previous year i.e. an increase of 6.3 percent.
Based on the above growth in traffic, the total traffic earnings have been budgeted at` 1,32,502 crore in BE 2012-13 i.e. a growth of 27.2 percent over previous year. The budgeted trafficearnings comprise earnings from passenger budgeted at ` 36,073 crore, goods at ` 89,339 crore, othercoaching earnings at ` 2,994 crore and the sundry other earnings at ` 4,096 crore envisaging a growth of27.7 percent, 28.4 percent, 10.2 percent and 12.4 percent over the previous year, respectively.
The revenue expenditure on Railways consists mainly of Ordinary Working Expenses (OWE),appropriation to Pension Fund and Depreciation Reserve Fund (DRF). The OWE has been budgeted at` 84,400 crore in BE 2012-13 representing an increase of 13.3 percent over ` 74,537 crore of PreviousYear. The appropriation to Pension Fund and DRF was kept at ` 18,500 crore and ` 9,500 crore in BE2012-13.
The Railway has budgeted to achieve an operating ratio of 84.9 percent in 2012-13 and targetted internalresources of ` 25,117 crore for plan finance as per the budget projections.

11Quarter 3 - October to December 2012
BE2012-13 Earnings/Expenditure Position up to Increase from upto December Dec. as a % Dec. 2011 to
2012-13 2011-12 of BE 2012-13 Dec. 2012 (in %)(1) (2) (3) (4) (5) (6)Passenger 36073 22544 20593 62.5 9.5Other Coaching 2994 2225 2021 74.3 10.1Goods 89339 61220 49543 68.5 23.6Sundries 4096 2278 2114 55.6 7.8Total 132502 88267 74271 66.6 18.8OWE 84400 64997 57065 77.0 13.9
The earnings at ` 88,267 crore has a growth of 18.8 percent up to December, 2012 but is not in line with thebudgeted expectations. The shortfall in growth is seen in all segments of traffic earnings. The shortfall in growthof earnings to end of December, 2012 is due to lesser realization of yield per MT. The lesser growth of passengerearnings to end of December, 2012 is attributable to lesser growth in suburban passengers and lesser yield due toonly partial adoption of revision in passenger fares envisaged in the Budget Estimates 2012-13.
The growth of OWE at 13.9 percent to end December,2012 is slightly higher than the full year growthof 13.3 percent provided in BE 2012-13.
It is worth highlighting that the Railways have repaid the entire loan of ` 3,000 crore taken fromMinistry of Finance in 2011-12 along with interest in the Q3.
Plan Expenditure
The plan outlay of Railways has been budgeted at ` 60,100 crore in BE 2012-13 as against ` 45,061crore of the Previous Year, representing an increase of 33.4 percent. Segment-wise the plan outlay for2012-13 comprises ` 24,000 crore of Budgetary Support, ` 18,050 crore of internal resources,` 2,000 crore of Railway Safety Fund funded through Diesel Cess and ` 16,050 crore of Extra BudgetaryResources (EBR). In the four segments, the increase provided over previous year is 20 percent, 102 percent,nil and 8.5 percent, respectively. The Budgetary Support contributes 40 percent of the total plan outlay,Internal Resources 30 percent, Railways Safety Fund 3 percent and EBR 27 percent.
The plan expenditure incurred to end of December, 2012 works out to ` 38,700 crore, which is morethan the expenditure of ` 31,673 crore incurred during COPPY. While the expenditure incurred to end ofDecember, 2012 under Budgetary Support is ̀ 20,932 crore, which is higher than the COPPY by 38 percent,it is ̀ 6,879 crore under the Internal Resources, which is 7.4 percent lower than the COPPY. The expenditureincurred from Railway Safety Fund and EBR is ` 791 crore and ` 10,097 crore, respectively.
ConclusionIn view of the prevailing macro economic environment it is imperative for Government to contain
fiscal deficit within budgeted level so that adequte space is left for borrowing for private investment.
Measures undertaken by Government for fiscal consolidation in last few months have bore fruits.Government drew up a fiscal consolidation roadmap with commitment to keep fiscal deficit within 5.3percent of GDP. Review exercise undertaken by Government has reasonably rationalised the estimates ofPlan and Non-plan expenditure for the fiscal year 2012-13. Effort has been to achieve similar outcomesthrough smaller outlays in Fiscal Year 2012-13, through more efficient utilization of financial resourcesavailable with programme implementing units. Efforts have also been made to realise resources throughtaxation effort and keep the gap between budgeted and realized level to minimum possible.
The financial performance in the Q3 of 2012-13 for railways is not up to the budgeted expectations. Railwaysare making efforts to increase the earnings and control the expenditure to achieve the budgeted targets.


13
Annex I
ACCOUNTS AT A GLANCE
(` crore)
Particulars ACTUALS upto Dec. Percentage to BEB.E. Upto Upto Upto COPY 5 years
2012-13 2012-13 2011-12 12/2012 movingaverage
1 2 3 4 5 6 7
1 Revenue Receipts 935685 570536 498491 61.0 63.1 69.5
2 Tax Revenue (Net) 771071 484156 420414 62.8 63.3 67.2
3 Non-Tax Revenue 164614 86380 78077 52.5 62.2 78.4
4 Capital Receipts (5+6+7) 555240 420587 397870 75.7 85.0 84.3
Non Debt Capital Receipts 41650 15888 16858 38.1 30.6 74.2
5 Recovery of Loans 11650 7710 14115 66.2 94.0 128.4
6 Other Receipts 30000 8178 2743 27.3 6.9 107.9
7 Borrowings and other liabilities 513590 404699 381012 78.8 92.3 85.9
8 Total Receipts (1+4) 1490925 991123 896361 66.5 71.3 72.2
9 Non-Plan Expenditure 969900 695233 619457 71.7 75.9 75.1
10 On Revenue Account 865596 625598 550692 72.3 75.1 77.7
11 of which Interest Payments 319759 201959 179429 63.2 67.0 63.7
12 On Capital Account 104304 69635 68765 66.8 83.2 56.9
13 Plan Expenditure 521025 295890 276904 56.8 62.7 66.3
14 On Revenue Account 420513 242975 233903 57.8 64.3 66.4
15 On Capital Account 100512 52915 43001 52.6 55.2 66.2
16 Total Expenditure (9+13) 1490925 991123 896361 66.5 71.3 72.2
17 Revenue Expenditure (10+14) 1286109 868573 784595 67.5 71.5 74.1
18 Of which Grants for creation ofCapital Assets 164672 74283 84149 45.1 57.3 0.0
19 Capital Expenditure (12+15) 204816 122550 111766 59.8 69.6 59.4
20 Revenue Deficit (17-1) 350424 298037 286104 85.1 93.1 118.8
21 Effective Revenue Deficit (20-18) 185752 223754 201955 120.5 125.9 0.0
22 Fiscal Deficit {16 – (1+5+6)} 513590 404699 381012 78.8 92.3 85.9
23 Primary Deficit (22 – 11) 193831 202740 201583 104.6 139.2 104.2
Notes: 1. The figures of Railways have been netted as in Budget Estimates. 2. COPY - Corresponding Period of Previous Year. 3. # Excluding Grants for creation of Capital Assets.

14
1 Corporation Tax 373227.00 237625.61 64% 359990.00 214837.32 60%
2 Taxes on Income 195786.00 131520.82 67% 172026.00 108583.75 63%
(a) Taxes on Income other than
Corporation Tax 189866.00 128273.42 68% 164526.00 104701.34 64%
(b) Fringe Benefit Tax 0.00 -46.67 0.00 118.89
(c) Securities Transaction Tax 5920.00 3294.06 56% 7500.00 3763.44 50%
(d) Banking Cash Transaction Tax 0.00 0.01 0.00 0.08
3 Wealth Tax 1244.00 663.30 53% 635.00 646.23 102%
4 Customs 186694.00 118780.85 64% 151700.00 112008.10 74%
5 Union Excise Duties 194350.34 109210.88 56% 164115.66 93063.94 57%
6 Service Tax 124000.00 80926.75 65% 82000.00 60859.80 74%
7 Other taxes 2310.45 2617.19 113% 1973.22 2348.51 119%
(a) Direct Taxes 17.74 12.89
(b) Indirect Taxes 2599.45 2335.62
GROSS TAX REVENUE 1077611.79 681345.40 63% 932439.88 592347.65 64%
Of which netted against expenditure
(Surcharge for financing National
Calamity Contigency Fund) 4620.00 2796.82 61% 4525.00 2304.17 51%
Balance Gross Tax Revenue 1072991.79 678548.58 63% 927914.88 590043.48 64%
Less Assignment to States 301920.76 194392.16 64% 263457.74 169629.22 64%
NET TAX REVENUE 771071.03 484156.42 63% 664457.14 420414.26 63%
Annex II
TAX REVENUE
(` crore)2012-13 2011-12
DESCRIPTION BE ACTUALS % BE ACTUALS %upto 12/2012 upto 12/2011
(1) (2) (3) (4) (5) (6) (7)

15
A. Interest receipts 25230.68 27729.09 110% 29821.89 24724.05 83%Add Provisional Receipts onaccount of(i) Railway 0.00 0.00(ii) Telecom 0.00 0.00
Balance - Interest receipts 44169.58 27729.09 63% 43503.69 24724.05 57%Less - i) Receipts incidential to
Market Borrowing taken in reduction of cost of borrowing 5010.00 14821.62 296% 4344.11 7582.79 175%
ii) Waiver of Interest 990.00 990.00 100% 5900.00 5900.00 100%Net Interest Receipts 19230.68 11917.47 62% 19577.78 11241.26 57%
B. Dividends and Profits 50152.55 35721.50 71% 42623.68 31578.79 74%
C. Non-Tax Revenue of U.T.s 1135.78 841.12 74% 1169.35 637.15 54%
D. Other Non-Tax Revenue
Fiscal Services 119.32 28.34 24% 127.82 76.98 60%
Other General Services 22988.94 14843.32 65% 22001.31 12405.74 56%Less: Other Receipts utilised towrite-off loans etc. 1106.60 5.18 0% 1506.95 6.95 0%
Net - Other General Services 21882.34 14838.14 68% 20494.36 12398.79 60%
Social Services 1371.55 940.51 69% 2353.90 715.58 30%
Economic Services 91147.49 32451.70 36% 57606.69 30445.77 53%Less - (I) Other Receipts utilised to
write-off loans 3.00 0.00 0.00 0.00Net Economic Services 91144.49 32451.70 36% 57606.69 30445.77 53%Grants-in-Aid and Contributions 2887.20 1756.15 61% 2172.96 1999.47 92%
Total Other Non-Tax Revenue 117404.90 50014.84 43% 82755.73 45636.59 55%
Less : Commercial Departments 23310.30 12115.43 52% 20691.42 11016.80 53%
Net Other Non-Tax Revenue 94094.60 37899.41 40% 62064.31 34619.79 56%
Net Non-Tax Revenue (A+B+C+D) 164613.61 86379.50 52% 125435.12 78076.99 62%
Annex III
NON-TAX REVENUE
(` crore)2012-13 2011-12
DESCRIPTION BE ACTUALS % BE ACTUALS %Upto 12/2012 Upto 12/2011
(1) (2) (3) (4) (5) (6) (7)

16
1 (a) Market Loans includingShort term borrowings 488000.00 468357.37 96% 358000.00 384146.48 107%
(b) Receipt under MSS (Net) 20000.00 0.00 0% 20000.00 0.00 0%(c) Treasury Bills(14 days) 0.00 -9484.02 0.00 -33183.83
2 Securities against Small Savings 1197.52 -889.26 -74% 24182.46 -889.26 -4%3 (i) External Loans
Gross Borrowings 26047.94 13044.29 50% 26820.13 17051.84 64% Less Repayments 15899.74 12200.90 77% 12320.13 9967.24 81% Net Borrowings 10148.20 843.39 8% 14500.00 7084.60 49%(ii) Revolving Fund 6.82 -26.33Non-Debt Capital Receipts (4&5)
4 Recoveries of Loans and Advances Gross Recoveries 23095.20 8250.51 36% 26510.00 14433.96 54% Less Recoveries of Ways & MeansAdvances , Loans to Govt. Servantsand NAB 11445.00 540.39 5% 11490.00 319.37 3%Net Recoveries of Loans & Advances 11650.20 7710.12 66% 15020.00 14114.59 94%
5 Miscellaneous Capital Receipts 30000.00 8178.37 27% 40000.00 2742.89 7%(i) Disinvestment of Govt.’s Equity
Holdings 30000.00 8178.37 27% 40000.00 1144.55 3%(ii) Issue of Bonus Shares 0.00 0.00 0.00 1598.34(iii)Other Misc. Receipts 0.00 0.00 0.00 0.00
6 National Small Savings Fund 5005.48 22219.23 444% 94.21 8210.58(a) Small Savings, Public Provident
Funds 0.00 -685.26 65000.00 -9881.79 -15%(b) Investment in Securities 12122.24 15762.17 130% -58350.00 5595.14 -10%(c) Income & Expenditure of NSSF -7116.76 7142.32 -100% -6555.79 12497.23 -191%
7 State Provident Funds 12000.00 1657.34 14% 10000.00 3896.67 39%8 Public Accounts
(other than SPF& NSSF) 313.57 -9004.12 -2871% -9783.58 -22840.26 233%9 Other Internal Debt Receipts -3074.32 -1704.51 55% -4176.52 -8867.31 212%10 Ways & Means Advances 0.00 25141.0011 Investment (-)/disinvestment(+)
of Surplus Cash 0.00 16416.0012 Decrease in Cash Balance -67303.64 20000.00 1923.61 10%
(Including difference betweenRBI & A/C)
13 Cash held under MSS -20000.00 0.00 0% -20000.00 0.00 0%
TOTAL 555240.65 420587.09 76% 467836.57 397869.43 85%
Annex IV
CAPITAL RECEIPTS
(` crore)2012-13 2011-12
DESCRIPTION BE ACTUALS % BE ACTUALS %Upto 12/2012 Upto 12/2011
(1) (2) (3) (4) (5) (6) (7)

17
MINISTRY OF AGRICULTURE 25338.00 16266.79 64% 21522.87 15016.67 70%1 Department of Agriculture and
Cooperation 20208.00 13293.30 66% 17122.87 12155.00 71%2 Department of Agricultural Research
and EducationGross: 3220.00 1815.99 56% 2808.54 2053.45 73%Less : Recoveries: 0.00 0.00 8.54 48.50 568%Net 3220.00 1815.99 56% 2800.00 2004.95 72%
3 Department of Animal Husbandry,Dairying and Fisheries 1910.00 1157.50 61% 1600.00 856.72 54%
DEPARTMENT OF ATOMIC ENERGY 5600.00 1483.68 26% 5600.00 2097.79 37%4 Atomic Energy 4601.73 1477.99 32% 3991.00 1690.27 42%5 Nuclear Power Schemes 998.27 5.69 1% 1609.00 407.52 25%
MINISTRY OF CHEMICALS ANDFERTILISERS 2201.00 1617.41 73% 1200.00 1064.46 89%
6 Department of Chemicals andPetro-Chemicals 1757.00 1578.10 90% 800.00 904.05 113%
7 Department of Fertilisers 256.00 6.57 3% 225.00 129.67 58%8 Department of Pharmaceuticals 188.00 32.74 17% 175.00 30.74 18%
MINISTRY OF CIVIL AVIATION 4500.00 4021.15 89% 1700.00 1271.14 75%9 Ministry of Civil Aviation 4500.00 4021.15 89% 1700.00 1271.14 75%
MINISTRY OF COAL 450.00 286.61 64% 420.00 131.24 31%10 Ministry of Coal 450.00 286.61 64% 420.00 131.24 31%
MINISTRY OF COMMERCE ANDINDUSTRY 3465.00 2286.11 66% 3300.00 2021.74 61%
11 Department of Commerce 2100.00 1479.56 70% 2000.00 1279.02 64%12 Department of Industrial Policy &
Promotion 1365.00 806.55 59% 1300.00 742.72 57%
MINISTRY OF COMMUNICATIONSAND INFORMATION TECHNOLOGY 8600.00 3732.01 43% 7218.00 3136.60 43%13 Department of Posts 800.00 69.55 9% 800.00 147.88 18%14 Department of Telecommunications
Gross 7800.00 2820.91 36% 5518.00 3198.32 58%Less : Recoveries 3000.00 362.55 12% 2100.00 1450.48 69%Net 4800.00 2458.36 51% 3418.00 1747.84 51%
15 Department of Information Technology 3000.00 1204.10 40% 3000.00 1240.88 41%
MINISTRY OF CONSUMER AFFAIRS,FOOD AND PUBLIC DISTRIBUTION 367.00 102.05 28% 345.00 153.92 45%16 Department of Consumer Affairs 241.00 65.75 27% 225.00 112.90 50%17 Department of Food and Public
Distibution 126.00 36.30 29% 120.00 41.02 34%
Annex V
PLAN EXPENDITURE
(` crore)GRANT MINISTRY/ 2012-13 2011-12 NO. DEPARTMENT BE ACTUALS % BE ACTUALS %
Upto 12/2012 Upto 12/2011(1) (2) (3) (4) (5) (6) (7) (8)

18
MINISTRY OF CORPORATE AFFAIRS 32.00 20.61 64% 28.00 16.03 57%18 Ministry of Corporate Affairs 32.00 20.61 64% 28.00 16.03 57%
MINISTRY OF CULTURE 864.00 563.01 65% 785.00 503.32 64%19 Ministry of Culture 864.00 563.01 65% 785.00 503.32 64%
MINISTRY OF DEVELOPMENT OFNORTH EASTERN REGION 1905.00 1225.86 64% 1741.00 1292.74 74%28 Ministry of Development of North
Eastern RegionGross 2075.00 1301.03 63% 1911.00 1292.74 68%Less : Recoveries 170.00 75.17 44% 170.00 0.00 0%Net 1905.00 1225.86 64% 1741.00 1292.74 74%
MINISTRY OF EARTH SCIENCES 1281.00 558.81 44% 1220.00 533.05 44%29 Ministry of Earth Sciences 1281.00 558.81 44% 1220.00 533.05 44%
MINISTRY OF ENVIRONMENTAND FORESTS 2430.00 1010.35 42% 2300.00 1387.38 60%30 Ministry of Environment and Forests
Gross 2630.00 1010.64 38% 2300.00 1387.38 60%Less : Recoveries 200.00 0.29 0% 0.00 0.00Net 2430.00 1010.35 42% 2300.00 1387.38 60%
MINISTRY OF EXTERNAL AFFAIRS 1500.00 1184.74 79% 800.00 623.16 78%31 Ministry of External Affairs 1500.00 1184.74 79% 800.00 623.16 78%
MINISTRY OF FINANCE 119675.00 56737.65 47% 90636.61 52141.96 58%32 Department of Economic Affairs
Gross 5142.45 2755.31 54% 3080.63 2716.14 88%Less : Recoveries 1102.45 826.83 75% 1040.63 780.45 75%Net 4040.00 1928.48 48% 2040.00 1935.69 95%
33 Department of Financial Services 16088.00 1300.00 8% 7850.00 110.83 1%35 Transfers to State and UT Governments
Gross 106908.00 53510.99 50% 88473.61 50093.60 57%Less : Recoveries 7365.00 4.07 0% 7732.00 0.00 0%Net 99543.00 53506.92 54% 80741.61 50093.60 62%
38 Department of Expenditure 4.00 2.25 56% 5.00 1.84 37%
MINISTRY OF FOOD PROCESSINGINDUSTRIES 660.00 464.85 70% 600.00 350.84 58%
45 Ministry of Food ProcessingIndustries 660.00 464.85 70% 600.00 350.84 58%
MINISTRY OF HEALTH ANDFAMILY WELFARE 30477.00 16535.34 54% 26760.00 16520.08 62%
46 Department of Health andFamily Welfare 27127.00 14790.11 55% 23560.00 14712.29 62%
47 Department of Ayurveda, Yoga &Naturopathy,Unani, Siddha andHomoeopathy (Ayush) 990.00 352.45 36% 900.00 397.16 44%
48 Department of Health Research 660.00 376.65 57% 600.00 393.94 66%49 Department of Aids Control 1700.00 1016.13 60% 1700.00 1016.69 60%
MINISTRY OF HEAVY INDUSTRIESAND PUBLIC ENTERPRISES 566.00 347.05 61% 410.00 363.18 89%
50 Department of Heavy Industry 553.00 343.03 62% 399.00 356.47 89%51 Department of Public Enterprises 13.00 4.02 31% 11.00 6.71 61%
(1) (2) (3) (4) (5) (6) (7) (8)

19
MINISTRY OF HOME AFFAIRS 12140.89 4910.61 40% 11562.29 3808.52 33%52 Ministry of Home Affairs 2139.01 693.50 32% 3237.00 786.27 24%54 Police 8045.99 3273.03 41% 6435.00 2558.54 40%55 Other Expenditure of the Ministry
of Home Affairs 315.00 119.40 38% 328.00 83.44 25%56 Transfers to UT Govts. 1640.89 824.68 50% 1562.29 380.27 24%
MINISTRY OF HOUSING ANDURBAN POVERTY ALLEVIATION 1155.00 565.46 49% 1100.00 753.68 69%57 Ministry of Housing and Urban
Poverty Alleviation 1155.00 565.46 49% 1100.00 753.68 69%
MINISTRY OF HUMAN RESOURCEDEVELOPMENT 61407.00 43473.90 71% 52057.00 39787.83 76%
58 Department of School Educationand Literacy
Gross 64584.08 33937.80 53% 57483.33 41485.50 72%Less : Rec. (prarambik shikshakosh/National Inv. Fund 18615.08 0.00 0% 18526.33 10692.88 58%Net 45969.00 33937.80 74% 38957.00 30792.62 79%
59 Department of Higher Education 15438.00 9536.10 62% 13100.00 8995.21 69%
MINISTRY OF INFORMATIONAND BROADCASTING 905.00 410.05 45% 861.00 491.04 57%
60 Ministry of Information andBroadcasting 905.00 410.05 45% 861.00 491.04 57%
MINISTRY OF LABOUR ANDEMPLOYMENT 2403.88 1220.99 51% 1248.25 836.18 67%
61 Ministry of Labour and EmploymentGross 2522.44 1220.99 48% 1988.25 836.18 42%Less : Recoveries 118.56 0.00 0% 740.00 0.00 0%Net 2403.88 1220.99 51% 1248.25 836.18 67%
MINISTRY OF LAW AND JUSTICE 1050.00 622.33 59% 1000.00 306.93 31%63 Law and Justice 1050.00 622.33 59% 1000.00 306.93 31%
MINISTRY OF MICRO, SMALLAND MEDIUM ENTERPRISE 2835.00 1414.96 50% 2700.00 1399.42 52%
65 Ministry of Micro, Small andMedium Enterprises 2835.00 1414.96 50% 2700.00 1399.42 52%
MINISTRY OF MINES 232.00 162.33 70% 214.00 221.35 103%66 Ministry of Mines 232.00 162.33 70% 214.00 221.35 103%
MINISTRY OF MINORITY AFFAIRS 3135.00 1576.13 50% 2850.00 1411.10 50%67 Ministry of Minority Affairs 3135.00 1576.13 50% 2850.00 1411.10 50%
MINISTRY OF NEW ANDRENEWABLE ENERGY 1383.00 822.16 59% 1198.00 856.54 71%
68 Ministry of New and Renewable EnergyGross 1423.43 827.15 58% 1198.00 856.54 71%Less : Recoveries 40.43 4.99 12%Net 1383.00 822.16 59% 1198.00 856.54 71%
MINISTRY OF PANCHAYATI RAJ 5350.00 2043.23 38% 5250.00 2181.31 42%70 Ministry of Panchayati Raj 5350.00 2043.23 38% 5250.00 2181.31 42%
MINISTRY OF PERSONNEL, PUBLICGRIEVANCES & PENSIONS 279.00 107.22 38% 260.00 89.06 34%
72 Ministry of Personnel, PublicGrievances and Pensions 279.00 107.22 38% 260.00 89.06 34%
(1) (2) (3) (4) (5) (6) (7) (8)
20
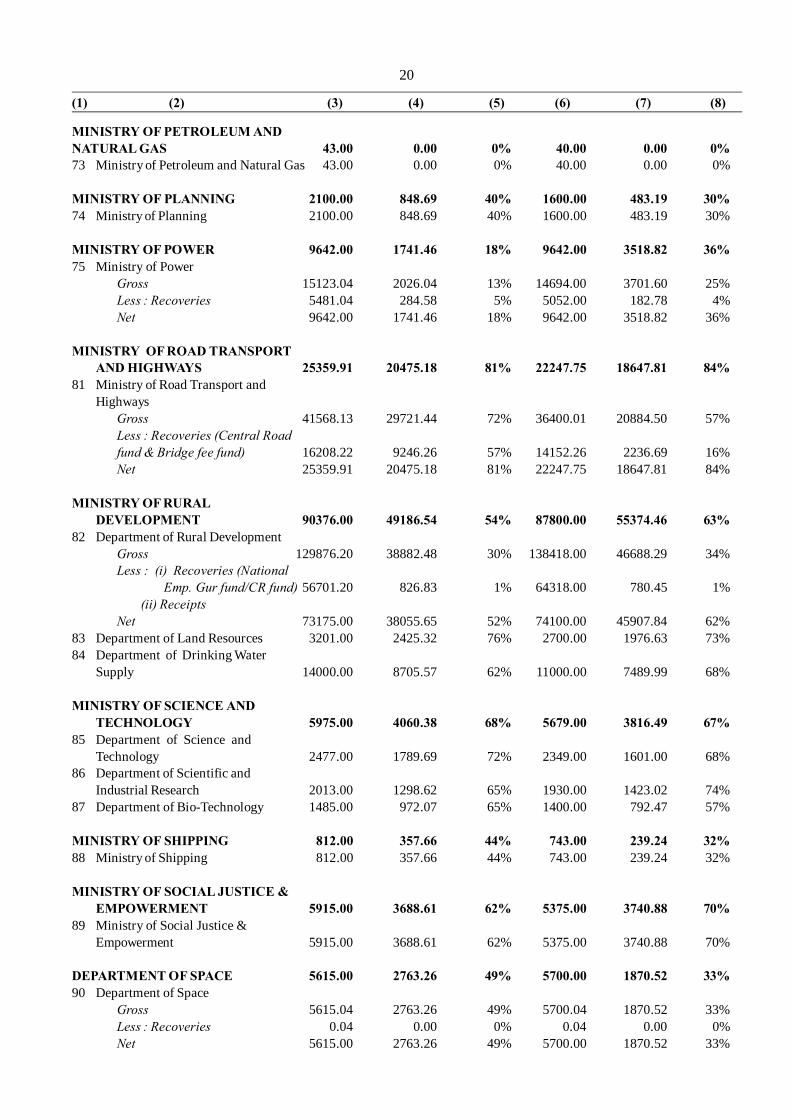
MINISTRY OF PETROLEUM ANDNATURAL GAS 43.00 0.00 0% 40.00 0.00 0%73 Ministry of Petroleum and Natural Gas 43.00 0.00 0% 40.00 0.00 0%
MINISTRY OF PLANNING 2100.00 848.69 40% 1600.00 483.19 30%74 Ministry of Planning 2100.00 848.69 40% 1600.00 483.19 30%
MINISTRY OF POWER 9642.00 1741.46 18% 9642.00 3518.82 36%75 Ministry of Power
Gross 15123.04 2026.04 13% 14694.00 3701.60 25%Less : Recoveries 5481.04 284.58 5% 5052.00 182.78 4%Net 9642.00 1741.46 18% 9642.00 3518.82 36%
MINISTRY OF ROAD TRANSPORTAND HIGHWAYS 25359.91 20475.18 81% 22247.75 18647.81 84%
81 Ministry of Road Transport andHighways
Gross 41568.13 29721.44 72% 36400.01 20884.50 57%Less : Recoveries (Central Roadfund & Bridge fee fund) 16208.22 9246.26 57% 14152.26 2236.69 16%Net 25359.91 20475.18 81% 22247.75 18647.81 84%
MINISTRY OF RURALDEVELOPMENT 90376.00 49186.54 54% 87800.00 55374.46 63%
82 Department of Rural DevelopmentGross 129876.20 38882.48 30% 138418.00 46688.29 34%Less : (i) Recoveries (National
Emp. Gur fund/CR fund) 56701.20 826.83 1% 64318.00 780.45 1%(ii) Receipts
Net 73175.00 38055.65 52% 74100.00 45907.84 62%83 Department of Land Resources 3201.00 2425.32 76% 2700.00 1976.63 73%84 Department of Drinking Water
Supply 14000.00 8705.57 62% 11000.00 7489.99 68%
MINISTRY OF SCIENCE ANDTECHNOLOGY 5975.00 4060.38 68% 5679.00 3816.49 67%
85 Department of Science andTechnology 2477.00 1789.69 72% 2349.00 1601.00 68%
86 Department of Scientific andIndustrial Research 2013.00 1298.62 65% 1930.00 1423.02 74%
87 Department of Bio-Technology 1485.00 972.07 65% 1400.00 792.47 57%
MINISTRY OF SHIPPING 812.00 357.66 44% 743.00 239.24 32%88 Ministry of Shipping 812.00 357.66 44% 743.00 239.24 32%
MINISTRY OF SOCIAL JUSTICE &EMPOWERMENT 5915.00 3688.61 62% 5375.00 3740.88 70%
89 Ministry of Social Justice &Empowerment 5915.00 3688.61 62% 5375.00 3740.88 70%
DEPARTMENT OF SPACE 5615.00 2763.26 49% 5700.00 1870.52 33%90 Department of Space
Gross 5615.04 2763.26 49% 5700.04 1870.52 33%Less : Recoveries 0.04 0.00 0% 0.04 0.00 0%Net 5615.00 2763.26 49% 5700.00 1870.52 33%
(1) (2) (3) (4) (5) (6) (7) (8)

21
MINISTRY OF STATISTICS ANDPROGRAMME IMPLEMENTATION 4586.00 2783.80 61% 2180.00 1793.98 82%91 Ministry of Statistics and Programme
Implementation 4586.00 2783.80 61% 2180.00 1793.98 82%
MINISTRY OF STEEL 46.00 10.69 23% 40.00 9.51 24%92 Ministry of Steel 46.00 10.69 23% 40.00 9.51 24%
MINISTRY OF TEXTILES 7000.00 2701.35 39% 5000.00 2829.90 57%93 Ministry of Textiles 7000.00 2701.35 39% 5000.00 2829.90 57%
MINISTRY OF TOURISM 1210.00 639.48 53% 1100.00 823.16 75%94 Ministry of Tourism 1210.00 639.48 53% 1100.00 823.16 75%
MINISTRY OF TRIBAL AFFAIRS 4090.00 2533.35 62% 3723.01 2613.09 70%95 Ministry of Tribal Affairs 4090.00 2533.35 62% 3723.01 2613.09 70%
U.T.s WITHOUT LEGISLATURE 4015.20 2106.29 52% 3140.22 1775.38 57%96 Andaman & Nicobar Islands 1701.43 894.78 53% 1430.45 733.88 51%97 Chandigarh 737.23 318.05 43% 661.89 428.73 65%98 Dadra & Nagar Haveli 607.68 412.45 68% 334.14 205.60 62%99 Daman & Diu 568.25 297.99 52% 324.95 200.96 62%100 Lakshadweep 400.61 183.02 46% 388.79 206.21 53%
MINISTRY OF URBANDEVELOPMENT 7012.12 5368.45 77% 6279.75 4420.57 70%
101 Department of Urban Development 6783.25 5261.54 78% 6068.76 4326.63 71%102 Public Works 228.87 106.91 47% 210.99 93.94 45%
MINISTRY OF WATER RESOURCES 1500.00 399.11 27% 720.00 358.61 50%104 Ministry of Water Resources
Gross 1512.00 407.17 27% 732.00 366.48 50%Less : Recoveries 12.00 8.06 67% 12.00 7.87 66%Net 1500.00 399.11 27% 720.00 358.61 50%
MINISTRY OF WOMEN AND CHILDDEVELOPMENT 18500.00 13092.94 71% 12650.00 11506.45 91%
105 Ministry of Women and ChildDevelopment 18500.00 13092.94 71% 12650.00 11506.45 91%
MINISTRY OF YOUTH AFFAIRS &SPORTS 1041.00 695.01 67% 1000.00 608.43 61%
106 Ministry of Youth Affairs and Sports 1041.00 695.01 67% 1000.00 608.43 61%
RAILWAYS 24000.00 16663.99 69% 20000.00 11704.96 59%Ministry of Railways
Gross 16680.21 11723.56Less : Exp.met from Receipts 16.22 18.60Exp. Met from Reserve Funds 0.00 0.00Net 24000.00 16663.99 69% 20000.00 11704.96 59%
GRAND TOTAL 521025.00 295889.69 57% 441546.75 276903.71 63%
(1) (2) (3) (4) (5) (6) (7) (8)

22
NON-PLAN EXPENDITURE
(` crore)2012-2013 2011-12
GRANT MINISTRY/ BE ACTUALS % BE ACTUALS % NO. DEPARTMENT Upto 12/2012 Upto 12/2011
MINISTRY OF AGRICULTURE 2593.59 1939.84 75% 2653.85 1868.96 70%1 Department of Agriculture and
Cooperation 322.22 261.86 81% 400.00 144.68 36%2 Department of Agricultural Research
and Education 2172.00 1615.30 74% 2157.60 1614.54 75%3 Department of Animal Husbandry,
Dairying and FisheriesGross 451.37 317.16 70% 437.95 336.63 77%Less : Receipts 352.00 254.48 72% 341.70 226.89 66%Net 99.37 62.68 63% 96.25 109.74 114%
DEPARTMENT OF ATOMICENERGY 3632.00 3536.84 97% 3752.46 2994.09 80%
4 Atomic EnergyGross 4786.60 4308.95 90% 5096.26 3737.20 73%Less : Receipts 1601.60 987.02 62% 1331.00 1000.56 75%Recoveries 136.00 126.82 93% 153.85 70.47 46%Net 3049.00 3195.11 105% 3611.41 2666.17 74%
5 Nuclear Power SchemesGross 3523.00 2363.19 67% 7787.38 7224.92 93%Less : Receipts 2940.00 2021.46 69% 7646.33 6897.00 90%Net 583.00 341.73 59% 141.05 327.92 232%
MINISTRY OF CHEMICALSAND FERTILISERS 61088.71 59564.81 98% 50080.00 55636.49 111%
6 Department of Chemicalsand Petro-Chemicals 45.62 40.18 88% 22.00 305.08 1387%
7 Department of FertilisersGross 65618.00 61664.59 94% 53612.00 58485.80 109%Less : Recoveries 4618.00 2172.05 47% 3592.00 3188.23 89%Net 61000.00 59492.54 98% 50020.00 55297.57 111%
8 Department of Pharmaceuticals 43.09 32.09 74% 38.00 33.84 89%
MINISTRY OF CIVIL AVIATION 738.80 697.64 94% 693.88 544.20 78%9 Ministry of Civil Aviation
Gross 738.84 697.64 94% 693.92 544.20 78% Less : Recoveries 0.04 0.00 0% 0.04 0.00 0%
Net 738.80 697.64 94% 693.88 544.20 78%
MINISTRY OF COAL 48.35 28.23 58% 48.72 16.06 33%10 Ministry of Coal
Gross 78.35 58.13 74% 78.72 45.06 57% Less : Recoveries 30.00 29.90 100% 30.00 29.00 97%
Net 48.35 28.23 58% 48.72 16.06 33%
MINISTRY OF COMMERCE ANDINDUSTRY 3125.25 2460.47 79% 4700.58 2318.84 49%
11 Department of CommerceGross 2927.50 2338.25 80% 4516.08 2186.26 48%
Annex VI

(1) (2) (3) (4) (5) (6) (7) (8)
Less : Recoveries 4.50 16.14 359% 4.50 8.49 189%Net 2923.00 2322.11 79% 4511.58 2177.77 48%
12 Department of Industrial Policy andPromotion
Gross 202.25 138.36 68% 189.01 141.12 75% Less : Recoveries 0.00 0.00 0.01 0.05 500%
Net 202.25 138.36 68% 189.00 141.07 75%
MINISTRY OF COMMUNICATIONSAND INFORMATIONTECHNOLOGY 11082.16 12628.76 114% 9332.06 11283.95 121%
13 Department of PostsGross 14195.48 11554.14 81% 13240.48 10339.38 78%Less : Receipts 7793.31 2962.44 38% 7517.70 2556.02 34%Recoveries 665.05 46.99 7% 695.11 44.18 6%Net 5737.12 8544.71 149% 5027.67 7739.18 154%
14 Department of Telecommunications 5294.04 4049.66 76% 4255.78 3513.16 83%15 Department of Information Technology 51.00 34.39 67% 48.61 31.61 65%
MINISTRY OF CONSUMERAFFAIRS, FOOD AND PUBLICDISTRIBUTION 76502.45 77771.47 102% 61841.57 57149.79 92%
16 Department of Consumer AffairsGross 383.09 289.29 76% 375.36 241.95 64%
Less :Recoveries 21.80 0.00 0% 19.80 1.12 6%Net 361.29 289.29 80% 355.56 240.83 68%
17 Department of Food & PublicDistribution .
Gross 86835.66 77836.39 90% 72211.32 57222.30 79%Less: Receipts 10000.00 0.00 0% 10000.00 0.00 0%Recoveries 694.50 354.21 51% 725.31 313.34 43%Net 76141.16 77482.18 102% 61486.01 56908.96 93%
MINISTRY OF CORPORATEAFFAIRS 213.50 145.90 68% 210.94 138.84 66%
18 Ministry of Corporate Affairs 213.50 145.90 68% 210.94 138.84 66%
MINISTRY OF CULTURE 583.00 445.51 76% 553.00 422.53 76%19 Ministry of Culture 583.00 445.51 76% 553.00 422.53 76%
MINISTRY OF DEFENCE 238205.53 167015.73 70% 202572.30 151759.40 75%20 Ministry of Defence
Gross 16598.24 10209.97 62% 13156.81 10665.74 81%Less : Receipts 10800.00 6366.37 59% 9000.00 5499.52 61%Net 5798.24 3843.60 66% 4156.81 5166.22 124%
21 Defence Pensions 39000.00 27050.59 69% 34000.00 24204.67 71%DEFENCE SERVICES 193407.29 136121.54 70% 164415.49 122388.51 74%
22 Defence Services-ArmyGross 80025.82 60761.91 76% 65985.05 53384.08 81%Less : Receipts 1869.64 1280.48 68% 1695.62 1208.78 71%Recoveries 41.82 0.00 0% 37.88 0.00 0%Net 78114.36 59481.43 76% 64251.55 52175.30 81%
23 Defence Services-NavyGross 12748.02 8553.19 67% 10789.06 8618.82 80%Less : Receipts 200.00 308.09 154% 200.00 84.92 42%Net 12548.02 8245.10 66% 10589.06 8533.90 81%
23

(1) (2) (3) (4) (5) (6) (7) (8)
24 Defence Services-Air ForceGross 18325.19 12913.81 70% 16520.87 12229.57 74%Less : Receipts 619.38 448.06 72% 592.92 379.98 64%Net 17705.81 12465.75 70% 15927.95 11849.59 74%
25 Defence Ordnance FactoriesGross 1801.68 2811.42 156% 795.88 2327.25 292%Less : Receipts 1836.77 1084.52 59% 1647.63 1061.64 64%Recoveries 500.00 0.00 0% 325.00 0.00 0%Net -535.09 1726.90 -323% -1176.75 1265.61 -108%
26 Defence Services - Research andDevelopment
Gross 6035.56 3691.51 61% 5659.87 3787.94 67%Less : Receipts 40.00 197.04 493% 35.00 29.25 84%Net 5995.56 3494.47 58% 5624.87 3758.69 67%
27 Capital Outlay on Defence Services 79578.63 50707.89 64% 69198.81 44805.42 65%
MINISTRY OF DEVELOPMENT OFNORTH EASTERN REGION 24.33 20.30 83% 21.58 19.62 91%
28 Ministry of Development of NorthEastern Region 24.33 20.30 83% 21.58 19.62 91%
MINISTRY OF EARTH SCIENCES 387.00 297.53 77% 347.00 269.24 78%29 Ministry of Earth Sciences
Gross 391.39 299.35 76% 349.22 269.61 77% Less :Recoveries 4.39 1.82 41% 2.22 0.37 17%
Net 387.00 297.53 77% 347.00 269.24 78%
MINISTRY OF ENVIRONMENTAND FORESTS 199.41 159.08 80% 191.97 148.90 78%
30 Ministry of Environment and ForestsGross 452.41 228.42 50% 441.97 294.23 67%Less :Receipt 253.00 69.34 27% 250.00 145.33 58%Net 199.41 159.08 80% 191.97 148.90 78%
MINISTRY OF EXTERNALAFFAIRS 8161.97 5417.13 66% 6306.00 4642.56 74%
31 Ministry of External Affairs 8161.97 5417.13 66% 6306.00 4642.56 74%
MINISTRY OF FINANCE 435380.00 261000.44 60% 374130.52 242238.23 65%32 Department of Economic Affairs
Gross 62899.98 7653.82 12% 18551.59 11792.12 64%Less :Recoveries 1651.65 0.25 0% 1590.60 514.95 32%Receipts 42123.32 0.00 0% 8767.75 0.00 0%Net 19125.01 7653.57 40% 8193.24 11277.17 138%
33 Department of Financial ServicesGross 8349.24 4826.53 58% 15855.94 2873.84 18%Less : Recoveries 0.01 239.23 6000.00 1267.12 21%Net 8349.23 4587.30 55% 9855.94 1606.72 16%
34 Interest PaymentsGross 324769.43 216780.43 67% 272330.28 187011.81 69%Less : Receipts 5010.00 14821.62 296% 4344.11 7582.79 175%Net 319759.43 201958.81 63% 267986.17 179429.02 67%
35 Transfers to State and UT GovernmentsGross 69022.46 29815.80 43% 60173.62 29002.27 48%
24

(1) (2) (3) (4) (5) (6) (7) (8)
Less : Receipts 5720.00 2796.82 49% 6025.00 2304.17 38%Recoveries 4620.00 1002.50 22% 4525.00 455.26 10%Net 58682.46 26016.48 44% 49623.62 26242.84 53%
36 Loans to Govt. Servants etc.Gross 250.00 129.90 52% 300.00 149.69 50%Less : Receipts 445.00 286.72 64% 490.00 319.37 65%Net -195.00 -156.82 80% -190.00 -169.68 89%
37 Repayment of DebtGross (Excluding MSS) 3786074.35 2476387.71 65% 3155216.93 2675894.24 85%Less : Receipts 3786074.35 2476387.71 65% 3155216.93 2675894.24 85%Net 0.00 0.00 0.00 0.00
38 Department of Expenditure 131.25 75.23 57% 96.97 76.84 79%39 Pensions
Gross 19800.00 13456.14 68% 17000.00 12385.04 73%Less : Receipts 1000.00 0.00 0% 1000.00 0.00 0%Net 18800.00 13456.14 72% 16000.00 12385.04 77%
40 Indian Audit and Accounts DepartmentGross 2568.49 2117.87 82% 2398.56 1913.52 80%Less :Recoveries 152.79 171.49 112% 145.48 139.42 96%Net 2415.70 1946.38 81% 2253.08 1774.10 79%
41 Department of RevenueGross 1178.59 511.53 43% 13356.90 5050.48 38%Less : Receipts 366.73 266.41 73% 312.00 289.77 93%Recoveries 42.22 0.00 0% 53.97 0.00 0%Net 769.64 245.12 32% 12990.93 4760.71 37%
42 Direct TaxesGross 3880.46 2487.08 64% 3881.55 2351.29 61%Less :Recoveries 2.00 1.09 55% 2.00 5.59 280%Net 3 878.46 2485.99 64% 3879.55 2345.70 60%
43 Indirect TaxesGross 3601.08 2719.77 76% 3378.89 2492.96 74%Less : Recoveries 0.50 0.29 58% 0.50 0.42 84%Net 3600.58 2719.48 76% 3378.39 2492.54 74%
44 Department of Disinvestment 63.24 12.76 20% 62.63 17.23 28%
MINISTRY OF FOOD PROCESSINGINDUSTRIES 10.54 7.58 72% 10.09 6.27 62%
45 Ministry of Food Processing Industries 10.54 7.58 72% 10.09 6.27 62%
MINISTRY OF HEALTH ANDFAMILY WELFARE 4011.00 3691.13 92% 3696.00 3081.80 83%
46 Department of Health and FamilyWelfare
Gross 5853.29 4289.79 73% 5341.33 3672.80 69%Less :Recoveries 2278.29 915.32 40% 2004.33 844.07 42%Net 3575.00 3374.47 94% 3337.00 2828.73 85%
Department of Ayurveda, Yoga &Naturopathy,Unani, Siddha andHomoeopathy (Ayush)" 188.00 136.66 73% 188.00 124.86 66%
48 Department of Health Research 248.00 180.00 73% 171.00 128.21 75%
MINISTRY OF HEAVY INDUSTRIESAND PUBLIC ENTERPRISES 465.60 220.12 47% 464.34 183.56 40%
50 Department of Heavy Industry 456.67 213.55 47% 456.65 177.37 39%51 Department of Public Enterprises 8.93 6.57 74% 7.69 6.19 80%
25
(1) (2) (3) (4) (5) (6) (7) (8)
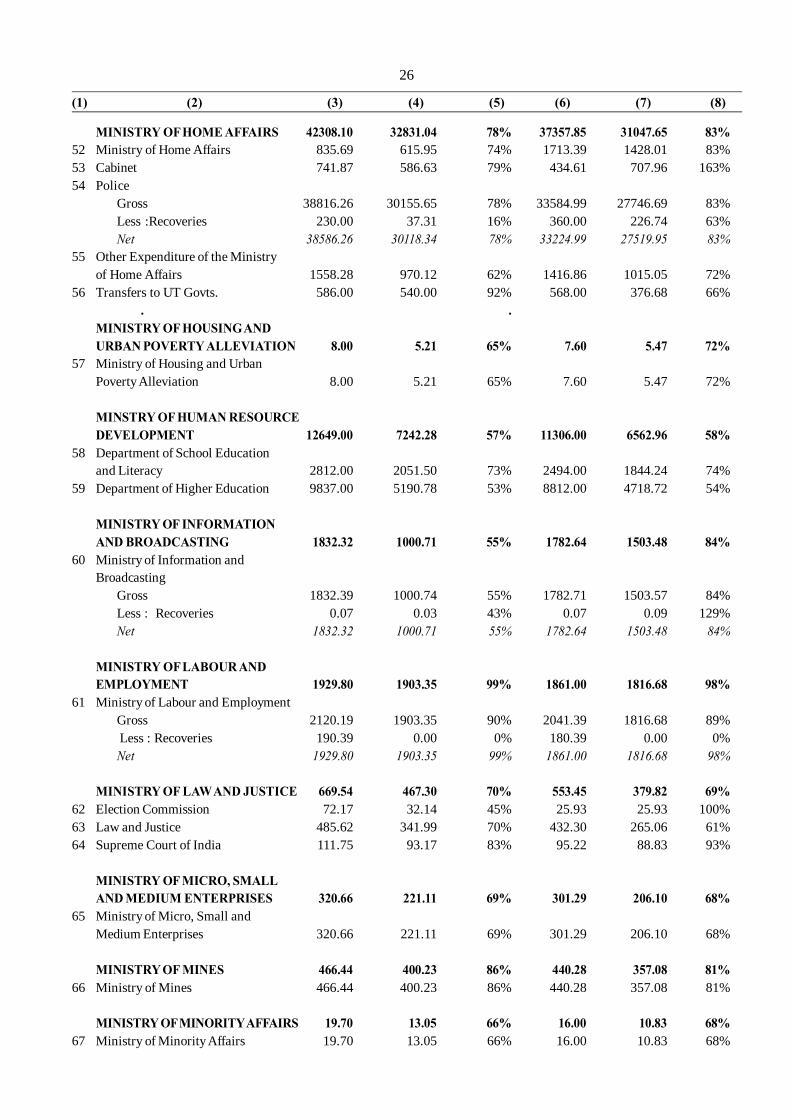
MINISTRY OF HOME AFFAIRS 42308.10 32831.04 78% 37357.85 31047.65 83%52 Ministry of Home Affairs 835.69 615.95 74% 1713.39 1428.01 83%53 Cabinet 741.87 586.63 79% 434.61 707.96 163%54 Police
Gross 38816.26 30155.65 78% 33584.99 27746.69 83%Less :Recoveries 230.00 37.31 16% 360.00 226.74 63%Net 38586.26 30118.34 78% 33224.99 27519.95 83%
55 Other Expenditure of the Ministryof Home Affairs 1558.28 970.12 62% 1416.86 1015.05 72%
56 Transfers to UT Govts. 586.00 540.00 92% 568.00 376.68 66%. .
MINISTRY OF HOUSING ANDURBAN POVERTY ALLEVIATION 8.00 5.21 65% 7.60 5.47 72%
57 Ministry of Housing and UrbanPoverty Alleviation 8.00 5.21 65% 7.60 5.47 72%
MINSTRY OF HUMAN RESOURCEDEVELOPMENT 12649.00 7242.28 57% 11306.00 6562.96 58%
58 Department of School Educationand Literacy 2812.00 2051.50 73% 2494.00 1844.24 74%
59 Department of Higher Education 9837.00 5190.78 53% 8812.00 4718.72 54%
MINISTRY OF INFORMATIONAND BROADCASTING 1832.32 1000.71 55% 1782.64 1503.48 84%
60 Ministry of Information andBroadcasting
Gross 1832.39 1000.74 55% 1782.71 1503.57 84%Less : Recoveries 0.07 0.03 43% 0.07 0.09 129%Net 1832.32 1000.71 55% 1782.64 1503.48 84%
MINISTRY OF LABOUR ANDEMPLOYMENT 1929.80 1903.35 99% 1861.00 1816.68 98%
61 Ministry of Labour and EmploymentGross 2120.19 1903.35 90% 2041.39 1816.68 89%
Less : Recoveries 190.39 0.00 0% 180.39 0.00 0%Net 1929.80 1903.35 99% 1861.00 1816.68 98%
MINISTRY OF LAW AND JUSTICE 669.54 467.30 70% 553.45 379.82 69%62 Election Commission 72.17 32.14 45% 25.93 25.93 100%63 Law and Justice 485.62 341.99 70% 432.30 265.06 61%64 Supreme Court of India 111.75 93.17 83% 95.22 88.83 93%
MINISTRY OF MICRO, SMALLAND MEDIUM ENTERPRISES 320.66 221.11 69% 301.29 206.10 68%
65 Ministry of Micro, Small andMedium Enterprises 320.66 221.11 69% 301.29 206.10 68%
MINISTRY OF MINES 466.44 400.23 86% 440.28 357.08 81%66 Ministry of Mines 466.44 400.23 86% 440.28 357.08 81%
MINISTRY OF MINORITY AFFAIRS 19.70 13.05 66% 16.00 10.83 68%67 Ministry of Minority Affairs 19.70 13.05 66% 16.00 10.83 68%
26
(1) (2) (3) (4) (5) (6) (7) (8)
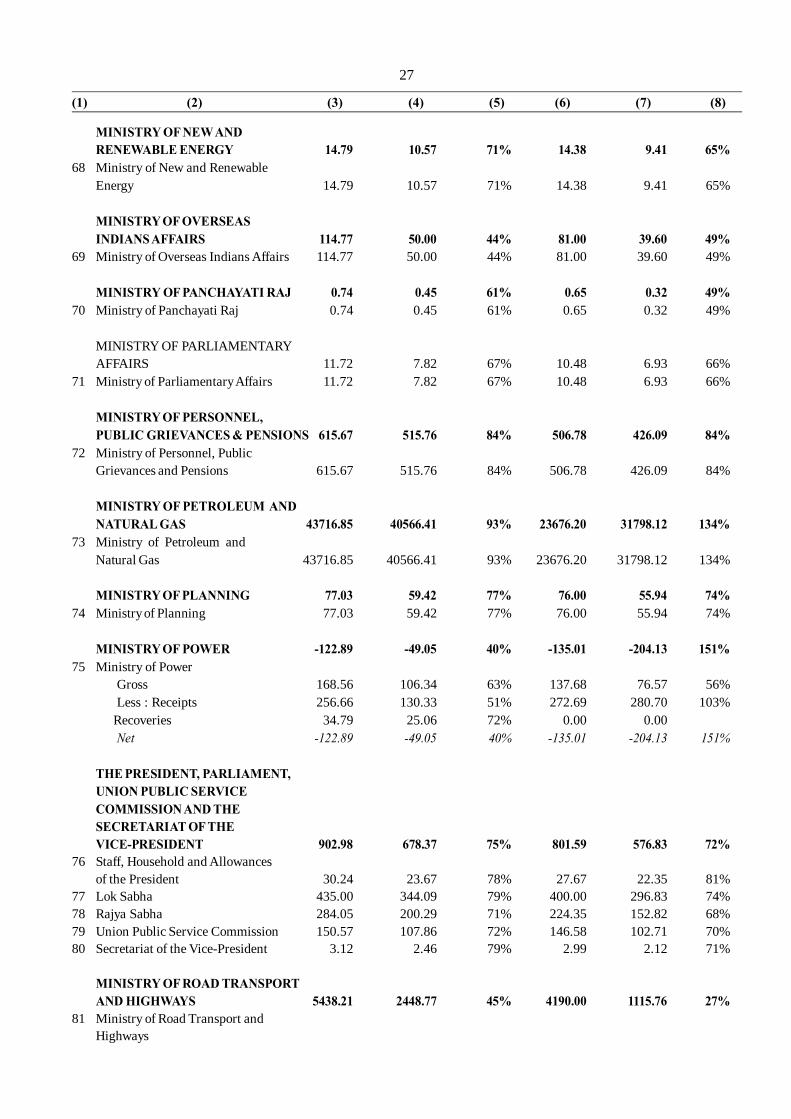
MINISTRY OF NEW ANDRENEWABLE ENERGY 14.79 10.57 71% 14.38 9.41 65%
68 Ministry of New and RenewableEnergy 14.79 10.57 71% 14.38 9.41 65%
MINISTRY OF OVERSEASINDIANS AFFAIRS 114.77 50.00 44% 81.00 39.60 49%
69 Ministry of Overseas Indians Affairs 114.77 50.00 44% 81.00 39.60 49%
MINISTRY OF PANCHAYATI RAJ 0.74 0.45 61% 0.65 0.32 49%70 Ministry of Panchayati Raj 0.74 0.45 61% 0.65 0.32 49%
MINISTRY OF PARLIAMENTARYAFFAIRS 11.72 7.82 67% 10.48 6.93 66%
71 Ministry of Parliamentary Affairs 11.72 7.82 67% 10.48 6.93 66%
MINISTRY OF PERSONNEL,PUBLIC GRIEVANCES & PENSIONS 615.67 515.76 84% 506.78 426.09 84%
72 Ministry of Personnel, PublicGrievances and Pensions 615.67 515.76 84% 506.78 426.09 84%
MINISTRY OF PETROLEUM ANDNATURAL GAS 43716.85 40566.41 93% 23676.20 31798.12 134%
73 Ministry of Petroleum andNatural Gas 43716.85 40566.41 93% 23676.20 31798.12 134%
MINISTRY OF PLANNING 77.03 59.42 77% 76.00 55.94 74%74 Ministry of Planning 77.03 59.42 77% 76.00 55.94 74%
MINISTRY OF POWER -122.89 -49.05 40% -135.01 -204.13 151%75 Ministry of Power
Gross 168.56 106.34 63% 137.68 76.57 56%Less : Receipts 256.66 130.33 51% 272.69 280.70 103%
Recoveries 34.79 25.06 72% 0.00 0.00Net -122.89 -49.05 40% -135.01 -204.13 151%
THE PRESIDENT, PARLIAMENT,UNION PUBLIC SERVICECOMMISSION AND THESECRETARIAT OF THEVICE-PRESIDENT 902.98 678.37 75% 801.59 576.83 72%
76 Staff, Household and Allowancesof the President 30.24 23.67 78% 27.67 22.35 81%
77 Lok Sabha 435.00 344.09 79% 400.00 296.83 74%78 Rajya Sabha 284.05 200.29 71% 224.35 152.82 68%79 Union Public Service Commission 150.57 107.86 72% 146.58 102.71 70%80 Secretariat of the Vice-President 3.12 2.46 79% 2.99 2.12 71%
MINISTRY OF ROAD TRANSPORTAND HIGHWAYS 5438.21 2448.77 45% 4190.00 1115.76 27%
81 Ministry of Road Transport andHighways
27

(1) (2) (3) (4) (5) (6) (7) (8)
Gross 5578.22 2493.83 45% 4340.50 1169.05 27%Less : Recoveries 140.01 45.06 32% 150.50 53.29 35%Net 5438.21 2448.77 45% 4190.00 1115.76 27%
MINISTRY OF RURALDEVELOPMENT 59.26 43.32 73% 55.16 47.92 87%
82 Department of Rural Development 46.82 33.01 71% 43.72 38.54 88%83 Department of Land Resources 7.20 5.83 81% 6.20 5.57 90%84 Department of Drinking Water and
Sanitation 5.24 4.48 85% 5.24 3.81 73%
MINISTRY OF SCIENCE ANDTECHNOLOGY 1882.61 1411.42 75% 1865.92 1389.34 74%
85 Department of Science and TechnologyGross 405.86 316.95 78% 393.64 280.30 71%Less : Recoveries 9.64 20.47 212% 9.64 3.70 38%Net 396.22 296.48 75% 384.00 276.60 72%
86 Department of Scientific andIndustrial Research 1471.00 1102.37 75% 1455.00 1089.57 75%
87 Department of Biotechnology 15.39 12.57 82% 26.92 23.17 86%
MINISTRY OF SHIPPING 867.49 334.06 39% 1063.00 395.15 37%88 Ministry of Shipping
Gross 1164.49 512.75 44% 1328.60 565.02 43%Less : Receipts 190.00 116.92 62% 170.00 166.34 98%Recoveries 107.00 61.77 58% 95.60 3.53 4%Net 867.49 334.06 39% 1063.00 395.15 37%
MINISTRY OF SOCIAL JUSTICE& EMPOWERMENT 93.30 64.80 69% 78.00 64.10 82%
89 Ministry of Social Justice &Empowerment 93.30 64.80 69% 78.00 64.10 82%
DEPARTMENT OF SPACE 1100.00 868.34 79% 926.00 711.06 77%90 Department of Space 1100.00 868.34 79% 926.00 711.06 77%
MINISTRY OF STATISTICS ANDPROGRAMME IMPLEMENTATION 357.54 310.27 87% 347.36 243.92 70%
91 Ministry of Statistics and ProgrammeImplementation 357.54 310.27 87% 347.36 243.92 70%MINISTRY OF STEEL 69.29 48.35 70% 70.76 51.49 73%
92 Ministry of SteelGross 75.89 53.53 71% 77.71 58.44 75%Less: Receipts 6.60 5.18 78% 6.95 6.95 100%Net 69.29 48.35 70% 70.76 51.49 73%
MINISTRY OF TEXTILES 836.41 500.60 60% 855.75 470.94 55%93 Ministry of Textiles 836.41 500.60 60% 855.75 470.94 55%
MINISTRY OF TOURISM 72.98 49.90 68% 70.76 43.17 61%94 Ministry of Tourism 72.98 49.90 68% 70.76 43.17 61%
28

(1) (2) (3) (4) (5) (6) (7) (8)
MINISTRY OF TRIBAL AFFAIRS 18.00 12.93 72% 17.00 11.75 69%95 Ministry of Tribal Affairs 18.00 12.93 72% 17.00 11.75 69%
U.Ts WITHOUT LEGISLATURE 3706.92 3276.04 88% 3408.89 3055.54 90%96 Andaman & Nicobar Islands
Gross 1390.74 993.90 71% 1285.31 1058.02 82%Less : Recoveries 114.13 61.40 54% 111.41 59.81 54%Net 1276.61 932.50 73% 1173.90 998.21 85%
97 ChandigarhGross 2178.78 1832.83 84% 2068.31 1600.86 77%Less : Recoveries 374.00 139.91 37% 421.78 99.85 24%Net 1804.78 1692.92 94% 1646.53 1501.01 91%
98 Dadra & Nagar HaveliGross 1780.32 1201.08 67% 1527.02 1119.87 73%Less : Recoveries 1673.76 1113.08 67% 1429.72 1032.28 72%Net 106.56 88.00 83% 97.30 87.59 90%
99 Daman & DiuGross 835.80 697.62 83% 708.00 646.10 91%Less : Recoveries 722.60 555.35 77% 602.60 557.09 92%Net 113.20 142.27 126% 105.40 89.01 84%
100 LakshadweepGross 503.06 430.24 86% 483.05 397.33 82%Less : Recoveries 97.29 9.89 10% 97.29 17.61 18%Net 405.77 420.35 104% 385.76 379.72 98%
MINISTRY OF URBANDEVELOPMENT 2673.87 2097.40 78% 2261.71 1835.92 81%
101 Department of Urban DevelopmentGross 946.17 703.97 74% 786.51 605.21 77%Less : Recoveries 0.04 0.00 0% 0.04 0.00 0%Net 946.13 703.97 74% 786.47 605.21 77%
102 Public WorksGross 1686.55 1338.14 79% 1443.45 1165.44 81%Less : Recoveries 61.15 13.48 22% 65.44 7.91 12%Net 1625.40 1324.66 81% 1378.01 1157.53 84%
103 Stationery and PrintingGross 264.42 184.02 70% 253.24 162.36 64%Less : Recoveries 162.08 115.25 71% 156.01 89.18 57%Net 102.34 68.77 67% 97.23 73.18 75%
MINISTRY OF WATERRESOURCES 541.00 420.97 78% 502.73 379.19 75%
104 Ministry of Water ResourcesGross 555.60 433.63 78% 517.33 387.44 75%Less : Recoveries 14.60 12.66 87% 14.60 8.25 57%Net 541.00 420.97 78% 502.73 379.19 75%
MINISTRY OF WOMEN ANDCHILD DEVELOPMENT 84.00 65.12 78% 83.00 55.00 66%
105 Ministry of Women and ChildDevelopment 84.00 65.12 78% 83.00 55.00 66%
29

(1) (2) (3) (4) (5) (6) (7) (8)
MINISTRY OF YOUTH AFFAIRS& SPORTS 111.00 89.46 81% 121.00 93.80 78%
106 Ministry of Youth Affairs and Sports 111.00 89.46 81% 121.00 93.80 78%
MINISTRY OF RAILWAYSMinistry of Railways
Gross 109393.25 88884.63 81% 109393.25 75967.33 69%Less : Receipts 109393.25 87475.62 80% 109393.25 74576.06 68%Reserve fund 0.00 1409.01 0.00 1391.27Net 0.00 0.00 0.00 0.00Exp. From Contingency Fund 219.03 170.41
GRAND TOTAL 969900.29 695233.32 72% 816182.08 619456.97 76%
30

Annex VII
RESOURCES TRANSFERRED TO STATE & UT GOVERNMENTS
(` crore)2012-13 2011-12
Sr. DESCRIPTION BE ACTUALS % BE ACTUALS %No. Upto 12/2012 Upto 12/2011
1 States' share of Taxes & Duties 301921 194392 64% 263458 169629 64%
2 Non-plan Grants & Loans 64296 30508 47% 66396 34720 52%Grants 64211 30460 47% 66311 34672 52%Loans 85 48 56% 85 48 56%Ways and Means Advances (Net) 0 0
3 Central Assistance for State &UT Plans 122014 64734 53% 101292 60402 60%
Grants 111014 57417 52% 92292 53470 58%Loans 11000 7317 67% 9000 6932 77%
4 Assistance for Central & Centrallysponsored Schemes 41592 36431 88% 34045 32745 96%
Grants 41592 36431 88% 34025 32725 96%Loans 20 20 100%
5 Total Grants & Loans (2+3+4) 227902 131673 58% 201733 127867 63%Grants 216817 124308 57% 192628 120867 63%Loans 11085 7365 66% 9105 7000 77%
6 Less : Recovery of Loans & Advances 8529 6475 76% 8416 5925 70%
7 Net Resources transferred to State &UT Governments (1+5-6) 521294 319590 61% 456775 291571 64%
(i) Of Which State Govts. 518182 317958 61% 453882 290439 64%(ii) Of Which UT. Govts. 3112 1632 52% 2893 1132 39%
31

Annex VIII
DEPARTMENTAL COMMERCIAL UNDERTAKINGS
(` crore)2012-13 2011-12
Sr. DESCRIPTION BE Actuals % BE Actuals %No. Upto 12/2012 Upto 12/2011
General ServicesExpenditure 11500.00 6873.32 60% 8563.64 7115.36 83%Receipt 10800.00 6366.37 59% 9000.00 5499.52 61%Net 700.00 506.95 72% -436.36 1615.84 -370%
1 Canteen Stores DepartmentExpenditure 11500.00 6873.32 60% 8563.64 7115.36 83%Receipts 10800.00 6366.37 59% 9000.00 5499.52 61%Net 700.00 506.95 72% -436.36 1615.84 -370%
Economic ServicesExpenditure 17839.34 14453.36 81% 16356.77 13057.08 80%Receipts 12510.30 5749.06 46% 11691.42 5517.28 47%Net 5329.04 8704.30 163% 4665.35 7539.80 162%
2 Delhi Milk SchemeExpenditure 370.00 257.88 70% 350.00 280.15 80%Receipts 352.00 254.48 72% 341.70 226.89 66%Net 18.00 3.40 19% 8.30 53.26 642%
3 Opium and Alkaloid FactoriesExpenditure 349.64 287.60 82% 325.46 309.83 95%Receipts 366.73 266.41 73% 312.00 289.77 93%Net -17.09 21.19 -124% 13.46 20.06 149%
4 Badarpur Thermal Power StationExpenditure 9.95 0.00 0% 17.65 0.00 0%Receipts 256.66 130.33 51% 272.69 280.70 103%Net -246.71 -130.33 53% -255.04 -280.70 110%
5 Fuel Fabrication FacilitiesExpenditure 946.38 944.60 100% 1146.66 770.87 67%Receipts 1601.60 987.02 62% 1331.00 1000.56 75%Net -655.22 -42.42 6% -184.34 -229.69 125%
6 Rajasthan Atomic Power StationExpenditure 79.68 0.00 0% 84.93 73.24 86%Receipts 0.00 0.00 0% 0.00 0.00Net 79.68 0.00 0% 84.93 73.24 86%
7 Fuel InventoryExpenditure 2400.00 1329.06 55% 1749.45 1209.18 69%Receipts 1950.00 1031.46 53% 1746.33 997.00 57%Net 450.00 297.60 66% 3.12 212.18 6801%
32
(1) (2) (3) (4) (5) (6) (7) (8)
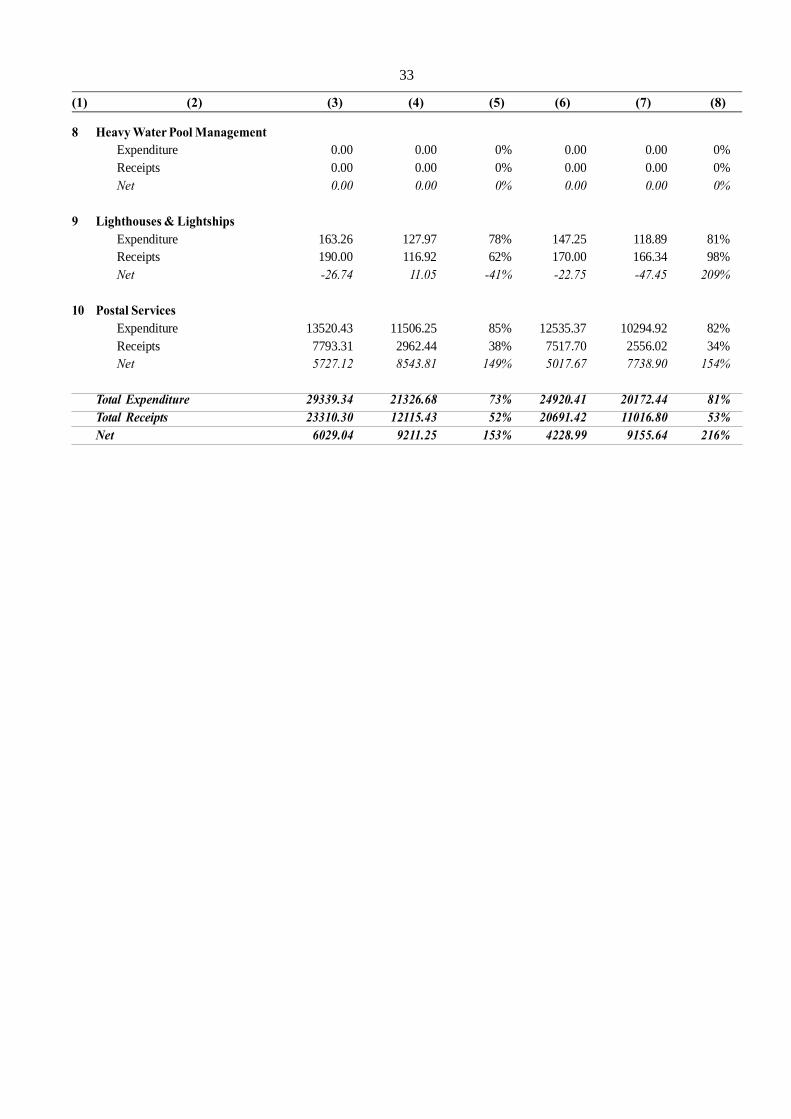
8 Heavy Water Pool ManagementExpenditure 0.00 0.00 0% 0.00 0.00 0%Receipts 0.00 0.00 0% 0.00 0.00 0%Net 0.00 0.00 0% 0.00 0.00 0%
9 Lighthouses & LightshipsExpenditure 163.26 127.97 78% 147.25 118.89 81%Receipts 190.00 116.92 62% 170.00 166.34 98%Net -26.74 11.05 -41% -22.75 -47.45 209%
10 Postal ServicesExpenditure 13520.43 11506.25 85% 12535.37 10294.92 82%Receipts 7793.31 2962.44 38% 7517.70 2556.02 34%Net 5727.12 8543.81 149% 5017.67 7738.90 154%
Total Expenditure 29339.34 21326.68 73% 24920.41 20172.44 81%Total Receipts 23310.30 12115.43 52% 20691.42 11016.80 53%Net 6029.04 9211.25 153% 4228.99 9155.64 216%
33