state universities retirement system of illinois … 5- 5d callan...state universities retirement...
TRANSCRIPT
State Universities Retirement System of Illinois
Callan Associates Investment Consulting
October 17, 2013
Greg Allen President
John Jackson, CFA Senior Vice President
Angel Haddad Vice President
Sally Haskins Senior Vice President
Exhibit 5

2 State Universities Retirement System of Illinois Knowledge. Experience. Integrity.
Agenda
I. Executive Summary
II. Relationship Review
III. Strategic Planning
IV. Portfolio Structure
V. Research Capabilities
VI. Defined Contribution Consulting
VII. Portfolio Monitoring & Evaluation
VIII. Fees
IX. Summary
Appendix
Exhibit 5

Executive Summary
Callan - Investment Consulting Services
Exhibit 5

4 State Universities Retirement System of Illinois Knowledge. Experience. Integrity.
Client Focused Consulting Model
Callan utilizes a custom approach to consulting. By understanding the evolution of each client’s investment program and using a disciplined process, we enable clients to make optimal long-term decisions based on their unique circumstances.
Experience
Callan has been providing clients with custom solutions since 1973. As one of the largest investment consulting firms in the U.S., Callan has the size and scale to keep abreast of the unique challenges of the Public Fund market. Public Funds make up the bulk of our practice and our extensive experience has led to launching programs like Callan Connects to be responsive to client needs.
Dedicated Research Professionals
Callan has 22 dedicated professional whose sole responsibility is manager research. These individuals do not divide time engaging in other consulting activities. In addition, a dedicated DC Group illustrates Callan’s commitment to the industry.
Independent and Focused Callan is independent, well into its third generation of employee ownership, and is solely focused on serving the needs of institutional investors. Our strategic interest is consulting, not managing money.
Executive Summary Exhibit 5

5 State Universities Retirement System of Illinois Knowledge. Experience. Integrity.
Callan’s Organizational and Consultant History Exceptional Client Service backed by Deep Resources and Unmatched Collective Experience
Independent & Focused
● Established in 1973 ● Investment consulting remains our primary focus ● 100% employee owned ● Third generation of private ownership ● 69 current owner-employees
Experienced
● Over 370 Fund Sponsor clients representing over $1.9 trillion in assets ● Client-focused consultants with 8-12 clients each ● Consultant tenure - Average 10 years Callan/18 years Industry ● Client tenure – Average of 8.5 years
Fully Resourced
● 171 employees ● 35 CFA Charterholders and 7 CFA candidates ● 44 advanced degrees ● 64 research specialists in every area of need ● Proprietary systems and databases
1973 Successfully transitioned a
third generation of employee owners to senior
management positions
Successfully transitioned ownership from Ed Callan to employees, while
remaining an independent consulting firm
Ed Callan and associates founded
company
2007 1990 Callan celebrates 40th anniversary
2013
Exhibit 5
6 State Universities Retirement System of Illinois Knowledge. Experience. Integrity.
Callan’s Investment Consulting Philosophy
● Customized solutions for each client’s particular needs – not a “one size fits all” approach.
● Direct, open and candid communication on Investments – we believe that our clients are best served by our unbiased and experienced advice.
● Taking a strategic, long-term approach to planning and implementation with documented due diligence is the most prudent way to manage institutional assets.
● Diversification at the total fund level and within each asset class.
● Proven strategies over ones considered “cutting edge” – a conservative approach to risk management in which we perform in-depth due diligence research to ensure that investments are managed by firms with experience, expertise and established track records.
Exhibit 5
7 State Universities Retirement System of Illinois Knowledge. Experience. Integrity.
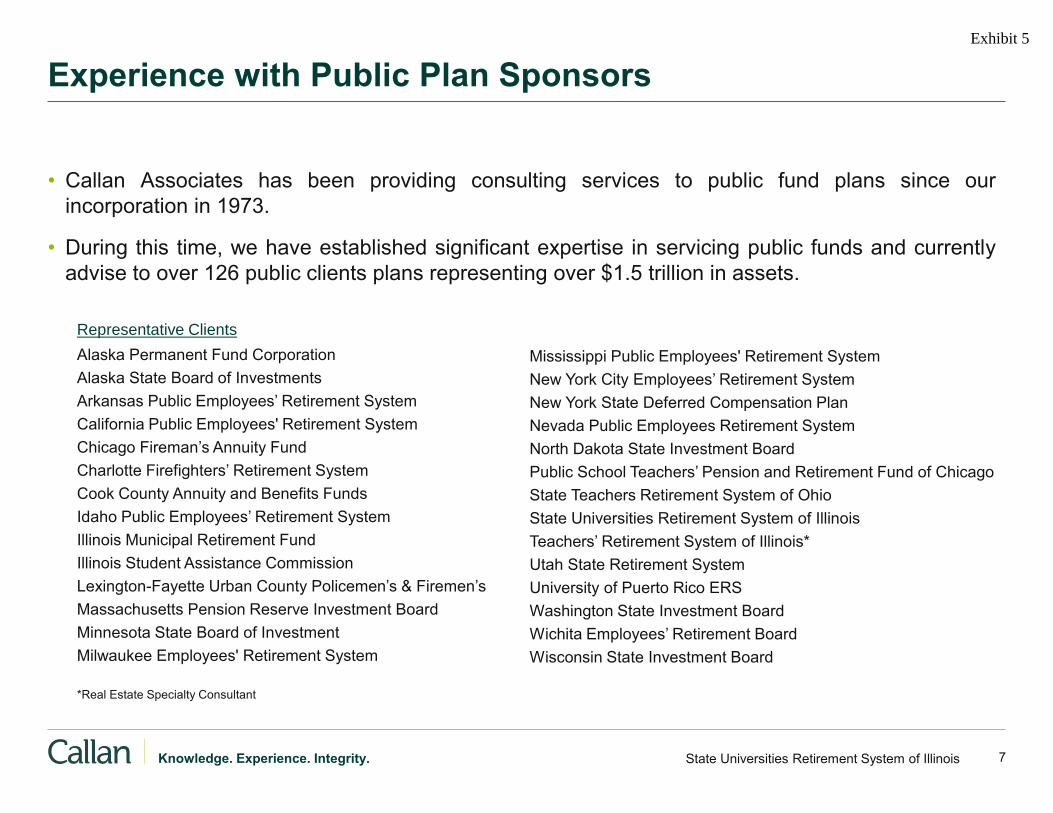
Experience with Public Plan Sponsors
• Callan Associates has been providing consulting services to public fund plans since our incorporation in 1973.
• During this time, we have established significant expertise in servicing public funds and currently advise to over 126 public clients plans representing over $1.5 trillion in assets.
Alaska Permanent Fund Corporation Alaska State Board of Investments Arkansas Public Employees’ Retirement System California Public Employees' Retirement System Chicago Fireman’s Annuity Fund Charlotte Firefighters’ Retirement System Cook County Annuity and Benefits Funds Idaho Public Employees’ Retirement System Illinois Municipal Retirement Fund Illinois Student Assistance Commission Lexington-Fayette Urban County Policemen’s & Firemen’s Massachusetts Pension Reserve Investment Board Minnesota State Board of Investment Milwaukee Employees' Retirement System *Real Estate Specialty Consultant
Mississippi Public Employees' Retirement System New York City Employees’ Retirement System New York State Deferred Compensation Plan Nevada Public Employees Retirement System North Dakota State Investment Board Public School Teachers’ Pension and Retirement Fund of Chicago State Teachers Retirement System of Ohio State Universities Retirement System of Illinois Teachers’ Retirement System of Illinois* Utah State Retirement System University of Puerto Rico ERS Washington State Investment Board Wichita Employees’ Retirement Board Wisconsin State Investment Board
Representative Clients
Exhibit 5
8 State Universities Retirement System of Illinois Knowledge. Experience. Integrity.
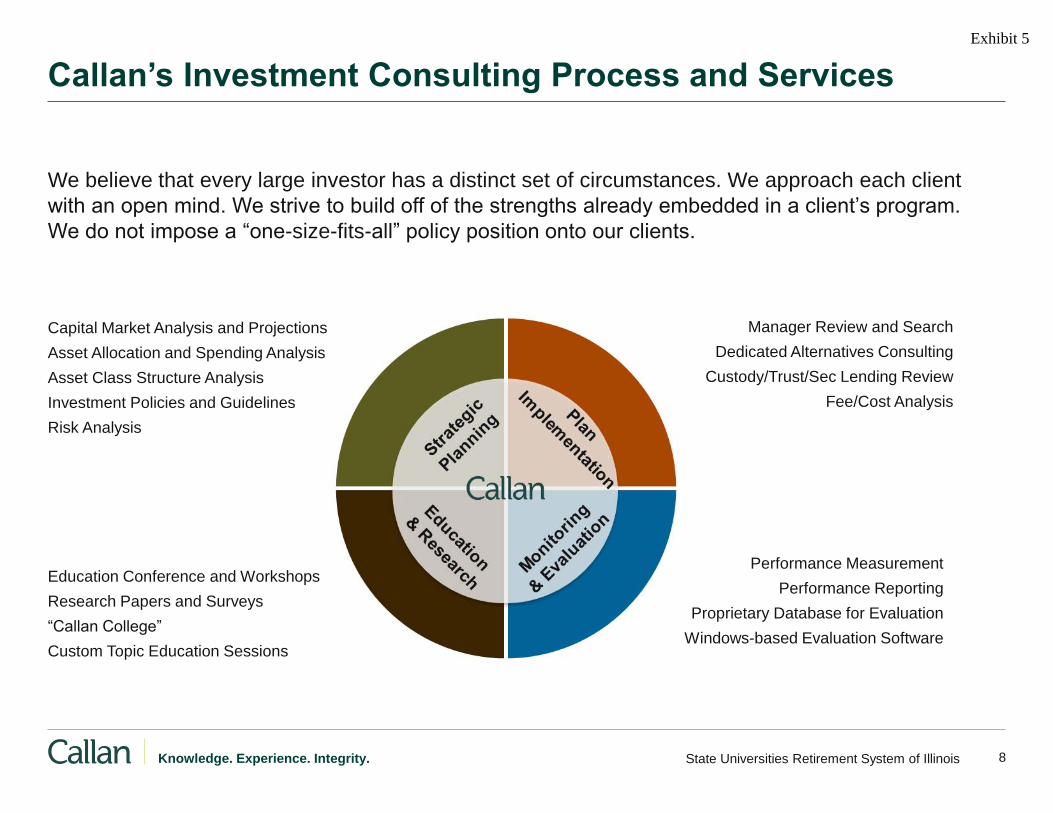
Callan’s Investment Consulting Process and Services
Manager Review and Search Dedicated Alternatives Consulting
Custody/Trust/Sec Lending Review Fee/Cost Analysis
Capital Market Analysis and Projections Asset Allocation and Spending Analysis Asset Class Structure Analysis Investment Policies and Guidelines Risk Analysis
Education Conference and Workshops Research Papers and Surveys “Callan College”Custom Topic Education Sessions
Performance Measurement Performance Reporting
Proprietary Database for Evaluation Windows-based Evaluation Software
We believe that every large investor has a distinct set of circumstances. We approach each client with an open mind. We strive to build off of the strengths already embedded in a client’s program. We do not impose a “one-size-fits-all” policy position onto our clients.
Exhibit 5
9 State Universities Retirement System of Illinois Knowledge. Experience. Integrity.
Callan’s Commitment to Diversity
It has been, and will continue to be the policy of Callan Associates, Inc. to provide Equal Employment Opportunity without regard to race, religion, creed, color, national origin, sex, age, disability, marital status, pregnancy, sexual orientation, citizenship, or veteran status. Further, it is the policy of the Company to undertake affirmative action in compliance with all federal, state and local requirements.
Our commitment to diversity is evidenced by:
● Callan founder, Ed Callan, also founded Progress Trust, the first multi-manager asset management organization committed to promoting diversity within the institutional investment community
● Over 40% of Callan’s shareholders are women or minorities
● Over 50% of Callan’s employees and investment professionals are female or minorities
● 50% of Callan’s Management Committee is comprised of female or minorities
● Callan has taken an active role in helping public pension plans expand their minority, woman and disabled owned investments through programs like “Callan Connects”
Exhibit 5

10 State Universities Retirement System of Illinois Knowledge. Experience. Integrity.
Research and Education Callan Published Research
A complete listing of Research is available at www.callan.com
Conference/Workshop Presentations − Expanding Global Horizons − Fixed Income – This Time It’s Different − Plan Regulations and Costs
Periodic Surveys − 2013 Risk Management Survey − 2013 DC Trends Survey − 2011 Investment Management Fee Survey
Quarterly Newsletters − Capital Markets Review − Defined Contribution Observer − Hedge Fund Monitor − Private Market Trends
Research Papers − Risk Factors as Building Blocks for Portfolio Diversification: The Chemistry of Asset Allocation − Investments in Database and Performance Measurement Technology: The Value of Stubbornness − Exchange-Traded Funds: A Look at the Shifting Landscape
Exhibit 5

Relationship Review
Callan - Investment Consulting Services
Exhibit 5

12 State Universities Retirement System of Illinois Knowledge. Experience. Integrity.
Alternatives Review Committee
Client Focused Consulting Model Proactively Provide Our Collective Expertise and Experience to Client
Global Manager Research
Capital Markets Group
Client Report Services Proprietary Database
Callan Investments Institute and “Callan College”
Callan Consulting Team John Jackson, CFA Angel Haddad Sally Haskins Greg Allen
Strategic Planning
Plan Implementation
Monitoring & Evaluation
Education & Research
6 Dedicated Professionals 35 Dedicated Performance Analysts and Support
30 Dedicated Professionals 7 Dedicated Professionals Most Callan Professionals Participate as Instructors and Research Writers
Client Policy Review Committee Manager Search Committee
Callan DC Consulting Team Lori Lucas, CFA
Jamie McAllister Jim O’Connor Ben Taylor James Veneruso, CFA
Exhibit 5
13 State Universities Retirement System of Illinois Knowledge. Experience. Integrity.
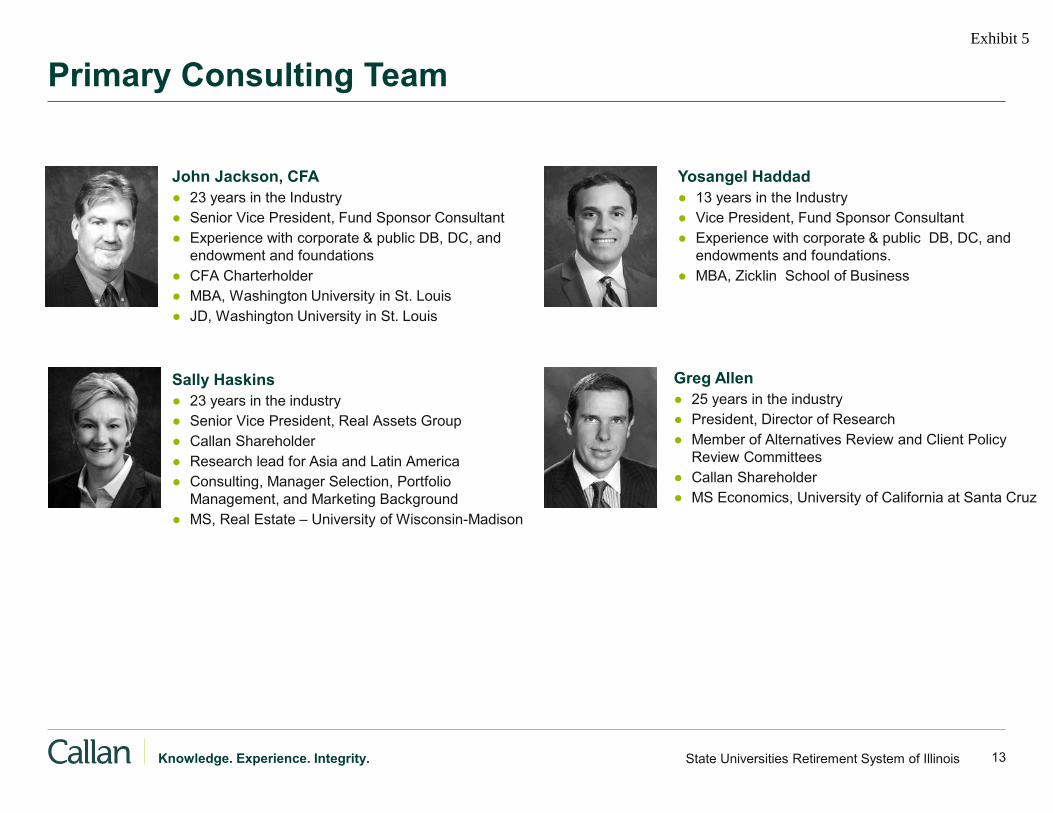
Primary Consulting Team
Yosangel Haddad ● 13 years in the Industry ● Vice President, Fund Sponsor Consultant ● Experience with corporate & public DB, DC, and
endowments and foundations. ● MBA, Zicklin School of Business
John Jackson, CFA ● 23 years in the Industry ● Senior Vice President, Fund Sponsor Consultant ● Experience with corporate & public DB, DC, and
endowment and foundations ● CFA Charterholder ● MBA, Washington University in St. Louis ● JD, Washington University in St. Louis
Sally Haskins ● 23 years in the industry ● Senior Vice President, Real Assets Group ● Callan Shareholder ● Research lead for Asia and Latin America ● Consulting, Manager Selection, Portfolio
Management, and Marketing Background ● MS, Real Estate – University of Wisconsin-Madison
Greg Allen ● 25 years in the industry ● President, Director of Research ● Member of Alternatives Review and Client Policy
Review Committees ● Callan Shareholder ● MS Economics, University of California at Santa Cruz
Exhibit 5
14State Universities Retirement System of Illinois Knowledge. Experience. Integrity.
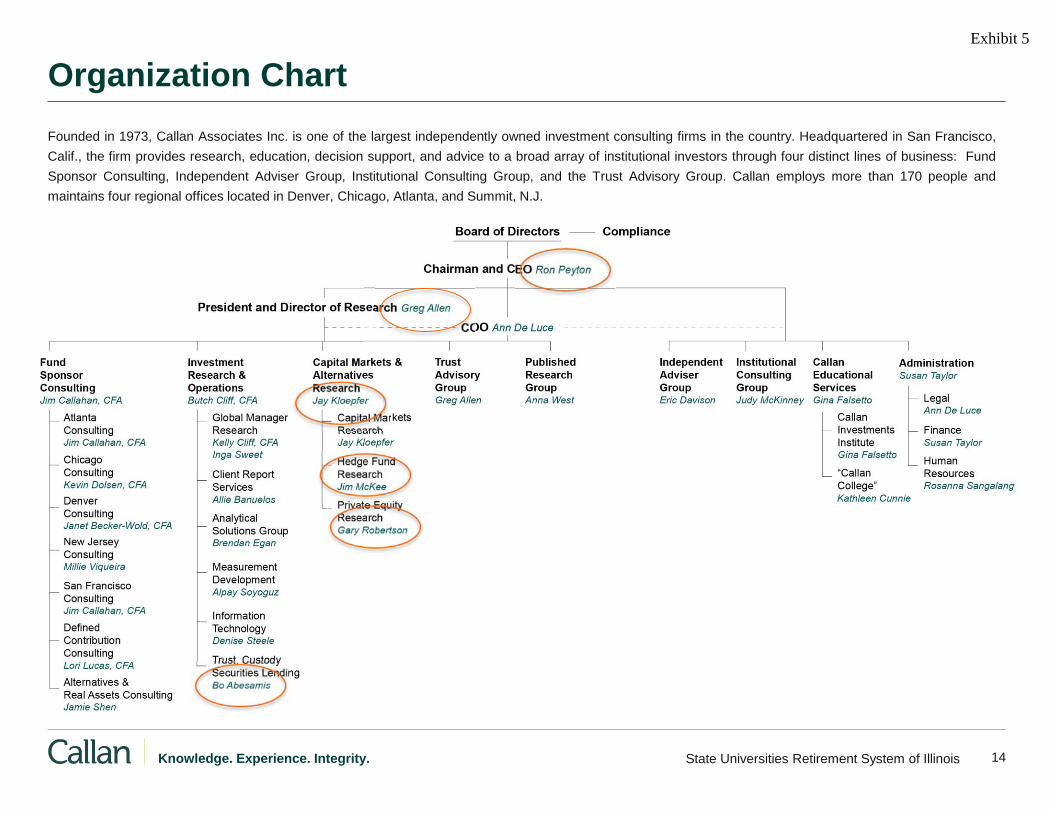
Organization Chart Founded in 1973, Callan Associates Inc. is one of the largest independently owned investment consulting firms in the country. Headquartered in San Francisco, Calif., the firm provides research, education, decision support, and advice to a broad array of institutional investors through four distinct lines of business: Fund Sponsor Consulting, Independent Adviser Group, Institutional Consulting Group, and the Trust Advisory Group. Callan employs more than 170 people andmaintains four regional offices located in Denver, Chicago, Atlanta, and Summit, N.J.
Exhibit 5

15 State Universities Retirement System of Illinois Knowledge. Experience. Integrity.
Relationship Review
● Inception: January 2011
● Achievements: – Asset /Liability Study – Global/International Structure Review – Domestic Equity Structure Review – Fixed Income Structure Review – Private Equity Review – Pacing Study & Searches – Real Estate Review – Pacing Study & Searches – Custodian/Securities Lending Review & Search – Annual Asset Class Reviews – Annual Manager Diversity Program (MDP) Reviews – Annual DC Reviews – Educational Events – Annual On-Site Forums – Participation at Legislative Hearings
● SURS has had access to the depth and breadth of Callan’s resources including frequent interaction with the senior levels throughout the organization. We expect our relationship will likely evolve over time and are completely amenable to your needs. We will continue to operate as an extension of your staff.
Exhibit 5

16State Universities Retirement System of Illinois Knowledge. Experience. Integrity.
Asset/Liability Study • Jay Kloepfer/Karen
Harris
MDP Update
Transition Management Educational Presentation • Bo Abesamis
Asset Structure Analysis Phase III: Fixed Income and TIPS • Jay Kloepfer
RREEF Termination Recommendation • Sally Haskins
February 2013
Implementation of Phase III of Asset Structure Analysis • John Jackson • Modify existing mandate to
PIMCO to include an unconstrained mandate
Educational Topic: S&P 500 Buy-Write Strategies • Jim McKee
March 2013
2011
June 2011
Asset Structure Analysis Phase I: Domestic Equity • Greg Allen
Small Cap Growth Search • CastleArk hired
Opportunistic Real Estate Search Pacing Study Sally Haskins • Franklin Templeton and Mesirow
retained
Custodian/Securities Lending Provider Search Approved by Board • Bo Abesamis • NT retained as custodian; Deutsche
Bank hired for securities lending services
September 2011
October 2011 Asset Structure Analysis Phase II: Non-US & Global Equity • Greg Allen
March 2012 Securities Lending Educational Presentation • Bo Abesamis
September 2012 Core Real Estate Search • Sally Haskins • JP Morgan and Heitman
retained
Private Equity Emerging Manager Search Approved by Board • Gary Robertson • Fairview hired
October 2012 Review of Non-US and Global Equity Managers • Mark Kline
SURS’ Expectations● Commitment and
Dedication of Necessary Resources
● Independence of Firm● Provide Quality & Unique
Recommendations ● Expertise of Investment
Management & Public Pension Fund Industries/Provide Education and Training
● In Depth Knowledge of All Asset Classes
● Awareness of the Illinois Legislative Climate
● Extensive Knowledge of Minority, Female and Persons with Disability-Owned Firms
● Insight of the Latest Trends and Topical Issues
● Diversity ● Extensive Manager
Research and Ability to Conduct Complex Searches
Work Plan (Select Events)
• Custodian/Sec Lending Review
• Consideration of Transition Manager
• Global/International Equity Manager Review
• Real Estate Review –Pacing Study
• Private Equity Manager Review & Opportunities
• Fixed Income Mgr. Review
• Small Cap Search
• Core Real Estate Search
• Custody/Sec Lending Search
• MDP Review
2011 2012 2013• Finalist Interviews: Real
Estate Search • Emerging Mgr. Private Equity
Search • Fixed Income Structure
Analysis
2012
Real Estate Educational Presentation • Sally Haskins
February 2011
Transition Manager Review/Search • Bo Abesamis
March 2011
DC Industry Educational Presentation • Jamie McAllister
April 2012
MDP Update Cap Mkts Update • Jay Kloepfer
June 2012
2013 2014
(Select Events)
Timeline: Goals and Achievements Since Inception
DC Industry Educational Presentation • Jamie McAllister
May 2013
MDP Update • Angel Haddad
June 2013
Exhibit 5
17 State Universities Retirement System of Illinois Knowledge. Experience. Integrity.
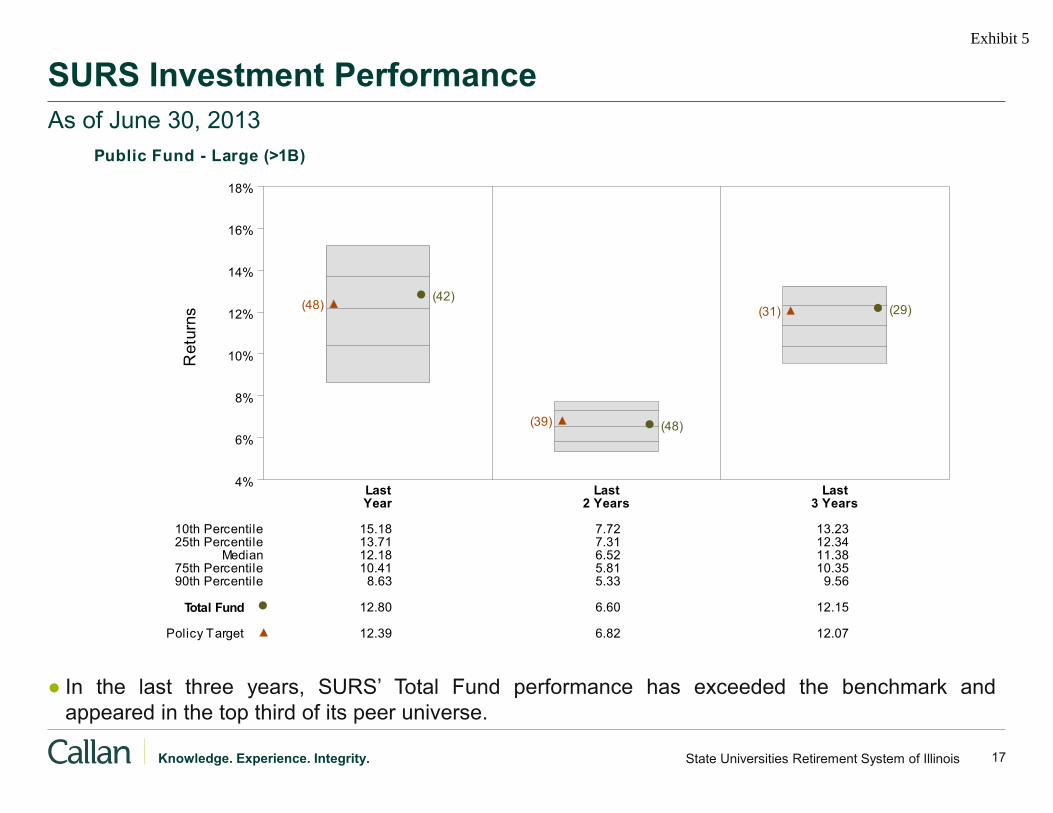
SURS Investment Performance As of June 30, 2013
● In the last three years, SURS’ Total Fund performance has exceeded the benchmark and appeared in the top third of its peer universe.
Public Fund - Large (>1B)
Ret
urns
4%
6%
8%
10%
12%
14%
16%
18%
Last Last LastYear 2 Years 3 Years
(42)(48)
(48)(39)
(29)(31)
10th Percentile 15.18 7.72 13.2325th Percentile 13.71 7.31 12.34
Median 12.18 6.52 11.3875th Percentile 10.41 5.81 10.3590th Percentile 8.63 5.33 9.56
Total Fund 12.80 6.60 12.15
Policy Target 12.39 6.82 12.07
Exhibit 5
18 State Universities Retirement System of Illinois Knowledge. Experience. Integrity.
What’s Next?
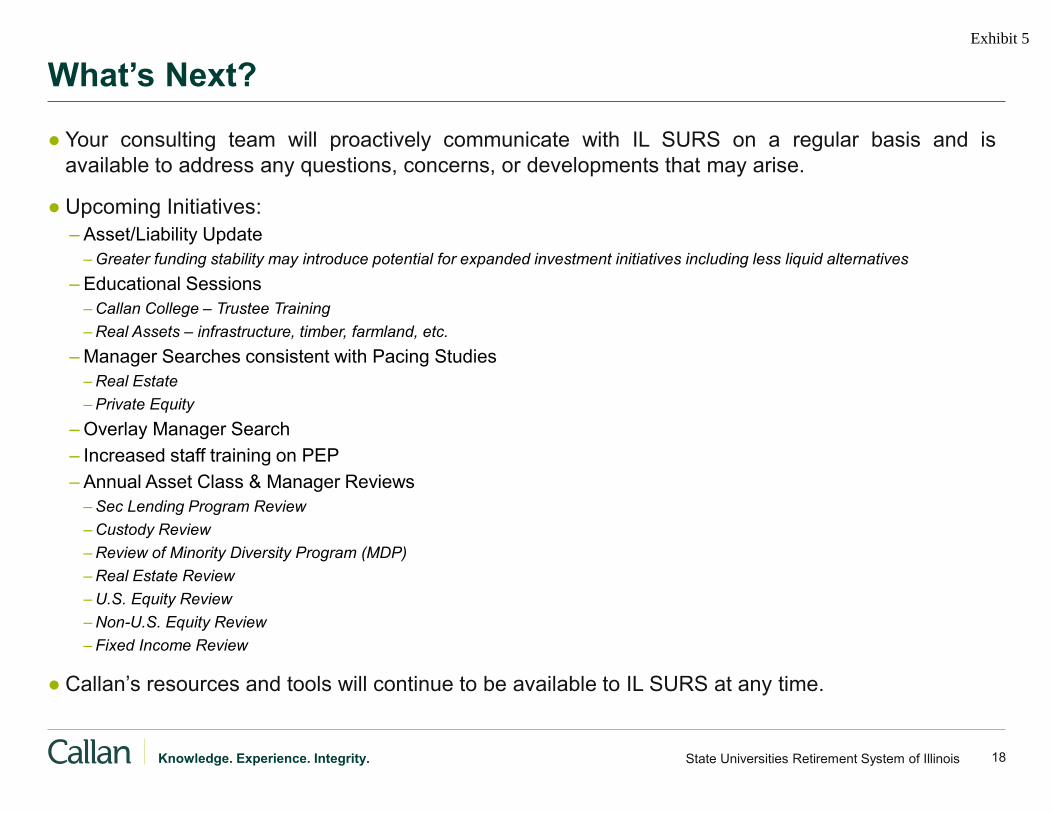
● Your consulting team will proactively communicate with IL SURS on a regular basis and is available to address any questions, concerns, or developments that may arise.
● Upcoming Initiatives: – Asset/Liability Update
– Greater funding stability may introduce potential for expanded investment initiatives including less liquid alternatives – Educational Sessions
– Callan College – Trustee Training – Real Assets – infrastructure, timber, farmland, etc.
– Manager Searches consistent with Pacing Studies – Real Estate – Private Equity
– Overlay Manager Search – Increased staff training on PEP – Annual Asset Class & Manager Reviews
– Sec Lending Program Review – Custody Review – Review of Minority Diversity Program (MDP) – Real Estate Review – U.S. Equity Review – Non-U.S. Equity Review – Fixed Income Review
● Callan’s resources and tools will continue to be available to IL SURS at any time.
Exhibit 5

Callan - Investment Consulting Services
Strategic Planning
Exhibit 5
20 State Universities Retirement System of Illinois Knowledge. Experience. Integrity.
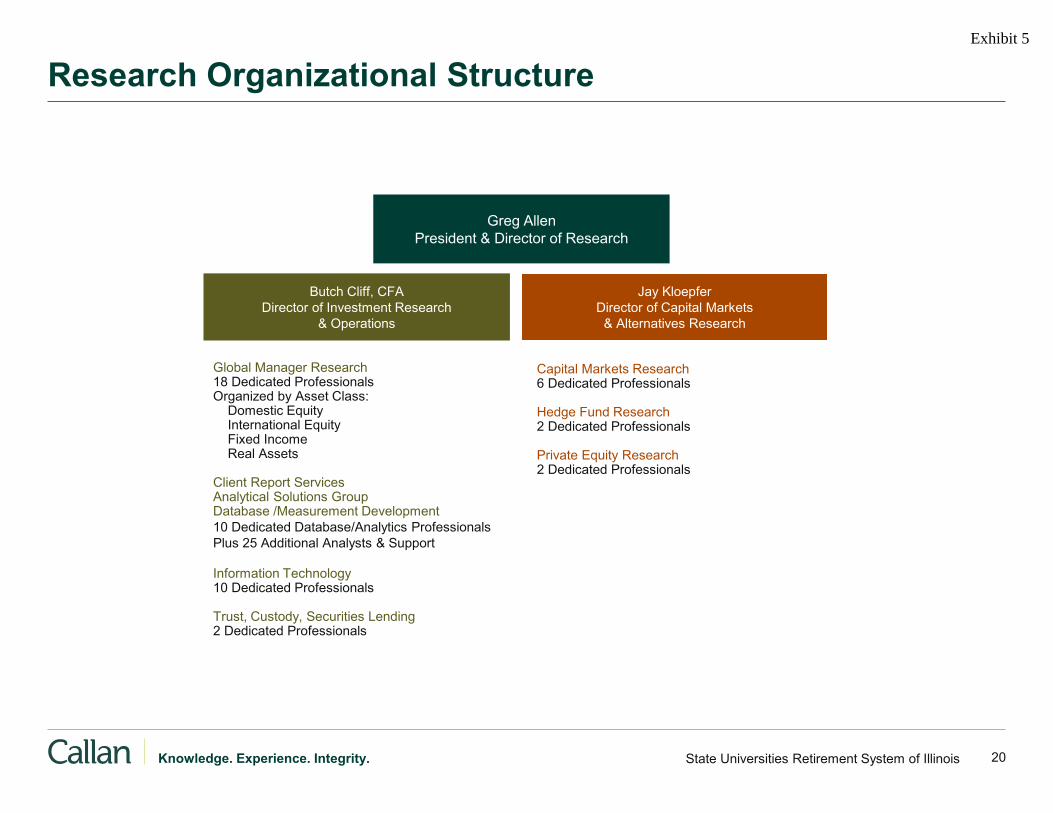
Research Organizational Structure
Greg Allen President & Director of Research
Global Manager Research 18 Dedicated Professionals Organized by Asset Class: Domestic Equity International Equity Fixed Income Real Assets Client Report Services Analytical Solutions Group Database /Measurement Development 10 Dedicated Database/Analytics Professionals Plus 25 Additional Analysts & Support Information Technology 10 Dedicated Professionals Trust, Custody, Securities Lending 2 Dedicated Professionals
Butch Cliff, CFA Director of Investment Research
& Operations
Jay Kloepfer Director of Capital Markets
& Alternatives Research
Capital Markets Research 6 Dedicated Professionals Hedge Fund Research 2 Dedicated Professionals Private Equity Research 2 Dedicated Professionals
Exhibit 5

21 State Universities Retirement System of Illinois Knowledge. Experience. Integrity.
Capital Markets Research Group Capital Markets Research Professionals
Eugene Podkaminer BA, MBA, CFA
Julia Moriarty BS, MBA, CFA
Jay Kloepfer BS, MA
Director of Capital Markets and Alternatives Research
Karen Harris BM, ASA, CFA
Jason Ellement BS, FSA, MAAA, CFA
James Van Heuit BA, BS, MA
25 Full asset/liability or spending studies conducted each year
25 Asset allocation-only studies
conducted each year 20 Investment structure studies
conducted each year 50 Custom research projects
conducted each year
● Provide basic capital market research – all asset classes, all strategies
● Develop proprietary capital market expectations
● Conduct a wide array of modeling assignments, including asset allocation, scenario analysis, custom target date glidepaths
● Asset class implementation – strategies and manager structure
● Provide custom client research and education
● Quarterly Capital Market Review and periodic research papers
● Teamed with Callan’s private markets, hedge fund and real estate research groups
● Assist clients in the completion/enhancement of their internal projects
Exhibit 5
22 State Universities Retirement System of Illinois Knowledge. Experience. Integrity.
Strategic Planning
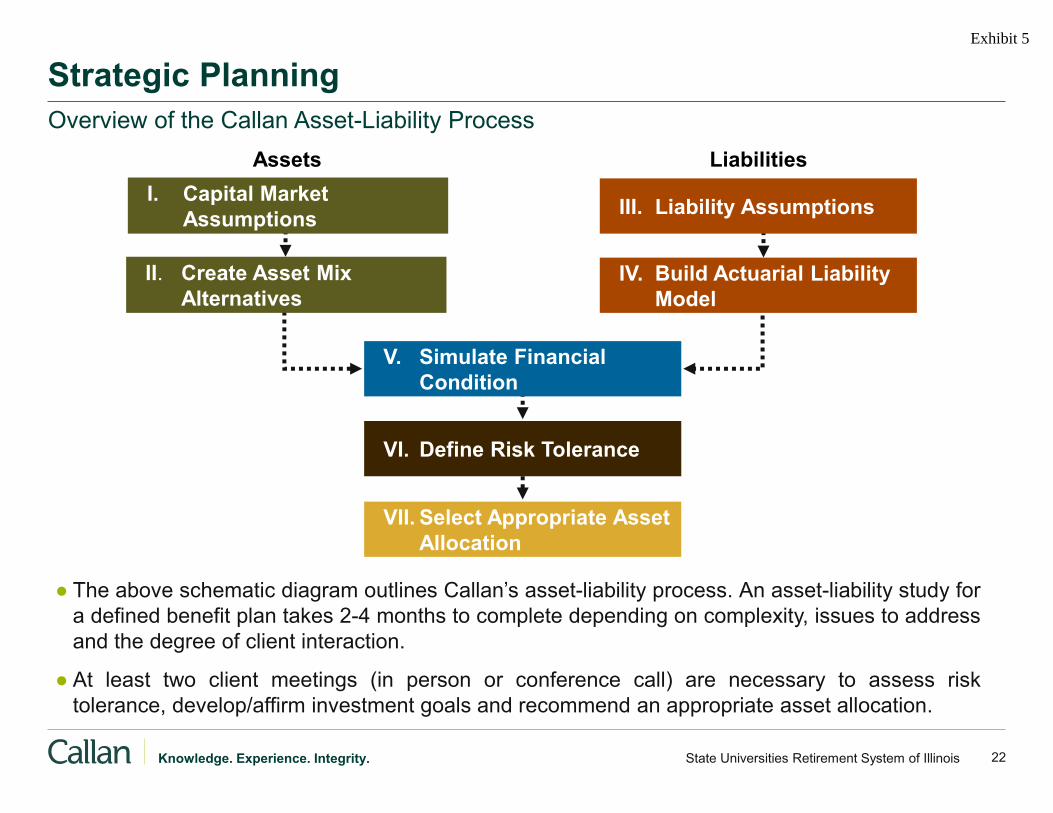
● The above schematic diagram outlines Callan’s asset-liability process. An asset-liability study for a defined benefit plan takes 2-4 months to complete depending on complexity, issues to address and the degree of client interaction.
● At least two client meetings (in person or conference call) are necessary to assess risk tolerance, develop/affirm investment goals and recommend an appropriate asset allocation.
Overview of the Callan Asset-Liability Process
Assets Liabilities
II. Create Asset Mix Alternatives
IV. Build Actuarial Liability Model
V. Simulate Financial Condition
VI. Define Risk Tolerance
VII. Select Appropriate Asset Allocation
I. Capital Market Assumptions III. Liability Assumptions
Exhibit 5

23State Universities Retirement System of Illinois Knowledge. Experience. Integrity.
Summary Findings of 2011 Asset/Liability Study
● Investment policy alone cannot close the Illinois SURS plan deficit over the next 10 (or 25) years.
● The investment and contribution experience in the next 5 years will be crucial in determining whether the trust will remain sustainable or shift to depletion mode.
● Asset/liability analysis suggests key asset allocation decisions –exposure to risk assets, and illiquid strategies in particular –depend on expected contributions: – Statutory Rate contributions are expected to sustain the plan’s funded ratio;
continued underfunding could lead to depletion.
● Recommended course of action for the next five years: – Continue with the System’s current risk posture, which in combination with
active management is expected to meet the actuarial return assumption; – Consider limiting the illiquid asset class exposures to current levels; – Put off funding of any new strategies (such as absolute return) for the next
several years until future funding policy is clear. – Consider creating a liquidity reserve to anticipate annual net outflows (i.e.
marginal cash allocation within the fixed income allocation).
●
●
●
Proposed Target Adopted June 2011
Exhibit 5
24 State Universities Retirement System of Illinois Knowledge. Experience. Integrity.
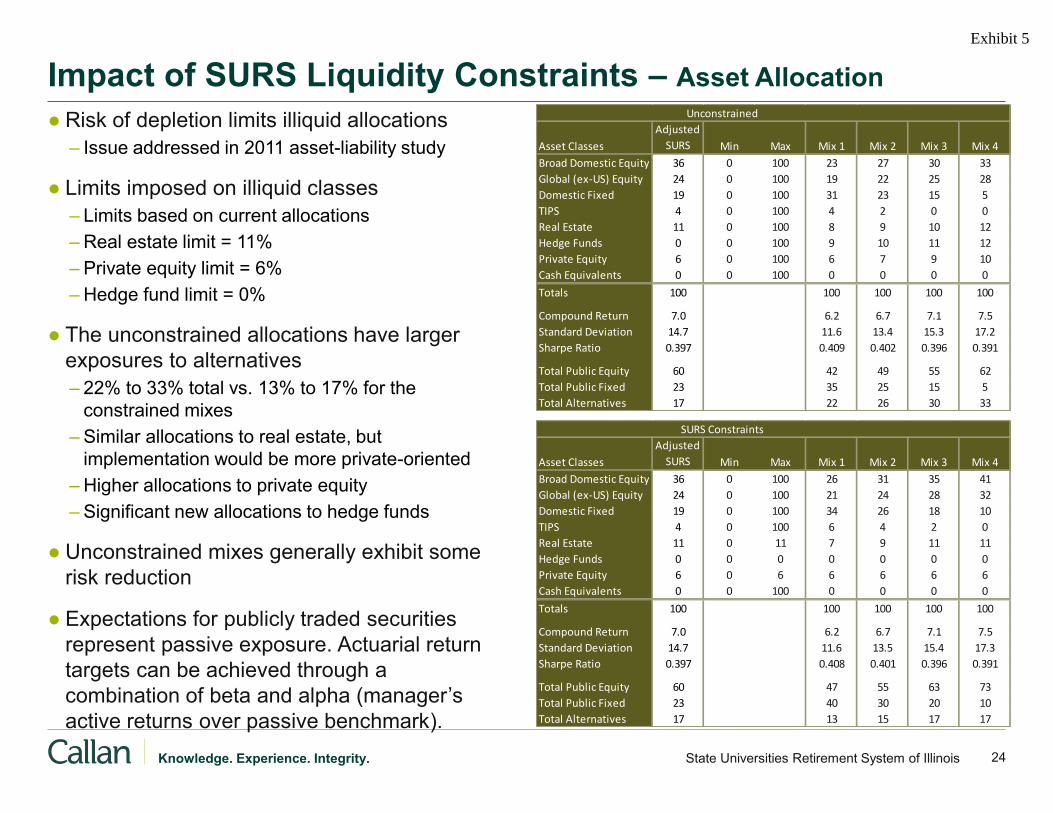
Impact of SURS Liquidity Constraints – Asset Allocation ● Risk of depletion limits illiquid allocations
– Issue addressed in 2011 asset-liability study
● Limits imposed on illiquid classes – Limits based on current allocations – Real estate limit = 11% – Private equity limit = 6% – Hedge fund limit = 0%
● The unconstrained allocations have larger exposures to alternatives – 22% to 33% total vs. 13% to 17% for the
constrained mixes – Similar allocations to real estate, but
implementation would be more private-oriented – Higher allocations to private equity – Significant new allocations to hedge funds
● Unconstrained mixes generally exhibit some risk reduction
● Expectations for publicly traded securities represent passive exposure. Actuarial return targets can be achieved through a combination of beta and alpha (manager’s active returns over passive benchmark).
Unconstrained
Asset Classes
Adjusted
SURS Min Max Mix 1 Mix 2 Mix 3 Mix 4
Broad Domestic Equity 36 0 100 23 27 30 33
Global (ex-US) Equity 24 0 100 19 22 25 28
Domestic Fixed 19 0 100 31 23 15 5
TIPS 4 0 100 4 2 0 0
Real Estate 11 0 100 8 9 10 12
Hedge Funds 0 0 100 9 10 11 12
Private Equity 6 0 100 6 7 9 10
Cash Equivalents 0 0 100 0 0 0 0
Totals 100 100 100 100 100
Compound Return 7.0 6.2 6.7 7.1 7.5
Standard Deviation 14.7 11.6 13.4 15.3 17.2
Sharpe Ratio 0.397 0.409 0.402 0.396 0.391
Total Public Equity 60 42 49 55 62
Total Public Fixed 23 35 25 15 5
Total Alternatives 17 22 26 30 33
SURS Constraints
Asset Classes
Adjusted
SURS Min Max Mix 1 Mix 2 Mix 3 Mix 4
Broad Domestic Equity 36 0 100 26 31 35 41
Global (ex-US) Equity 24 0 100 21 24 28 32
Domestic Fixed 19 0 100 34 26 18 10
TIPS 4 0 100 6 4 2 0
Real Estate 11 0 11 7 9 11 11
Hedge Funds 0 0 0 0 0 0 0
Private Equity 6 0 6 6 6 6 6
Cash Equivalents 0 0 100 0 0 0 0
Totals 100 100 100 100 100
Compound Return 7.0 6.2 6.7 7.1 7.5
Standard Deviation 14.7 11.6 13.5 15.4 17.3
Sharpe Ratio 0.397 0.408 0.401 0.396 0.391
Total Public Equity 60 47 55 63 73
Total Public Fixed 23 40 30 20 10
Total Alternatives 17 13 15 17 17
Exhibit 5

25 State Universities Retirement System of Illinois Knowledge. Experience. Integrity.
Impact of SURS Liquidity Constraints – Risk Budgeting
● Tables show impact of the asset allocation constraints on risk attribution – Top table shows unconstrained risk attribution – Middle table shows above constraints – Bottom table shows impact of constraints
● The SURS liquidity constraints cause risk budget to be concentrated in public equity
● Removing constraints shifts risk from public equity primarily to hedge funds and private equity and secondarily to real estate
Unconstrained
Asset Classes
Adjusted
SURS Mix 1 Mix 2 Mix 3 Mix 4
Broad Domestic Equity 45.2% 36.2% 36.8% 35.7% 35.1%
Global (ex-US) Equity 32.8% 32.9% 33.0% 32.7% 32.8%
Domestic Fixed -0.3% 0.1% -0.2% -0.2% -0.1%
TIPS -0.2% -0.1% -0.1% 0.0% 0.0%
Real Estate 10.5% 9.6% 9.3% 9.0% 9.6%
Hedge Funds 0.0% 6.4% 6.0% 5.8% 5.6%
Private Equity 11.9% 15.0% 15.1% 17.1% 17.0%
Cash Equivalents 0.0% 0.0% 0.0% 0.0% 0.0%
Totals 100.0% 100.0% 100.0% 100.0% 100.0%
SURS Constraints
Asset Classes
Adjusted
SURS Mix 1 Mix 2 Mix 3 Mix 4
Broad Domestic Equity 45.2% 40.7% 42.3% 42.0% 43.7%
Global (ex-US) Equity 32.8% 36.2% 35.9% 37.0% 37.6%
Domestic Fixed -0.3% 0.1% -0.2% -0.3% -0.2%
TIPS -0.2% -0.2% -0.2% -0.1% 0.0%
Real Estate 10.5% 8.3% 9.3% 10.0% 8.8%
Hedge Funds 0.0% 0.0% 0.0% 0.0% 0.0%
Private Equity 11.9% 14.9% 12.9% 11.4% 10.1%
Cash Equivalents 0.0% 0.0% 0.0% 0.0% 0.0%
Totals 100.0% 100.0% 100.0% 100.0% 100.0%
Differences
Asset Classes
Adjusted
SURS Mix 1 Mix 2 Mix 3 Mix 4
Broad Domestic Equity 0.0% 4.5% 5.4% 6.3% 8.6%
Global (ex-US) Equity 0.0% 3.3% 3.0% 4.2% 4.8%
Domestic Fixed 0.0% 0.0% 0.0% 0.0% -0.1%
TIPS 0.0% -0.1% -0.1% -0.1% 0.0%
Real Estate 0.0% -1.3% 0.0% 1.0% -0.9%
Hedge Funds 0.0% -6.4% -6.0% -5.8% -5.6%
Private Equity 0.0% -0.1% -2.2% -5.7% -6.9%
Cash Equivalents 0.0% 0.0% 0.0% 0.0% 0.0%
Exhibit 5

26State Universities Retirement System of Illinois Knowledge. Experience. Integrity.
2011 Asset/Liability Study
● Two funding policies modeled: – Upper Bound: Statutory appropriations rate (Section 15-155)
– Overall objective of achieving 90% funding ratio by 2045 – Expected to increase to 31% by 2015 using new Experience Study – Rate would vary depending on future market performance, subject to caps.
– Lower Bound: Flat rate contribution equal to current rate of Payroll of 20%. Schedule of Contributions in $Millions
Net ARC State Shortfall Payroll State (% Payroll)1997 433 182 (251) 2,298,029 8%1998 290 228 (63) 2,377,578 10%1999 296 238 (58) 2,411,118 10%2000 325 241 (84) 2,424,209 10%2001 327 247 (79) 2,474,631 10%2002 435 256 (179) 2,607,155 10%2003 598 285 (312) 2,763,428 10%2004 691 1,758 1,067 2,814,071 62%2005 608 285 (322) 2,939,185 10%2006 662 180 (482) 3,054,100 6%2007 706 261 (445) 3,180,985 8%2008 708 345 (363) 3,303,220 10%2009 874 452 (422) 3,463,922 13%2010 1,003 697 (307) 3,491,071 20%2011 1,239 845 (394) 4,080,079 20%
2015 1,585 1,422 (163) 4,569,185 31%2020 1,681 1,641 (40) 5,307,591 31%2030 1,760 2,270 510 7,426,307 31%
Source: Gabriel, Roeder Smith & Company Payroll changes in 2011 from DB Plan only to Total Uncapped
Actuarial Model Funding Policy
Exhibit 5
27State Universities Retirement System of Illinois Knowledge. Experience. Integrity.
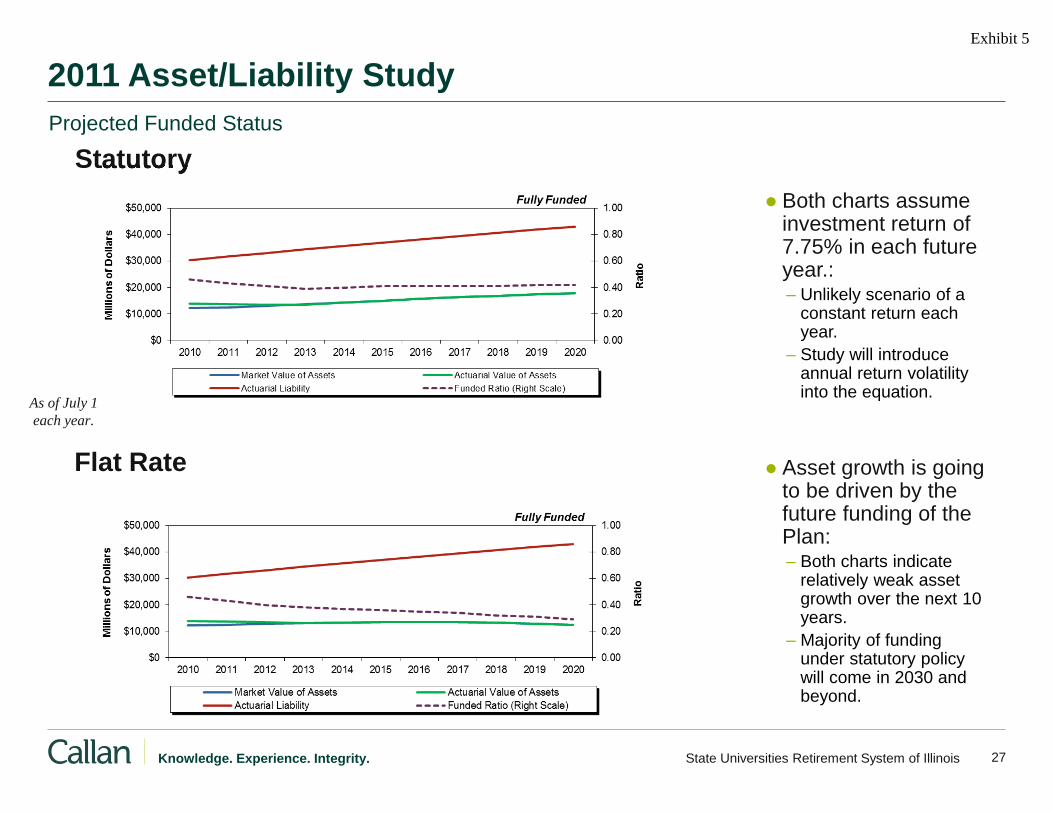
2011 Asset/Liability Study
● Both charts assume investment return of 7.75% in each future year.: – Unlikely scenario of a
constant return each year.
– Study will introduce annual return volatility into the equation.
● Asset growth is going to be driven by the future funding of the Plan: – Both charts indicate
relatively weak asset growth over the next 10 years.
– Majority of funding under statutory policy will come in 2030 and beyond.
Statutory
Flat Rate
As of July 1 each year.
Statutory Projected Funded Status
Exhibit 5

28State Universities Retirement System of Illinois Knowledge. Experience. Integrity.
2011 Asset/Liability Study
● Net cash flow = Contributions – (Benefit Payments + Expenses)
● Liquidity needs are projected to be manageable under the statutory policy.
● Under the flat rate policy, liquidity becomes an issue 7-10years out. Need to introduce investment volatility into liquidity equation.
● Liquidity needs help define the appropriate time horizon for plan investments and shape the ability of the Plan to commit to illiquid asset classes.
● The current size of benefit payments and the potential for underfunding suggest that it may be prudent to prepare for liquidity in the event of severe market weakness.
As of July 1 each year.
Statutory
Flat Rate
As of July 1 each year.
Statutory Net Cash Flow
Exhibit 5

Callan - Investment Consulting Services
Portfolio Structure
Exhibit 5
30 State Universities Retirement System of Illinois Knowledge. Experience. Integrity.
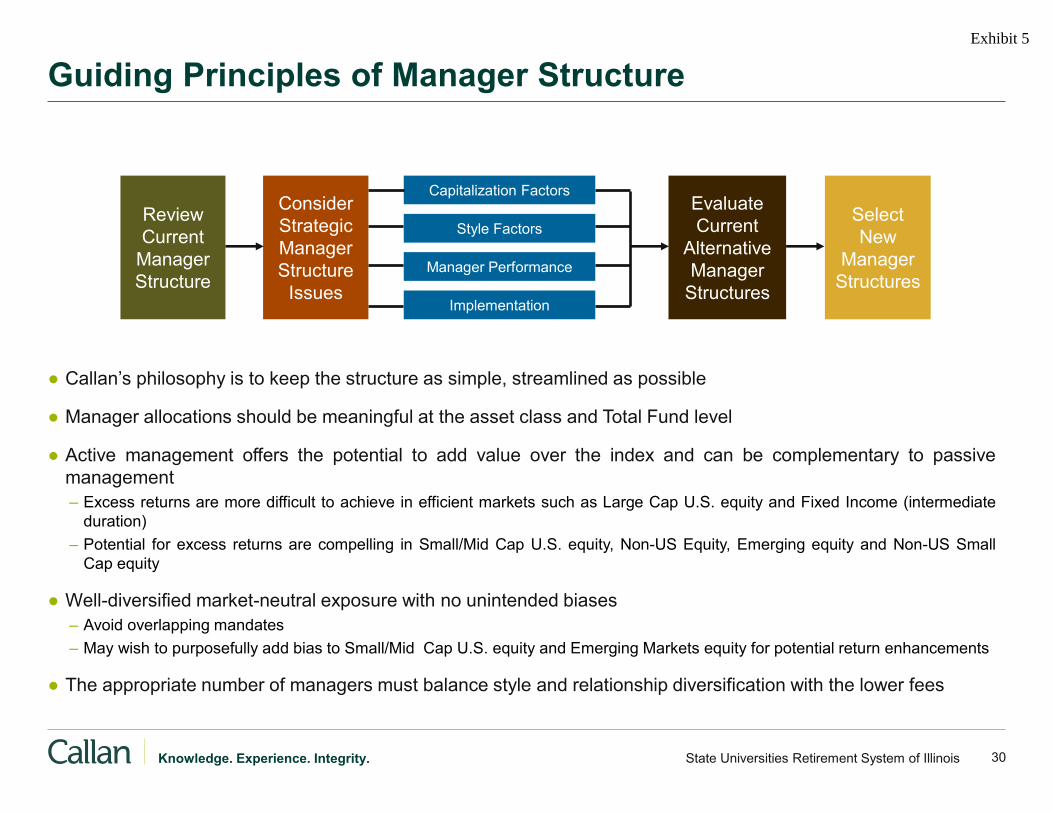
Guiding Principles of Manager Structure
● Callan’s philosophy is to keep the structure as simple, streamlined as possible
● Manager allocations should be meaningful at the asset class and Total Fund level
● Active management offers the potential to add value over the index and can be complementary to passive management – Excess returns are more difficult to achieve in efficient markets such as Large Cap U.S. equity and Fixed Income (intermediate
duration) – Potential for excess returns are compelling in Small/Mid Cap U.S. equity, Non-US Equity, Emerging equity and Non-US Small
Cap equity
● Well-diversified market-neutral exposure with no unintended biases – Avoid overlapping mandates – May wish to purposefully add bias to Small/Mid Cap U.S. equity and Emerging Markets equity for potential return enhancements
● The appropriate number of managers must balance style and relationship diversification with the lower fees
Review Current
Manager Structure
Consider Strategic Manager Structure
Issues
Capitalization Factors
Style Factors
Manager Performance
Implementation
Evaluate Current
Alternative Manager
Structures
Select New
Manager Structures
Exhibit 5

31 State Universities Retirement System of Illinois Knowledge. Experience. Integrity.
Summary of Structure Recommendations (2011-2013)
● Domestic Equity – Increase allocation to small/mid cap strategies (+7%) – More balanced approach to sub-portfolios and managers – Significantly Increased allocation to MDP
● Non-U.S. Equity – Decrease allocation to active EAFE Strategies (-11%) – Increase allocation to active ACWI ex US strategies (+10%) – Consolidate passive assets in ACWI ex US mandate (+4%) – Decrease passive emerging markets strategies (-8%) – Move to actively managed mandate for dedicated Emerging Markets (+5%) – More balanced approach to sub-portfolios and managers – Significantly Increased allocation to MDP
● Fixed Income – Introduce unconstrained strategy to enhance return potential in rising interest rate environment. – Reduce passive exposure (-5%) – Significantly Increased allocation to MDP
● Real Estate – Implement 10% allocation: 6% in private real estate and 4% REITS – Of the real estate allocation, dedicate 80% Core (includes REITS) – Of the Real Estate allocation, dedicate 20% Non-Core (value-add and opportunistic)
Exhibit 5
Callan - Investment Consulting Services
Research Capabilities
Exhibit 5

33 State Universities Retirement System of Illinois Knowledge. Experience. Integrity.
Global Manager Research
Inga Sweet BA
Co-lead and Manager of the Global Manager Research Group and Manager of the Published Research Group
Mark Stahl BA, CFA
Domestic Equity
Kelly Cliff BA, CFA, CAIA
CIO of Public Markets, and co-lead of the Global Manager Research Group
Brett Cornwell BA, CFA
Fixed Income
Steve Center BA, MBA, CFA
Fixed Income
Lauren Etcheverry BS, CFA
Domestic Equity MWDO Liaison
Andy Iseri BS, CFA
International Equity
Jessica Ransdall BA
International Equity
Ho Hwang BA
International Equity
Public Markets Research Professionals
Exhibit 5

34 State Universities Retirement System of Illinois Knowledge. Experience. Integrity.
Global Manager Research
Kelly Cliff BA, CFA, CAIA Public & Multi-Strategy Real Return Commodities
Michael Bise BA Private Equity
Brett Cornwell BA, CFA TIPS, MLPs
Sally Haskins BA, MS General U.S., Asian and Latin American Real Estate
Steve Center BA, CFA, MBA TIPS
Jim McKee BA, MBA Hedge Funds
Jay Nayak BA Public Real Estate Securities , Debt, and European Strategies
Gary Robertson BA, MBA Private Equity Private Energy
Avery Robinson BS, MBA, CAIA Core Real Estate , Infrastructure, and Emerging Managers
Jamie Shen BS General Real Estate, Agriculture
Lauren Sertich BA General Real Estate and Timber
Brian Kmetz BS, BA, CIPM Hedge Funds
Alternative Investment Research Professionals
Jonathan Gould BS New Offerings Research
Exhibit 5
35 State Universities Retirement System of Illinois Knowledge. Experience. Integrity.
Global Manager Research By the Numbers
Global Manager Research
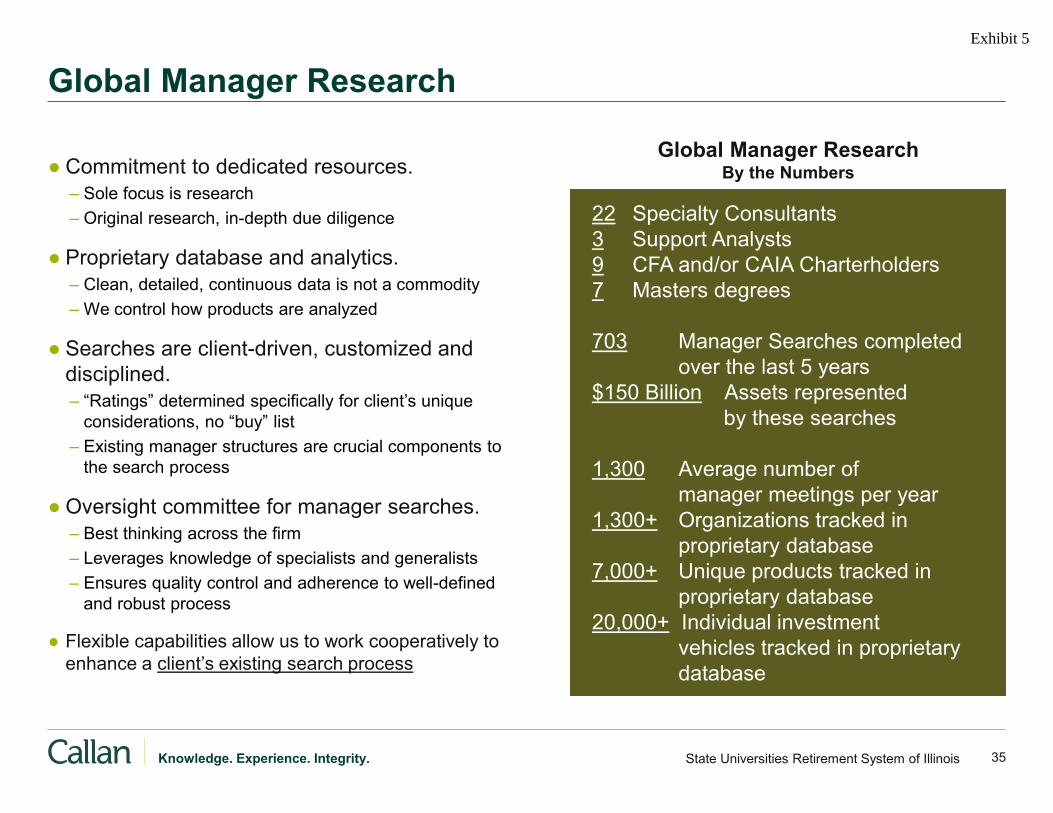
● Commitment to dedicated resources. – Sole focus is research – Original research, in-depth due diligence
● Proprietary database and analytics. – Clean, detailed, continuous data is not a commodity – We control how products are analyzed
● Searches are client-driven, customized and disciplined. – “Ratings” determined specifically for client’s unique
considerations, no “buy” list – Existing manager structures are crucial components to
the search process
● Oversight committee for manager searches. – Best thinking across the firm – Leverages knowledge of specialists and generalists – Ensures quality control and adherence to well-defined
and robust process
● Flexible capabilities allow us to work cooperatively to enhance a client’s existing search process
22 Specialty Consultants 3 Support Analysts 9 CFA and/or CAIA Charterholders 7 Masters degrees 703 Manager Searches completed over the last 5 years $150 Billion Assets represented by these searches 1,300 Average number of manager meetings per year 1,300+ Organizations tracked in proprietary database 7,000+ Unique products tracked in proprietary database 20,000+ Individual investment vehicles tracked in proprietary database
Exhibit 5

36 State Universities Retirement System of Illinois Knowledge. Experience. Integrity.
Manager Search Process
The Process: • Every search starts from scratch, no
“Approved” or “Buy” lists • Backed by extensive due diligence
and accumulated knowledge of specialist and generalist consultants
• Disciplined and Consistent • Client driven, customized • Utilizes peer review - Manager
Search Committee to ensure quality control
The Outcome: • The identification of the managers
and products that are the best fit for the investment program and the specific mandate
Client cooperation: • All parts of this process are
transparent and client involvement is encouraged. Any part of this process can be used to supplement a client’s existing search process.
Exhibit 5

37 State Universities Retirement System of Illinois Knowledge. Experience. Integrity.
Emerging Manager and MWDO Firm Research*
● Callan Connects – Launched in 2010 to proactively increase coverage of emerging managers and MWDO firms
– One day each quarter is reserved for Callan research and consulting professionals to meet with emerging managers and MWDO firms. Managers are given 30 minutes to present their firm and its products
– Callan Connects rotates across the nation to help increase access
– Supplements ongoing research by the real assets team
● Callan has extensive experience with Emerging Managers, and Minority, Woman, and Disabled Owned (MWDO) Firms – Callan consults to four Illinois plans with legislative requirements for investment management inclusion
– Callan regularly participates in the National Association of Securities Professionals conferences, as well as state sponsored conferences (i.e., New York State Teachers, Texas State Teachers). Callan is also a sponsor of the Robert Toigo Foundation
– Since the inception of the Callan Connects program through December 2012, Callan professionals have participated in 156 meetings with emerging and MWDO firms
– There are 258 firms classified as MWDO in Callan’s database
– MWDO firms manage over $21 billion for Callan clients, $1.6 billion in assets for Callan’s real estate clients
*Information as of September 30, 2012 unless indicated differently.
Exhibit 5
38State Universities Retirement System of Illinois Knowledge. Experience. Integrity.
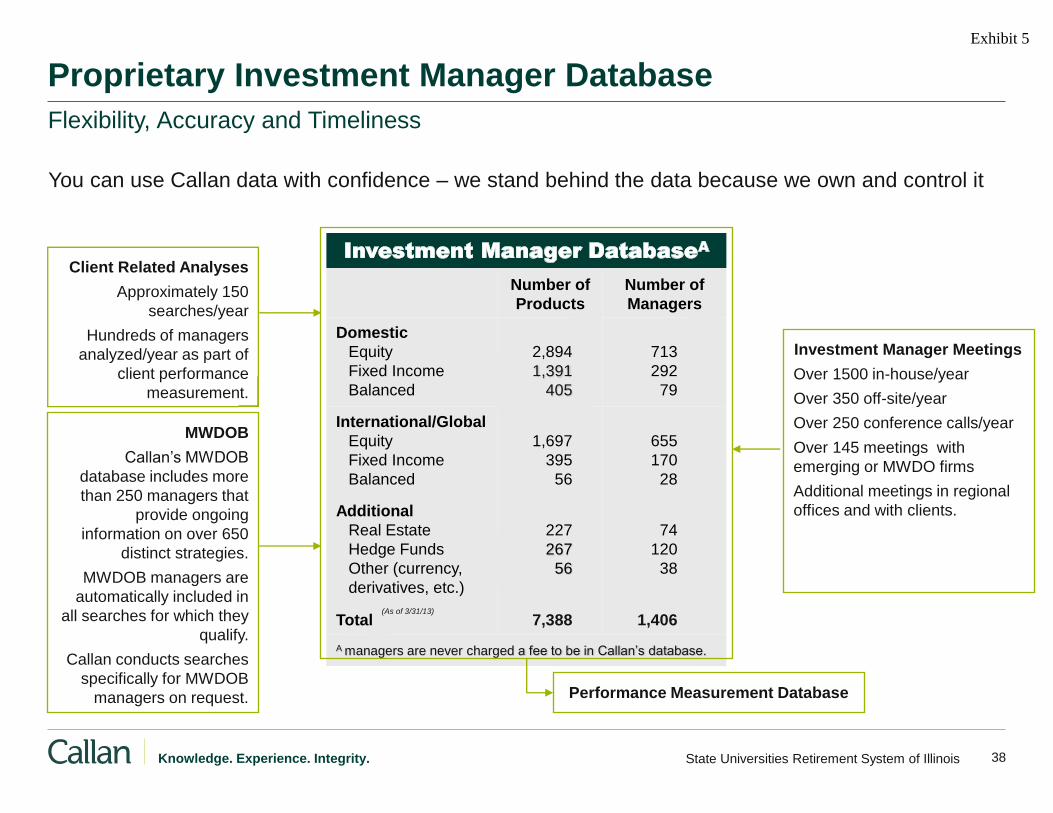
Proprietary Investment Manager Database Flexibility, Accuracy and Timeliness
You can use Callan data with confidence – we stand behind the data because we own and control it
Performance Measurement Database
Investment Manager Meetings Over 1500 in-house/year Over 350 off-site/year Over 250 conference calls/year Over 145 meetings with emerging or MWDO firms Additional meetings in regional offices and with clients.
Client Related Analyses Approximately 150
searches/year Hundreds of managers
analyzed/year as part of client performance
measurement.
MWDOB Callan’s MWDOB
database includes more than 250 managers that
provide ongoing information on over 650
distinct strategies. MWDOB managers are
automatically included in all searches for which they
qualify. Callan conducts searches
specifically for MWDOB managers on request.
Investment Manager DatabaseA
Number ofProducts
Number of Managers
Domestic Equity Fixed Income Balanced
2,894 1,391
405
713292
79
International/GlobalEquity Fixed Income Balanced
1,697 395
56
655170
28
Additional Real Estate Hedge Funds Other (currency, derivatives, etc.)
227267
56
74120
38
Total 7,388 1,406 A managers are never charged a fee to be in Callan’s database.
(As of 3/31/13)
Exhibit 5

39 State Universities Retirement System of Illinois Knowledge. Experience. Integrity.
Real Assets Manager Search Activity
● Dedicated team conducts all real assets manager research
● Open door policy with managers
● Coverage assigned by geography or specialty
● 300+ meetings per year, including on-sites and international due diligence
● 124 searches or evaluations; $11 billion allocated since 2008
● Active across the risk spectrum, strategy and vehicle type
● Recent activity was diversified across nearly all categories
Strategy
Number of Searches & Evaluations 2008-YTD
2013
$ Millions Allocated 2008-YTD
2013 Core 43 $5,389
Value Added 21 $1,014
Opportunistic 11 $745
International 12 $370
Debt 10 $450
Specialty 8 $190
Fund of Funds 3 $258
US REITS 3 $150
Global/Intl REITs 3 $129
Energy 7 $350
Infrastructure 4 $1,000
Timber 5 $732
Agriculture 2 $265
TOTAL 125 $10,692
Exhibit 5

Defined Contribution Practice
Callan - Investment Consulting Services
Exhibit 5
41 State Universities Retirement System of Illinois Knowledge. Experience. Integrity.
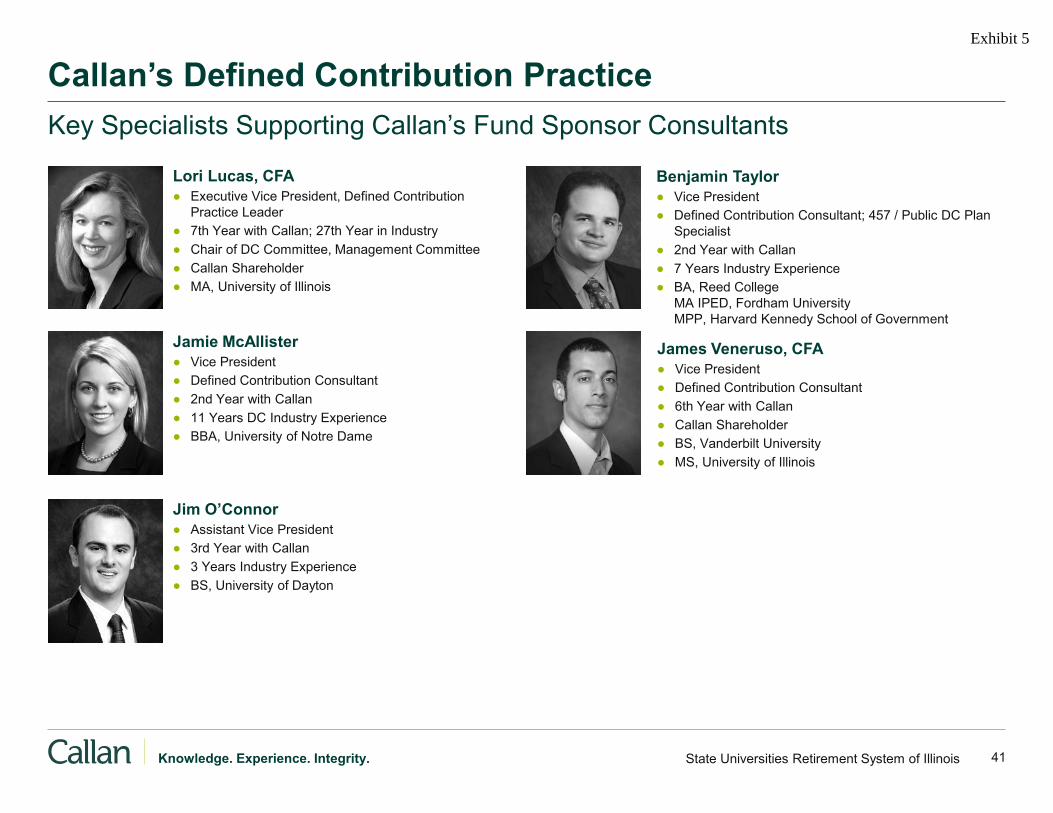
Callan’s Defined Contribution Practice Key Specialists Supporting Callan’s Fund Sponsor Consultants
Lori Lucas, CFA ● Executive Vice President, Defined Contribution
Practice Leader ● 7th Year with Callan; 27th Year in Industry ● Chair of DC Committee, Management Committee ● Callan Shareholder ● MA, University of Illinois
Jamie McAllister ● Vice President ● Defined Contribution Consultant ● 2nd Year with Callan ● 11 Years DC Industry Experience ● BBA, University of Notre Dame
James Veneruso, CFA ● Vice President ● Defined Contribution Consultant ● 6th Year with Callan ● Callan Shareholder ● BS, Vanderbilt University ● MS, University of Illinois
Benjamin Taylor ● Vice President ● Defined Contribution Consultant; 457 / Public DC Plan
Specialist ● 2nd Year with Callan ● 7 Years Industry Experience ● BA, Reed College
MA IPED, Fordham University MPP, Harvard Kennedy School of Government
Jim O’Connor ● Assistant Vice President ● 3rd Year with Callan ● 3 Years Industry Experience ● BS, University of Dayton
Exhibit 5
42 State Universities Retirement System of Illinois Knowledge. Experience. Integrity.
Callan’s Defined Contribution Practice
● Provide thought leadership and strategic direction for Callan’s DC business – TDVantageTM – Callan Target Date Index – Callan DC IndexTM
– Proprietary recordkeeping database – Proprietary institutional mutual fund database – Callan DC Plan Sponsor Survey
● Support Callan’s clients and consultants on DC projects and issues – DC investment structure issues – Consulting on fiduciary requirements and regulatory updates – Fee analyses – Recordkeeper searches – Advice/managed accounts provider searches – Fund mapping recommendations – Participant communication evaluation – Development/review of investment policy statement – DC Trends Studies / DC Insights
● Formal testimony and commentary on DC topics to regulators – 408(b)2 regulations – DOL/SEC hearings on TDFs – Advice Regulations – SEC Target Date Disclosure Amendment – Stable Value Comment Letter – Senate HELP Subcommittee Testimony on DC plans – ERISA Advisory Council Testimony
Exhibit 5

43State Universities Retirement System of Illinois Knowledge. Experience. Integrity.
Investment Structure Evaluation
• Callan’s Philosophical Investment Tenets– Beware of Over Diversification; Simpler can be Better – Give Access to Capitalization and Style Spectrum in Core Options – Cost is Important
Risk Spectrum Tier I Asset Allocation Options Tier II. Core Options Tier III. Specialty OptionsConservative
Target Date Funds Capital Preservation
Core Plus Bond
S&P 500 Index
International Equity
Small\Mid Cap Core
Aggressive
Clean Sheet Investment Line-Up
Tier II Core Options Tier III Specialty Options
Exhibit 5

44 State Universities Retirement System of Illinois Knowledge. Experience. Integrity.
Target Date Fund Performance Measurement
● Callan Target Date Index (“CAI Consensus Index”) is constructed using 44 different target date providers' glidepaths (using up to 17 asset classes). – Uses an equal weighted average glidepath asset allocation over the entire possible 80 year span of the
constituent glidepaths (40 pre-retirement accumulation years, 40 post-retirement decumulation years) – The resulting "consensus" glidepath represents the glidepath you would own if you invested equally in each of
the providers' glidepaths
● Performance of a target date fund is measured relative to Callan Target Date Index and the glidepath return. – If the fund’s glidepath return ranks above CAI Consensus Index, the outperformance can be attributed to the
fund’s asset allocation or glidepath – If the fund ranks above its glidepath return, the outperformance is attributable to the performance of the
underlying funds
Overview
Exhibit 5

45 State Universities Retirement System of Illinois Knowledge. Experience. Integrity.
Target Date Family Performance vs. Peer Families (cheapest net)
Target Date Family Glide Path Returns vs. Peer Families (cheapest net)
The Fidelity funds have lagged peers and have underperformed relative to the Callan Consensus Glidepath in all but the one year period.
The Fidelity funds glidepath returns have likewise featured lackluster performance to peers and the Callan Consensus Glidepath.
Target Date Analytics: Family Performance Breakdown
(4%)(2%)
0%2%4%6%8%
10%12%14%16%
Last Quarter Last Year Last 2 Years Last 3 Years Last 5 Years
(63)(70)
(89)(82)
(73)(45)
(73)(50)
(86)(53)
10th Percentile 0.10 13.02 7.09 12.01 5.9325th Percentile (0.19) 12.27 6.60 11.61 5.53
Median (0.38) 11.72 5.92 11.20 5.1775th Percentile (0.78) 10.81 4.83 10.13 4.4590th Percentile (1.03) 9.53 4.35 9.26 4.00
Fidelity Mgmt Activ e (0.62) 9.96 4.85 10.13 4.03
CAI ConsensusALL Glidepath (0.64) 10.46 6.13 11.19 5.11
(4%)(2%)
0%2%4%6%8%
10%12%14%16%
Last Quarter Last Year Last 2 Years Last 3 Years Last 5 Years
(77)(51)
(82)(44)
(82)(50)
(74)(42)
(84)(66)
10th Percentile 0.06 12.76 7.61 12.64 5.9325th Percentile (0.10) 11.61 7.08 12.02 5.66
Median (0.60) 10.33 6.13 10.92 5.2775th Percentile (0.97) 9.40 5.71 10.53 5.0190th Percentile (1.12) 8.73 5.06 9.90 4.73
Fidelity Mgmt Activ e (1.04) 9.08 5.43 10.56 4.92
CAI ConsensusALL Glidepath (0.64) 10.46 6.13 11.19 5.11
Exhibit 5
46 State Universities Retirement System of Illinois Knowledge. Experience. Integrity.
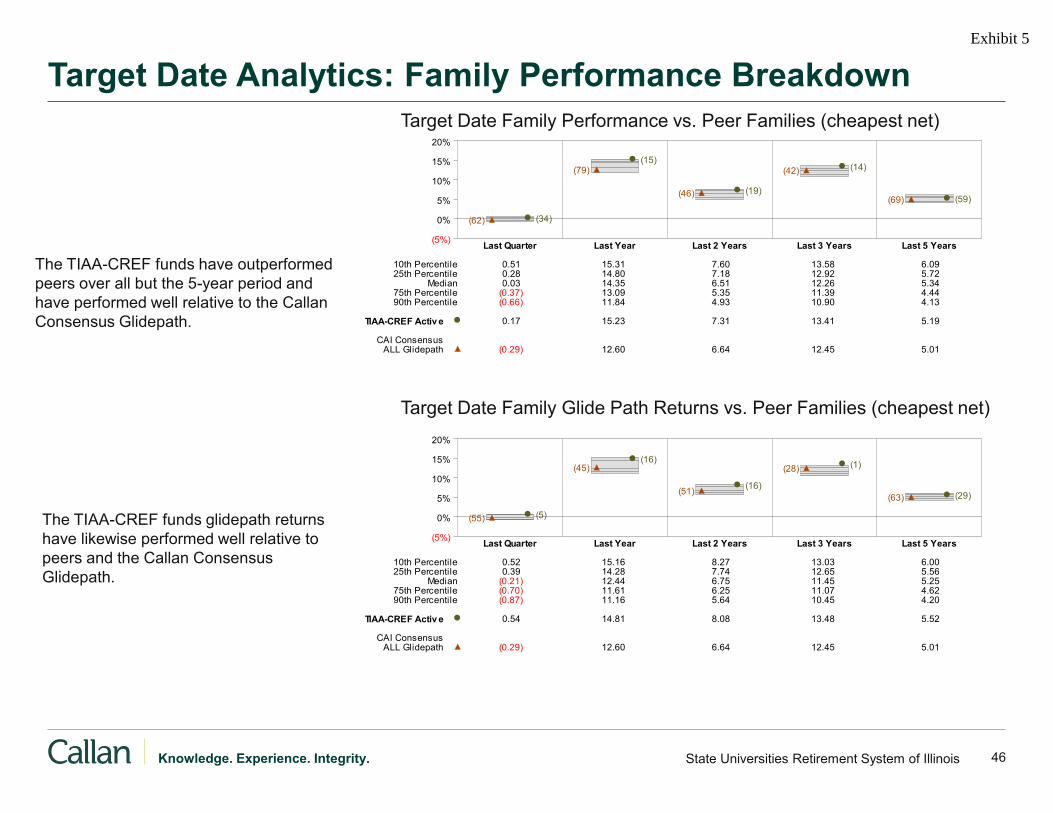
Target Date Analytics: Family Performance Breakdown Target Date Family Performance vs. Peer Families (cheapest net)
Target Date Family Glide Path Returns vs. Peer Families (cheapest net)
The TIAA-CREF funds have outperformed peers over all but the 5-year period and have performed well relative to the Callan Consensus Glidepath.
The TIAA-CREF funds glidepath returns have likewise performed well relative to peers and the Callan Consensus Glidepath.
(5%)
0%
5%
10%
15%
20%
Last Quarter Last Year Last 2 Years Last 3 Years Last 5 Years
(34)(62)
(15)(79)
(19)(46)
(14)(42)
(59)(69)
10th Percentile 0.51 15.31 7.60 13.58 6.0925th Percentile 0.28 14.80 7.18 12.92 5.72
Median 0.03 14.35 6.51 12.26 5.3475th Percentile (0.37) 13.09 5.35 11.39 4.4490th Percentile (0.66) 11.84 4.93 10.90 4.13
TIAA-CREF Activ e 0.17 15.23 7.31 13.41 5.19
CAI ConsensusALL Glidepath (0.29) 12.60 6.64 12.45 5.01
(5%)
0%
5%
10%
15%
20%
Last Quarter Last Year Last 2 Years Last 3 Years Last 5 Years
(5)(55)
(16)(45)
(16)(51)
(1)(28)
(29)(63)
10th Percentile 0.52 15.16 8.27 13.03 6.0025th Percentile 0.39 14.28 7.74 12.65 5.56
Median (0.21) 12.44 6.75 11.45 5.2575th Percentile (0.70) 11.61 6.25 11.07 4.6290th Percentile (0.87) 11.16 5.64 10.45 4.20
TIAA-CREF Activ e 0.54 14.81 8.08 13.48 5.52
CAI ConsensusALL Glidepath (0.29) 12.60 6.64 12.45 5.01
Exhibit 5

47 State Universities Retirement System of Illinois Knowledge. Experience. Integrity.
0%
10%
20%
30%
40%
50%
60%
70%
80%
90%
100%
25 28 31 34 37 40 43 46 49 52 55 58 61 64 67 70 73 76 79 82 85 88 91 94 97 100
103
Effe
ctiv
e Eq
uity
Age
TIAA-Cref Fidelity CAI Consensus
Target Date Analytics: Glidepath Comparison
The Fidelity and TIAA glidepath vary in their equity exposure, with Fidelity being the more conservative of the two.
Exhibit 5

48 State Universities Retirement System of Illinois Knowledge. Experience. Integrity.
Fee Analysis and Recordkeeper Due Diligence
● Callan regularly conducts defined contribution plan fee analysis for our clients; the process and results can help accomplish four objectives:
– Assist plan fiduciaries in documenting their awareness and understanding of how plan costs are paid
– Benchmark the plan’s current services versus industry best practices
– Establish an appropriate mechanism for paying plan expenses prospectively, given the plan size and asset scale
– Negotiate possibly more competitive fee terms with your provider
● Callan frequently conducts fee analyses and recordkeeper searches and our capabilities are extensive:
– Total fee studies and recordkeeper searches in the past 24 months: 28
– Callan’s recordkeeper database includes two dozen recordkeepers
– Callan’s recordkeeper questionnaire spans over 800 questions for each market segment: core, large, and mega plans
– Questionnaire is updated annually on our online ProposalTech system
Exhibit 5

Portfolio Monitoring
Callan - Investment Consulting Services
Exhibit 5

50 State Universities Retirement System of Illinois Knowledge. Experience. Integrity.
Monitoring and Evaluation Performance Measurement, Database, Investment Analytics
35+ year commitment to the business of performance measurement.
25 Dedicated performance analysts
5 Analytical solutions experts 5 Investment Database
specialists 10 Programmers/systems
analysts
Allie Bañuelos BA
Manager of Client Report Services
Ivan “Butch” Cliff BA, CFA
Director of Investment Research & Operations
Brendan Egan BA
Manager of the Analytical Solutions Group
Alpay Soyoguz BA, CFA
Manager of the Database
Denise Steele BS
Director of Information Technology
● Proprietary Data – Comprehensive and dedicated effort ensures accuracy and timeliness
● Innovative Analytical Tools – Facilitates performance and risk evaluation
● Customized, Flexible, Accurate Reporting
● Empower Clients with our Software & Data – Provide and train client staff with sophisticated software, databases, and
“flow-through” of their client-specific performance/risk/holdings data – Help clients enhance their existing internal reporting processes
Exhibit 5
51 State Universities Retirement System of Illinois Knowledge. Experience. Integrity.
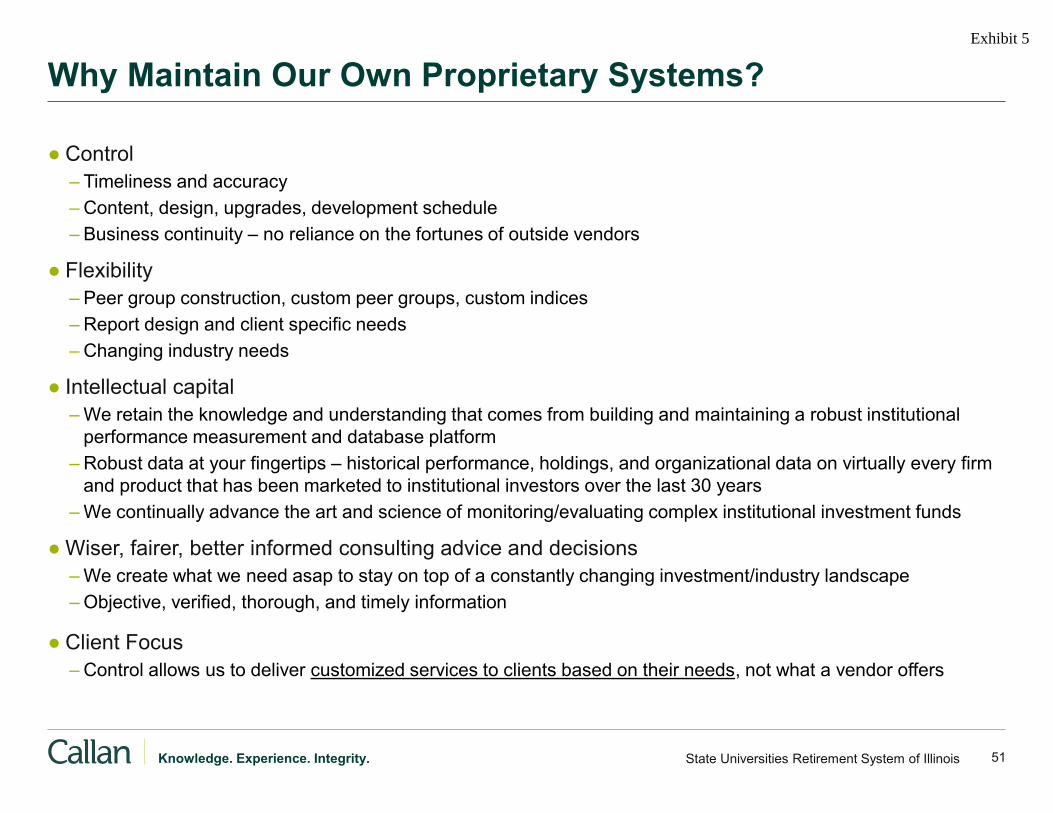
Why Maintain Our Own Proprietary Systems?
● Control – Timeliness and accuracy – Content, design, upgrades, development schedule – Business continuity – no reliance on the fortunes of outside vendors
● Flexibility – Peer group construction, custom peer groups, custom indices – Report design and client specific needs – Changing industry needs
● Intellectual capital – We retain the knowledge and understanding that comes from building and maintaining a robust institutional
performance measurement and database platform – Robust data at your fingertips – historical performance, holdings, and organizational data on virtually every firm
and product that has been marketed to institutional investors over the last 30 years – We continually advance the art and science of monitoring/evaluating complex institutional investment funds
● Wiser, fairer, better informed consulting advice and decisions – We create what we need asap to stay on top of a constantly changing investment/industry landscape – Objective, verified, thorough, and timely information
● Client Focus – Control allows us to deliver customized services to clients based on their needs, not what a vendor offers
Exhibit 5
52State Universities Retirement System of Illinois Knowledge. Experience. Integrity.
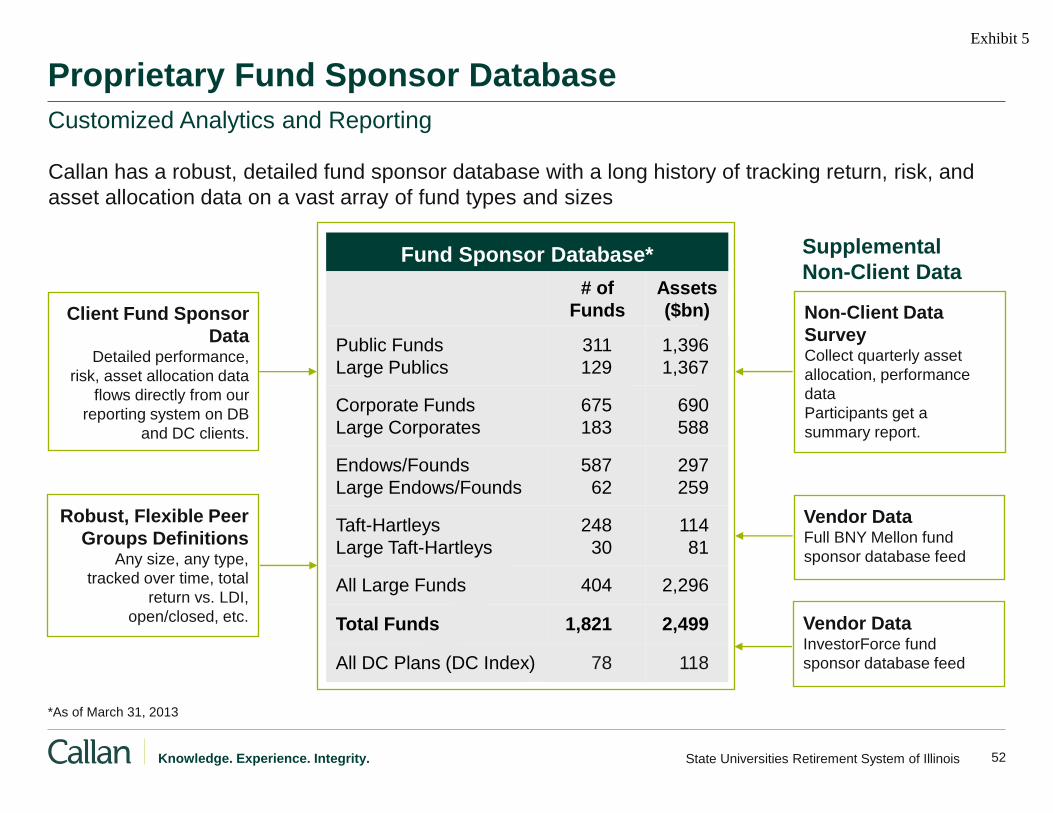
Callan has a robust, detailed fund sponsor database with a long history of tracking return, risk, and asset allocation data on a vast array of fund types and sizes
Proprietary Fund Sponsor Database
Vendor Data Full BNY Mellon fund sponsor database feed
Non-Client Data Survey Collect quarterly asset allocation, performance data Participants get a summary report.
Supplemental Non-Client Data
Client Fund Sponsor Data
Detailed performance, risk, asset allocation data
flows directly from our reporting system on DB
and DC clients.
Robust, Flexible Peer Groups Definitions
Any size, any type, tracked over time, total
return vs. LDI, open/closed, etc.
Fund Sponsor Database*# of
FundsAssets ($bn)
Public FundsLarge Publics
311129
1,396 1,367
Corporate FundsLarge Corporates
675183
690588
Endows/FoundsLarge Endows/Founds
58762
297259
Taft-Hartleys Large Taft-Hartleys
24830
114 81
All Large Funds 404 2,296
Total Funds 1,821 2,499
All DC Plans (DC Index) 78 118
*As of March 31, 2013
Customized Analytics and Reporting
Vendor Data InvestorForce fund sponsor database feed
Exhibit 5

53 State Universities Retirement System of Illinois Knowledge. Experience. Integrity.
Performance Measurement and Evaluation
● Style-Based Peer Groups
● Portfolio Characteristics Rankings versus Peer Groups
● Performance Attribution for Global Equity Portfolios
● Total Fund Attribution for Global Multi-Asset Class Portfolios
● Holdings-Based Global Equity Style Analysis
● Asset Allocation Adjusted Total Fund Rankings
● Active Share Analysis for Global Equity Portfolios
● Target Date Indices, Peer Groups, and GlidePath Evaluation Tools
● Total Fund Risk Attribution and Diversification Analysis (forward-looking)
● Drawdown Risk Analysis
● Portfolio “ESG” Analysis and Scoring Metrics
● Portfolio Quality Analysis and Scoring Metrics
● Future improvements and breakthroughs…
A Heritage of Reporting Innovation
Exhibit 5

54 State Universities Retirement System of Illinois Knowledge. Experience. Integrity.
History of Analytical Innovation
The f ollowing is f orward-looking analy sis of the projected long-term total f und risk, return, and div ersif ication benef its(improv ement in risk and Sharpe ratio) using long-term capital market assumptions. The top table display s the projectedresults and div ersif ication benef its f or the total f und using both the actual and target asset allocations. The middle and bottomexhibits giv e a detailed attribution by asset class of the sources of projected total f und risk and return. This analy sisjuxtaposes dollar weights with projected risk weights and examines the projected risk and return contribution by asset class.
0%
20%
40%
60%
80%
100%
120%
140%
Current $ Weights Current Risk Weights0%
2%
4%
6%
8%
10%
12%
14%
16%
18%
20%
Current Return Contrib Current Risk Contrib
State Universities Retirement System of IllinoisTotal Fund Projected Risk Analysisas of June 30, 2013
Capital Market Assumptions: Callan 2013Total Fund Projected Risk Profile
Proj ected Proj ected Proj ected Risk w/o Risk SharpeReturn Risk Sharpe Div ersification Div ersification Div ersification
Current Asset Allocation 6.84% 14.69% 0.33 16.58% 1.89% 0.04%
Target Asset Allocation 6.75% 14.32% 0.33 16.27% 1.95% 0.04%
Projected Risk and Return Sources
Domestic Broad Eq Intl Equity Private Equity Global Equity Broad Domestic REIT Real Estate Opportunistic Other Dom Fixed TIPSDomestic Fixed
Detailed Risk and Return Sources by Asset ClassCurrent Target Current Target Proj ected Proj ected Proj ectedDollar Dollar Proj ected Proj ected Risk Risk Return Risk Rtn/RiskWeight Weight Return Risk Weight Weight Contrib Contrib Contrib
Domestic Broad Eq 33.25% 32.00% 7.63% 18.94% 41.18% 40.59% 2.72% 6.05% 0.45x
Intl Equity 20.35% 21.00% 7.50% 20.10% 26.33% 27.90% 1.64% 3.87% 0.42x
Private Equity 7.20% 6.00% 8.63% 30.90% 14.39% 12.27% 0.67% 2.11% 0.32x
Global Equity Broad 8.26% 8.00% 7.50% 20.10% 10.84% 10.79% 0.67% 1.59% 0.42x
Domestic REIT 3.95% 4.00% 7.26% 21.00% 4.95% 5.16% 0.31% 0.73% 0.42x
Real Estate 2.54% 3.00% 6.21% 17.50% 2.36% 2.87% 0.17% 0.35% 0.49x
Opportunistic 0.52% 1.00% 6.21% 17.50% 0.48% 0.96% 0.03% 0.07% 0.49x
Other Dom Fixed 2.85% 2.85% 2.51% 3.75% (0.04% ) (0.04%) 0.08% (0.01%) (12.87x)
TIPS 3.84% 4.00% 2.30% 5.00% (0.17% ) (0.17%) 0.09% (0.02%) (3.91x)
Domestic Fixed 17.23% 18.15% 2.51% 3.75% (0.33% ) (0.33%) 0.46% (0.05%) (9.65x)
State Universities Retirement System of Illinois 201
Exhibit 5
55 State Universities Retirement System of Illinois Knowledge. Experience. Integrity.
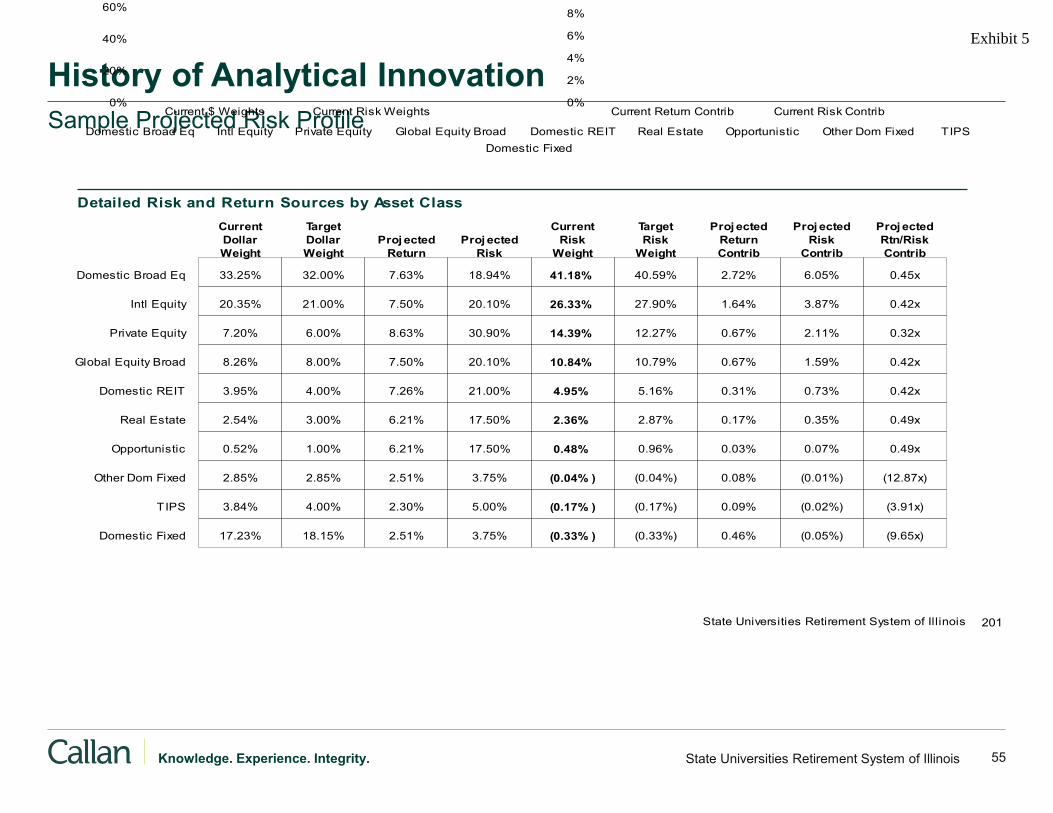
History of Analytical Innovation Sample Projected Risk Profile
The f ollowing is f orward-looking analy sis of the projected long-term total f und risk, return, and div ersif ication benef its(improv ement in risk and Sharpe ratio) using long-term capital market assumptions. The top table display s the projectedresults and div ersif ication benef its f or the total f und using both the actual and target asset allocations. The middle and bottomexhibits giv e a detailed attribution by asset class of the sources of projected total f und risk and return. This analy sisjuxtaposes dollar weights with projected risk weights and examines the projected risk and return contribution by asset class.
0%
20%
40%
60%
80%
100%
120%
140%
Current $ Weights Current Risk Weights0%
2%
4%
6%
8%
10%
12%
14%
16%
18%
20%
Current Return Contrib Current Risk Contrib
State Universities Retirement System of IllinoisTotal Fund Projected Risk Analysisas of June 30, 2013
Capital Market Assumptions: Callan 2013Total Fund Projected Risk Profile
Proj ected Proj ected Proj ected Risk w/o Risk SharpeReturn Risk Sharpe Div ersification Div ersification Div ersification
Current Asset Allocation 6.84% 14.69% 0.33 16.58% 1.89% 0.04%
Target Asset Allocation 6.75% 14.32% 0.33 16.27% 1.95% 0.04%
Projected Risk and Return Sources
Domestic Broad Eq Intl Equity Private Equity Global Equity Broad Domestic REIT Real Estate Opportunistic Other Dom Fixed TIPSDomestic Fixed
Detailed Risk and Return Sources by Asset ClassCurrent Target Current Target Proj ected Proj ected Proj ectedDollar Dollar Proj ected Proj ected Risk Risk Return Risk Rtn/RiskWeight Weight Return Risk Weight Weight Contrib Contrib Contrib
Domestic Broad Eq 33.25% 32.00% 7.63% 18.94% 41.18% 40.59% 2.72% 6.05% 0.45x
Intl Equity 20.35% 21.00% 7.50% 20.10% 26.33% 27.90% 1.64% 3.87% 0.42x
Private Equity 7.20% 6.00% 8.63% 30.90% 14.39% 12.27% 0.67% 2.11% 0.32x
Global Equity Broad 8.26% 8.00% 7.50% 20.10% 10.84% 10.79% 0.67% 1.59% 0.42x
Domestic REIT 3.95% 4.00% 7.26% 21.00% 4.95% 5.16% 0.31% 0.73% 0.42x
Real Estate 2.54% 3.00% 6.21% 17.50% 2.36% 2.87% 0.17% 0.35% 0.49x
Opportunistic 0.52% 1.00% 6.21% 17.50% 0.48% 0.96% 0.03% 0.07% 0.49x
Other Dom Fixed 2.85% 2.85% 2.51% 3.75% (0.04% ) (0.04%) 0.08% (0.01%) (12.87x)
TIPS 3.84% 4.00% 2.30% 5.00% (0.17% ) (0.17%) 0.09% (0.02%) (3.91x)
Domestic Fixed 17.23% 18.15% 2.51% 3.75% (0.33% ) (0.33%) 0.46% (0.05%) (9.65x)
State Universities Retirement System of Illinois 201
Exhibit 5
56 State Universities Retirement System of Illinois Knowledge. Experience. Integrity.
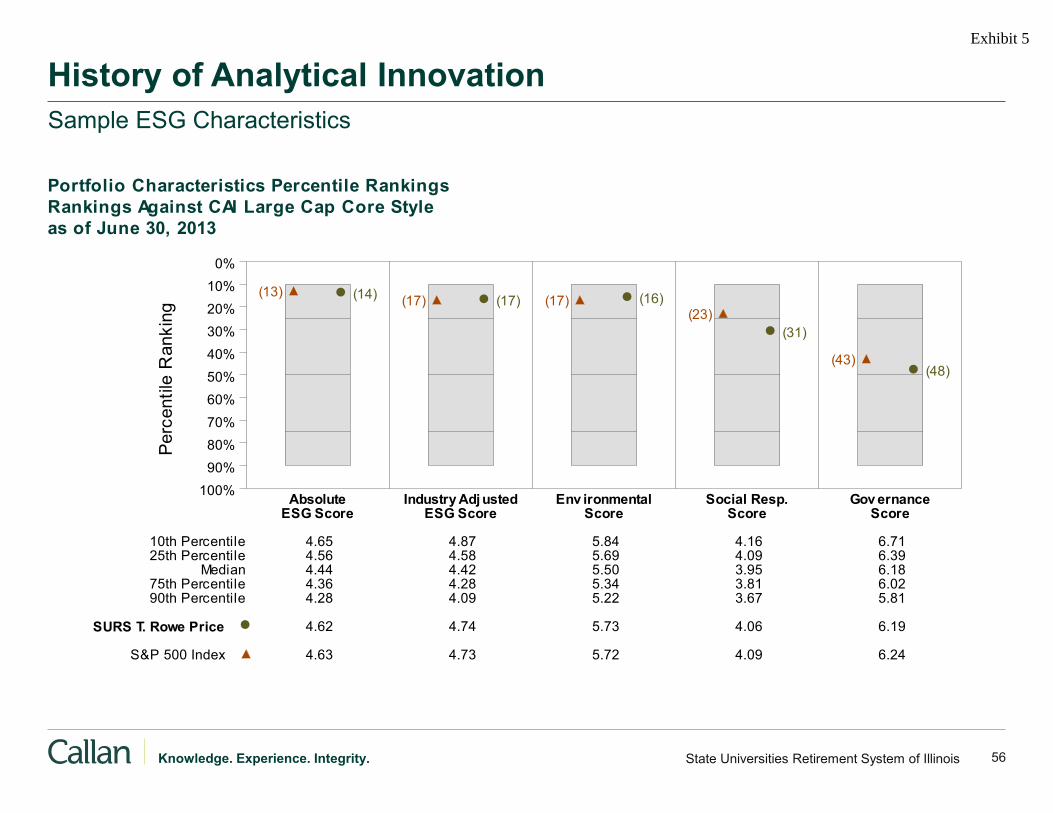
History of Analytical Innovation Sample ESG Characteristics
Portfolio Characteristics Percentile RankingsRankings Against CAI Large Cap Core Styleas of June 30, 2013
Perc
entil
e R
anki
ng
100%90%80%70%60%50%40%30%20%10%
0%
Absolute Industry Adj usted Env ironmental Social Resp. Gov ernanceESG Score ESG Score Score Score Score
(14)(13) (17)(17) (16)(17)
(31)(23)
(48)(43)
10th Percentile 4.65 4.87 5.84 4.16 6.7125th Percentile 4.56 4.58 5.69 4.09 6.39
Median 4.44 4.42 5.50 3.95 6.1875th Percentile 4.36 4.28 5.34 3.81 6.0290th Percentile 4.28 4.09 5.22 3.67 5.81
SURS T. Rowe Price 4.62 4.74 5.73 4.06 6.19
S&P 500 Index 4.63 4.73 5.72 4.09 6.24
Exhibit 5

57 State Universities Retirement System of Illinois Knowledge. Experience. Integrity.
History of Analytical Innovation Sample ESG Characteristics
Sector AllocationJune 30, 2013
0% 5% 10% 15% 20% 25%
Information Technology17.8%17.8%
18.5%
Financials15.9%
16.7%16.2%
Consumer Discretionary13.0%
12.2%13.6%
Health Care12.4%
50%
Mgr
MV
50%
Mgr
MV
12.7%13.9%
Consumer Staples10.7%10.5%
9.7%
Energy10.4%10.5%10.6%
Industrials10.1%10.1%10.3%
Materials4.2%
3.3%2.9%
Utilities2.9%
3.3%1.9%
Telecommunications2.8%2.8%
2.4%
SURS T. Rowe Price S&P 500 Index CAI Large Cap Core Style
DiversificationJune 30, 2013
0
50
100
150
200
250
300
Number of IssueSecurities Div ersification
(9)
(8)
10th Percentile 255 4325th Percentile 147 33
Median 98 2675th Percentile 58 2190th Percentile 38 15
SURS T. Rowe Price 257 46
S&P 500 Index 500 54
Sector WeightsThe graph below contrasts the manager's sector weights with those of the benchmark and median sector weights across themembers of the peer group. The magnitude of sector weight dif f erences f rom the index and the manager's sectordiv ersif ication are also shown. Div ersif ication by number and concentration of holdings are also compared to the benchmarkand peer group. Issue Div ersif ication represents by count, and Div ersif ication Ratio by percent, the number of holdings thatcomprise half of the portf olio's market v alue.
Exhibit 5
58 State Universities Retirement System of Illinois Knowledge. Experience. Integrity.
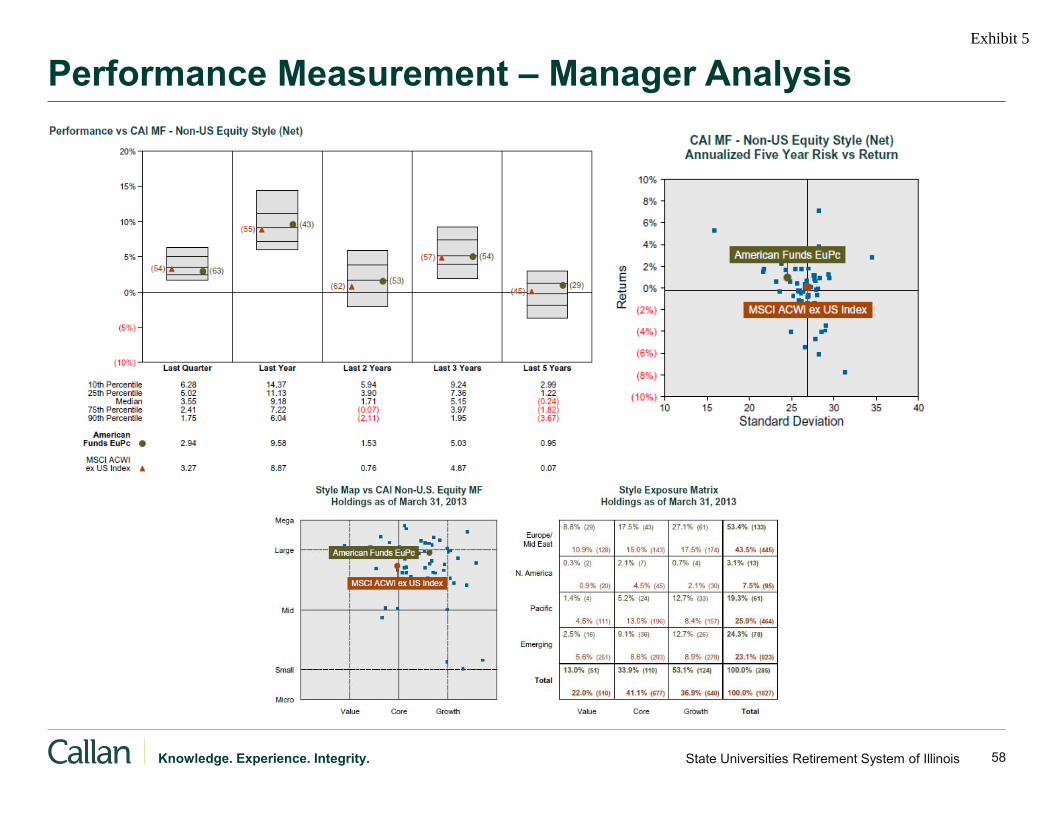
Performance Measurement – Manager Analysis Exhibit 5

59 State Universities Retirement System of Illinois Knowledge. Experience. Integrity.
Active Share 12.26%
Passive Share
87.74%
Sector Level Share Analysis
Index Active Share
40.61%
Non-Index Active Share
3.39%
Passive Share
56.00%
Holdings-Level Share Analysis
Index Active Share Within
Sector
Non-Index Active Share within
Sector
Total Active Share within
Sector Index Weight Manager Weight
Contribution to Total Portfolio Active Share
Consumer Discretionary 40.81% 4.64% 45.45% 11.02% 15.98% 6.80% Consumer Staples 28.46% 2.45% 30.91% 8.18% 6.78% 2.72% Energy 43.67% 1.70% 45.37% 10.51% 10.66% 5.06% Financials 43.48% 2.97% 46.44% 19.66% 13.53% 6.80% Health Care 35.29% 6.59% 41.88% 11.54% 13.38% 5.37% Industrials 49.99% 0.00% 49.99% 12.11% 10.32% 5.47% Information Technology 32.11% 1.96% 34.07% 16.05% 20.56% 6.58% Materials 42.01% 10.16% 52.17% 3.69% 4.47% 2.33% Pooled Vehicles 50.00% 50.00% 100.00% - 0.03% 0.02% Telecommunications 50.77% 5.62% 56.39% 3.54% 2.57% 1.54% Utilities 32.09% 0.00% 32.09% 3.69% 1.72% 1.33% Total 40.61% 3.39% 44.00% 100.00% 100.00% 44.00%
History of Analytical Innovation Active Share Analysis – Domestic Equity Composite vs. Russell 3000
Total Active Share: 44.00%
Exhibit 5
60 State Universities Retirement System of Illinois Knowledge. Experience. Integrity.
Performance Evaluation Program (PEP)
● PEP for Windows™ is Callan’s industry-leading performance, risk, and style analysis software application. Designed by Callan from the ground up, PEP is a highly flexible software tool for analyzing investment performance and producing analysis to meet the needs of today’s investment professionals – Return/Risk Analysis - Performance and risk can be measured relative to any of Callan’s style groups or
databases, or over 450 market indices – Style Analysis - PEP can effectively quantify manager style for domestic, international, and global equity
portfolios through the use of both holdings-based and multi-factor regression analysis – Holdings Based Analysis and Attribution - Managers routinely send their periodic portfolio holdings to
Callan for analysis and characteristic computation. These statistical results are then sent back to PEP users in their PEP database for in-house analysis
– Searchbooks - PEP’s newest manager search tool, facilitate the ability to run statistics on many managers or funds at one time
– Database - PEP provides immediate access to valuable data from Callan’s separate account and mutual fund databases. With over 14,000 products across these two databases, you can access information on virtually every available investment vehicle
Exhibit 5

Fees
Exhibit 5

62 State Universities Retirement System of Illinois Knowledge. Experience. Integrity.
Proposed Fees for IL SURS Retainer Relationship
Project based services for DB Plan:
– Additional Asset/Liability Studies - $55,000 (one has been included in the retainer) – Real Estate Advisory – included in retainer – Public Markets Manager Search - $30,000 – Private Markets Manager Search - $40,000 – Custodian/Securities Lending Search - $80,000 – Due Diligence to re-up with existing manager – included in retainer – Custody Search - $60,000 – Transition Manager Search - $20,000 – Securities Lending Search (if done separately from Custodian Search) - $65,000 – Monthly Flash Report - $18,000
Project based services for SMP DC Plan:
– Public Markets Manager Search - $30,000 – Recordkeeper Search - $85,000 – Board Education – included in retainer – Due Diligence on Current DC Providers – included in retainer – DC Investment Policy Review – included in retainer – Access to DC Research – included in retainer
Callan proposes a total retainer fee of $395,000 annually for a five-year contract; with an annual inflation adjustment that is standard in all our contracts. This fee is in hard dollars and would not be supplemented with any brokerage or soft dollar payments. Billing occurs on a quarterly basis in arrears.
Exhibit 5

63 State Universities Retirement System of Illinois Knowledge. Experience. Integrity.
Proposed Fees for IL SURS Retainer Relationship
– Managed Accounts / Advice Search – Due to the infrequent nature of these types of searches, Callan typically excludes these from typical retainer arrangements. Each such search would cost $30,000. In addition to the service cost, travel by members of our Defined Contribution team to SURS’ office for associated meetings and to onsite due diligence meetings at the service provider’s facilities (if required), would be additional and billed at cost.
– Fund Fact Sheets – Callan can provide custom quarterly fund fact sheets for participants. Our cost is $4,000 per option, plus additional set up fee. Costs vary depending on how many funds will receive fact sheets. The schedule is as follows: $20,000 for the implementation of up to 5 funds; $30,000 for the implementation of up to 10 funds; $35,000 for the implementation of up to 15 funds. Anything over 15 funds will be negotiated between SURS and Callan.
– Comprehensive Fee Review – This includes a comprehensive review of retirement plan service provider (recordkeeping/administration), including competitive fee analysis/benchmarking with mini-surveys to providers; assistance with contract negotiations with recordkeeper and other service providers. Each fee review is $30,000.
– Communication Review - A communication review consists of a comprehensive examination of existing DC plan communication and education resources available to SURS employees. Gaps are identified in the existing education and communication programs. Callan uses its recordkeeper database—which contains communication best practices and samples from more than a dozen leading record keepers—as the basis of its gap analysis and as a source of recommendations for any improvements to the plans’ communication and educations programs. Each such review would cost $20,000.
Consulting Services that would require an additional fee for the SMP DC Plan
Exhibit 5

Summary
Exhibit 5
65 State Universities Retirement System of Illinois Knowledge. Experience. Integrity.
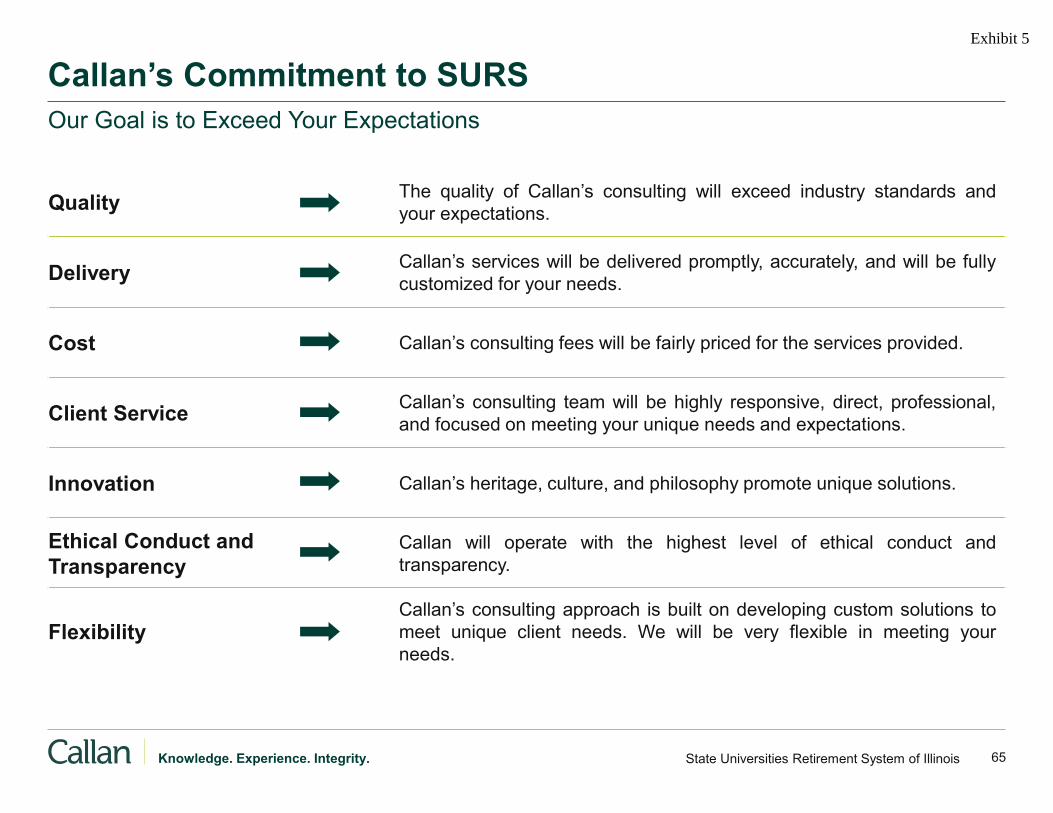
Quality The quality of Callan’s consulting will exceed industry standards and your expectations.
Delivery Callan’s services will be delivered promptly, accurately, and will be fully customized for your needs.
Cost Callan’s consulting fees will be fairly priced for the services provided.
Client Service Callan’s consulting team will be highly responsive, direct, professional, and focused on meeting your unique needs and expectations.
Innovation Callan’s heritage, culture, and philosophy promote unique solutions.
Ethical Conduct and Transparency
Callan will operate with the highest level of ethical conduct and transparency.
Flexibility Callan’s consulting approach is built on developing custom solutions to meet unique client needs. We will be very flexible in meeting your needs.
Callan’s Commitment to SURS Our Goal is to Exceed Your Expectations
Exhibit 5

Appendix
Exhibit 5
67 State Universities Retirement System of Illinois Knowledge. Experience. Integrity.
Callan Biographies
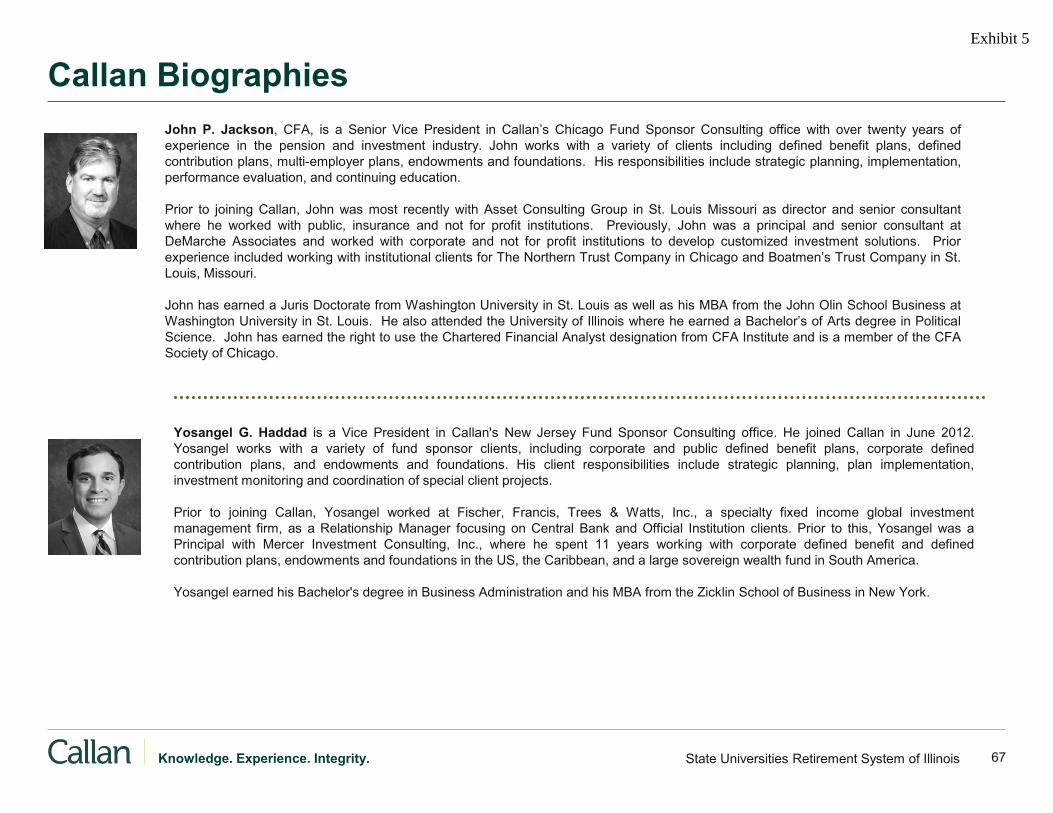
Yosangel G. Haddad is a Vice President in Callan's New Jersey Fund Sponsor Consulting office. He joined Callan in June 2012. Yosangel works with a variety of fund sponsor clients, including corporate and public defined benefit plans, corporate defined contribution plans, and endowments and foundations. His client responsibilities include strategic planning, plan implementation, investment monitoring and coordination of special client projects. Prior to joining Callan, Yosangel worked at Fischer, Francis, Trees & Watts, Inc., a specialty fixed income global investment management firm, as a Relationship Manager focusing on Central Bank and Official Institution clients. Prior to this, Yosangel was a Principal with Mercer Investment Consulting, Inc., where he spent 11 years working with corporate defined benefit and defined contribution plans, endowments and foundations in the US, the Caribbean, and a large sovereign wealth fund in South America. Yosangel earned his Bachelor's degree in Business Administration and his MBA from the Zicklin School of Business in New York.
John P. Jackson, CFA, is a Senior Vice President in Callan’s Chicago Fund Sponsor Consulting office with over twenty years of experience in the pension and investment industry. John works with a variety of clients including defined benefit plans, defined contribution plans, multi-employer plans, endowments and foundations. His responsibilities include strategic planning, implementation, performance evaluation, and continuing education. Prior to joining Callan, John was most recently with Asset Consulting Group in St. Louis Missouri as director and senior consultant where he worked with public, insurance and not for profit institutions. Previously, John was a principal and senior consultant at DeMarche Associates and worked with corporate and not for profit institutions to develop customized investment solutions. Prior experience included working with institutional clients for The Northern Trust Company in Chicago and Boatmen’s Trust Company in St. Louis, Missouri. John has earned a Juris Doctorate from Washington University in St. Louis as well as his MBA from the John Olin School Business at Washington University in St. Louis. He also attended the University of Illinois where he earned a Bachelor’s of Arts degree in Political Science. John has earned the right to use the Chartered Financial Analyst designation from CFA Institute and is a member of the CFA Society of Chicago.
Exhibit 5
68 State Universities Retirement System of Illinois Knowledge. Experience. Integrity.
Callan Biographies
Sally Haskins is a Senior Vice President and a consultant in Callan's Real Assets Consulting group. She is responsible for strategic planning, implementation, and performance oversight of client's real estate portfolios. She heads manager due diligence and strategy research for Asian real estate markets and investment products. Her role also includes new business development for the real estate consulting group. Sally is a shareholder of the firm. Sally joined Callan in 2010 from ING Clarion Partners where she was a Director in the Marketing and Client Service Group. Prior to joining ING Clarion in 2007, Sally enjoyed a 15 year career with Russell Investments and Institutional Property Consultants, Inc. (IPC). While at Russell, Sally held multiple positions including consulting, manager research, and portfolio management. Most recently, she served as the Head of Property, Asia-Pacific and was located in Russell's Sydney office. There she led the strategy and launch of Russell's Global Property Fund, an opportunistic real estate fund of funds for Australian superannuation investors. In addition, she evaluated real estate property and capital markets for the Asia-Pacific region and directed manager research for Asian private equity real estate funds. While working in the US, she designed Russell's comparative analysis and ranking of the core and value added open-end commingled fund universe as well as evaluated European open and closed end funds. At IPC, Sally developed strategy and implementation plans for pension plans and conducted manager due diligence with a focus on opportunistic real estate funds. Her clients included New York State Common Retirement Fund and State of Wisconsin Investment Board. She started her real estate career in 1989 at the State Teachers Retirement System of Ohio. Sally received an MS in Real Estate Appraisal and Investment from the University of Wisconsin-Madison and a BA (Magna cum Laude and Phi Beta Kappa) from St. Olaf College.
Exhibit 5

69 State Universities Retirement System of Illinois Knowledge. Experience. Integrity.
Callan Biographies
Gregory C. Allen, is President and Director of Research. As President, Greg is responsible for overseeing Callan’s Fund Sponsor Consulting group, the Trust Advisory Group, and all of the firm’s research groups which include: Global Manager Research, Alternative Investment Research, Capital Markets Research, Database, Client Report Services, and Operations. Greg is also a member of Callan’s Management Committee, the Alternatives Review Committee, and the Client Policy Review Committee. He is also a member of the Investment Committee which has oversight responsibility for all of Callan’s discretionary multi-manager solutions. Greg joined the San Francisco office of Callan in 1988 as an analyst in the Capital Markets Research group where he focused on capital market research, quantitative analysis, product development, and asset allocation liability analysis. In 1993, Greg took over the Operations and Capital Markets Research groups. He has managed a wide variety of projects for Callan, including the development of the firm’s performance measurement service, the development of Callan’s web site and web-based performance reporting capabilities, and the development and launch of Callan’s PEP for WindowsTM software. In 2000, Greg was promoted to Manager of Specialty Consulting (Now Director of Research) and in 2007 was promoted to President. Greg is a shareholder with the firm. Greg earned an MS in Applied Economics and a BA in Economics (Honors, Phi Beta Kappa) from the University of California at Santa Cruz. He is a frequent speaker on investment related topics, and has numerous publications. These include "Performance Attribution for Global Portfolios" published in the Fall 1991 issue of the Journal of Portfolio Management, "The Active Premium in Small-Cap U.S. Equities" published in the Spring 2005 issue of the Journal of Portfolio Management, and “Does Size Matter?” published in the Spring 2007 issue of the Journal of Portfolio Management.
Exhibit 5

70 State Universities Retirement System of Illinois Knowledge. Experience. Integrity.
Callan Biographies
Lori Lucas, CFA, is an Executive Vice President and Defined Contribution Practice Leader at Callan Associates. Lori is responsible for setting the direction of Callan's DC business, providing DC support both internally to Callan's consultants and externally to Callan's clients, and developing research and insights into DC trends for the benefit of clients and the industry. Lori is a member of Callan's Management Committee and is a shareholder of the firm. Formerly, Lori was Director of Retirement Research at Hewitt Associates. Lori has also served as a vice president at Ibbotson Associates, a pension fund consultant at J.H. Ellwood & Associates, and an analyst and product development leader at Morningstar, Inc. Lori received a Bachelor of Arts from Indiana University and earned a Masters from the University of Illinois. Additionally, she earned the right to use the Chartered Financial Analyst® designation. Lori is a former columnist for Workforce Management online magazine, serves on the editorial advisory board of Benefits Quarterly, and her views have been featured in numerous publications. She is Executive Vice Chair of the Employee Benefit Research Institute's Retirement Research Committee, she is a member of NAGDCA's Survey Committee, and she is on the Executive Board of Defined Contribution Institutional Investment Association. Lori is also a frequent speaker at pension industry conferences.
Jay V. Kloepfer is an Executive Vice President and the Director of Capital Market and Alternatives Research. Jay oversees Callan's Capital Markets, Hedge Fund and Private Markets research groups. The Capital Markets group helps Callan's fund sponsor clients with their strategic planning, conducting asset allocation and asset/liability studies, developing optimal investment manager structures, evaluating defined contribution plan investment lineups and providing custom research on a variety of investment topics. The Hedge Fund and Private Markets groups are responsible for specialized consulting including asset class and strategy research, manager searches, portfolio reviews, and performance evaluation. Jay is the author of the "Callan Periodic Table of Investment Returns," which he created in 1999. He is a member of Callan's Management Committee and is a shareholder of the firm. Prior to joining Callan, Jay was a Senior Economist and the Western Regional Manager for Standard & Poor's DRI. Jay earned a BS with honors in Economics from the University of Oregon and an MA in Economics from Stanford.
Exhibit 5

71 State Universities Retirement System of Illinois Knowledge. Experience. Integrity.
Education and Research
● The Callan Investments Institute was formally established in 1980 to provide continuing education and research to the investment industry.
● Formal research is conducted and disseminated by field consultants and dedicated research professionals: – 30 Original Research Papers published over the last 5 years – 10 Major Surveys conducted during last 5 years
● Annual client conference and regional breakfasts workshops. – Continuing education for all staff members
● Center for Investment Training, or the “Callan College,” was established in 1994 to provide relevant and practical educational opportunities to all professionals involved in the investment decision-making process. – Perfect forum for the onboarding of newer staff members – We also offer customized, single client sessions based on the client’s specific needs
Overview
Exhibit 5
72 State Universities Retirement System of Illinois Knowledge. Experience. Integrity.
Education and Research Callan Insights/Callan DC Insights
Exhibit 5

73 State Universities Retirement System of Illinois Knowledge. Experience. Integrity.
2011 Asset/Liability Study - Asset Mix Alternatives
● The six alternative mixes above are “efficient” - each asset mix maximizes return for a given level of risk.
● Your current target mix is similar in risk and return as efficient Mix 4 (highlighted). Alternative mix(es) suggest a slightly higher allocation to non-US equity relative to public equity.
● Mix 5 is expected to meet your nominal actuarial discount rate target.
● Liquidity concerns suggest two potential portfolio impacts: that allocation to illiquid asset classes be capped and that more conservative mixes be considered for the study.
MEAN-VARIANCE FRONTIER
Asset ClassAdjusted
SURSMinimum
Allocation
Maximum
Allocation Mix 1 Mix 2 Mix 3 Mix 4 Mix 5 Mix 6
Broad U.S. Equity 36.5% 0% 100% 23% 28% 31% 34% 37% 41%Non-US Equity 23.5% 0% 100% 18% 22% 24% 26% 29% 32%US Core Fixed Income 19% 0% 100% 40% 30% 25% 20% 14% 8%TIPS 4% 0% 100% 9% 7% 5% 4% 3% 2%Real Estate 11% 0% 11% 7% 8% 9% 10% 11% 11%Private Equity 6% 0% 6% 3% 5% 6% 6% 6% 6%Cash Equivalents 0% 0% 100% 0% 0% 0% 0% 0% 0%Total 100% 100% 100% 100% 100% 100% 100%
Geometric Returns (Nominal) 7.5% 6.5% 7.0% 7.3% 7.5% 7.7% 8.0%Real Return 5.0% 4.0% 4.5% 4.8% 5.0% 5.2% 5.5%Standard Deviation of Nominal Return 14.2% 9.6% 11.9% 13.0% 14.2% 15.4% 16.6%Sharpe Ratio 0.318 0.362 0.340 0.329 0.319 0.309 0.299
Equity 60% 41% 50% 55% 60% 66% 73%Fixed Income/Cash 23% 49% 37% 30% 24% 17% 10%REITS 4% 4% 4% 4% 4% 4% 4%Alternatives / Illiquid 13% 6% 9% 11% 12% 13% 13%
% Non-US Equity 39% 44% 44% 44% 43% 44% 44%
Mean Variance Optimization using Current Asset Classes
Exhibit 5
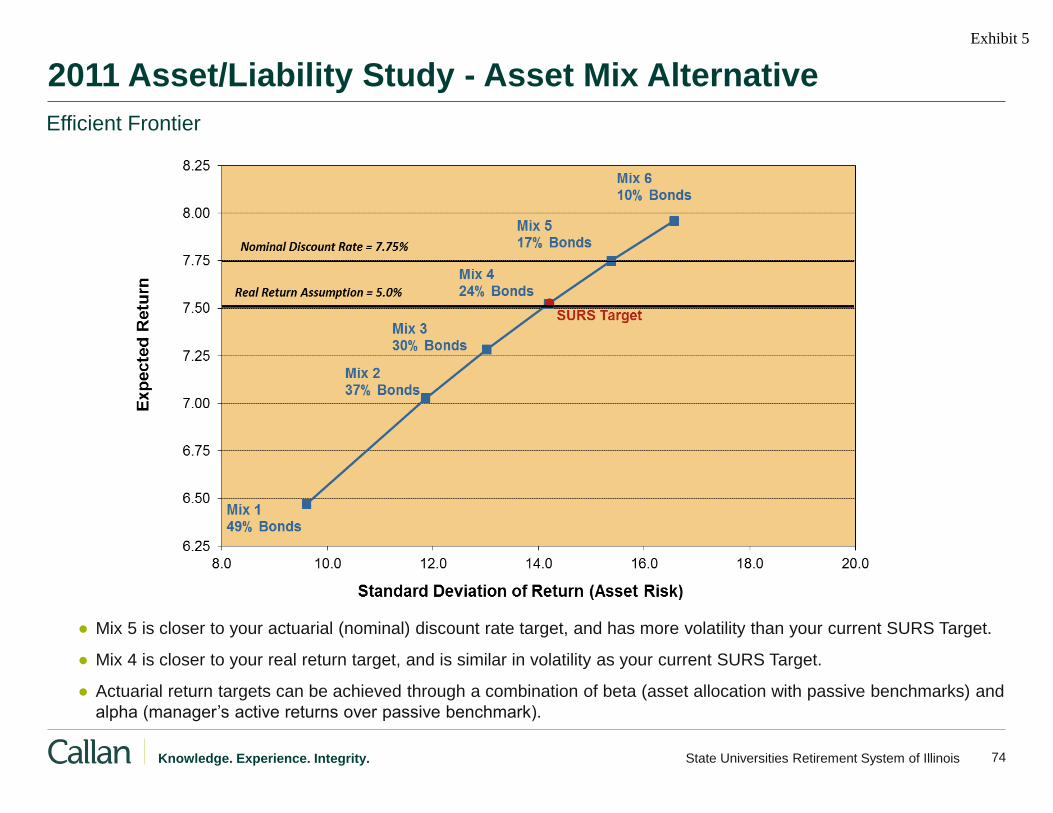
74State Universities Retirement System of Illinois Knowledge. Experience. Integrity.
● Mix 5 is closer to your actuarial (nominal) discount rate target, and has more volatility than your current SURS Target.
● Mix 4 is closer to your real return target, and is similar in volatility as your current SURS Target.
● Actuarial return targets can be achieved through a combination of beta (asset allocation with passive benchmarks) and alpha (manager’s active returns over passive benchmark).
Efficient Frontier
2011 Asset/Liability Study - Asset Mix Alternative Exhibit 5
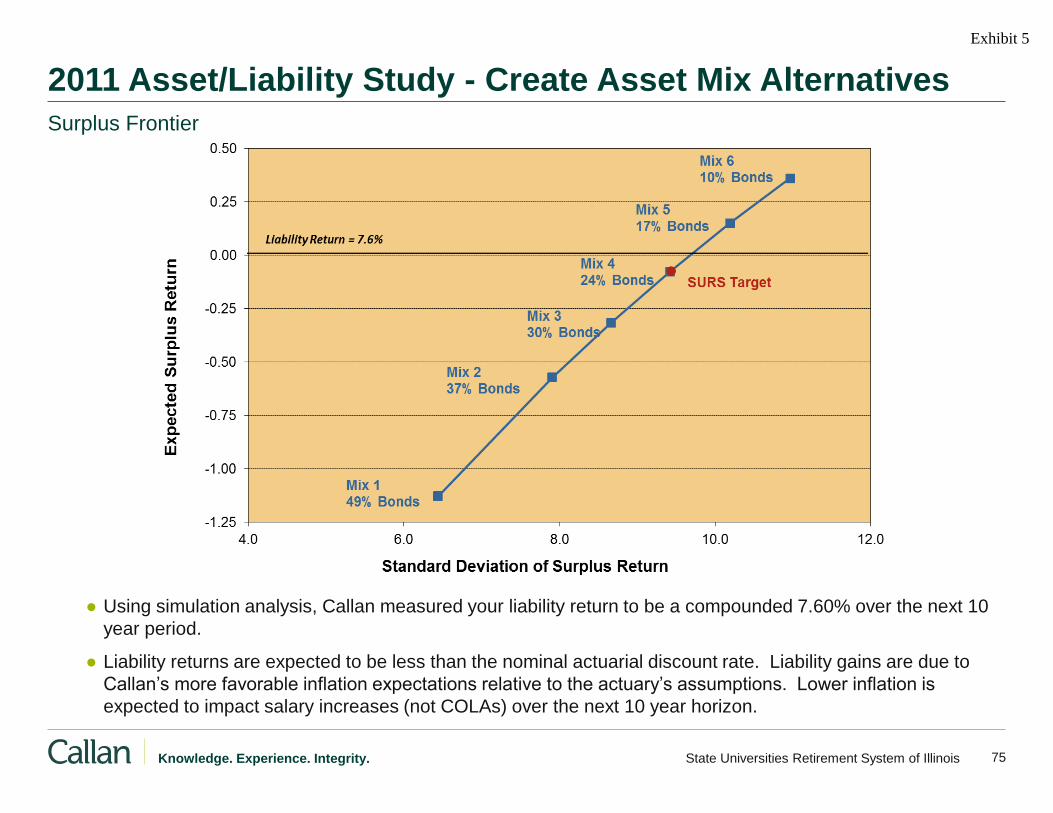
75State Universities Retirement System of Illinois Knowledge. Experience. Integrity.
● Using simulation analysis, Callan measured your liability return to be a compounded 7.60% over the next 10 year period.
● Liability returns are expected to be less than the nominal actuarial discount rate. Liability gains are due to Callan’s more favorable inflation expectations relative to the actuary’s assumptions. Lower inflation is expected to impact salary increases (not COLAs) over the next 10 year horizon.
2011 Asset/Liability Study - Create Asset Mix Alternatives Surplus Frontier
Exhibit 5
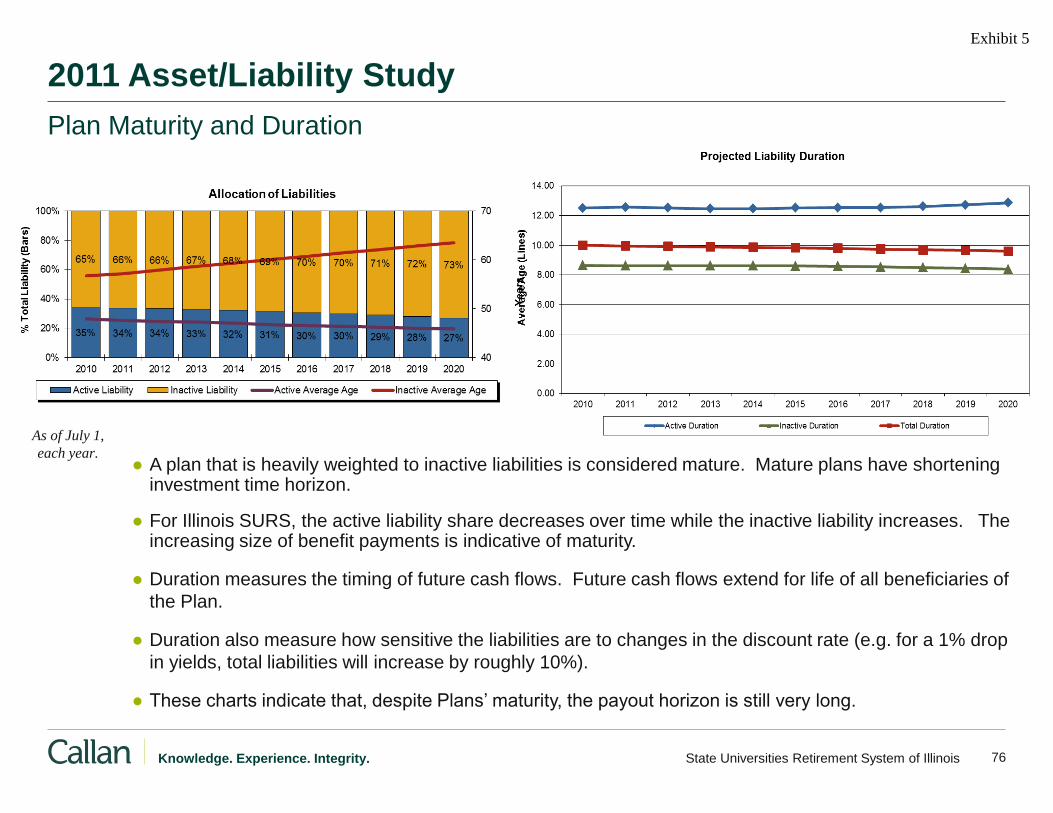
76State Universities Retirement System of Illinois Knowledge. Experience. Integrity.
2011 Asset/Liability Study
● A plan that is heavily weighted to inactive liabilities is considered mature. Mature plans have shortening investment time horizon.
● For Illinois SURS, the active liability share decreases over time while the inactive liability increases. The increasing size of benefit payments is indicative of maturity.
● Duration measures the timing of future cash flows. Future cash flows extend for life of all beneficiaries of the Plan.
● Duration also measure how sensitive the liabilities are to changes in the discount rate (e.g. for a 1% drop in yields, total liabilities will increase by roughly 10%).
● These charts indicate that, despite Plans’ maturity, the payout horizon is still very long.
As of July 1, each year.
Plan Maturity and Duration
Exhibit 5
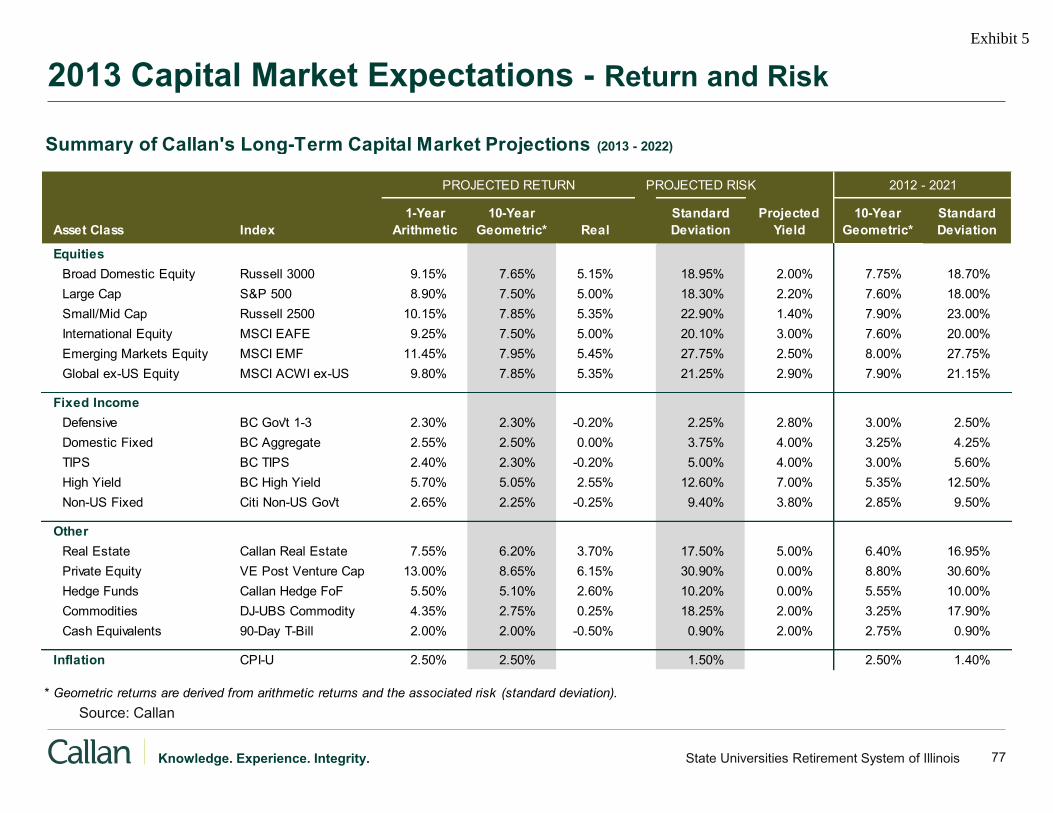
77 State Universities Retirement System of Illinois Knowledge. Experience. Integrity.
2013 Capital Market Expectations - Return and Risk
Source: Callan
Summary of Callan's Long-Term Capital Market Projections (2013 - 2022)
PROJECTED RETURN PROJECTED RISK 2012 - 2021
Asset Class Index1-Year
Arithmetic10-Year
Geometric* RealStandard Deviation
Projected Yield
10-Year Geometric*
Standard Deviation
EquitiesBroad Domestic Equity Russell 3000 9.15% 7.65% 5.15% 18.95% 2.00% 7.75% 18.70%Large Cap S&P 500 8.90% 7.50% 5.00% 18.30% 2.20% 7.60% 18.00%Small/Mid Cap Russell 2500 10.15% 7.85% 5.35% 22.90% 1.40% 7.90% 23.00%International Equity MSCI EAFE 9.25% 7.50% 5.00% 20.10% 3.00% 7.60% 20.00%Emerging Markets Equity MSCI EMF 11.45% 7.95% 5.45% 27.75% 2.50% 8.00% 27.75%Global ex-US Equity MSCI ACWI ex-US 9.80% 7.85% 5.35% 21.25% 2.90% 7.90% 21.15%
Fixed IncomeDefensive BC Gov't 1-3 2.30% 2.30% -0.20% 2.25% 2.80% 3.00% 2.50%Domestic Fixed BC Aggregate 2.55% 2.50% 0.00% 3.75% 4.00% 3.25% 4.25%TIPS BC TIPS 2.40% 2.30% -0.20% 5.00% 4.00% 3.00% 5.60%High Yield BC High Yield 5.70% 5.05% 2.55% 12.60% 7.00% 5.35% 12.50%Non-US Fixed Citi Non-US Gov't 2.65% 2.25% -0.25% 9.40% 3.80% 2.85% 9.50%
OtherReal Estate Callan Real Estate 7.55% 6.20% 3.70% 17.50% 5.00% 6.40% 16.95%Private Equity VE Post Venture Cap 13.00% 8.65% 6.15% 30.90% 0.00% 8.80% 30.60%Hedge Funds Callan Hedge FoF 5.50% 5.10% 2.60% 10.20% 0.00% 5.55% 10.00%Commodities DJ-UBS Commodity 4.35% 2.75% 0.25% 18.25% 2.00% 3.25% 17.90%Cash Equivalents 90-Day T-Bill 2.00% 2.00% -0.50% 0.90% 2.00% 2.75% 0.90%
Inflation CPI-U 2.50% 2.50% 1.50% 2.50% 1.40%
* Geometric returns are derived from arithmetic returns and the associated risk (standard deviation).
Exhibit 5

78 State Universities Retirement System of Illinois Knowledge. Experience. Integrity.
2013 Capital Market Expectations - Correlation Coefficient Matrix
Source: Callan
Broad Lg Cap Sm/Mid Int'l Eq Emerge GlobxUS Defensive Dom Fix TIPS Hi Yield NUS Fix Real Est Pvt Eqt Hedge Fd Comm Cash Eq Inflation
Broad Domestic Equity 1.000
Large Cap 0.996 1.000
Small/Mid Cap 0.953 0.920 1.000
International Equity 0.852 0.850 0.805 1.000
Emerging Markets Equity 0.836 0.830 0.805 0.840 1.000
Global ex-US Equity 0.878 0.874 0.834 0.984 0.923 1.000
Defensive -0.299 -0.295 -0.295 -0.280 -0.300 -0.297 1.000
Domestic Fixed -0.106 -0.100 -0.120 -0.100 -0.140 -0.117 0.700 1.000
TIPS -0.166 -0.160 -0.175 -0.150 -0.175 -0.164 0.480 0.635 1.000
High Yield 0.632 0.630 0.600 0.600 0.575 0.614 -0.030 0.000 -0.010 1.000
Non-US Fixed -0.074 -0.065 -0.100 0.000 -0.090 -0.029 0.380 0.400 0.300 0.050 1.000
Real Estate 0.746 0.740 0.720 0.650 0.630 0.667 -0.120 -0.010 -0.060 0.550 0.020 1.000
Private Equity 0.910 0.905 0.870 0.860 0.840 0.885 -0.270 -0.150 -0.185 0.630 -0.020 0.730 1.000
Hedge Funds 0.755 0.750 0.725 0.695 0.700 0.722 -0.130 0.080 0.020 0.540 0.000 0.575 0.685 1.000
Commodities 0.157 0.155 0.155 0.145 0.155 0.154 -0.250 -0.010 0.200 0.120 -0.050 0.150 0.130 0.180 1.000
Cash Equivalents -0.043 -0.030 -0.080 -0.010 -0.100 -0.040 0.350 0.100 0.070 -0.110 0.000 -0.060 0.000 -0.070 0.070 1.000
Inflation -0.048 -0.060 -0.010 -0.110 0.030 -0.068 -0.360 -0.320 0.130 0.070 -0.220 0.170 -0.060 0.210 0.470 0.150 1.000
Exhibit 5

79 State Universities Retirement System of Illinois Knowledge. Experience. Integrity.
93 94 95 96 97 98 99 00 01 02 03 04 05 06 07 08 09 10 11 12 13(20.0)
(15.0)
(10.0)
(5.0)
0.0
5.0
10.0
15.0
Exc
ess
Ret
urn
for 20 Years Ended June 30, 2013Rolling 12 Quarter Excess Return Relative To S&P 500
CAI Large Cap Broad Style
S&P 500
Large Cap Broad Equity Style versus S&P 500
● Percent of Three-Year periods where Manager Beat Benchmark by more than Hurdle – by Percentile
Hurdle 0.25% 0.30% 0.35% 0.40% 0.45% 0.50% 0.55% 0.60% 0.65% 0.70%Median 46% 45% 43% 41% 39% 39% 38% 34% 33% 31%
45th Percentile 59% 59% 56% 54% 53% 53% 51% 48% 46% 45%
40th Percentile 71% 71% 69% 69% 69% 69% 66% 65% 61% 60%
35th Percentile 75% 75% 74% 73% 73% 73% 73% 73% 70% 70%
30th Percentile 83% 83% 80% 79% 79% 76% 75% 74% 73% 73%
25th Percentile 88% 86% 86% 86% 86% 86% 86% 84% 84% 83%
Average Annualized Excess Return – Median Manager: -0.12%
Exhibit 5

80 State Universities Retirement System of Illinois Knowledge. Experience. Integrity.
93 94 95 96 97 98 99 00 01 02 03 04 05 06 07 08 09 10 11 12 13(18.0)(14.0)(10.0)
(6.0)(2.0)
2.06.0
10.014.018.022.026.030.0
for 20 Years ended June 30, 2013Rolling 12 Quarter Excess Return relative to Russell 2000
Exc
ess
Ret
urn
CAI Small Cap Broad Style
Russell 2000
Small Cap Broad Equity Style versus Russell 2000
● Percent of Three-Year periods where Manager Beat Benchmark by more than Hurdle – by Percentile
Hurdle 0.50% 0.55% 0.60% 0.65% 0.70% 0.75% 0.80% 0.85% 0.90% 0.95%Median 81% 80% 80% 76% 73% 73% 71% 69% 69% 65%
45th Percentile 94% 90% 90% 89% 88% 86% 86% 85% 85% 84%
40th Percentile 98% 98% 98% 98% 96% 95% 94% 91% 91% 91%
35th Percentile 98% 98% 98% 98% 98% 98% 98% 98% 98% 98%
30th Percentile 99% 98% 98% 98% 98% 98% 98% 98% 98% 98%
25th Percentile 100% 100% 100% 100% 100% 99% 99% 99% 99% 99%
Average Annualized Excess Return – Median Manager: 1.94%
Exhibit 5
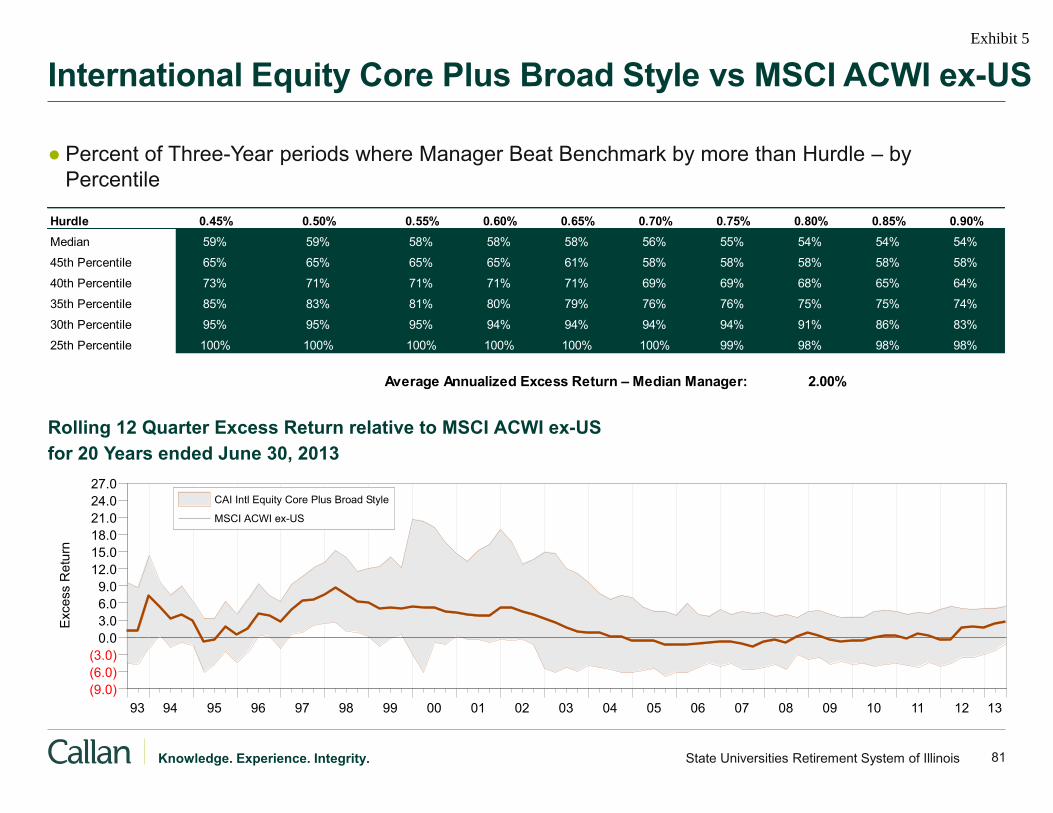
81 State Universities Retirement System of Illinois Knowledge. Experience. Integrity.
International Equity Core Plus Broad Style vs MSCI ACWI ex-US
● Percent of Three-Year periods where Manager Beat Benchmark by more than Hurdle – by Percentile
93 94 95 96 97 98 99 00 01 02 03 04 05 06 07 08 09 10 11 12 13(9.0)(6.0)(3.0)
0.03.06.09.0
12.015.018.021.024.027.0
for 20 Years ended June 30, 2013Rolling 12 Quarter Excess Return relative to MSCI ACWI ex-US
Exc
ess
Ret
urn
CAI Intl Equity Core Plus Broad Style
MSCI ACWI ex-US
Hurdle 0.45% 0.50% 0.55% 0.60% 0.65% 0.70% 0.75% 0.80% 0.85% 0.90%Median 59% 59% 58% 58% 58% 56% 55% 54% 54% 54%
45th Percentile 65% 65% 65% 65% 61% 58% 58% 58% 58% 58%
40th Percentile 73% 71% 71% 71% 71% 69% 69% 68% 65% 64%
35th Percentile 85% 83% 81% 80% 79% 76% 76% 75% 75% 74%
30th Percentile 95% 95% 95% 94% 94% 94% 94% 91% 86% 83%
25th Percentile 100% 100% 100% 100% 100% 100% 99% 98% 98% 98%
Average Annualized Excess Return – Median Manager: 2.00%
Exhibit 5

82State Universities Retirement System of Illinois Knowledge. Experience. Integrity.
Callan’s Business Model
A diversified revenue stream has been critical to our ability to continue to reinvest in our people and our proprietary systems. It is what allows us to deliver greater capability to our clients at more competitive fees.
Clients include defined contribution, pension, foundation and operating assets
372 funds
$1.9 trillion in assets
69% of Callan’s revenues
Clients include “middle market”consulting firms and financial intermediaries
30 clients
8% of Callan’s revenues
Clients include very large defined benefit plans
New business line in 2006
$3.9 billion in assets
5% of Callan’s revenues
Fund Sponsor Consulting Independent Advisor Group (IAG)
Trust Advisory Group (TAG)
FundSponsor
IAG
TAG
ICGClients are investment management organizations
181 clients
$7 trillion in assets
18% of Callan’s revenues
Institutional Consulting Group (ICG)
As of June 30, 2013
contribution, pension, foundation
69% of Callan’s revenues
Clients include “middle market”
consulting firms and financial intermediaries
30 clients
8% of Callan’s revenues
Clients include very large defined benefit plans
New business line in 2006
Fund Sponsor Consulting Independent Advisor Group (IAG)
Trust Advisory Group (TAG)
FundSponsor
IAG
TAG TAG TAG
ICGClients are investment management organizations
181 clients
$7 trillion in assets
18% of Callan’s revenues
Institutional Consulting Group (ICG)
Exhibit 5

83 State Universities Retirement System of Illinois Knowledge. Experience. Integrity.
Callan’s Ethics Policy
● Separate P&L: Each business unit has their own personnel and their own P&L. A fund sponsor consultant's compensation is entirely dependent on the health of the Fund Sponsor consulting business and the satisfaction of Fund Sponsor clients. They have a massive personal financial disincentive against their clients ever receiving conflicted advice from the firm.
● Peer Review: Every manager search is a collective effort involving the client, the general consultant, a team of specialists, and ultimately a peer review committee. This environment of complete transparency absolutely requires a well-documented process. Unsupported personal opinions and biases are eradicated.
● Disclosure: Callan sets the standard for disclosure in our industry. Every manager search report and performance report has a complete listing of every manager that does business with Callan's ICG division. Clients can request fee information on manager clients from our compliance department at any time.
● Code of Ethical Responsibility: We hire ethical people at Callan. On an annual basis we require every employee to review and acknowledge their required adherence to our Code of Ethical Responsibility. Any breach of the Code of Ethical Responsibility can result in immediate termination and potential legal action against the individual.
Protecting Our Clients and Our Firm
Exhibit 5
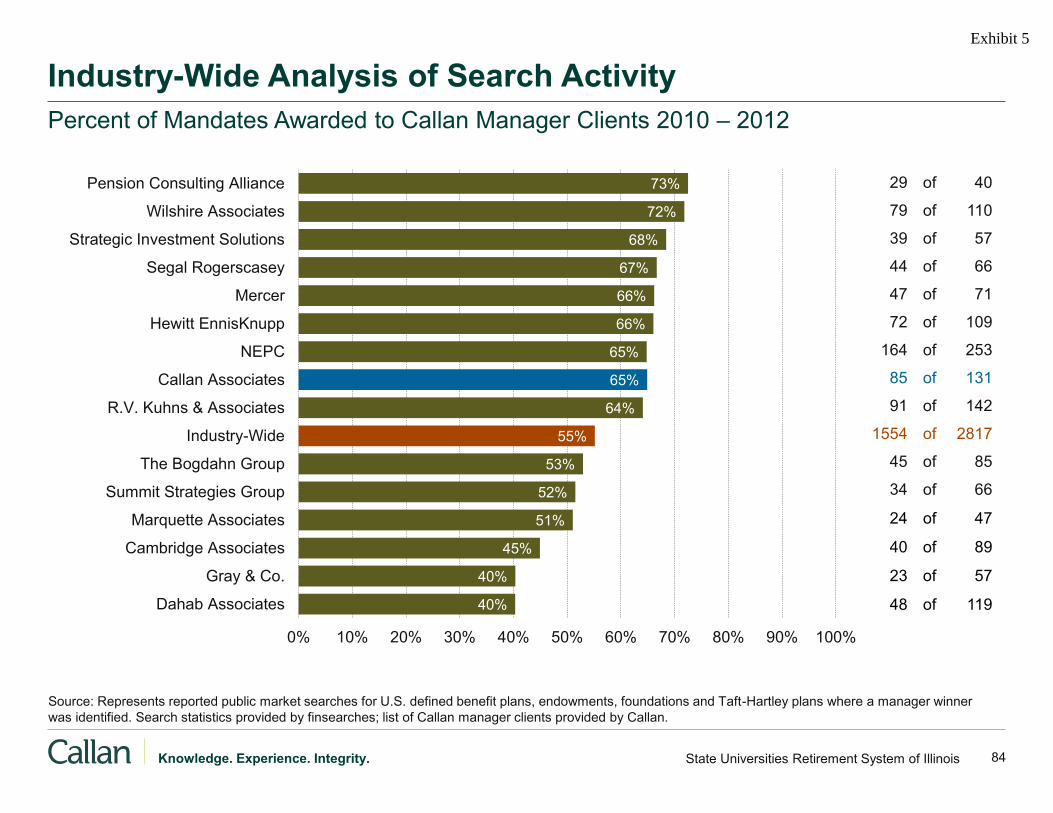
84 State Universities Retirement System of Illinois Knowledge. Experience. Integrity.
Industry-Wide Analysis of Search Activity Percent of Mandates Awarded to Callan Manager Clients 2010 – 2012
73%
72%
68%
67%
66%
66%
65%
65%
64%
55%
53%
52%
51%
45%
40%
40%
0% 10% 20% 30% 40% 50% 60% 70% 80% 90% 100%
Pension Consulting Alliance
Wilshire Associates
Strategic Investment Solutions
Segal Rogerscasey
Mercer
Hewitt EnnisKnupp
NEPC
Callan Associates
R.V. Kuhns & Associates
Industry-Wide
The Bogdahn Group
Summit Strategies Group
Marquette Associates
Cambridge Associates
Gray & Co.
Dahab Associates
Source: Represents reported public market searches for U.S. defined benefit plans, endowments, foundations and Taft-Hartley plans where a manager winner was identified. Search statistics provided by finsearches; list of Callan manager clients provided by Callan.
29 of 40
79 of 110
39 of 57
44 of 66
47 of 71
72 of 109
164 of 253
85 of 131
91 of 142
1554 of 2817
45 of 85
34 of 66
24 of 47
40 of 89
23 of 57
48 of 119
Exhibit 5

85 State Universities Retirement System of Illinois Knowledge. Experience. Integrity.
Disclaimer
This report is for informational purposes only and should not be construed as legal or tax advice on any matter. Any decision you make on the basis of this content is your sole responsibility. You should consult with legal and tax advisers before applying any of this information to your particular situation.
This report may consist of statements of opinion, which are made as of the date they are expressed and are not statements of fact.
Reference to or inclusion in this report of any product, service or entity should not be construed as a recommendation, approval, affiliation or endorsement of such product, service or entity by Callan.
Past performance is no guarantee of future results.
The statements made herein may include forward-looking statements regarding future results. The forward-looking statements herein: (i) are best estimations consistent with the information available as of the date hereof and (ii) involve known and unknown risks and uncertainties such that actual results may differ materially from these statements. There is no obligation to update or alter any forward-looking statement, whether as a result of new information, future events or otherwise. Undue reliance should not be placed on forward-looking statements.
Exhibit 5