state standard sb4a. investigate the relationships among organisms, populations, communities,...
TRANSCRIPT

State Standard
SB4A. Investigate the relationships among organisms, populations, communities, ecosystems, and biomes.
SB4D. Assess and explain human activities that influence and modify the environment such as global warming, population growth, pesticide use, and water and power consumption.
Human Population – Growth & Age Structure (4.2)
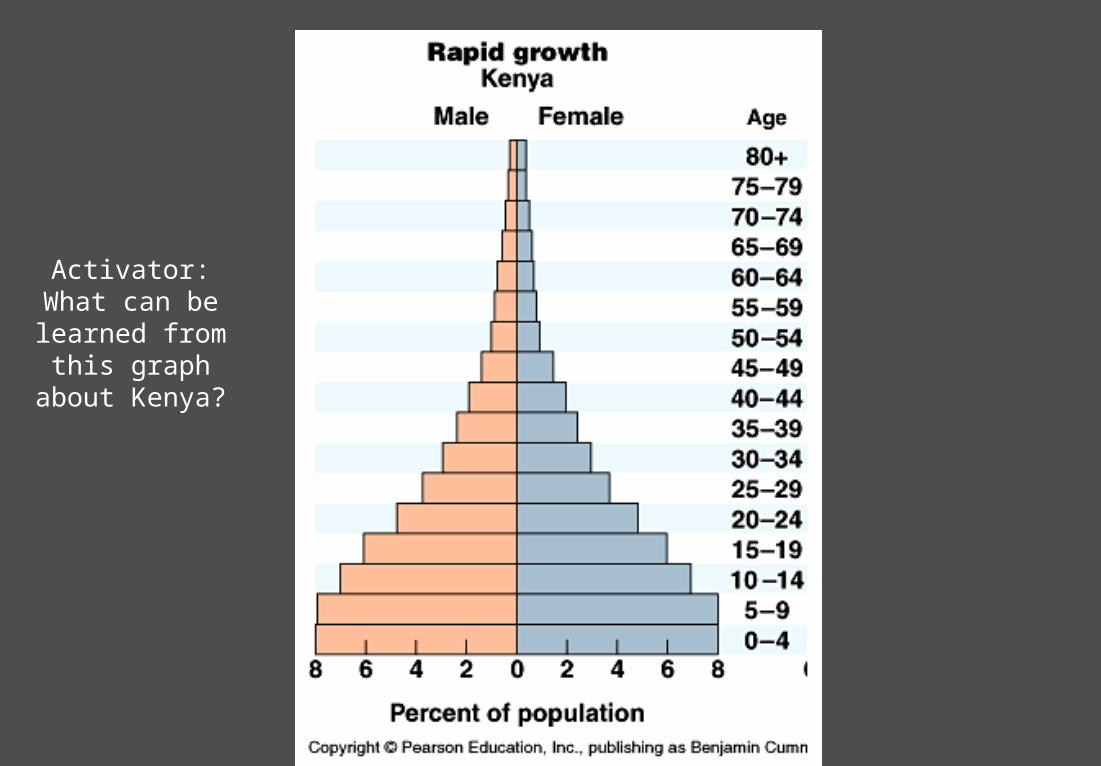
Activator:What can belearned from
this graphabout Kenya?
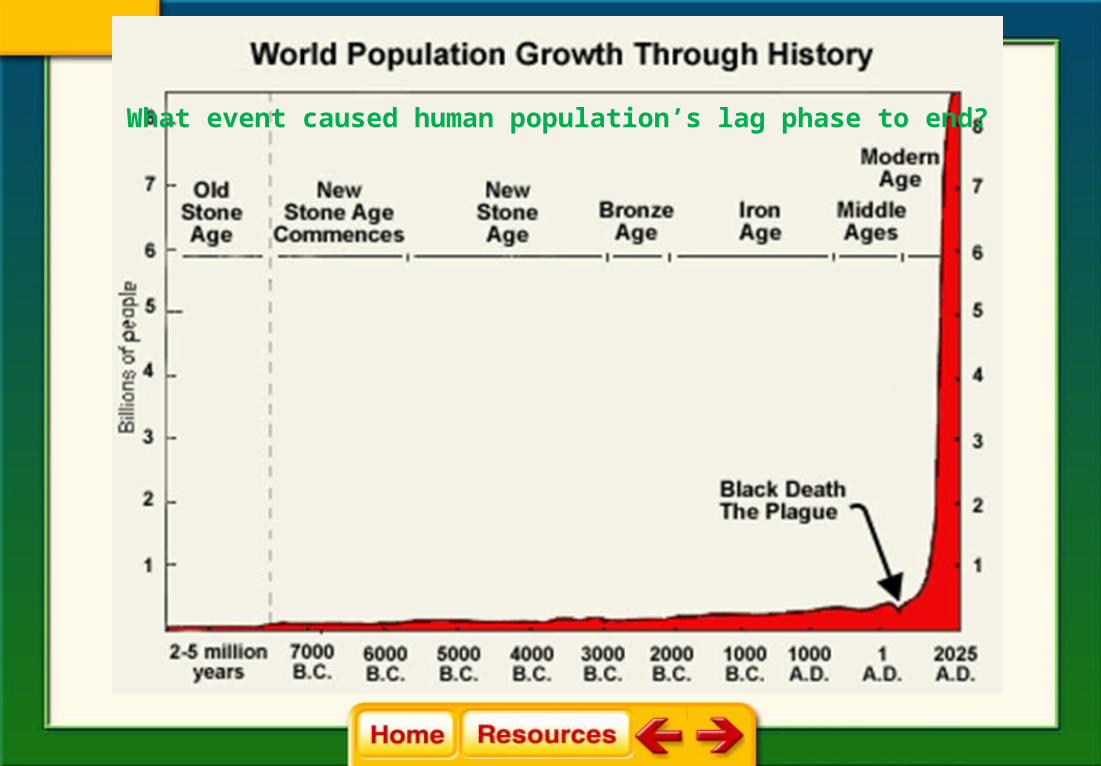
What event caused human population’s lag phase to end?

Human Population Growth Rate
The human population experienced exponential growth as humans benefitted from the Industrial Revolution, improved food production, improved health care, & disease cure/prevention
Population Ecology
4.2 Human Population
Chapter 4

What trend does this graph reveal about human population growth?
Why do you think this is?
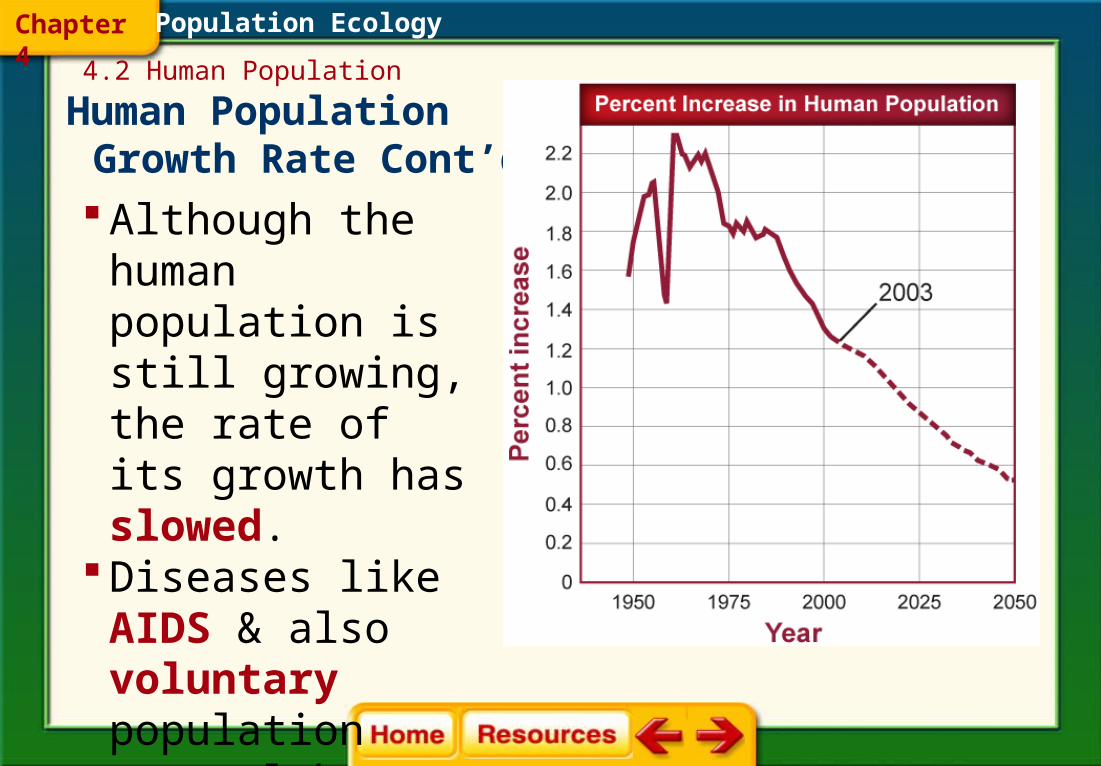
Human Population Growth Rate Cont’d Although the
human population is still growing, the rate of its growth has slowed.
Diseases like AIDS & also voluntary population control have contributed to this slowing.
Population Ecology
4.2 Human Population
Chapter 4
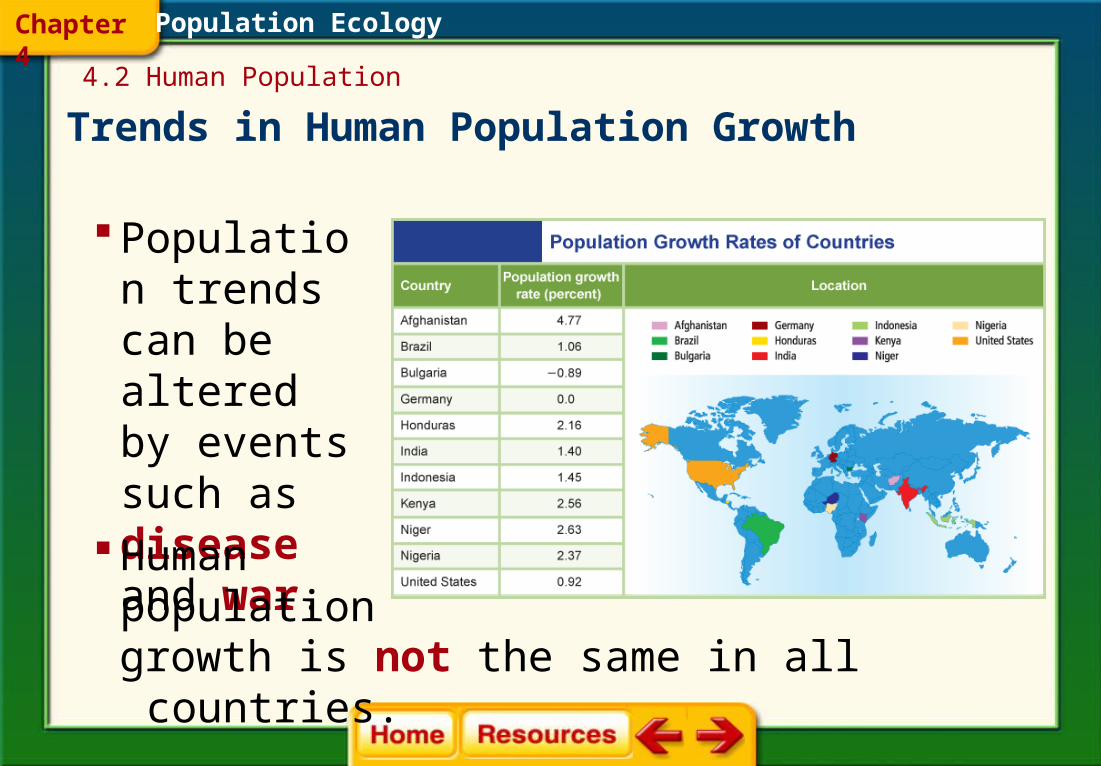
Trends in Human Population Growth
Population trends can be altered by events such as disease and war.
Population Ecology
4.2 Human Population
Chapter 4
Human populationgrowth is not the same in all countries.
Zero population growth (ZPG) occurs when the birthrate equals the death rate.
Population Ecology
Trends in Human Population Growth Cont’d
The age structure eventually should be more balanced with numbers at pre-reproductive, reproductive, and post-reproductive ages being approximately equal.
4.2 Human Population
Chapter 4
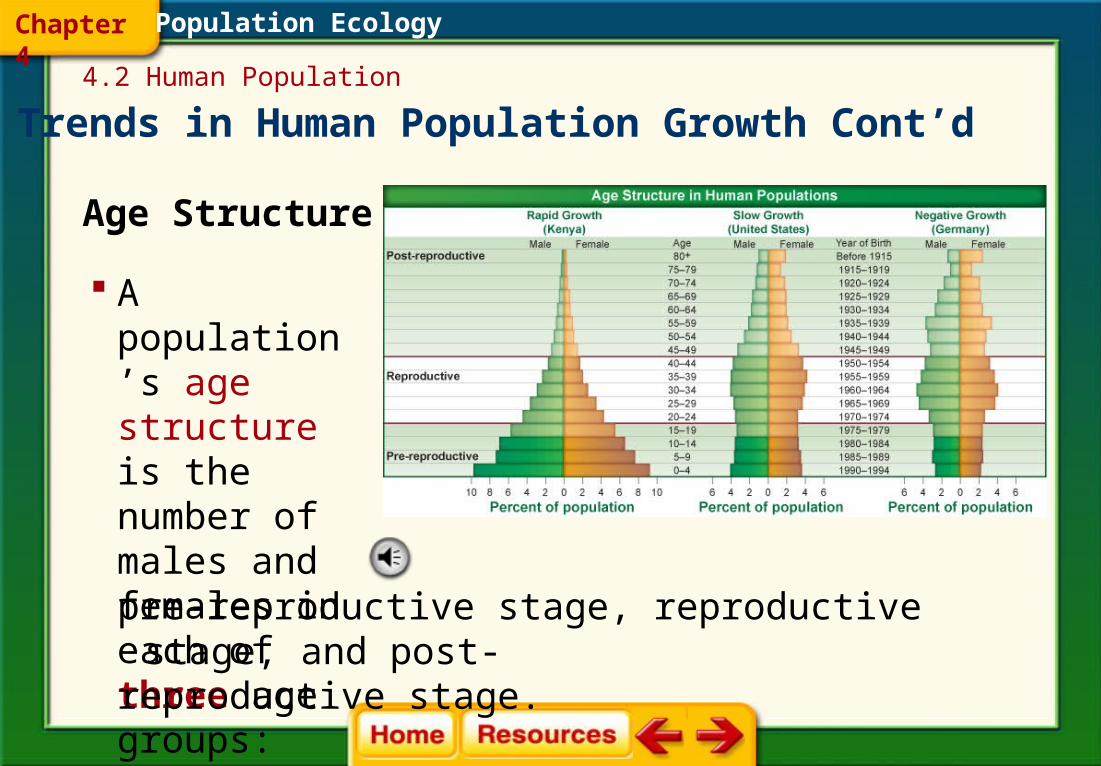
Age Structure
Population Ecology
A population’s age structure is the number of males and females in each of three age groups:pre-reproductive stage, reproductive stage, and post-reproductive stage.
4.2 Human Population
Chapter 4
Trends in Human Population Growth Cont’d

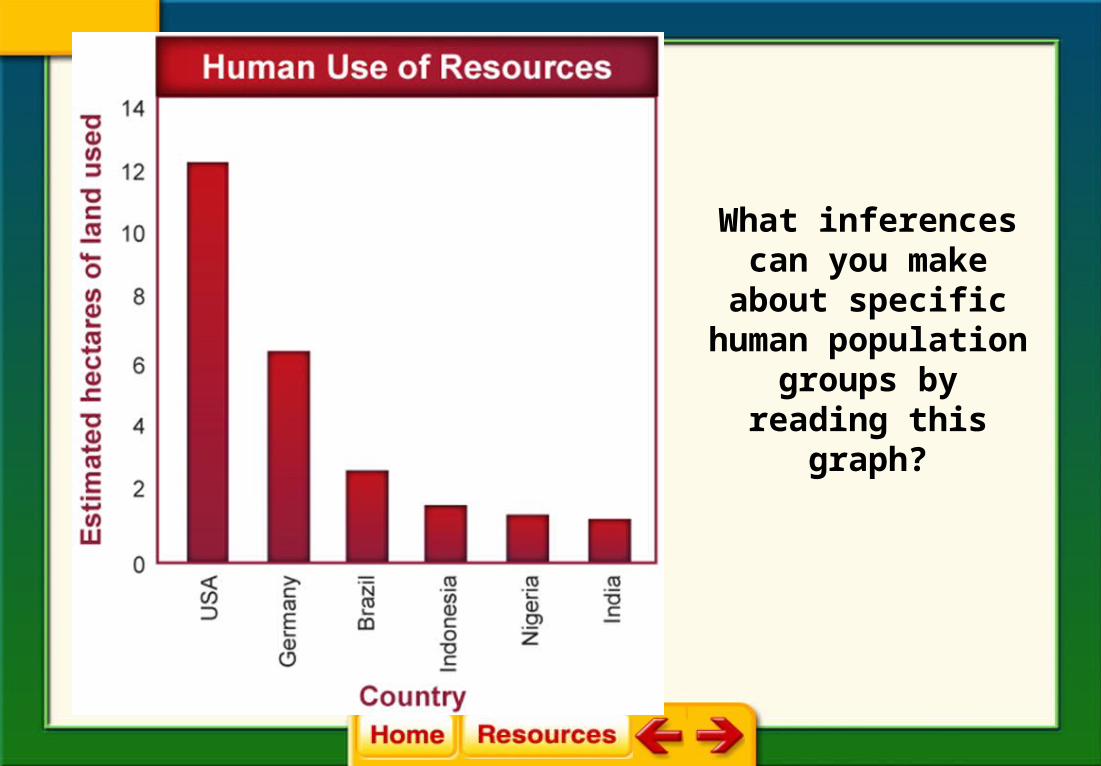
What inferences can you make about
specific human population groups
by reading this graph?
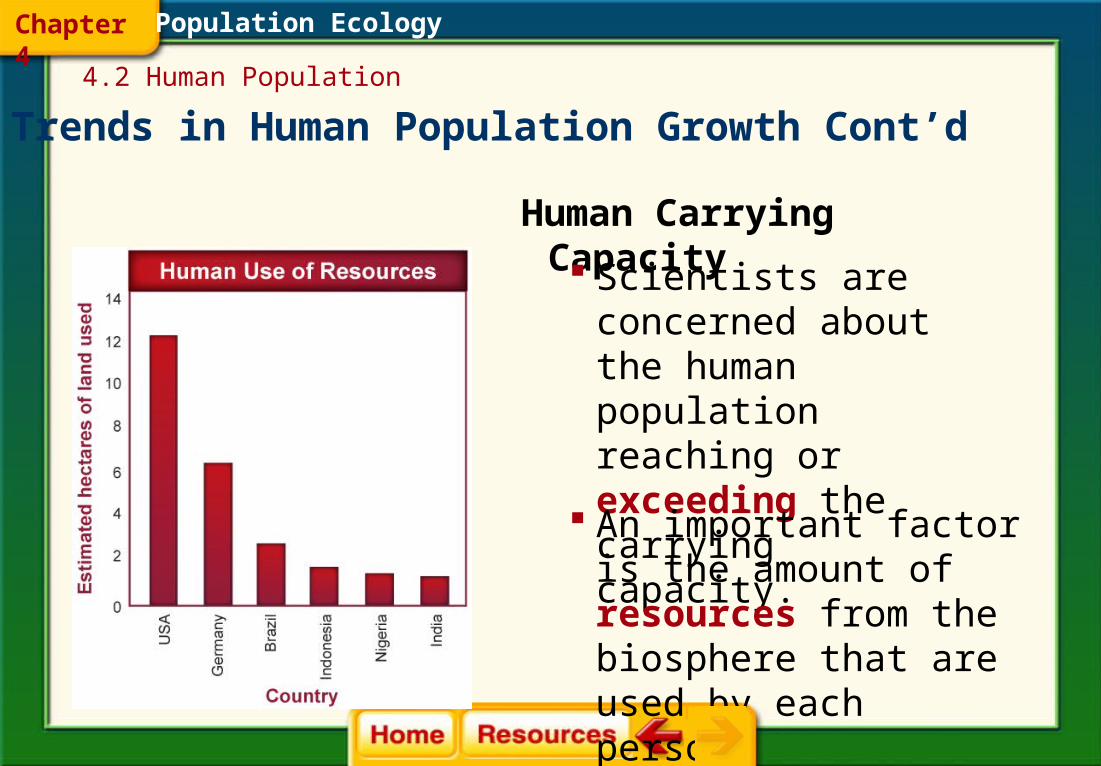
Human Carrying Capacity
Population Ecology
Scientists are concerned about the human population reaching or exceeding the carrying capacity.
An important factor is the amount of resources from the biosphere that are used by each person.
4.2 Human Population
Chapter 4
Trends in Human Population Growth Cont’d
1. A2. B3. C4. D
CDQ 3
0% 0%0%0%
Population EcologyChapter 4
Chapter Diagnostic Questions
A. when birth rate equals death rate
B. when death rate exceeds birth rate
C. when birth rate exceeds death rate
D. when there are zero births
When does zero population growth occur?
1. A2. B3. C4. D
FQ 5
0% 0%0%0%
Population EcologyChapter 4
4.2 Formative Questions
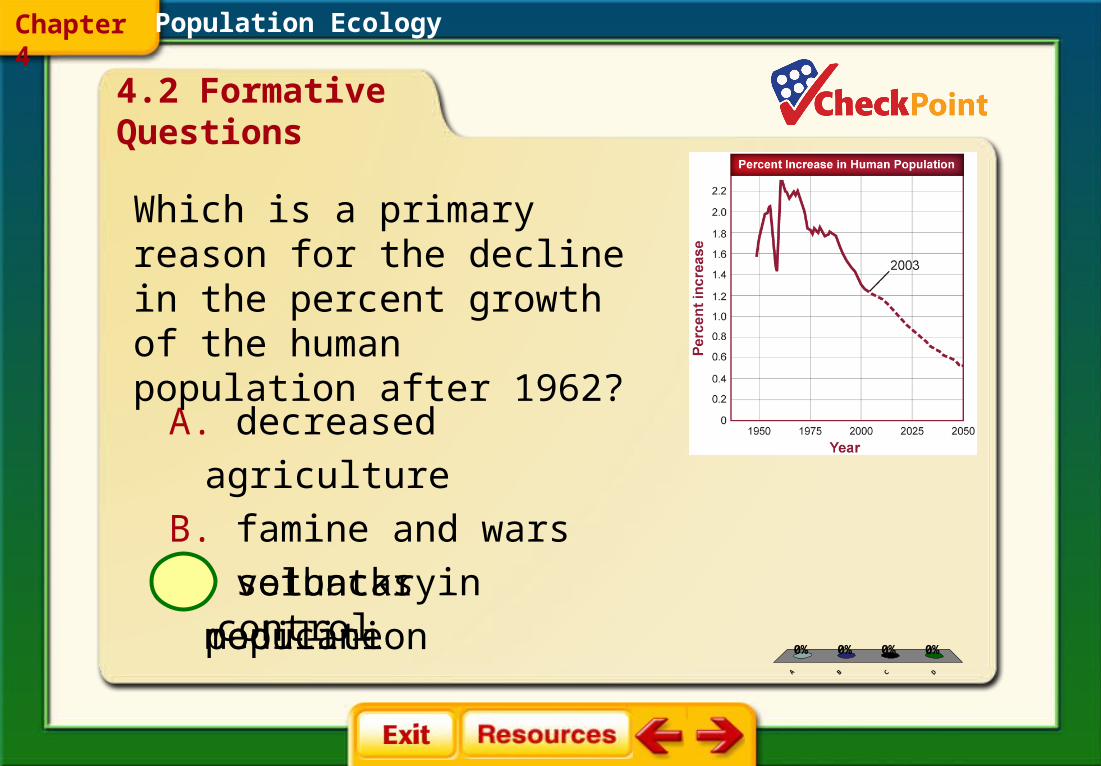
A. decreased agriculture
B. famine and wars
C. setbacks in medicine
D. voluntary populationcontrol
Which is a primary reason for the decline in the percent growth of the human population after 1962?
1. A2. B3. C4. D
FQ 6
0% 0%0%0%
Population EcologyChapter 4
4.2 Formative Questions
A. CDC
B. HPG
C. PGR
D. ZPG
What will happen to the human population when the birthrate equals the death rate?
1. A2. B3. C4. D
CAQ 1
0% 0%0%0%
Population EcologyChapter 4
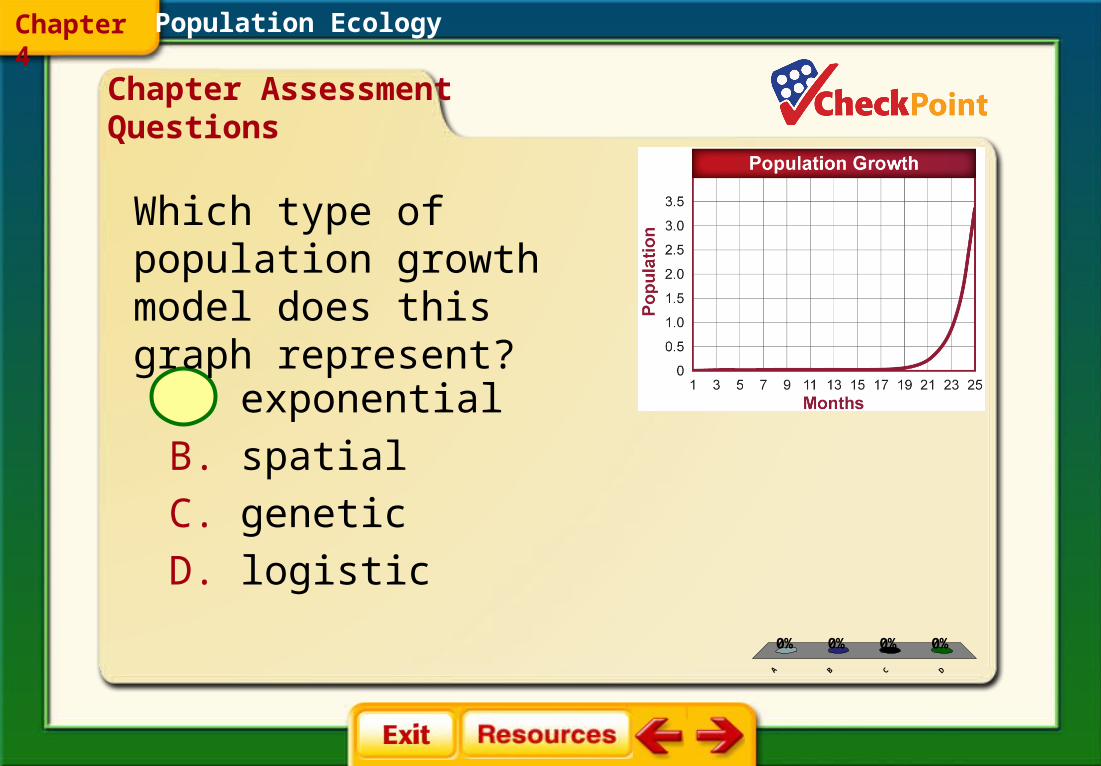
A. exponential
B. spatial
C. genetic
D. logistic
Chapter Assessment Questions
Which type of population growth model does this graph represent?

1. A2. B3. C4. D
CAQ 2
0% 0%0%0%
Population EcologyChapter 4
A. India has very little land for farming.
B. Germany is smaller per acre than
the United States.
C. More land is used to support an
individual in the United States.
D. A person in Indonesia requires more
land than a person in Brazil.
Chapter Assessment Questions
Based on the information in the graph, infer which statement accurately represents the information provided.