state of the nation’s housing markets 2 nd quarter 2010 update kevin p. kane chief housing market...
TRANSCRIPT

State of the Nation’s Housing Markets
2nd Quarter 2010 Update
Kevin P. KaneChief Housing Market Analyst
Office of Policy Development and ResearchSpecial Thanks – Randall Goodnight (Ft. Worth)

Nonfarm Payrolls 12-month Averages
200020002000200020002000200020002000200020002000200120012001200120012001200120012001200120012001200220022002200220022002200220022002200220022002200320032003200320032003200320032003200320032003200420042004200420042004200420042004200420042004200520052005200520052005200520052005200520052005200620062006200620062006200620062006200620062006200720072007200720072007200720072007200720072007200820082008200820082008200820082008200820082008200920092009200920092009200920092009200920092009201020102010201020102010124000
126000
128000
130000
132000
134000
136000
138000
140000
Tot
al J
obs
(in
thou
sand
s)

Nonfarm PayrollsAnnual Percentage Change (12-month avg.)
200120012001200120012001200120012001200120012001200220022002200220022002200220022002200220022002200320032003200320032003200320032003200320032003200420042004200420042004200420042004200420042004200520052005200520052005200520052005200520052005200620062006200620062006200620062006200620062006200720072007200720072007200720072007200720072007200820082008200820082008200820082008200820082008200920092009200920092009200920092009200920092009201020102010201020102010-5.0
-4.0
-3.0
-2.0
-1.0
0.0
1.0
2.0
3.0
Per
cent
age
Cha
nge

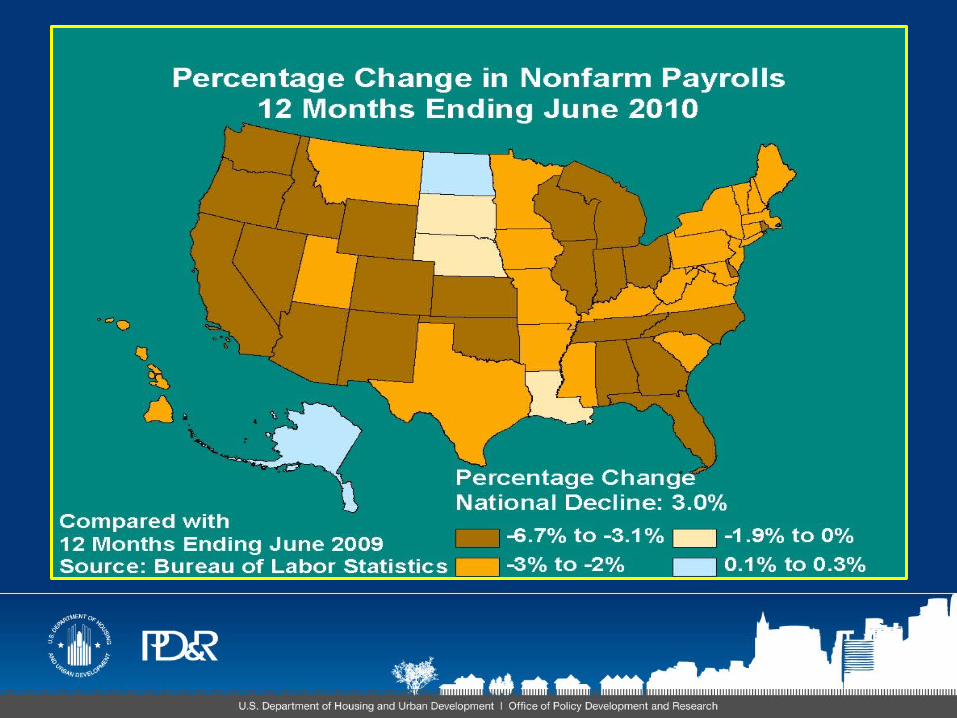
Regional Nonfarm PayrollsPercentage Change 12 months ending June 2010
New E
nglan
d
Mid-
Atlant
ic
Midw
est
Great
Plai
ns
Pacific
-6-5-4-3-2-10

Nonfarm Change by SectorPercentage Change 12 months ending June 2010
Mini
ng &
Log
ging
Who
lesale
Tra
de
Info
rmat
ion
Ed. &
Hea
lth S
erv.
Govt.
-15
-10
-5
0
5


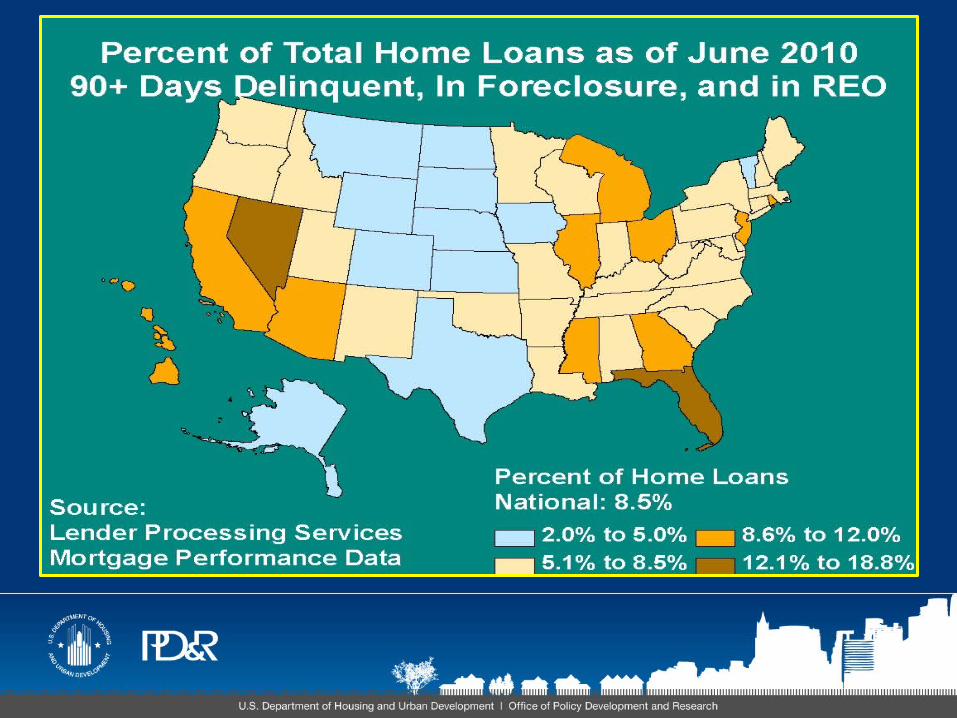
U.S. Housing Market Conditions: 2Q 2010 • Sales market conditions remain soft in much of the
country but continue to improve in many areas
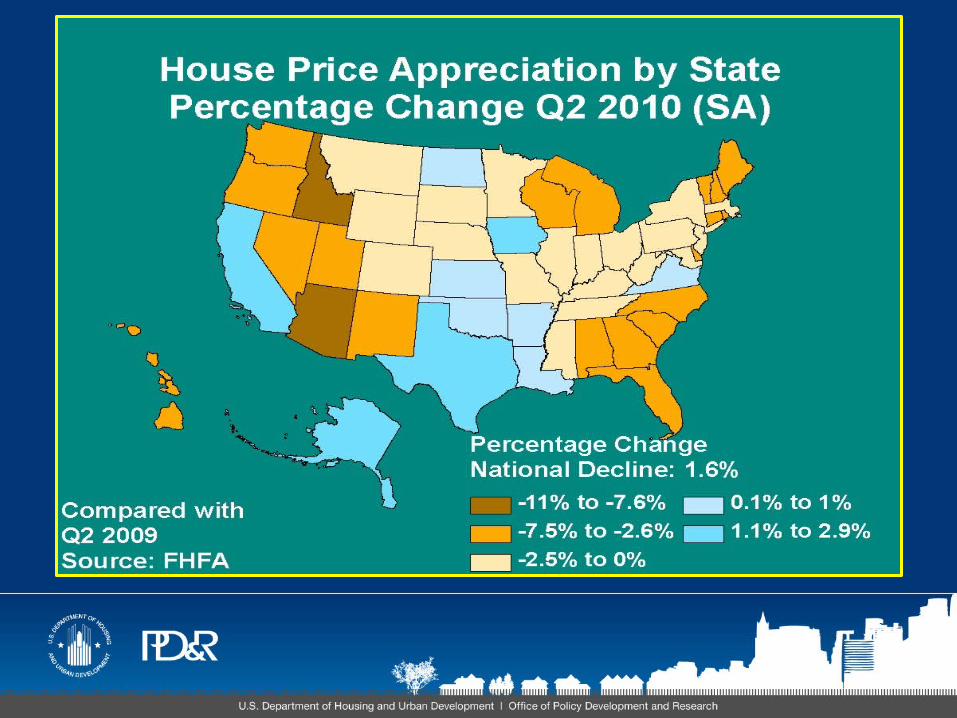
• Data on home sales prices indicate improvement
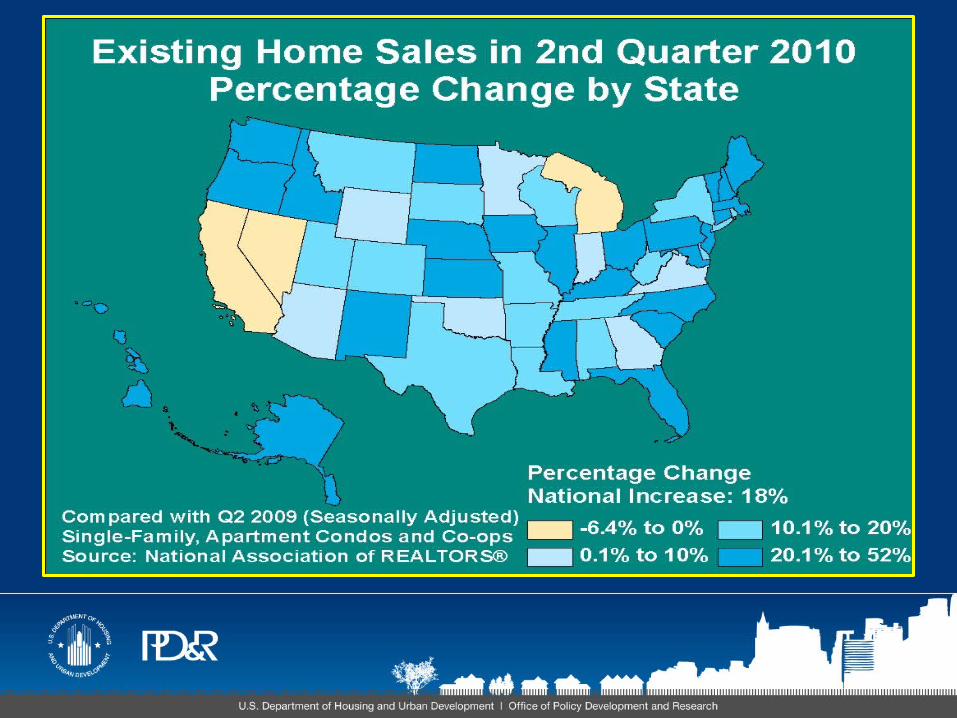
• Home sales are up (homebuyer tax credit)
• Inventories of new and existing homes for sale are down from a year ago and coming closer to balance
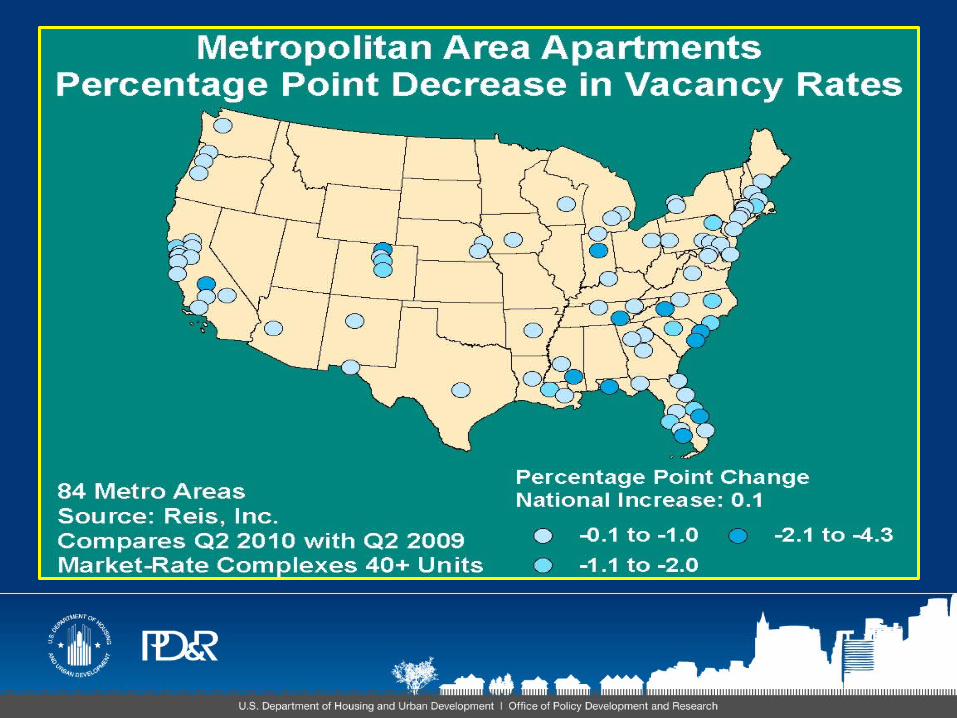
• Rental market conditions are mixed throughout the country
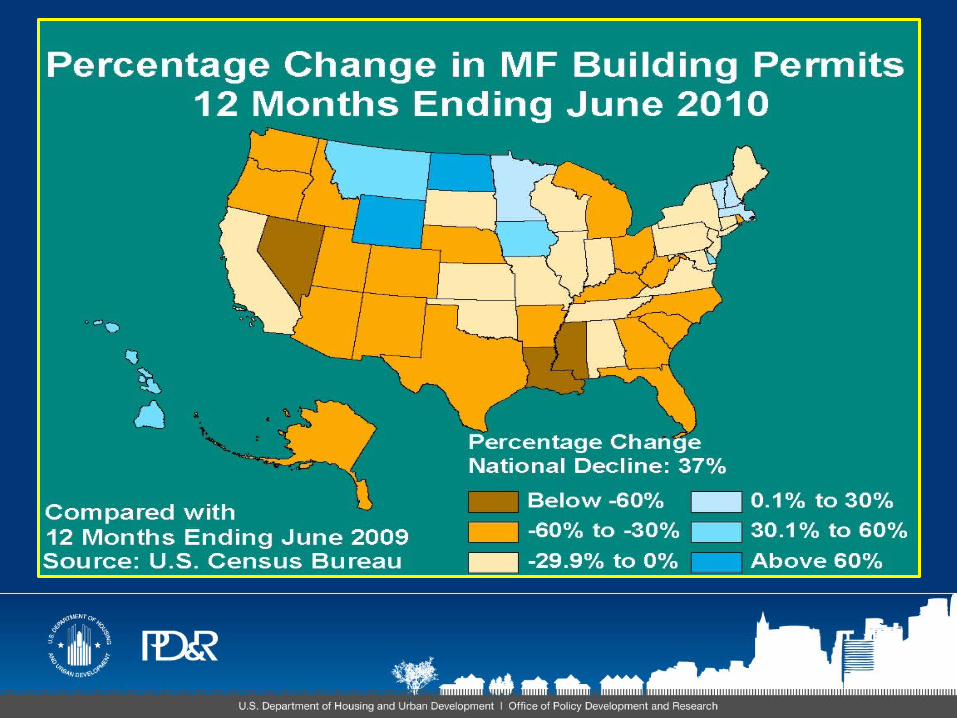
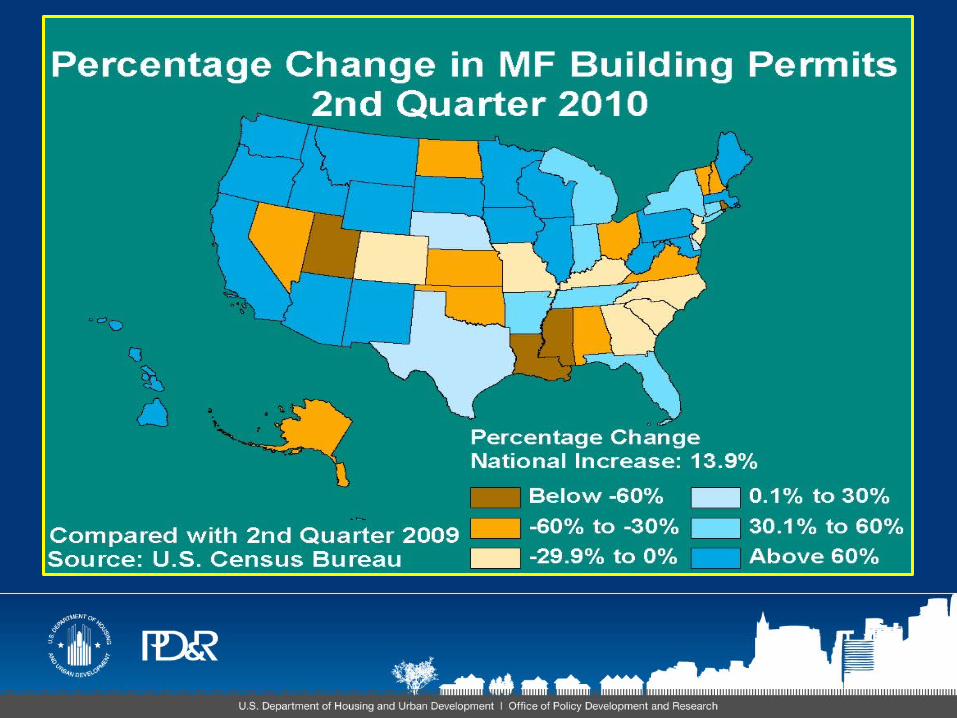
• Significant declines in multifamily permits have continued

Regional Conditions 2Q 2010Sales Markets Rental Markets
Region I (New England) Balanced BalancedRegion II (NY/NJ) Slightly Soft Balanced (NYC Tight)Region III (Mid-Atlantic Slightly Soft MixedRegion IV (Southeast-Caribbean) Soft SoftRegion V (Midwest Soft Mixed (soft/balanced)Region VI (Southwest) Slightly Soft Soft
Region VII (Great Plains) Balanced (Soft in MO) SoftRegion VIII (Rocky Mountains) Soft MixedRegion IX (Pacific) Soft Mixed Region X (Northwest) Soft Balanced
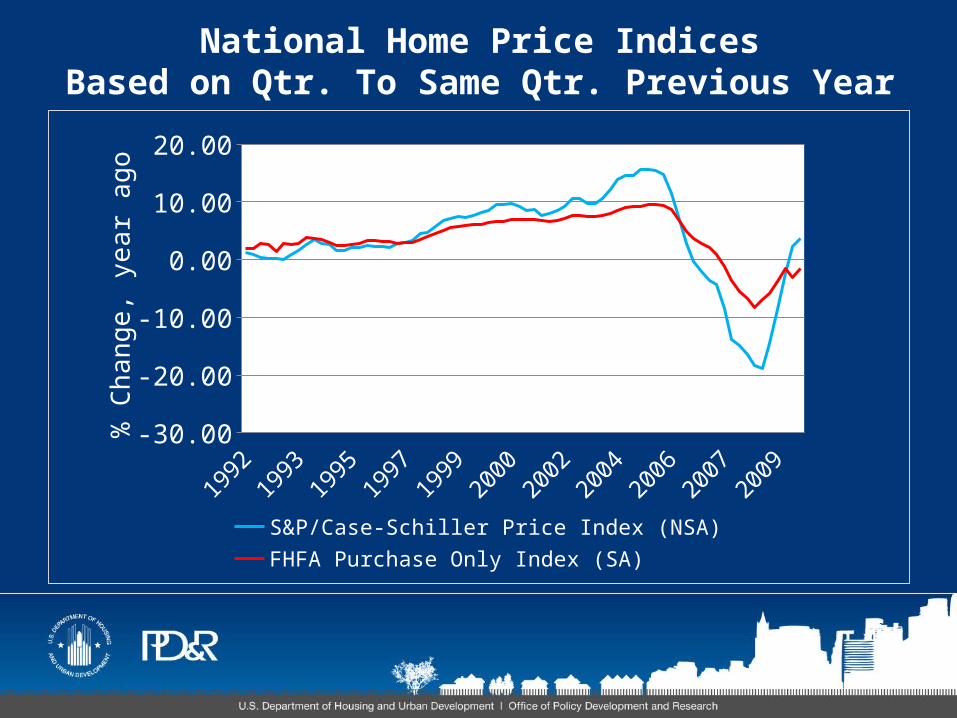
National Home Price IndicesBased on Qtr. To Same Qtr. Previous Year
1992
1993
1995
1996
1998
1999
2001
2002
2004
2005
2007
2008
2010
-25.00-20.00-15.00-10.00
-5.000.005.00
10.0015.0020.00
S&P/Case-Schiller Price Index (NSA)
FHFA Purchase Only Index (SA)
% C
hang
e, y
ear
ago


SF Permit ActivityDuring 12 Months Ending
June-09 June-100
50,000
100,000
150,000
200,000
250,000
300,000
350,000
400,000
450,000
500,000
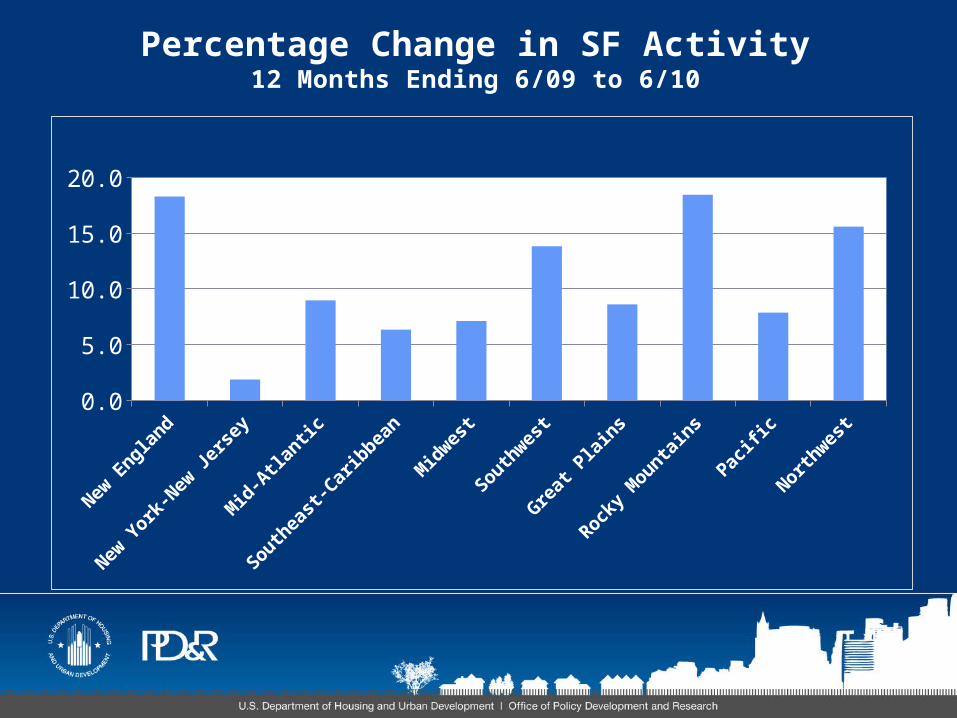
Percentage Change in SF Activity12 Months Ending 6/09 to 6/10
New E
ngland
New Y
ork-N
ew J
ersey
Mid
-Atla
ntic
Southeast-C
aribbean
Mid
west
Southw
est
Gre
at Pla
ins
Rocky Mounta
ins
Pacific
Northw
est0.0
5.0
10.0
15.0
20.0


MF Permit ActivityDuring 12 Months Ending
June-09 June-100
50,000
100,000
150,000
200,000
250,000

Percentage Change in MF Activity12 Months Ending 6/09 to 6/10
-60.0
-50.0
-40.0
-30.0
-20.0
-10.0
0.0

For additional information:
• U.S. Housing Market Conditions Report 2Q 2010 available at www.huduser.org
• Contact your local Regional or Field Economist
• Contact me at [email protected]