state of the county’s health report - ok.gov county 2010.pdf · (11,445 to 11,500) ... 26.8%...
TRANSCRIPT

Oklahoma ranks near the bottom in many key health status indicators. Most of these outcomes are related to conditions that Oklahomans must live with every day. Poverty, lack of insurance, limited access to primary care, and inadequate prenatal care, along with associated risky health behaviors (low fruit/vegetable consumption, low physical activity, a high prevalence of smoking) all contribute to the poor health status of our citizens.
The vision of the Oklahoma Health Improvement Plan (OHIP) involves local partnerships and communities working together to improve and sustain the physical, social, and mental well‐being of all people in Oklahoma. The targeted flagship initiatives of children’s health improvement, tobacco use prevention, and obesity reduction will help to maximize opportunities for all Oklahomans to lead healthy lives. If you would like more information about OHIP, please visit the Oklahoma State Department of Health website at http://www.ok.gov/ health/Organization/ Board_of_Health/OHIP.html.
This report focuses on health factors and demographics in Washita County. Awareness and thoughtful application of this health data can assist us in our joint endeavors to improve the health status of our local citizens.
Washita County
Working Together For Health
Inside This Issue
Sta
te o
f th
e C
ou
nty
’s
He
alt
h R
ep
ort
OK
LA
HO
MA
S
TA
TE
DE
PA
RT
ME
NT
O
F
HE
AL
TH
Washita County
Spring 2010
Table of Contents 1
County Demographics 2
Top 10 Leading Causes of Death 2
Top 10 Leading Causes of Death Table 3
Nutrition & Overweight 4
Physical Activity & Fitness 4
Diabetes 5
Teen Births 5
Tobacco Use Prevention
Healthy People 2010 Table
Health Care Costs Summary
County Health Department Usage
Health Education
Primary Care Map
Board of Health Map
Oklahoma Health Improvement Plan
7
8
9
10
11
11
12
12
Infant Mortality 6 Reference List 13
Low Birth Weight 6 Turning Point 14
Injury & Violence 7 Contact Information 14
Together We Can Move Forward

OSAGE809
TEXAS827
BEAVER760
ELLIS869
KAY979
CADDO1066
LE FLORE1024
CIMARRON908 WOODS
802
MCCURTAIN1111
GRADY1007
CREEK1011
ATOKA903
KIOWA1097
GRANT869
BRYAN1020
DEWEY978
MAJOR871
HARPER1110
BLAINE950
CUSTER971
PITTSBURG954
CRAIG989
NOBLE875
LINCOLN1008
WASHITA841
PAYNE777
LOGAN887
GARFIELD954
ALFALFA771
CARTER1058
PUSHMATAHA1042
GARVIN1016
MAYES944
TILLMAN1004
WOODWARD862
HUGHES1048GREER
969
COMANCHE954
BECKHAM1082
ADAIR1121
ROGERS900
CANADIAN853
STEPHENS986
ROGER MILLS798
LATIMER1035
COAL1140
COTTON929
KINGFISHER885
NO
WATA
879
OKLAHOMA932
OTTAWA1021
LOVE874
TULSA943
JACKSON1037
CHOCTAW1149
MUSKOGEE971
DELAW
ARE
922CH
EROKEE
1029
HASKELL1048
PAWNEE956
JEFFERSON1085
MCINTOSH960
PONTOTOC1008
SEQUOYAH1002
MCCLAIN962
OKMULGEE1042
SEMIN
OLE
1073
HAR
MO
N1024
JOHNSTON1097
OKFUSKEE1076
WAGONER862
MURRAY1119
POTTAW
ATOM
IE998
CLEVELAND
861
MARSHALL918
WASH
ING
TON
855
Page 2
County Demographics
STATE OF THE COUNTY’S HEALTH REPORT
Population estimates1
o 0.5% increase from 1990 to 2000 (11,445 to 11,500)
1.8% increase from 2000 to 2008 (11,500 to 11,709) o Ranked 35th for growth in state
2008 Census Estimates2
Hispanic/Latino ethnicity = 6.3% Race o Whites = 94.3% o Native Americans = 4.1% o Blacks = 1.3%
Age o Under 5 = 7.4% o 65 and over = 17.8% o Median age = 39.2 years
2000 Census3
Housing units Occupied = 4,506 (83%) Vacant = 946 (17%)
Disability (ages 21 to 64) = 18.6% state = 21.5% national = 19.2% 51.5% of disabled (ages 21-64)
are employed
Individuals below poverty = 15.5% state = 14.7% national = 12.4%
Families below poverty = 13.1% state = 11.2% national = 9.2%
0%
5%
10%
15%
20%
0‐4 5‐14 15‐24 25‐34 35‐44 45‐54 55‐64 65‐74 75‐84 85+Percent of Population
Age Group
1990, 2000, & 2008 Population by Age Groups,
1990 Census 2000 Census 2008 Estimate
Washita County
Top 10 Leading Causes of Death
295 214 2480 0 0 0
164419 363
1,741
4,684
0
500
1000
1500
2000
2500
3000
3500
4000
4500
5000
Washita * Age-Adjusted Death Rate per 100,000 Population
Rate per 100,000 Population
Heart Disease Death Rates by Demographic Groups, Washita County, 2002-20064
The top 10 leading causes of death4 table on the next page dis-plays a broad picture of the causes of death in Washita County. Since many health-related issues are unique to specific ages, this table provides causes of death by age group at a glance. The causes of death that are present across almost every age group have been highlighted. From 1983 to 1993 heart disease killed 1,129 people in Washita County and is still the leading cause of death with all age groups combined.
From 2006-2008, the total charges for all heart disease-related hospitalizations for Washita County residents was $18,889,614.00, which translated to an average of $35,176.19 per discharge.5 Total charges are an indicator of community health, however, these are hospital-based charges and not pay-ments or costs of actual illness. The direct and indirect costs of disease are actually much higher (i.e., loss of employee wages, loss of tax revenue, loss of years of life).
State = 945.6 National = 810.1 * Note: Data classified by Quartiles
Legend
759.5 - 885.4
885.5 - 970.8
970.9 - 1034.6
1034.7 - 1149.0
Missing
Age-Adjusted Death Rates by County, OSDH Vital Statistics, 2002-20064

WASHITA COUN TY Page 3
Ra
nk
0-4
05-1
415
-24
25-3
435
-44
45-5
455
-64
65+
All
Ag
es
CO
NG
ENIT
AL
AN
OM
ALI
ESU
NIN
TEN
T.
INJU
RY
UN
INT
ENT
. IN
JUR
YU
NIN
TEN
T.
INJU
RY
HEA
RT
DIS
EAS
EH
EAR
T D
ISEA
SE
HEA
RT
DIS
EAS
EH
EAR
T D
ISEA
SE
< 4
54
413
2517
121
1
INFL
UEN
ZA
/ PN
EUM
ON
IAS
UIC
IDE
SU
ICID
EH
EAR
T D
ISEA
SE
CA
NC
ERC
AN
CER
CA
NC
ERC
AN
CER
< 4
< 4
< 4
< 4
920
114
145
SEP
TIC
EMIA
(B
LOO
D
POIS
ON
ING
)
CO
NG
ENIT
AL
AN
OM
ALI
ESH
OM
ICID
EC
AN
CER
UN
INT
ENT
. IN
JUR
YS
TRO
KE
STR
OK
ES
TRO
KE
< 4
< 4
< 4
< 4
55
4552
UN
INT
ENT
. IN
JUR
YN
EPH
RIT
ISC
ON
GEN
ITA
L A
NO
MA
LIES
SU
ICID
EB
RO
NC
HIT
IS/
EMPH
YS
EMA
/ A
STH
MA
ALZ
HEI
MER
'S
DIS
EAS
EU
NIN
TEN
T.
INJU
RY
< 4
< 4
< 4
< 4
< 4
2832
HIV
BR
ON
CH
ITIS
/ EM
PHY
SEM
A/
AS
THM
A
DIA
BET
ES
MEL
LITU
S
BR
ON
CH
ITIS
/ EM
PHY
SEM
A/
AS
THM
A
BR
ON
CH
ITIS
/ EM
PHY
SEM
A/
AS
THM
A<
4<
4<
427
31
HO
MIC
IDE
LIV
ER D
ISEA
SE
LIV
ER D
ISEA
SE
DIA
BET
ES
MEL
LITU
SA
LZH
EIM
ER'S
D
ISEA
SE
< 4
< 4
< 4
2328
LIV
ER D
ISEA
SE
STR
OK
EFI
VE
CA
US
ES
TIED
INFL
UEN
ZA
/ PN
EUM
ON
IAD
IAB
ETES
M
ELLI
TUS
< 4
< 4
< 4
1625
STR
OK
EN
EPH
RIT
ISIN
FLU
ENZ
A/
PNEU
MO
NIA
< 4
1517
UN
INT
ENT
. IN
JUR
YN
EPH
RIT
IS
1216
SEP
TIC
EMIA
(B
LOO
D
POIS
ON
ING
)
SU
ICID
E
79
No
te: T
he
nu
mb
ers
less
th
an 4
hav
e b
een
sh
ow
n a
s "<
4"
to p
rote
ct t
he
pri
vac
y o
f th
e su
bje
cts
Dat
a so
urc
e: V
ital
Sta
tist
ics,
Hea
lth
Car
e In
form
atio
n D
ivis
ion
, Okl
aho
ma
Sta
te D
epar
tmen
t o
f H
ealt
hP
rod
uce
d b
y: C
om
mu
nit
y D
evel
op
men
t S
erv
ice,
Okl
aho
ma
Sta
te D
epar
tmen
t o
f H
ealt
h
Mar
ch 2
009
5 6 7 8 9 10
To
p 1
0 C
ause
s o
f Dea
th b
y A
ge
Gro
up
Was
hita
Co
un
ty 2
002-
2006
1 2 3 4

The increasing inactivity of the U.S. population is con-tributing to an increase in numerous poor health-related outcomes. Physical inactivity robs the body of precious energy needed to function properly, in turn health de-clines, and rates of various chronic diseases escalate.
According to the 2003-2008 BRFSS8, it is estimated that 26.8% (2,322) of people in Washita County had no lei-sure activity in the past month (at the time they were sur-veyed) and over half of the adults (52.9%) did not reach the recommended physical activity level.
Statewide, 55% of high school students did not partici-pate in physical activity for at least 60 minutes per day on five or more days in a week.7 Efforts need to be made to increase physical activity for our youth to build long-term healthy habits.
With obesity at epidemic levels, steps need to be taken to control this issue. Surveillance systems have improved and been ex-panded to obtain more accurate county-level data. While efforts continue on this front, communities must utilize this information to improve the problem itself. With health care costs being, on average, $395 more for a person under the age of 65 who is obese than a person of the same age who is not obese6, estimated health care costs related to obesity for Washita County soar to almost $7.5 thousand. These costs only go up when the 65 and over population are included.
The Youth Risk Behavior Surveillance System (YRBS)7, while not producing county-level data, shows that in 2005, 2007, and 2009 combined, 15.8% of high school children participating in the survey classified themselves as overweight. Further, 14.7% classified themselves as obese. Interestingly, 8.9% of the males said they were obese compared to 5.8% of females. This trend was reversed in the overweight category with 8.0% of females and 7.8% of males, statewide. Although, neither weight category is statistically significant by gender.
According to the Behavioral Risk Factor Surveillance System (BRFSS, 2003 & 2005)8 , 79.3% of Washita County adults did not eat the recommended 5 servings of fruits and vegetables a day. Increasing fruit and vegetable consumption is an eco-nomical way to control many health-related issues such as obesity and diabetes.
Page 4
Nutrition & Overweight
STATE OF THE COUNTY’S HEALTH REPORT
OSAGE36
TEXAS27.1
BEAVER38.1
ELLIS35.6
CADDO30.3
LE FLORE32.6
CIMARRON36.8 KAY
26.6WOODS
27
MCCURTAIN35.8
GRADY25.5
CREEK30.6
ATOKA31.7
KIOWA28
GRANT16.4
BRYAN35.2
DEWEY36.4
MAJOR31.2
HARPER50.3
BLAINE37.7
CUSTER28
PITTSBURG34.8
CRAIG35.5
NOBLE35.2
LINCOLN35.4
WASHITA26.8
PAYNE23.1
LOGAN30.4
GARFIELD28.4
ALFALFA26.6
CARTER35.1
PUSHMATAHA30.5
GARVIN31.8
MAYES34.6
TILLMAN36.8
WOODWARD28.1
HUGHES31.8
GREER37.8
COMANCHE29.7
BECKHAM33.2
COAL34.6
ADAIR37.5
JACKSON27.6
ROGERS28.9
CANADIAN25.3
STEPHENS33.8
ROGER MILLS35.1
LATIMER34.6
COTTON24.5
KINGFISHER30.4
NO
WATA
30.9
PONTOTOC30.8
SEQUOYAH35
OKMULGEE36.8OKLAHOMA
29.5
OTTAWA34.1
LOVE37.3
TULSA26.8
CHOCTAW33.7
MUSKOGEE37.1
DELAW
ARE
35.8
CHEROKEE35.7
HASKELL39.2
PAWNEE33.4
JEFFERSON29.7
MCINTOSH40.4
MCCLAIN27.3
SEMIN
OLE
28
HAR
MO
N53.6
JOHNSTON32.6
OKFUSKEE40.7
WAGONER27.6
MURRAY26.1
POTTAW
ATOM
IE31.1
CLEVELAND
23.8
MARSHALL35.1
WASH
ING
TON
28.4
Percent of Adults with No Physical Activity Within Past Month, BRFSS, 2003-20088
State = 29.9% National = Data Not Available * Note: Data classified by Quartiles
Physical Activity & Fitness
WASH
ING
TON
38.1
MARSHALL27.6CLEVELAN
D37
POTTAW
ATOM
IE36
MURRAY36.2
WAGONER35.9
OKFUSKEE44.6
JOHNSTON41
HAR
MO
N34.9
SEMIN
OLE
35.8
OKMULGEE31.2
MCCLAIN36.5
SEQUOYAH34.7
PONTOTOC33.8
MCINTOSH34
JEFFERSON38.2
PAWNEE39.3
HASKELL39.3
CHEROKEE34.9
DELAW
ARE
38
MUSKOGEE33
CHOCTAW34.4
JACKSON36.2
TULSA36.8
LOVE40
OTTAWA32.7
OKLAHOMA34
NO
WATA
37.2
KINGFISHER31
COTTON28.7
LATIMER32.9
ROGER MILLS34.6
STEPHENS36.5
CANADIAN38
ROGERS38.4
ADAIR35.3
BECKHAM39.2
COMANCHE36.3
GREER46.2
COAL37.8
HUGHES37.3
WOODWARD29.7
TILLMAN32.9
MAYES39.1
GARVIN36.7
PUSHMATAHA35.4
CARTER39.7
ALFALFA26.9
GARFIELD36.2
LOGAN39.1
PAYNE34.6
WASHITA40.8
LINCOLN34.6
NOBLE39.9
CRAIG40.4
PITTSBURG36
CUSTER37.3
BLAINE34.7
HARPER50.9
MAJOR36.7
DEWEY40.3
BRYAN40.5
GRANT50.4
KIOWA35.2
ATOKA34.1
CREEK34.4
GRADY38.6
MCCURTAIN36.1
WOODS36
KAY36.4
CIMARRON44
LE FLORE40.1
CADDO36.2
ELLIS48.5
BEAVER43.2
TEXAS40.9
OSAGE34.8OSAGE34.8
TEXAS40.9
BEAVER43.2
ELLIS48.5
CADDO36.2
LE FLORE40.1
CIMARRON44 KAY
36.4WOODS
36
MCCURTAIN36.1
GRADY38.6
CREEK34.4
ATOKA34.1
KIOWA35.2
GRANT50.4
BRYAN40.5
DEWEY40.3
MAJOR36.7
HARPER50.9
BLAINE34.7
CUSTER37.3
PITTSBURG36
CRAIG40.4
NOBLE39.9
LINCOLN34.6
WASHITA40.8
PAYNE34.6LOGAN
39.1
GARFIELD36.2
ALFALFA26.9
CARTER39.7
PUSHMATAHA35.4
GARVIN36.7
MAYES39.1
TILLMAN32.9
WOODWARD29.7
HUGHES37.3
COAL37.8
GREER46.2
COMANCHE36.3
BECKHAM39.2
ADAIR35.3
ROGERS38.4
CANADIAN38
STEPHENS36.5
ROGER MILLS34.6
LATIMER32.9
COTTON28.7
KINGFISHER31
NO
WATA
37.2
OKLAHOMA34
OTTAWA32.7
LOVE40
TULSA36.8
JACKSON36.2
CHOCTAW34.4
MUSKOGEE33
DELAW
ARE
38CHEROKEE
34.9
HASKELL39.3
PAWNEE39.3
JEFFERSON38.2
MCINTOSH34
PONTOTOC33.8
SEQUOYAH34.7
MCCLAIN36.5
OKMULGEE31.2
SEMIN
OLE
35.8
HAR
MO
N34.9
JOHNSTON41
OKFUSKEE44.6
WAGONER35.9
MURRAY36.2
POTTAW
ATOM
IE36
CLEVELAND
37
MARSHALL27.6
WASH
ING
TON
38.1
State = 36.0% National = 34.9% * Note: Data classified by Quartiles
Percent of Adults who are Overweight, BRFSS, 2003-20088
Legend
26.9 - 34.7
34.8 - 36.5
36.6 - 39.3
39.4 - 50.9
Missing
WASH
ING
TON
24.8
MARSHALL38.8
CLEVELAN
D25
POTTAW
ATOM
IE31.2
MURRAY22.6
WAGONER28.7
OKFUSKEE25.5
JOHNSTON30.4
HAR
MO
N17.6
SEMIN
OLE
31.4MCCLAIN29.5
MCINTOSH29.5
JEFFERSON27.4
PAWNEE33.8
HASKELL27.8
CHEROKEE29.9
DELAW
ARE
29.2
MUSKOGEE29.4
CHOCTAW27.3
TULSA24.6
LOVE29.7
OTTAWA32
OKLAHOMA26.2
OKMULGEE35 SEQUOYAH
32.2
PONTOTOC28.3
NO
WATA
31.2
KINGFISHER30.3
COTTON40.5
LATIMER34.5
ROGER MILLS36.4
STEPHENS28.8
CANADIAN24.1
ROGERS27.7
JACKSON29.8
ADAIR34.4
COAL28.6
BECKHAM28.4
COMANCHE28.2
GREER26.2
HUGHES24.4
WOODWARD28.8
TILLMAN31.5
MAYES30.5
GARVIN29.6
PUSHMATAHA29
CARTER24.4
ALFALFA34.9
GARFIELD30.8
LOGAN28.3
PAYNE25.2
WASHITA21.9
LINCOLN31.4
NOBLE30
CRAIG32
PITTSBURG28
CUSTER28.8
BLAINE34.5
HARPER23
MAJOR30.5
DEWEY26.9
BRYAN24.8
GRANT21.2
KIOWA33
ATOKA30.8
CREEK27.5
GRADY29.8
MCCURTAIN31.5
WOODS16.6
CIMARRON14.2
LE FLORE29.6
KAY28.7
CADDO30.5
ELLIS26.4
BEAVER28
TEXAS24.6
OSAGE31.8
State = 27.5% National = 23.7% * Note: Data classified by Quartiles
Percent of Adults who are Obese, BRFSS, 2003-20088
Legend
14.2 - 26.4
26.5 - 29.0
29.1 - 31.2
31.3 - 40.5
Missing
Legend
16.4 - 28.1
28.2 - 32.6
32.7 - 35.7
35.8 - 53.6
Missing

As stated previously, poor nutrition and lack of physical activity are linked to many chronic issues including diabe-tes. It is often hard to distinguish between Type I and Type II diabetes in large datasets but looking at the overall im-pact of diabetes is necessary to examine a communities health.
From 2006 to 2008, there were 111 hospital discharges for diabetes among Washita County residents.5 This ac-counted for a total of 495 days in the hospital and $1,407,678.00 in total charges.5 This was an average of 4.5 days and $12,681.78 in charges.5
According to the 2004-2008 BRFSS, it is esti-mated that 7.5% (650) of Washita County citi-zens have been diagnosed by a health profes-sional as having diabetes.
In 2007, the per capita annual healthcare costs for people with diabetes was $11,744 com-pared to $5,106 for people without diabetes.9 Persons with diabetes accumulate an esti-mated $8,605,301.40 in health care costs in one year for Washita County. Actual hospital charges account for only 5.3% of the total health care impact of diabetes.
Page 5
While births to teen mothers (age 15 to 19) have been on the decline in both the U.S. and Oklahoma, Oklahoma has moved down in the rankings according to the United Health Foundation.10 In 1993, the rate for teen births in the U.S. was 60.3 per 1,000 15-19 year old females and 67.1 in Oklahoma, ranking 35th in the country.10 In 2003, the rate decreased to 47.7 in the U.S. and 59.7 in Oklahoma, accounting for a decrease of 21% and 11%, respectively.10 However, while the rate decreased, Oklahoma continued to fall in the rakings (41st). In 2009, the rate of teen births stayed the same for Oklahoma (59.6) but the state ranked 45th in the country.10
Children of teen mothers are more likely to display poor health and social outcomes than those of older mothers, such as premature birth, low birth weight, higher rates of abuse and neglect, and are more likely to go into foster care or do poorly in school.11
According to Oklahoma Vital Statistics, Washita County had a teen birth rate of 80.6 in 2007, which accounted for a 41% increase from 2003 (57.1) and a 27% increase from 1993 (63.3)12. The map represents a five-year average of teen birth rates, 2003-2007.12
On average in Oklahoma, births to teen mothers accumu-late $3,807 a year for each teenage birth13, which is often passed on to citizens. With an average of 24.0 births per year (2003-2007)12, teen pregnancy costs the citizens of Washita County $76,800.00 a year.
Diabetes
Teen Births
WASHITA COUN TY
HAR
MO
N
CIMARRON
OSAGE12
TEXAS3.6 KAY
12BEAVER
7.3
ELLIS6.7
CADDO13.2
LE FLORE14.6
WOODS6.8
MCCURTAIN9.5
GRADY6.5
CREEK8.8
ATOKA12.3
KIOWA15.3
GRANT5.6
BRYAN9.9
DEWEY6.2
MAJOR8
HARPER18.4
BLAINE12.3
CUSTER10.9
PITTSBURG10.3
CRAIG12.3
NOBLE11
LINCOLN9.6
WASHITA7.5
PAYNE8.2
LOGAN9.4
GARFIELD8.5
ALFALFA14.6
CARTER8.7
PUSHMATAHA11.1
GARVIN12.1
MAYES11.3
TILLMAN18.7
WOODWARD10.7
HUGHES11.6
COAL8.4
GREER10.7
COMANCHE8.8
BECKHAM10.3
ADAIR13.9
JACKSON13.7
ROGERS10.1
CANADIAN8.6
STEPHENS10.1
ROGER MILLS9.9
LATIMER13.7
COTTON9
KINGFISHER8
NO
WATA
11PONTOTOC
8.7
SEQUOYAH10
OKMULGEE12.2
OKLAHOMA8.5
OTTAWA13
LOVE17.6
TULSA8.7
CHOCTAW9.9
MUSKOGEE11.8
DELAW
ARE
12.6
CHEROKEE12.2
HASKELL5.9
PAWNEE12.5
JEFFERSON10.2
MCINTOSH9.5
MCCLAIN6.6
SEMIN
OLE
6.9
JOHNSTON8.3
OKFUSKEE15.6
WAGONER10.4
MURRAY14.4
POTTAW
ATOM
IE9.1
CLEVELAND
7.2
MARSHALL9.1
WASH
ING
TON
10
State = 7.5% National = 8.1% * Note: Data classified by Quartiles
Percent of Adults Who Have Ever Been Told They Have Diabetes, BRFSS, 2004-20088
Legend
3.6 - 8.5
8.6 - 10.1
10.2 - 12.2
12.3 - 18.7
Missing
OSAGE43.1
TEXAS79.2
BEAVER38.5
ELLIS61
CADDO63.3
KAY67.2
LE FLORE78.2
CIMARRON42.1 WOODS
25.8
MCCURTAIN88.3
GRADY47.2
CREEK56.3
ATOKA66.3
KIOWA70.5
GRANT26.4
BRYAN65.6
DEWEY39.5
MAJOR37.9
HARPER65.8
BLAINE67.7
CUSTER46.7
PITTSBURG70.7
CRAIG65.1
NOBLE39.9
LINCOLN54.4
WASHITA61
PAYNE25.1
LOGAN32.7
GARFIELD67.9
ALFALFA29.5
CARTER74.2
PUSHMATAHA68.9
GARVIN71.8
MAYES66.3
TILLMAN84.1
WOODWARD76.8
HUGHES82.6
COAL57.2
GREER76
COMANCHE63.9
BECKHAM83
ADAIR93.1
JACKSON69.1
ROGERS38.4
CANADIAN35.2
STEPHENS58.1
ROGER MILLS63.3
LATIMER48.1
COTTON64.9
KINGFISHER42.8
NO
WATA
59.3
PONTOTOC56.7
SEQUOYAH71.9
OKMULGEE67.1
OKLAHOMA68.8
OTTAWA66.6
LOVE61.6
TULSA60.8
CHOCTAW83.3
MUSKOGEE75.6
DELAW
ARE
68.3
CHEROKEE52.3
HASKELL77.9
PAWNEE55.9
JEFFERSON91.6
MCINTOSH52.8
MCCLAIN41.1
SEMIN
OLE
72.9
HAR
MO
N80.3
JOHNSTON83.3
OKFUSKEE65.3
WAGONER40
MURRAY87.3
POTTAW
ATOM
IE59.8
CLEVELAND
26.2
MARSHALL82.7
WASH
ING
TON
47.2
State = 58.2 per 1,000 Female Population Aged 15-19 National = 40.5 per 1,000 Female Population Aged 15-19 (2005)
* Note: Data classified by Quartiles
Rate of Births to Teen Mothers (Age 15-19), OSDH Vital Statistics, 2003-200712
Legend
25.1 - 47.2
47.3 - 64.9
65.0 - 71.9
72.0 - 93.1
Missing

Protecting the most vulnerable populations is a task for every Oklahoman, socio-demographic variables have repeatedly been shown to affect infant mortality and birth weight. Income, education, race/ethnicity, access to medical care and social services, and social support are just a few of the characteristics that alter these rates, both positively and negatively.16 Differences in infant mortality rates are most apparent within racial categories. From 2003-2005 within the U.S., the infant mortality rate among white mothers was 5.7 deaths per 1,000 live births, while black or African Americans mothers had an infant mortality rate of 13.3 and
American Indian mothers a rate of 8.4. Interest-ingly, Hispanic mothers had rates similar to white mothers.15
Within Oklahoma, this trend continues. From 2002-2006, the infant mortality rate was highest for black or African American mothers (16.0), followed by American Indian (8.4), White (7.1), and Asian (5).4 The Hispanic infant mortality rate was 7.9.4
With an average of 412 infant deaths a year across Oklahoma4, it is difficult to obtain stable county-level data by race. From 2002-2006, the overall infant mortality rate for Washita County was 6.5. This accounted for a 19% decrease from the state rate of 8.0 deaths per 1,000 live births.4
In addition, the infant mortality rate in Washita County accounted for 375 years of potential life lost based on an average age of death in Okla-homa of 75 years of age.4
Birth weight has been a long standing indicator of long-term health outcomes as birth weight has been linked to certain adult chronic conditions such as high blood pressure, Type II diabetes, and heart disease.17 Low birth weight is defined as any baby born weighing less than 2,500 grams or 5 pounds and 8 ounces (including very low birth weight = less than 1,500 grams/3 pounds, 5 ounces).17 Low birth weight is associated with premature births, multiple births, birth defects, chronic health problems or infections in the mother, smoking, alcohol or drug use, placental problems, inadequate mater-nal weight gain or socioeconomic factors.17 Un-derstanding the trends behind low birth weight can assist in pinpointing causes specific to a com-munity.
In Oklahoma from 2003-2007, 8.1% of the live births were less than 2,500 grams. As with infant mortality, babies born to black or African Ameri-can mothers have the highest rates of low birth weight (14.1%), followed by White (7.5%), American Indian and Asian (6.9% each).12 This trend is similar to the national data.18
In Washita County, from 2003-2007 the low birth weight rate was 6.3%.12 This was a 22.2% de-crease from the state and national low birth weight rate. Because of the small numbers that occur in this category, county level data by race is unavail-able.
Infant Mortality
Low Birth Weight
OSAGE7.7
TEXAS6.7 KAY
7.8BEAVER
6.5
ELLIS6.7
CADDO8.2
LE FLORE6.5
CIMARRON4.2 WOODS
4.9
MCCURTAIN8.2
GRADY8.7
CREEK8
ATOKA9.1
KIOWA10.8
GRANT5
BRYAN7.4
DEWEY4.9
MAJOR10.3
HARPER6.5
BLAINE9.8
CUSTER6.9
PITTSBURG7.8
CRAIG9.2
NOBLE5.4
LINCOLN7.9
WASHITA6.3
PAYNE6.1
LOGAN7.1
GARFIELD8.4
ALFALFA6.3
CARTER9.2
PUSHMATAHA7.1
GARVIN7.5
MAYES6.9
TILLMAN7.7
WOODWARD8.1
HUGHES7.4
COAL6.9
GREER11.7
COMANCHE8.8
BECKHAM9
ADAIR8.7
JACKSON9.9
ROGERS6.7
CANADIAN7.2
STEPHENS7.3
ROGER MILLS7.3
LATIMER5.7
COTTON8.2
KINGFISHER7.6
NO
WATA
4.8
MCINTOSH9.1
OKLAHOMA8.8
OTTAWA8.1
LOVE9.3
TULSA8.2
CHOCTAW9.3
MUSKOGEE8.2
DELAW
ARE
7.9
CHEROKEE7.5
HASKELL7.5
PAWNEE8.5
JEFFERSON9.4
PONTOTOC8.6
SEQUOYAH8.5
MCCLAIN8.5
OKMULGEE8.1
SEMIN
OLE
8.5
HARM
ON
8.6
JOHNSTON7.6
OKFUSKEE8
WAGONER7.6
MURRAY9.9
POTTAW
ATOM
IE7.3
CLEVELAN
D7
MARSHALL7.2
WASH
ING
TON
7.1
State = 8.1% of live births National = 8.1% of live births (2003-2006) Note: % of births with birth weight under 2500 grams Data classified by Quartiles
Percent of Live Births with Low and Very Low Birth Weight, OSDH Vital Statistics, 2003-200712
BEAVER
ELLIS
OSAGE8.8
CIMARRON
WOODS
TEXAS5.7 GRANT
KAY7.8ALFALFA
CADDO8
LE FLORE8.2
MCCURTAIN5.1
GRADY7.8
CREEK8.6
ATOKA10.8
KIOWA8.5
BRYAN8.6
DEWEY10.8
MAJOR8
PAWNEE
HARPER13.1
BLAINE9.7
CUSTER4.8
PITTSBURG7.6
CRAIG6.4
NOBLE5.6
LINCOLN9.9
WASHITA6.5
PAYNE7.1
LOGAN8.7
GARFIELD10.4
CARTER6.2
PUSHMATAHA7.3
GARVIN8.4
MAYES15.3
TILLMAN10.4
WOODWARD9.3
HUGHES7.8
GREER12.7
COMANCHE7.6
BECKHAM6
ADAIR7.5
JACKSON10.2
ROGERS6.3
CANADIAN7.2
STEPHENS8.4
ROGER MILLS13.1
LATIMER14
COTTON8.1
KINGFISHER3.1
NO
WATA
4.7
PONTOTOC8.3
SEQUOYAH7.6
OKMULGEE9.5
OKLAHOMA8.9
OTTAWA7.4
LOVE5.2
TULSA8
CHOCTAW12.6
MUSKOGEE6.2
DELAW
ARE
4.8
CHEROKEE9.3
HASKELL9.8
JEFFERSON9.8
MCINTOSH6.1
MCCLAIN7.4
SEMIN
OLE
9.5
HAR
MO
N14.9
JOHNSTON5.8
OKFUSKEE5.5
WAGONER5.4
MURRAY6.1
POTTAW
ATOM
IE7.3
CLEVELAND
6.3
MARSHALL7.8
COAL26.8
WASH
ING
TON
7.7
Infant Mortality Rate, Oklahoma Vital Statistics, 2002-20064
State = 8.0 per 1,000 births National = 6.8 per 1,000 births (2003-2005) * Note: Data classified by Quartiles
Legend
3.1 - 6.3
6.4 - 7.8
7.9 - 9.5
9.6 - 26.8
Missing
Legend
4.2 - 7.0
7.1 - 7.8
7.9 - 8.6
8.7 - 11.7
Missing
Page 6 STATE OF THE COUNTY’S HEALTH REPORT

According to the 2005 State of the State’s Health Report19, tobacco use among Oklahomans has remained fairly stable from 1990 to 2002. The good news is that total cigarette sales in Oklahoma (tribal and non-tribal combined) have dropped from 98.2 packs per capita in fiscal year 2005 to 86.7 packs per capita during fiscal year 2008. The national average dropped during this same time period.20
Tobacco use is no longer just the problem of the individual but also the community as a whole. With health care costs on the rise, targeting areas such as tobacco use is an effective way to control those costs. The Oklahoma Tobacco Helpline (1-800-QUIT-NOW), supported jointly by the Oklahoma Tobacco Settlement Endowment Trust and the Oklahoma State Department of Health, con-tinues to experience high call volume. Over 37,800 Oklahomans received free cessation assistance through the Helpline in fiscal year 2009.20 Since inception of the Helpline in August 2003, over 110,000 Oklahomans have received free cessa-tion assistance.20
The CDC estimated that a person who used tobacco accrued over $3,300 in health care costs per year.21 According to the BRFSS (2005-2009)8, it is estimated that 28.3% (2,452) of adults in Washita County use tobacco of some sort. Medical costs accumu-lated by those persons are over $8.1 million a year for Washita
Across the nation and the state of Oklahoma, unintentional and violence-related injuries are on the rise. Uninten-tional injuries account for the 5th leading cause of death in the United States and Oklahoma for 2002-2006. For per-sons ages 1 to 44 in Oklahoma, unintentional injuries are the leading cause of death.4
This trend does not change much in Washita County. Unintentional injuries are the lead-ing cause of death for ages 15 to 44 in Washita County.
It is estimated that for every motor vehicle-related death $1.3 million in economic costs are incurred (2008 data).16 For Washita County, which has an average of 2.4 motor vehicle-related deaths a year4, the estimated economic costs are almost $3.1 million a year.
Violence-related injuries (homicide and sui-cide) in Washita County are ranked in the top 10 causes of death for persons from 15 to age 54 and suicide is the 10th leading cause of death for all ages.4
Injury and Violence
Tobacco Use Prevention
Per Capita Cigarette Sales: Oklahoma & United States20
MCCLAIN6HAR
MO
N
ELLIS
HARPERALFALFA
MAJOR
COAL
TEXAS10.7 WOODS
10
GRADY10.5
PAYNE7.7
LOGAN8
GARFIELD11
HUGHES11
JACKSON7.2
ROGERS11.3
CANADIAN11.7
STEPHENS10.8
KINGFISHER11.7
NO
WATA
8.5
HASKELL7.3
JEFFERSON11.6
OKFUSKEE9.7
WAGONER9.6
CLEVELAND
11.1
OSAGE13.7
LE FLORE13.9
KIOWA11.9
GRANT12.2
BLAINE12.8
CUSTER11.8
CRAIG14.1
NOBLE12
TILLMAN13.6
WOODWARD12
COMANCHE13.1
ADAIR13.9
SEQUOYAH12.3
OKLAHOMA14.2
LOVE13.7
DELAW
ARE
13.3
PAWNEE12.2
JOHNSTON13.4
CADDO16.6
KAY15.1
ATOKA16.4
DEWEY15.1
WASHITA15.5
CARTER16.6
PUSHMATAHA15.3
GREER16.2
ROGER MILLS17.6
PONTOTOC15.3
OKMULGEE16.5
TULSA15.3
CHOCTAW18.4
MUSKOGEE14.4
CHEROKEE17.4
POTTAW
ATOM
IE15.1
MARSHALL15.1
BEAVER23.6
CIMARRON29.6
MCCURTAIN26.4
CREEK21.5
BRYAN19.6
PITTSBURG19.5
LINCOLN21.9
GARVIN25
MAYES19.2
BECKHAM19.7
LATIMER40.2
COTTON19.4
OTTAWA21.4
MCINTOSH22.7SEM
INO
LE23.8
MURRAY21.8
WASH
ING
TON
21.9
State = 14.0 National = 10.9 * Note: Data classified by Quartiles
Age-Adjusted Suicide Rate by County, OSDH Vital Statistics, 2002-20064
Legend
6.6 - 11.7
11.8 - 14.2
14.3 - 18.4
18.5 - 40.2
Missing
Page 7 WASHITA COUN TY
0
10
20
30
40
50
60
Percent of Adults
Current Smoker Former Smoker Never SmokedWashita
Percent of Adults by Smoking Status, Washita County, 2001-2009, Five-Year Averages8

Healthy People 2010 Table
Page 8 STATE OF THE COUNTY’S HEALTH REPORT
Washita County
Prevalence of Obese (Aged 18+) 2002‐2008 20.2% 2008 31.0% 2008 26.7% 15%
No Leisure‐Time Physical Activity (Aged 18+) 2002‐2008 26.4% 2008 31.5% 2008 24.6% 20%
Prevalence of Smoking (Aged 18+) 2002‐2008 26.1% 2008 24.7% 2008 18.4% 12%
Infant Mortality (Per 1,000 of births) 2002‐2006 6.5 2006 8.1 2006 6.8 4.5
Low Birth Weight Infants (Percent of live births) 2002‐2007 6.5% 2006 8.3% 2006 8.3% 5%
Very Low Birth Weight Infants (Percent of live births) 2002‐2007 0.9% 2006 1.6% 2006 1.5% 0.9%
First Trimester Prenatal Care (Percent of births) 2002‐2007 64.3% 2006 75.6% 2006 83.2% 90%
Prevalence of Diabetes (Aged 18+) 2002‐2008 7.3% 2008 11.3% 2008 9.2% 2.5%
Lack of Health Insurance (Aged 18‐64) 2002‐2008 27.8% 2008 22.8% 2008 17.1% 0%
Prevalence of Binge Drinking (Aged 18+) 2002‐2008 5.4% 2008 12.2% 2008 15.6% 6%
Coronary Heart Disease Death* 2002‐2006 176.2 2006 184.5 2006 144.4 166.0
Cancer Death* 2002‐2006 180.3 2006 194.9 2006 180.8 159.9
Unintentional Injury Death* 2002‐2006 51.2 2006 55.6 2006 39.3 17.5
Transportation‐Related Death* 2002‐2006 22.9 2006 21.0 2006 14.5 9.2
Note: * means (Age‐adjusted death per 100,000 to the 2000 U.S. standard population).
Reference:
[1] Healthy People 2010 volume I and II, U.S. Department of Health and Human Services, November 2000.
[2] Centers for Disease Control and Prevention (CDC), Wide‐Ranging Online Data for Epidemiologic Research:
Data for Oklahoma and United States.
[3] CDC, National Center for Chronic Disease Prevention and Health Promotion, the Behavioral Risk Factor
Surveillance System (BRFSS): Data for Oklahoma and United States.
[4] Oklahoma State Department of Health (OSDH), OK2SHARE, BRFSS: Data for Oklahoma Counties.
[5] OSDH, OK2SHARE, Vital Statistics: Data for Oklahoma Counties.
Most Recent Data: Year(s)Healthy People 2010 Indicators 2010 TargetOklahoma United States
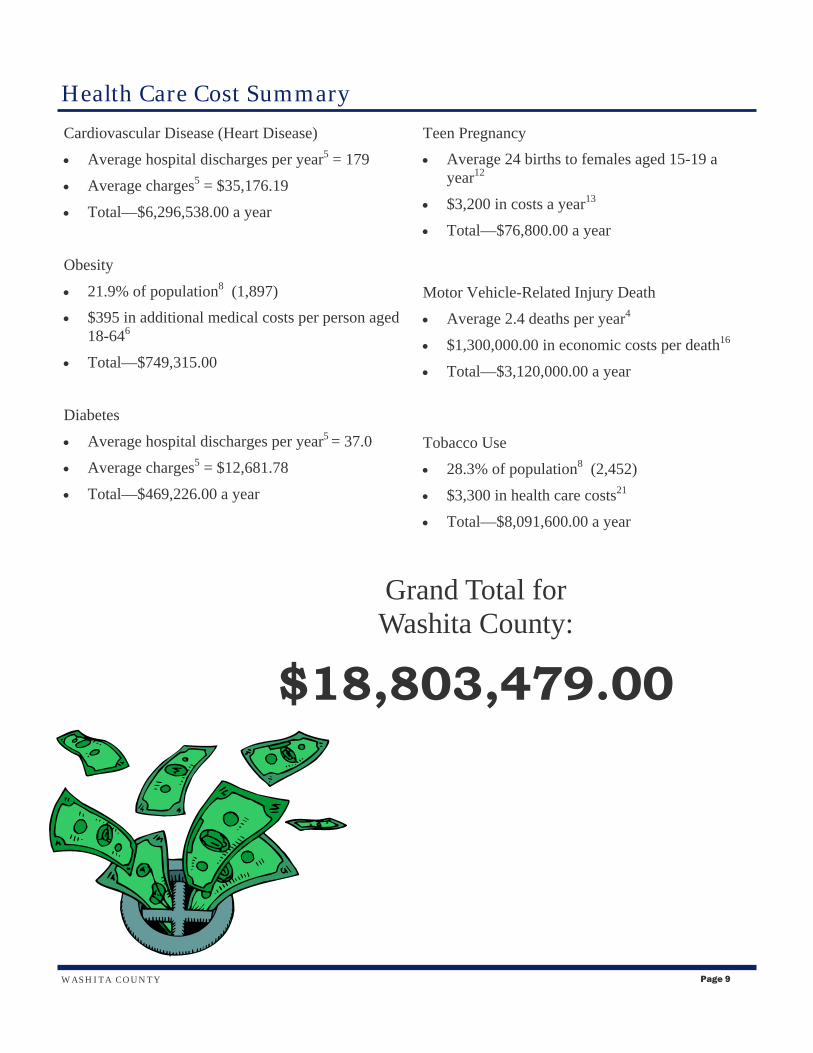
Health Care Cost Summary
Page 9 WASHITA COUN TY
Teen Pregnancy
Average 24 births to females aged 15-19 a year12
$3,200 in costs a year13
Total—$76,800.00 a year
Motor Vehicle-Related Injury Death
Average 2.4 deaths per year4
$1,300,000.00 in economic costs per death16
Total—$3,120,000.00 a year
Tobacco Use
28.3% of population8 (2,452)
$3,300 in health care costs21
Total—$8,091,600.00 a year
Cardiovascular Disease (Heart Disease)
Average hospital discharges per year5 = 179
Average charges5 = $35,176.19
Total—$6,296,538.00 a year
Obesity
21.9% of population8 (1,897)
$395 in additional medical costs per person aged 18-646
Total—$749,315.00
Diabetes
Average hospital discharges per year5 = 37.0
Average charges5 = $12,681.78
Total—$469,226.00 a year
Grand Total for Washita County:
$18,803,479.00

County Health Department Usage
STATE OF THE COUNTY’S HEALTH REPORT Page 10
County Health Department Unduplicated Clients, and Visits by Program, Washita County, State Fiscal Year 2009
2 8 318
2
185
0
50
100
150
200
250
300
350
Adult Services Child Health Early Intervention Family Planning STD WIC
Number of Unduplicated Clients and Visits
Unduplicated Clients Visits
WASHITA
Data Note: Data is reflective of all services offered in a
county, including county health departments and contracts.

Page 11 WASHITA COUN TY
Texas6
Osage6
Ellis6
Beaver3
Kay21
Cimarron2
Le Flore14
Caddo5
McCurtain14
Woods4
Grady18
Grant1
Atoka3
Creek24
Bryan20
Pittsburg26
Blaine7
Harper2
Custer15
Dewey2
Alfalfa1
Craig5
Lincoln7
Carter25
Garfield37
Washita2
Noble3
Tillman2
Greer4
Mayes13
Cotton1
Comanche48
Latimer2
Beckham17
Stephens23
Canadian40
Major5
Kiowa4
Garvin8
Logan11
Woodward7
Pushmataha6
Coal1
Adair8
Payne40 Tulsa
1142
Love4
Hughes3
Roger Mills2
Jackson16
Rogers27
Choctaw5
Kingfisher4
Jefferson2
Haskell3
Del
awar
e12
Pontotoc5
Che
roke
e16
Muskogee29
McIntosh6
Now
ata
2
Pawnee3
Johnston5
McClain7
Sequoyah6
Oklahoma1366
Har
mon
2
Sem
inole8
Okmulgee13
Ottawa13
Pottaw
atomie
33
Cleveland
156
Marshall7
Was
hing
ton
33
Okfuskee3
Wagoner12
Murray5
Rate of Primary Care Physicians per 100,000 Population, 2009 - 2010
LegendPer 100,00 Population
13.2 - 23.6
23.7 - 35.4
35.5 - 52.3
52.4 - 91.8
91.9 - 200.2
Note: The number of Primary Care Physicians for each county is represented under the county name. Source: 2009-2010 Physician Survey, Office of Primary Care and Rural Health, Community Development Service, Oklahoma State Department of Health
Primary Care Coverage Map
OSDH Health Education
Kathy Payne, Director
1000 NE 10th St, room 506
Oklahoma City, OK 73117
405-271-6127
[̀
[̀[̀
[̀
[̀[̀[̀[̀[̀
[̀[̀[̀[̀[̀[̀[̀[̀[̀[̀[̀[̀[̀
[̀
[̀
[̀[̀[̀[̀
[̀[̀[̀[̀ [̀[̀[̀
[̀
[̀
[̀[̀[̀!
!
!
!
!
!
!
!
!
!!!
!
!
!
!
!
OSAGE
TEXASKAY
BEAVER
ELLIS
CADDO
LE FLORE
CIMARRON
WOODS
MCCURTAIN
GRADY
CREEK
ATOKA
KIOWA
GRANT
BRYAN
DEWEY
MAJOR
BLAINE
HARPER
CUSTER
PITTSBURG
CRAIG
NOBLE
PAYNE
LINCOLN
WASHITA
LOGAN
ALFALFA
GARFIELD
CARTERPUSHMATAHA
GARVIN
LOVE
MAYES
TILLMAN
COAL
WOODWARD
HUGHESGREER
COMANCHE
BECKHAM
TULSA
ADAIR
JACKSON
ROGERS
CANADIAN
STEPHENS
LATIMER
ROGER MILLS
CHOCTAW
COTTON
MUSKOGEE
KINGFISHER CHEROKEE
HASKELL
PAWNEE
JEFFERSON
NOWATA
MCINTOSH
PONTOTOC
SEQUOYAH
OKMULGEEOKLAHOMA
JOHNSTON
OKFUSKEE
OTTAWA
WAGONER
MURRAY
DELAWARE
MCCLAIN
SEMIN
OLE
HARMON
POTTAW
ATOM
IE
CLEVELAND
MARSHALL
WAS H
ING
TON
If you have an after‐school program that is interested in learning more about CATCH Kids Club, a physical activity and nutrition program for children grades K‐5, please contact the local health educator or Kathy Payne for information.
CATCH Kids Club Sites
! CKC Pilot Sites 2009-2010 (17)
[̀ NEW CKC Sites 2009-2010 (40)
Health Education
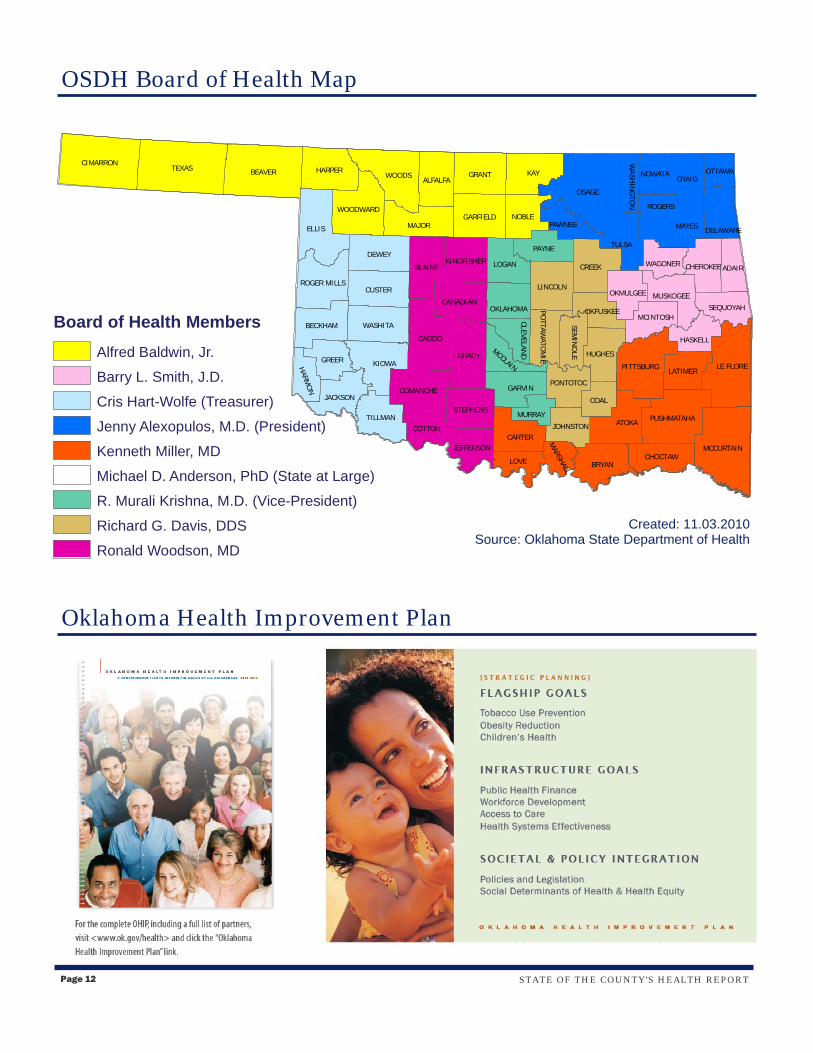
Board of Health Members
Alfred Baldwin, Jr.
Barry L. Smith, J.D.
Cris Hart-Wolfe (Treasurer)
Jenny Alexopulos, M.D. (President)
Kenneth Miller, MD
Michael D. Anderson, PhD (State at Large)
R. Murali Krishna, M.D. (Vice-President)
Richard G. Davis, DDS
Ronald Woodson, MD
OSAGE
TEXASKAY
ELLIS
BEAVER
LE FLORE
CADDO
CIMARRON
WOODS
GRADY
MCCURTAIN
CREEK
ATOKA
KIOWA
BRYAN
GRANT
DEWEY
MAJOR
BLAINE
CUSTER
HARPER
PITTSBURG
CRAIG
PAYNE
LINCOLN
WASHITA
NOBLEGARFIELD
CARTER
ALFALFA
LOGAN
GARVIN
LOVE
PUSHMATAHA
MAYES
TILLMAN
COAL
GREERHUGHES
WOODWARD
ADAIR
COMANCHE
BECKHAM
JACKSON
ROGERS
STEPHENS
ROGER MILLS
LATIMER
CANADIAN
CHOCTAW
COTTON
KINGFISHER
MUSKOGEE
HASKELL
JEFFERSON
SEQUOYAHMCINTOSH
PONTOTOC
JOHNSTON
OKLAHOMA
OTTAWA
WAGONER
MURRAY
TULSA
CHEROKEE
DELAWAREPAWNEE
NOWATA
MCCLAIN
SEMIN
OLE
OKMULGEE
OKFUSKEE
HARMO
N
POTTAW
ATOM
IE
CLEVELAND
MARSHALL
WASH
ING
TON
OSDH Board of Health Map
Created: 11.03.2010 Source: Oklahoma State Department of Health
Oklahoma Health Improvement Plan
Page 12 STATE OF THE COUNTY’S HEALTH REPORT
Reference List
Page 13 WASHITA COUN TY
1. U.S. Census Bureau, Population Estimates, Accessed February 12, 2010 from www.census.gov.
2. U.S. Census Bureau, 2008 Census Estimates, Accessed February 12, 2010 from www.census.gov.
3. U.S. Census Bureau, Census 2000 Summary File 3, Accessed February 12, 2010 from www.census.gov
4. Oklahoma State Department of Health, Health Care Information, OK2SHARE, Death Statistics ‐ Final, Accessed April 13, 2010, www.health.ok.gov/ok2share.
5. Oklahoma State Department of Health, Health Care Information, OK2SHARE, Inpatient Discharge Statistics, Accessed May 20, 2010, www.health.ok.gov/ok2share. Note: Data does not include federal or tribal facilities.
6. Sturm, R., 2002. The effects of obesity, smoking, and drinking on medical problems and costs. Health Affairs, 21, 245.
7. Oklahoma State Department of Health, Health Care Informat0ion, OK2SHARE, Youth Risk Behavior Survey (YRBS), www.health.ok.gov/ok2share.
8. Oklahoma State Department of Health, Health Care Informat0ion, OK2SHARE, Behavioral Risk Factor Surveillance Survey (BRFSS), www.health.ok.gov/ok2share.
9. Winning at Work—Diabetes Facts, American Diabetes Association, Accessed May 24, 2010 from www.diabetes.org
10. United Health Foundation, America’s Health Rankings, www.americashealthrankings.org
11. Healthy Teen Network, Unique Needs of Children Born to Teen Parents, Accessed May 24, 2010 from www.healthteennetwork.org
12. Oklahoma State Department of Health, Health Care Informat0ion, OK2SHARE, Birth Statistics—Final, www.health.ok.gov/ok2share.
13. Than National Campaign to prevent Teen Pregnancy, By the Numbers: The Public Costs of Teen Childbearing in Oklahoma, November 2006.
14. Finch, B. K., 2003. Early origins of the gradient: The relationship between socioeconomic status and infant mortality in the United States. Demography, 40, 675‐699.
15 United States Department of Health and Human Services (US DHHS), Centers of Disease Control and Prevention (CDC), National Center for Health Statistics (NCHS), Office of Analysis and Epidemiology (OAE), Division of Vital Sta‐tistics (DVS), Linked Birth / Infant Death Records 2003‐2005 on CDC WONDER On‐line Database. Accessed at http://wonder.cdc.gov/lbd‐current.html on May 25, 2010 4:08:29 PM
16. National Safety Council, Estimating the Costs of Unintentional Injuries, Accessed May 25, 2010 from http://www.nsc.org/news_resources/injury_and_death_statistics/Pages/EstimatingtheCostsofUnintentionalInjuries.aspx.
17. March of Dimes, Low Birthweight Fact Sheet, Accessed May 25, 2010 from http://www.marchofdimes.com/professionals/14332_1153.asp#head2.
18. United States Department of Health and Human Services (US DHHS), Centers for Disease Control and Prevention (CDC), National Center for Health Statistics (NCHS), Division of Vital Statistics, Natality public‐use data 2003‐2006, on CDC WONDER Online Database, March 2009. Accessed at http://wonder.cdc.gov/natality‐current.html on May 25, 2010 5:09:49 PM
19. Oklahoma State Department of Health, 2005 State of the State’s Health, Accessed May 25, 2010 from http://www.ok.gov/health/pub/boh/state05/index.html.
20. Oklahoma State Department of Health, Tobacco Use Prevention Service.
21. Centers for Disease Control and Prevention. Annual smoking‐attributable mortality, years of potential life lost, and economic costs—United States, 1995–1999. MMWR 2002;51(14):300–303.

The Oklahoma Turning Point Initiative is public health improvement in
action involving partnerships between the state and county departments of
health, local communities, and policy-makers. The Oklahoma Turning
point engine is fueled by a community-based decision making process
whereby local communities tap into the capacities, strengths, and vision of
their citizens to create and promote positive, sustainable changes in the
public health system, and the public’s health.
We are at a cross roads in our state and in Washita county. Please
come and be part of the solutions that will lead Oklahoma and
Washita County to becoming a healthy place to live, work and learn.
Page 14 STATE OF THE COUNTY’S HEALTH REPORT
If you are interested in learning more about Turning Point or
becoming involved in local activities, please
contact:
Washita Health Action Team
Community and Family Health Services
Community Development Service 1000 NE 10th St, Room 508 Oklahoma City, OK 73117
Phone: 405-271-6127
OKLAHOMA STATE DEPARTMENT OF HEALTH
Working Together For Health Neil Hann, MPH, CHES Community Dev., OSDH
1000 NE 10th Oklahoma City, OK 73117
(405) 271‐6127 Email: [email protected]
Website: www.okturningpoint.org
“If we are together nothing is impossible.
If we are divided all will fail.” - Winston Churchill
Report compiled by: Miriam McGaugh, Ph.D.
Epidemiologist and
Shu-Chuan Lin, Ph.D. Epidemiologist
Coalition Priorities: 1. Substance Abuse Prevention.
2. Positive Youth Development.
2009 Significant Outcomes:
$20,000 meth prevention grant by the ODMHSAS.
Media campaign for meth prevention project.
Sponsored youth to attend 2m2l Leadership Camp.
SWOSU became a Tobacco Free Campus.
Hosted Crystal Darkness Event.
http://www.ok.gov/health