starwood
TRANSCRIPT
Nick Ennis, Bill Geist, Allen Miller, Mike Mongiardini, Tom Walker & Ryan Williams December 6th 2014
Investment Analysis: Starwood Hotels & Resorts (NYSE: HOT)
EXECUTIVE SUMMARY
We believe that Starwood Hotels & Resorts Worldwide (HOT) is an interesting company with
sustainable advantages in the Lodging sector and feel that current market sentiment
underestimates the true earnings potential for the firm over the next two years. We believe
that HOT has positioned itself to benefit from optimistic industry growth prospects and have set
a December 2015 price target of $85.00.
We are bullish on the long term trajectory of Chinese consumer discretionary spending
growth and encouraged by HOT’s increased focus on the region as a prominent source of future
revenue. Additionally, we believe that the company’s timely transition to an asset-light
business model capitalizes on increasing real estate prices, enables ROA improvement, and
decreases the firm’s debt burden, which ultimately leads to decreased risk associated with the
business and in turn, justification for multiple expansion. Below are the four main points behind
our argument:
Macro trends in the Lodging Industry should support HOT’s growth initiatives. Growth in consumer discretionary spending in China continues to outperform global averages. The company has stated that it views Asia as the next source of revenue growth and intends to invest heavily in the region. Discretionary spending in China has increased from 9100 CNY to 3100 CNY since 2004. Furthermore, revenue per available room (RevPAR) in North America has increased at an 8% CAGR since 2009. Currently, North America accounts for roughly 45% of reported revenue for HOT broken out by geography.
HOT’s divestiture of real estate assets takes advantage of current market conditions. Data on real estate trends suggest that we are entering a seller’s market as prices for commercial real estate have increased roughly 40% since 2009.
An asset-light strategy in the Lodging segment allows for multiple expansion in stock value. By adopting such a model, HOT has proven that it can leverage the high reputation of its brand to support revenue and improve efficiency metrics along the
way. Since 2010, HOT’s return on assets has grown from 5.2% to 7.3% and the company’s debt burden has decreased from $3.4 to $2.4 billion. We believe that these developments represent strong arguments for a multiple expansion of 5.3% (from its current 13.1x to our estimated 13.8x) as the risk associated with the firm’s business have lessened.
2015 FCF should improve for the firm, as the company continues to rely less on a capital-intensive model. We believe that capital expenditure decreases will accelerate through 2015 as the firm continues to wind down its development capital expenditure from $160 million in 2014 to $135 million in 2015. The benefit to FCF will ultimately be a boon for shareholders of HOT as the company has shown a desire to return significant value to them through stock repurchases, dividends, and debt reduction.
COMPANY OVERVIEW
Starwood Hotel & Resorts Worldwide is a global hotel and leisure company that owns,
operates, and franchises luxury and upscale hotels, resorts, residences, and extended stay
hotels under the St. Regis, The Luxury Collection, W, Westin, Le Meridien, Sheraton, Four Points,
Aloft, and Element brands. In addition, the company markets vacation ownership resorts and
residential units for purchase at mixed use hotel projects. Starwood owns and/or manages over
1,200 properties in 100 countries and is headquartered in Stamford, Connecticut. It is listed on
NYSE in the S&P 500 stock price index under the ticker, HOT.
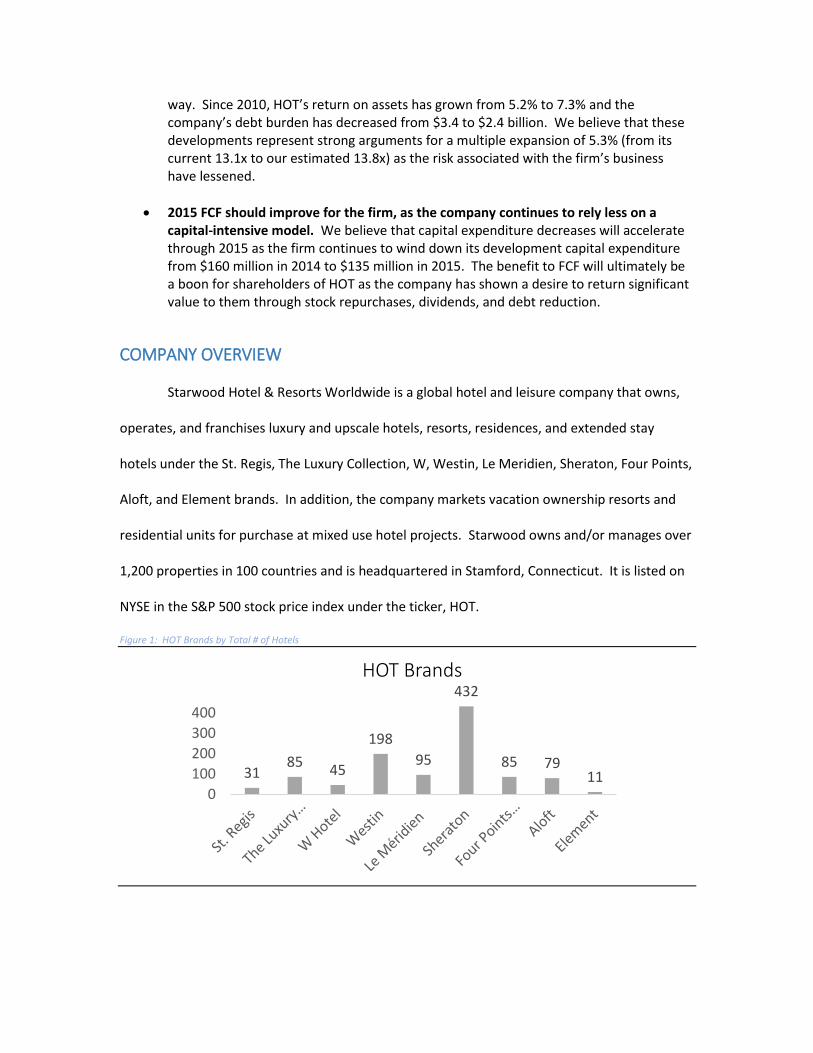
Figure 1: HOT Brands by Total # of Hotels
3185
45
198
95
432
85 7911
0
100
200
300
400
HOT Brands

The company segments its hotels business into Branded Hotel Management, Managed
Hotels, Brand Franchising and Licensing, and Owned, Leased, and Consolidated Joint Venture
Hotels. Its vacation ownership and residential sales operates separately from the hotels
business. Revenue by unit is broken down as follows:
Figure 2: Total Revenue by Unit
Business Unit 2012 2013 2014E 2015E Owned, Leased and Consolidated Joint Venture Hotels 1,698 1,692
Management Fees, Franchise Fees and Other Income 888 965 Vacation Ownership and Residential 1,287 924 Other Revenues from Managed and Franchised
Properties 2,448 2,614
Total Revenues 6,321 6,115
INVESTMENT THESIS HOT is positioned well to benefit from trends that suggest the Lodging Industry is rebounding from historical lows in 2008-2009 in existing markets and prepared to accelerate growth in new markets like China.
Chinese discretionary spending per capita is expected to grow beyond 30,000 CNY in
2015. That figure is expected to grow to over 42,000 within the next five years according to
estimates by Trading Economics which tracks nearly 300 economic indicators for 196 countries
worldwide. We believe that the nearly 10% CAGR in discretionary spending since 2004 indicates
a maturation of the Chinese consumer’s increasing demand of discretionary products and
services following overall economic expansion.
Figure 3: Chinese Discretionary Spending

In addition, we believe that the relaxation of visa restrictions between China and several major
economies, notably the United States and England, will increase inbound tourism demand
within China and serve as a further tailwind for the industry in the region.
Due to the continued development of the Chinese economy and therefore the increased
necessity of business travel to the region, paired with the relaxation of travel restrictions, we
feel that the Global Business Travel Association’s estimation that 55% of the increase in global
corporate travel over the next ten years stemming from Asia as a fair assumption and one that
supports the lodging sector’s growth in the region.
The North American lodging sector’s growth prospects, where HOT receives 45% of its
revenue, should also support our revenue projections for the firm over the next several
quarters. Figure 4 details the recovery of the North American luxury tourism sector. As can be
seen, the industry has rebounded from its lows following the financial crisis in 2008-09. We
believe that Average Daily Rate (ADR) will continue to outperform overall economic
development in the US (as measured by GDP growth) and believe this will have a positive effect
on RevPar.
Figure 4: Luxury Tourism Growth
9000
14000
19000
24000
29000
34000China Discretionary Spending per
Capita
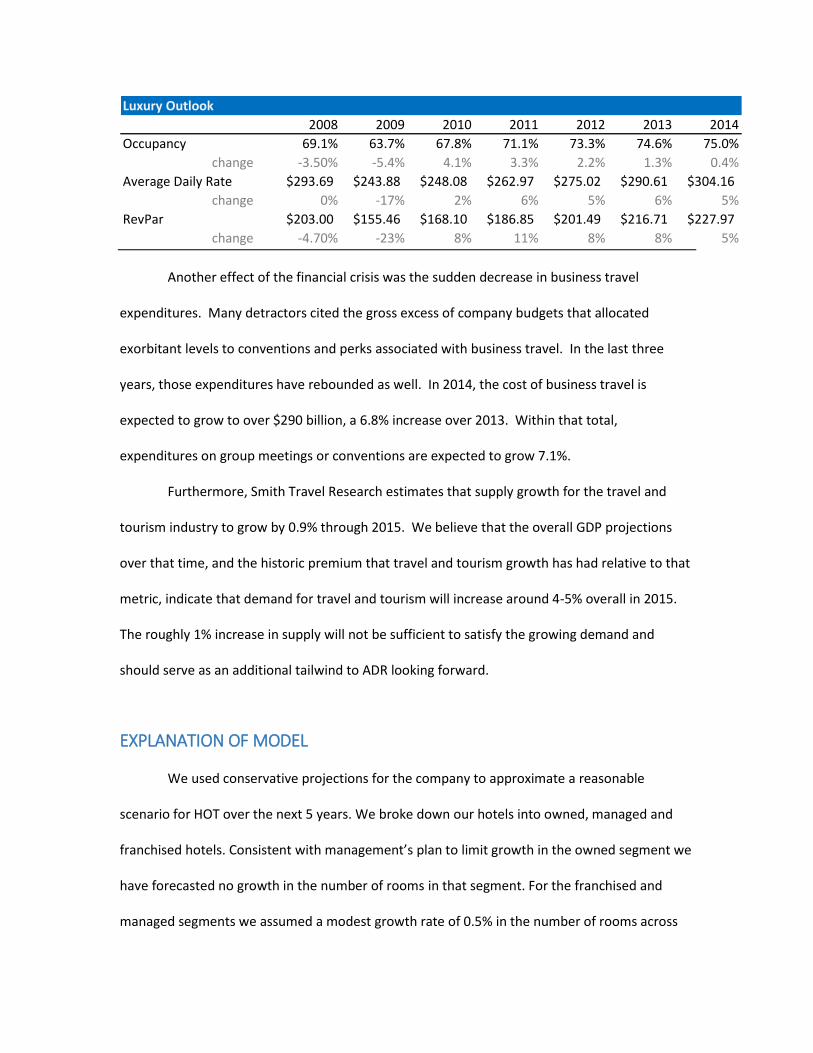
Another effect of the financial crisis was the sudden decrease in business travel
expenditures. Many detractors cited the gross excess of company budgets that allocated
exorbitant levels to conventions and perks associated with business travel. In the last three
years, those expenditures have rebounded as well. In 2014, the cost of business travel is
expected to grow to over $290 billion, a 6.8% increase over 2013. Within that total,
expenditures on group meetings or conventions are expected to grow 7.1%.
Furthermore, Smith Travel Research estimates that supply growth for the travel and
tourism industry to grow by 0.9% through 2015. We believe that the overall GDP projections
over that time, and the historic premium that travel and tourism growth has had relative to that
metric, indicate that demand for travel and tourism will increase around 4-5% overall in 2015.
The roughly 1% increase in supply will not be sufficient to satisfy the growing demand and
should serve as an additional tailwind to ADR looking forward.
EXPLANATION OF MODEL We used conservative projections for the company to approximate a reasonable
scenario for HOT over the next 5 years. We broke down our hotels into owned, managed and
franchised hotels. Consistent with management’s plan to limit growth in the owned segment we
have forecasted no growth in the number of rooms in that segment. For the franchised and
managed segments we assumed a modest growth rate of 0.5% in the number of rooms across
Luxury Outlook
2008 2009 2010 2011 2012 2013 2014
Occupancy 69.1% 63.7% 67.8% 71.1% 73.3% 74.6% 75.0%
change -3.50% -5.4% 4.1% 3.3% 2.2% 1.3% 0.4%
Average Daily Rate $293.69 $243.88 $248.08 $262.97 $275.02 $290.61 $304.16
change 0% -17% 2% 6% 5% 6% 5%
RevPar $203.00 $155.46 $168.10 $186.85 $201.49 $216.71 $227.97
change -4.70% -23% 8% 11% 8% 8% 5%

our different brands and geographies. We felt that by keeping conservative estimates
throughout our model we can rely on our DCF valuation as a base or even a downside scenario,
with any positive tailwinds in the market or for HOT providing a boost to this baseline value.
In addition to the modest increase in available rooms mentioned above, we have
forecasted some improvements in Average Daily Rates (“ADR”) and occupancy rates varying by
hotel brand in North America for our managed and franchised properties. For our international
properties we used comparable industry growth rates to forecast our own growth. In North
America, we assumed the ADR for each of our brands continued to grow at the rate it had from
2013 to 2014 over the life of our model. Regarding occupancy, we forecasted a modest increase
for 2015 and then kept occupancy rates flat for the duration of our model period resulting in
modest growth in RevPAR over the course of our modeling period. For our remaining 42 owned
hotels we simply included modest revenue per room increases of 2.2% in 2017 and 2018 to keep
up with inflation. Lastly, for the smaller timeshare segment, we just forecasted an explicit
growth rate in unit sales and corresponding growth in operating fees.
On the cost side, we have forecasted an explicit expense per hotel for our owned hotels
of $28 million per hotel annually which is in line with annual costs HOT has experienced in the
past. For the managed hotel segment, we have determined profits by applying the appropriate
base (4.3% in 2014 growing to 4.7% in 2019) and incentive management fees (2.2% in 2014 to
2.6% in 2019) to the revenue generated by these properties. Similarly, for the franchised hotel
segment we have applied an appropriate franchise fee (4.1% throughout the projection period)
to the revenues generated by these properties. Another major cost assumption in our model
includes maintaining an effective tax rate of 33% during the projection period, slightly higher
than in previous years.

The last assumption worth paying special attention to is our projection for capital
expenditures and debt going forward. We are forecasting a decline in Capital Expenditures from
roughly 10% of operating revenue in 2015 to 5% by 2019. This is consistent with HOT’s stated
goal of moving away from the owned hotel segment and operating primarily as a franchisor and
hotel manager. By the same token, we do not forecast any additional debt incurrence by HOT as
management seeks to improve its ROIC and is unlikely to want to raise more capital without a
pressing need for more capital expenditure.
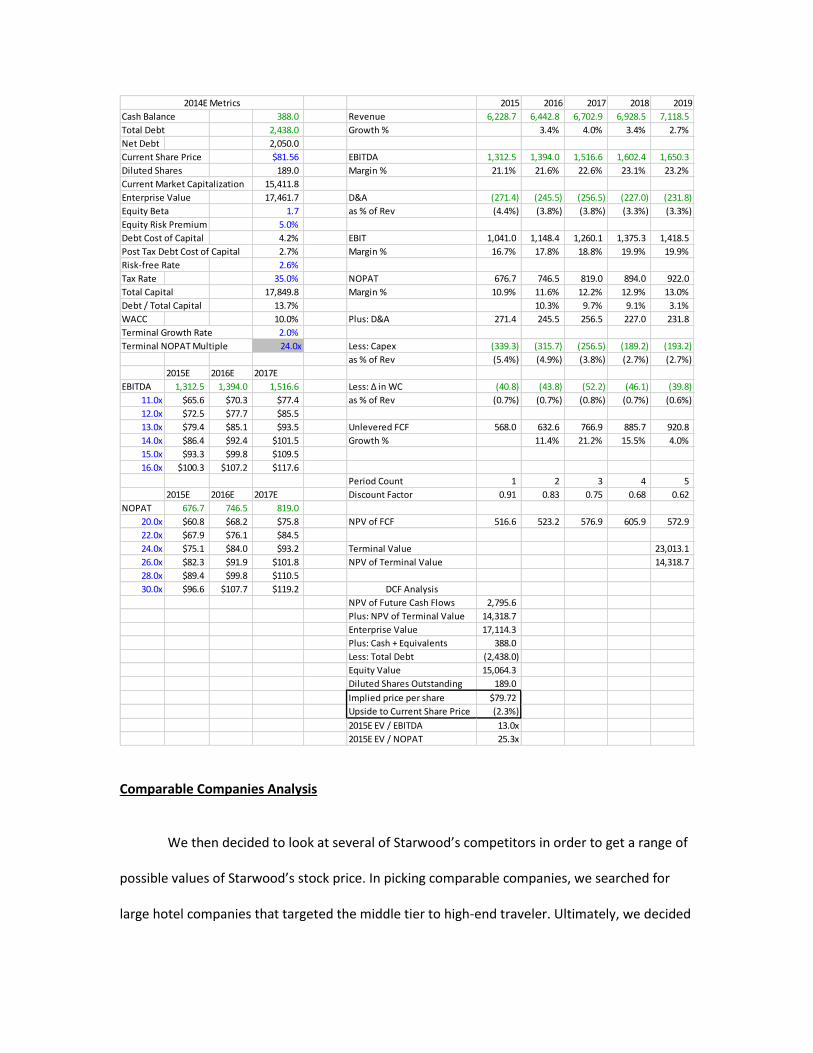
VALUATION ANALYSIS
Discounted Cash Flow Analysis
We performed a bottom-up modelling exercise to find the Net Present Value of HOT’s
future stream of cashflows to determine an appropriate share price target for the firm. The
detailed Discounted Cash Flow analysis derived an Enterprise Value of $17,157m; adding $388m
of cash and deducting $2,438m of debt provides and Equity Value of $15,107m. With 189m
shares outstanding, this implies a share price valuation of $79.95 per share, or a marginal ~2%
downside to the current share price of $81.56.
Below is a breakdown of our summary output for the detailed DCF model:
Comparable Companies Analysis
We then decided to look at several of Starwood’s competitors in order to get a range of
possible values of Starwood’s stock price. In picking comparable companies, we searched for
large hotel companies that targeted the middle tier to high-end traveler. Ultimately, we decided
2014E Metrics 2015 2016 2017 2018 2019
Cash Balance 388.0 Revenue 6,228.7 6,442.8 6,702.9 6,928.5 7,118.5
Total Debt 2,438.0 Growth % 3.4% 4.0% 3.4% 2.7%
Net Debt 2,050.0
Current Share Price $81.56 EBITDA 1,312.5 1,394.0 1,516.6 1,602.4 1,650.3
Diluted Shares 189.0 Margin % 21.1% 21.6% 22.6% 23.1% 23.2%
Current Market Capitalization 15,411.8
Enterprise Value 17,461.7 D&A (271.4) (245.5) (256.5) (227.0) (231.8)
Equity Beta 1.7 as % of Rev (4.4%) (3.8%) (3.8%) (3.3%) (3.3%)
Equity Risk Premium 5.0%
Debt Cost of Capital 4.2% EBIT 1,041.0 1,148.4 1,260.1 1,375.3 1,418.5
Post Tax Debt Cost of Capital 2.7% Margin % 16.7% 17.8% 18.8% 19.9% 19.9%
Risk-free Rate 2.6%
Tax Rate 35.0% NOPAT 676.7 746.5 819.0 894.0 922.0
Total Capital 17,849.8 Margin % 10.9% 11.6% 12.2% 12.9% 13.0%
Debt / Total Capital 13.7% 10.3% 9.7% 9.1% 3.1%
WACC 10.0% Plus: D&A 271.4 245.5 256.5 227.0 231.8
Terminal Growth Rate 2.0%
Terminal NOPAT Multiple 24.0x Less: Capex (339.3) (315.7) (256.5) (189.2) (193.2)
as % of Rev (5.4%) (4.9%) (3.8%) (2.7%) (2.7%)
2015E 2016E 2017E
EBITDA 1,312.5 1,394.0 1,516.6 Less: ∆ in WC (40.8) (43.8) (52.2) (46.1) (39.8)
11.0x $65.6 $70.3 $77.4 as % of Rev (0.7%) (0.7%) (0.8%) (0.7%) (0.6%)
12.0x $72.5 $77.7 $85.5
13.0x $79.4 $85.1 $93.5 Unlevered FCF 568.0 632.6 766.9 885.7 920.8
14.0x $86.4 $92.4 $101.5 Growth % 11.4% 21.2% 15.5% 4.0%
15.0x $93.3 $99.8 $109.5
16.0x $100.3 $107.2 $117.6
Period Count 1 2 3 4 5
2015E 2016E 2017E Discount Factor 0.91 0.83 0.75 0.68 0.62
NOPAT 676.7 746.5 819.0
20.0x $60.8 $68.2 $75.8 NPV of FCF 516.6 523.2 576.9 605.9 572.9
22.0x $67.9 $76.1 $84.5
24.0x $75.1 $84.0 $93.2 Terminal Value 23,013.1
26.0x $82.3 $91.9 $101.8 NPV of Terminal Value 14,318.7
28.0x $89.4 $99.8 $110.5
30.0x $96.6 $107.7 $119.2 DCF Analysis
NPV of Future Cash Flows 2,795.6
Plus: NPV of Terminal Value 14,318.7
Enterprise Value 17,114.3
Plus: Cash + Equivalents 388.0
Less: Total Debt (2,438.0)
Equity Value 15,064.3
Diluted Shares Outstanding 189.0
Implied price per share $79.72
Upside to Current Share Price (2.3%)
2015E EV / EBITDA 13.0x
2015E EV / NOPAT 25.3x

to use five companies for our analysis: Marriot International, Hyatt Hotels, Hilton, Wyndham,
and Intercontinental. These companies generated revenues ranging from $9.9 billion to $36.9
billion. Additionally, all of these companies operate several brand name hotels, most of which
target high-end travelers.
We then looked at several multiples in order to get an idea of the possible range of
values at which the market could conceivably value Starwood’s stock:
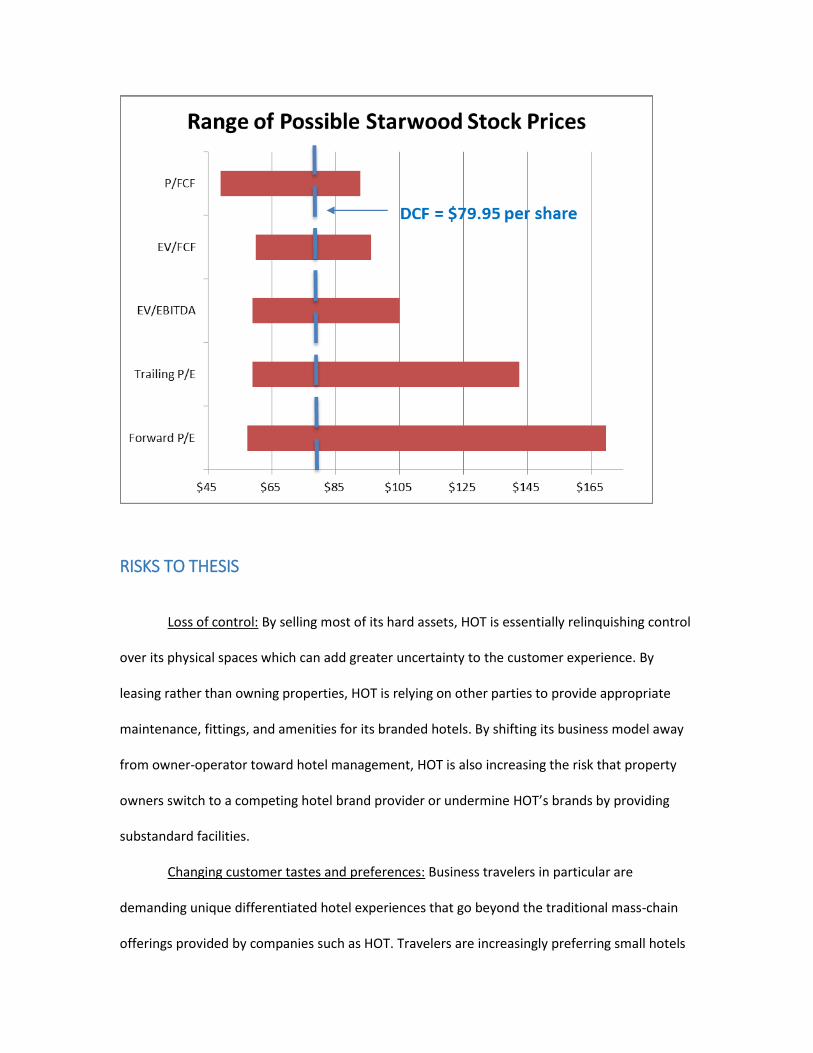
Enterprise Value to EBITDA: Perhaps the most commonly referenced multiple for
valuation purposes, this multiple is preferred by many analysts and observers because it is
normalized for differences between companies such as capital structure, taxes, and accounting
techniques. Using each of the comparable companies’ most recently reported enterprise value
and EBITDA from the previous 12 months, these companies reported multiples ranging from
12.08 to 20.04. Using this range of multiples and Starwood’s EBITDA from the last 12 months,
Starwood’s stock price ranges from $59 to $105. Starwood’s current EV/EBITDA ratio is 15.22,
putting it in the middle of the range of comparable companies.
Enterprise Value to Unlevered Free Cash Flow: The five comparable companies reported
multiples ranging from 18.81 to 28.45. Using this range of multiples and Starwood’s unlevered
free cash flow from the last 12 months, Starwood’s stock price ranges from $60 to $96.
Starwood’s current EV/FCF ratio is 23.36, putting it right near the average of the comparable
companies, which was 23.
Price to Unlevered Free Cash Flow per Share: The five comparable companies reported
multiples ranging from 13.04 to 24.66. Using this range of multiples and Starwood’s unlevered
free cash flow per share from the last 12 months, Starwood’s stock price ranges from $49 to
$93. Starwood’s P/FCF ratio is 20.63, putting it above the average of its competitors.
Forward Price to Earnings Ratio: The five comparable companies reported multiples
ranging from 16.85 to 49.86. Using this range of multiples and our estimate of Starwood’s 2015
net income, Starwood’s stock price ranges from $57 to $170. Starwood’s forward P/E ratio is
25.57, putting it below the average of its competitors.
Trailing Price to Earnings Ratio: The five comparable companies reported multiples
ranging from 19.60 to 47.30. Using this range of multiples and our estimate of Starwood’s 2014
net income, Starwood’s stock price ranges from $59 to $142. Starwood’s trailing P/E ratio is
28.3, putting it significantly below the average of its competitors.
Takeaway: Based on our analysis of several of Starwood’s competitors, we believe that
the market’s current value of Starwood’s stock is fair, as Starwood’s metrics and ratios are not
outliers in the hotel industry. Starwood’s current stock price of $77.58 falls near the middle of
the range of possible values derived from its DCF analysis, EV/EBITDA, EV/FCF, and P/FCF ratios.
RISKS TO THESIS
Loss of control: By selling most of its hard assets, HOT is essentially relinquishing control
over its physical spaces which can add greater uncertainty to the customer experience. By
leasing rather than owning properties, HOT is relying on other parties to provide appropriate
maintenance, fittings, and amenities for its branded hotels. By shifting its business model away
from owner-operator toward hotel management, HOT is also increasing the risk that property
owners switch to a competing hotel brand provider or undermine HOT’s brands by providing
substandard facilities.
Changing customer tastes and preferences: Business travelers in particular are
demanding unique differentiated hotel experiences that go beyond the traditional mass-chain
offerings provided by companies such as HOT. Travelers are increasingly preferring small hotels
with personal service and ‘a sense of place’1 that HOT’s large branded hotels are unable to
provide. A shift in customer preferences away from chain hotels poses a significant threat to
HOT’s revenue streams from products such as the Westin and Sheraton brands. Large hoteliers
are mitigating this risk by owning and operating their own ‘boutique’ hotels, although this
makes it harder for these companies to extract marketing and sales synergies across their
brands.
Political risks: While the Chinese market is certainly attractive from a growth outlook
point of view, there are a number of risks associated with operating in a market with opaque
legal structures and uncertain rule of law. HOT’s strategy to target the Chinese segment could
create significant value from new earnings streams, there nevertheless remains the possibility
that Chinese authorities could interfere with HOT’s operations or expropriate its assets.
Macro risks: As described above, the hotels business is highly cyclical and is particularly
sensitive to cuts in discretionary spending by businesses and travelers. With the global economic
outlook still uncertain, our forecasts for revenue growth and margin expansion
Brand dilution: HOT manages and markets a number of adjacent and competing hotel
brands that essentially operate in the same segment and compete for similar customers. It is
necessary to market different brands due to the competitive and fragmented nature of the
hotels business – clients are increasingly looking for brand differentiation and unique
experiences. This means that Starwood must promote and market a number of separate brands
in order to cater to the tastes and preferences of a range of customers. Hence there are risks
around customer cannibalization and brand dilution.
1 http://www.nytimes.com/2014/06/03/business/boutique-inns-chain-hotels-and-the-business-traveler.html?_r=0