standardizing key clinical processes across several hospitals using it as an enabler
TRANSCRIPT
Clinical Process Design
Standardizing Key Clinical Processes Across Several Hospitals Using IT as an Enabler
Imran Chaudhry, Regional Director Operational Excellence and Project Management OfficesProvidence Health & Services – California
Objective
• What is Clinical Process Design (CPD)• Why it is important• Innovative approach• Using CAMIS as an enabler• Redesign and standardization• Key Clinical Processes• Implementation• Lessons learned

What is Clinical Process Design?ObjectiveThe objective of Clinical Process Design (CPD) is to standardize key clinical processes related to patient handoffs, clinical communication, and medication management across the region. These processes will be redesigned using the new California Advanced Medical Information System (CAMIS) as an enabler rather than having the system dictate work flows.

Why CPD?• PHSCA is committed to a uniform,
“single instance” build of California Advanced Medical Information System (CAMIS)
• Most clinical information system installations do not place a heavy emphasis on antecedent process analysis and optimization
• CPD was created to redesign and standardize key clinical processesthat result in significant improvements in patient safety and clinical quality as a prerequisite to implementing CAMIS
Clinical information systems are an enabling technology for the processes involved in the delivery of patient care.
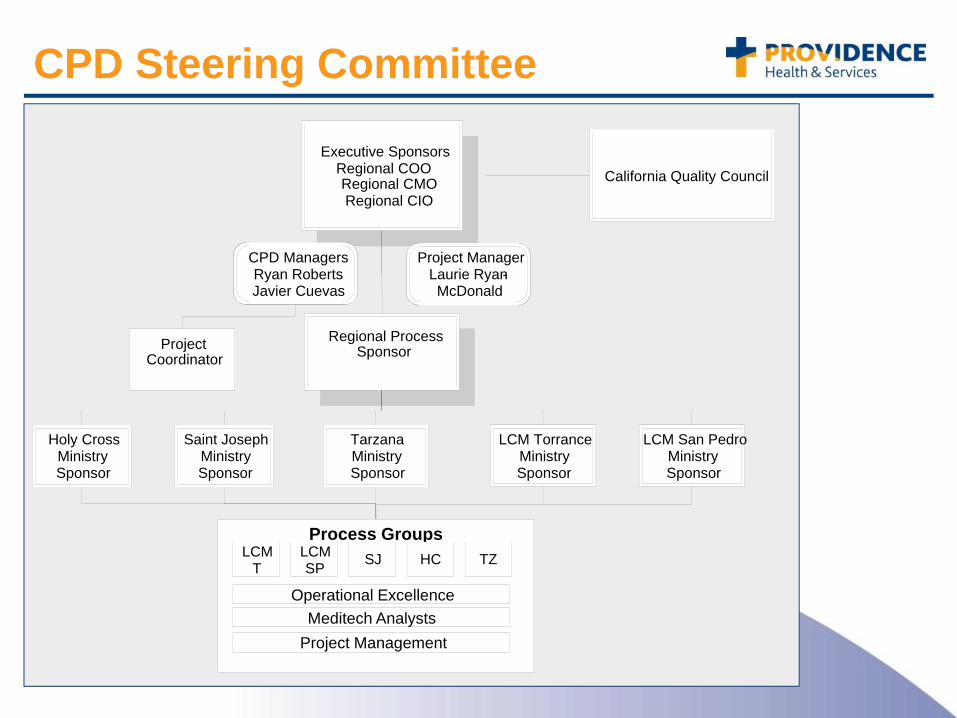
CPD Steering Committee
Executive SponsorsRegional COORegional CMORegional CIO
Process GroupsLCM
TLCMSP SJ HC TZ
Operational ExcellenceMeditech Analysts
Project Management
California Quality Council
Regional ProcessSponsor
TarzanaMinistry Sponsor
LCM TorranceMinistry Sponsor
Saint JosephMinistry Sponsor
LCM San PedroMinistry Sponsor
Holy CrossMinistry Sponsor
Project Coordinator
CPD ManagersRyan Roberts Javier Cuevas
Project ManagerLaurie Ryan-McDonald
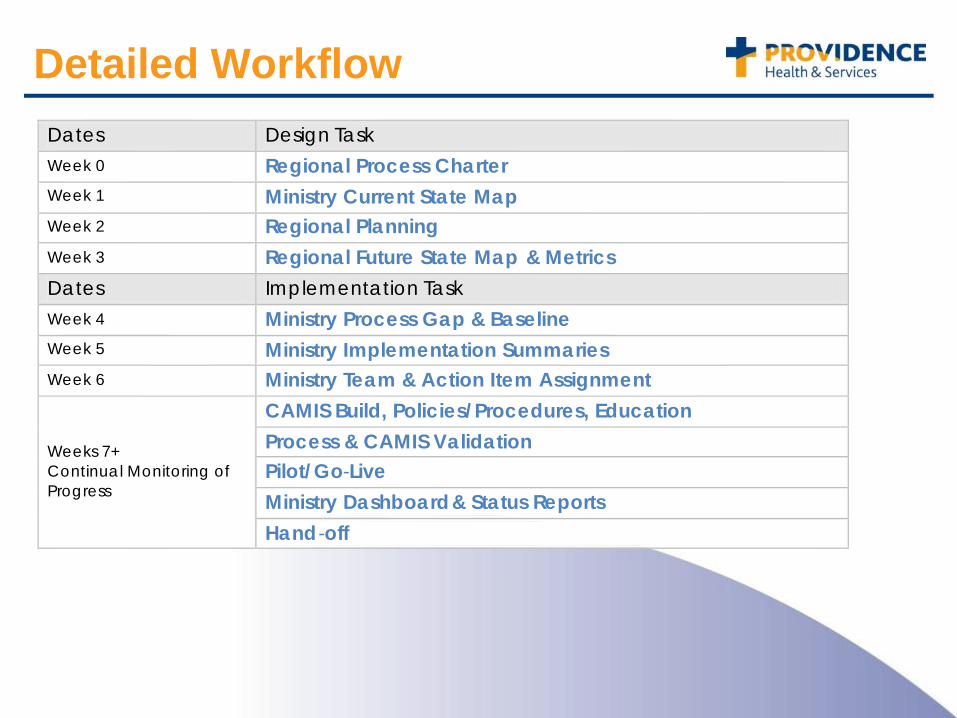
Detailed WorkflowDates Design TaskWeek 0 Regional Process CharterWeek 1 Ministry Current State MapWeek 2 Regional PlanningWeek 3 Regional Future State Map & MetricsDates Implementation TaskWeek 4 Ministry Process Gap & BaselineWeek 5 Ministry Implementation SummariesWeek 6 Ministry Team & Action Item Assignment
Weeks 7+ Continual Monitoring of Progress
CAMIS Build, Policies/Procedures, EducationProcess & CAMIS ValidationPilot/Go-LiveMinistry Dashboard& Status ReportsHand-off

How does CPD work?Planning
CharterTeam members
MappingCurrent StateRegional Future State
SummaryImplement SummaryGap Analysis
CAMIS BuildImplement
CAMIS & Non-CAMIS educationMetric Analysis
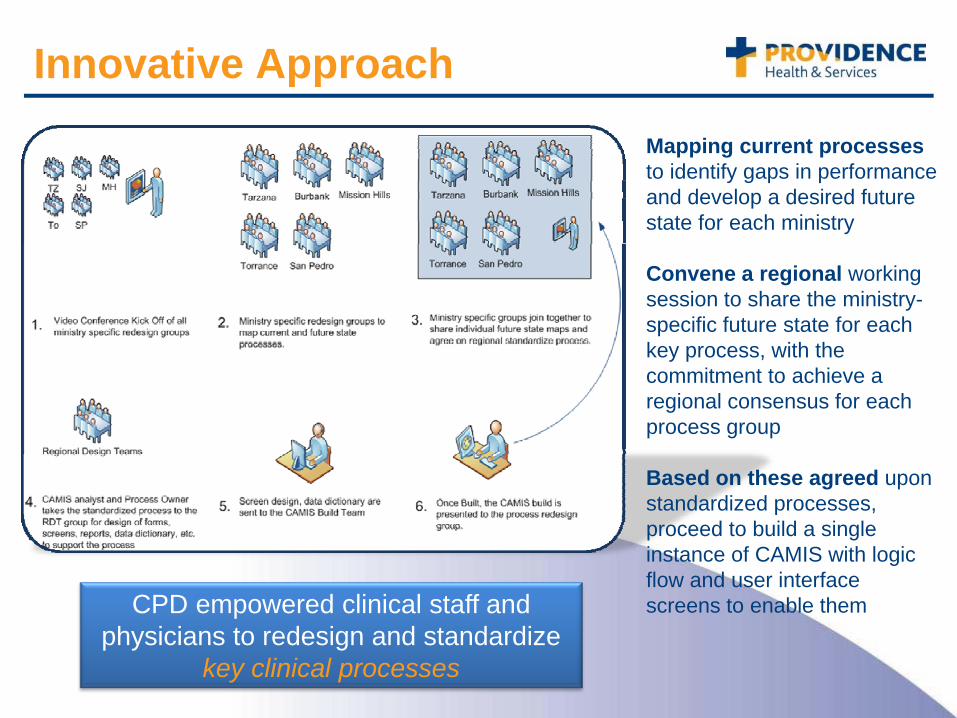
Mapping current processes to identify gaps in performance and develop a desired future state for each ministry
Convene a regional working session to share the ministry-specific future state for each key process, with the commitment to achieve a regional consensus for each process group
Based on these agreed upon standardized processes, proceed to build a single instance of CAMIS with logic flow and user interface screens to enable them
Innovative Approach
CPD empowered clinical staff and physicians to redesign and standardize
key clinical processes

Where was CPD applied?The Providence Quality Strategic Plan calls for the following:1. Cultivating a safe environment that promotes personal accountability that
eliminates preventable injuries and deaths2. Identify target areas for measuring and reducing harm3. Support the development and implementation of safe medication
practicesThese items are directly related to the Continuum of Care:
The focus of CPD is on the redesign and standardization of the patient’s Continuum of Care
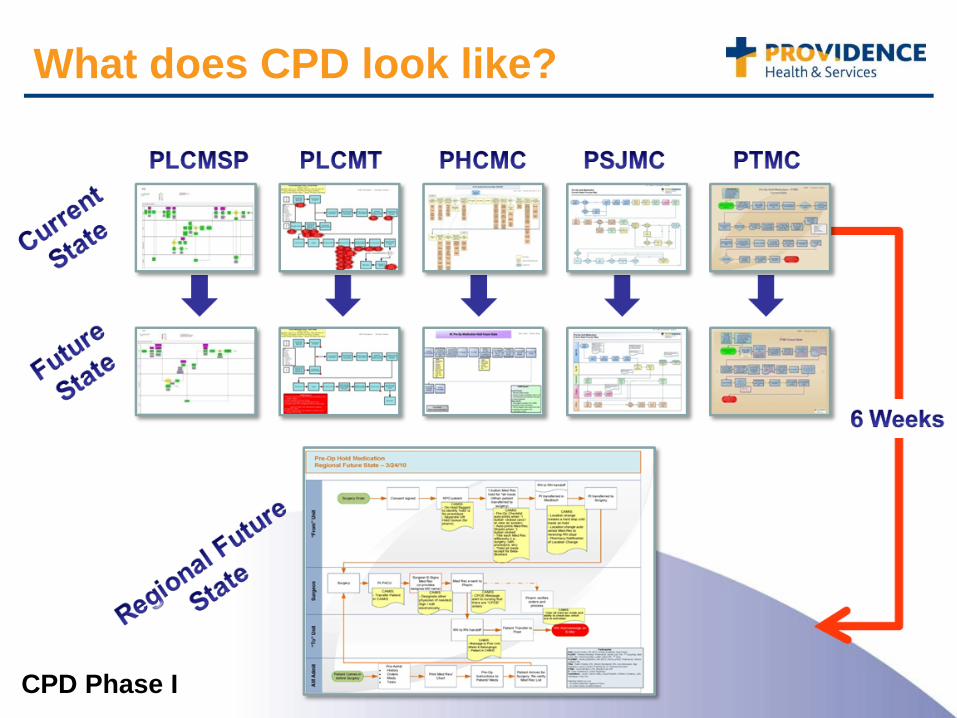
What does CPD look like?
CPD Phase I
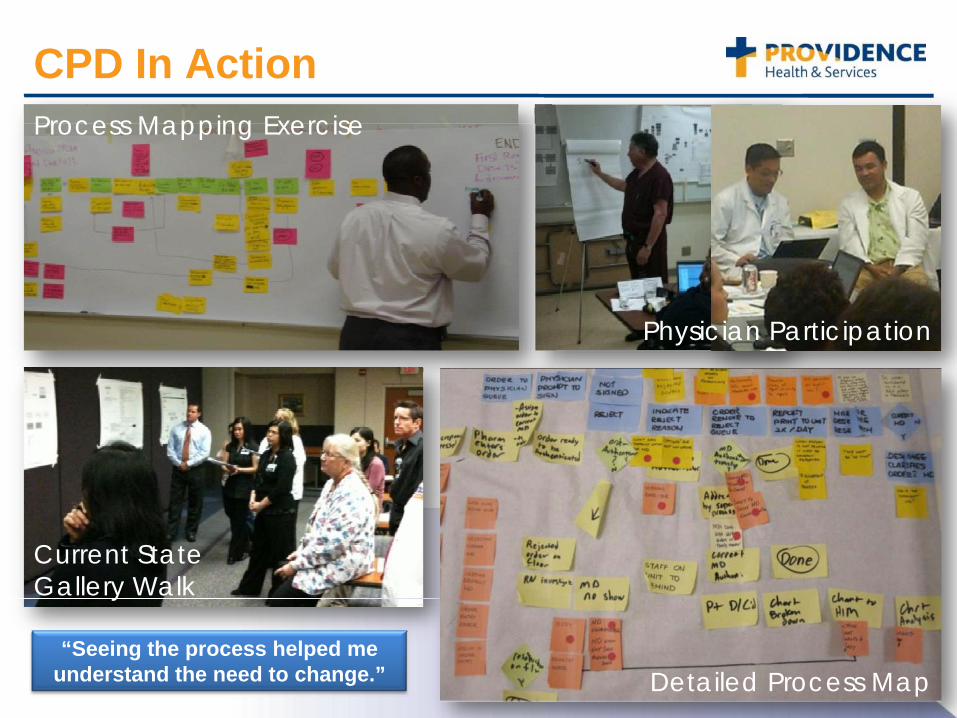
CPD In Action
Current State Gallery Walk
Physician Participation
Process Mapping Exercise
Detailed Process Map“Seeing the process helped me
understand the need to change.”
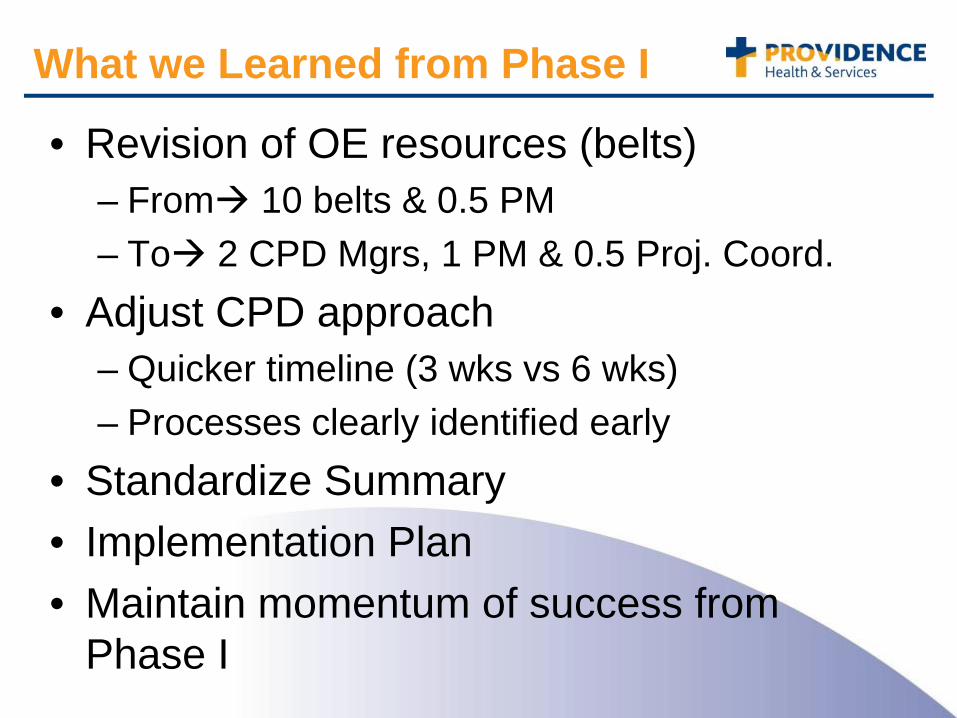
What we Learned from Phase I
• Revision of OE resources (belts)– From 10 belts & 0.5 PM– To 2 CPD Mgrs, 1 PM & 0.5 Proj. Coord.
• Adjust CPD approach– Quicker timeline (3 wks vs 6 wks)– Processes clearly identified early
• Standardize Summary• Implementation Plan• Maintain momentum of success from
Phase I
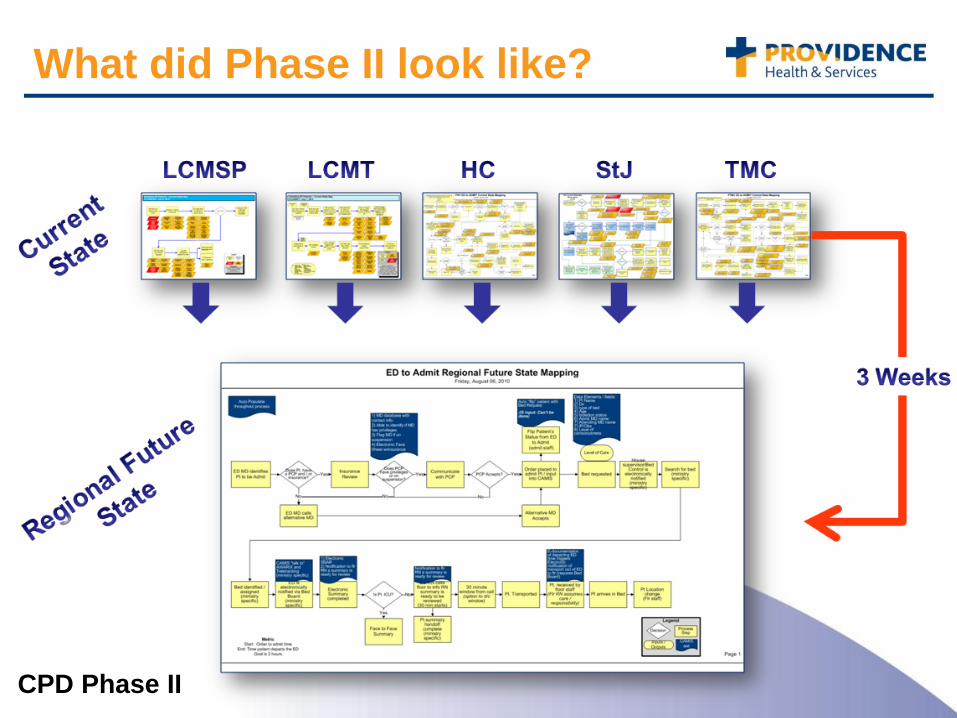
What did Phase II look like?
CPD Phase II
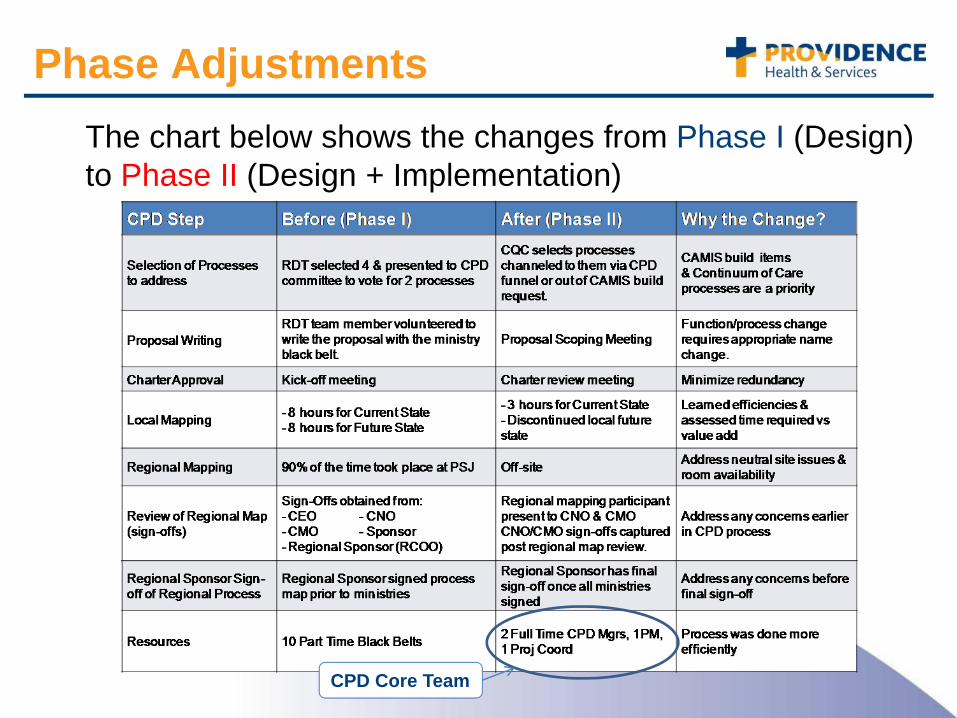
Phase AdjustmentsThe chart below shows the changes from Phase I (Design) to Phase II (Design + Implementation)
CPD Core Team
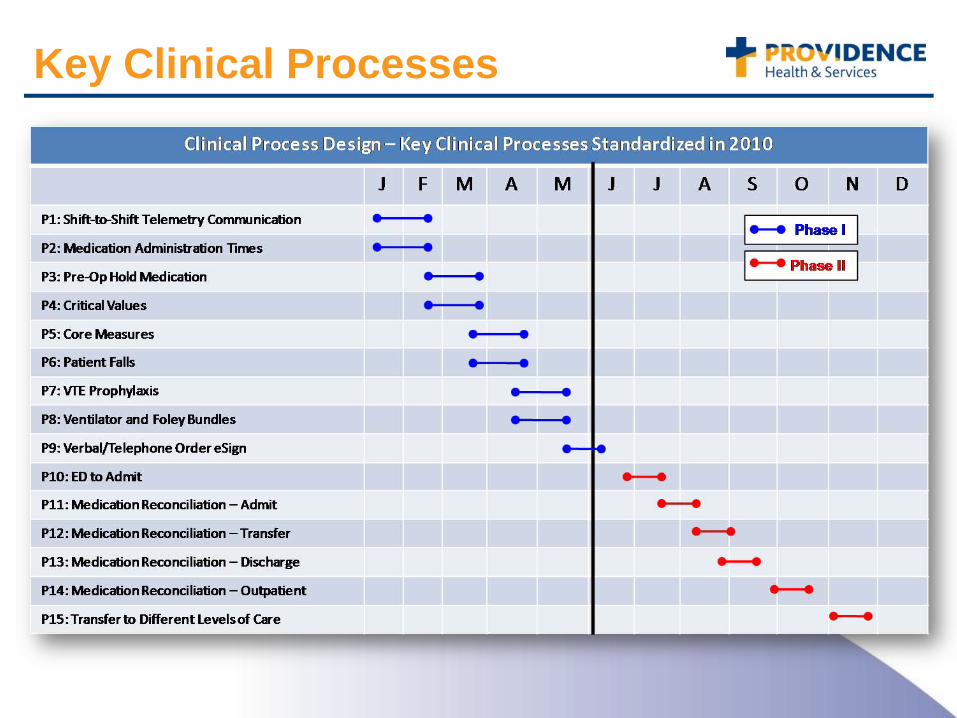
Key Clinical Processes
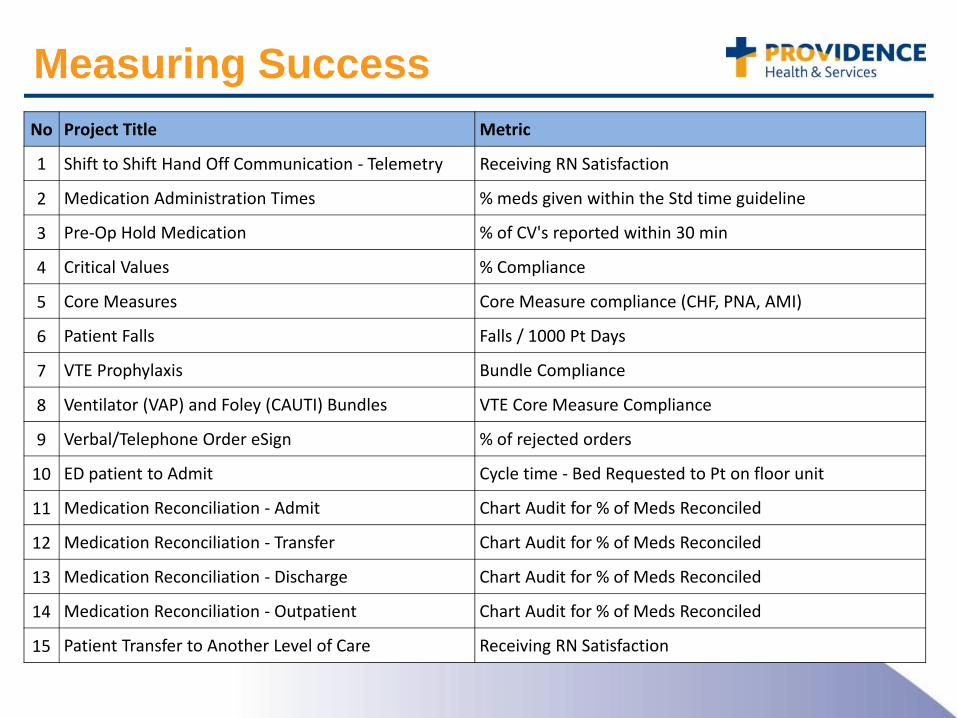
Measuring SuccessNo Project Title Metric
1 Shift to Shift Hand Off Communication ‐ Telemetry Receiving RN Satisfaction
2 Medication Administration Times % meds given within the Std time guideline
3 Pre‐Op Hold Medication % of CV's reported within 30 min
4 Critical Values % Compliance
5 Core Measures Core Measure compliance (CHF, PNA, AMI)
6 Patient Falls Falls / 1000 Pt Days
7 VTE Prophylaxis Bundle Compliance
8 Ventilator (VAP) and Foley (CAUTI) Bundles VTE Core Measure Compliance
9 Verbal/Telephone Order eSign % of rejected orders
10 ED patient to Admit Cycle time ‐ Bed Requested to Pt on floor unit
11 Medication Reconciliation ‐ Admit Chart Audit for % of Meds Reconciled
12 Medication Reconciliation ‐ Transfer Chart Audit for % of Meds Reconciled
13 Medication Reconciliation ‐ Discharge Chart Audit for % of Meds Reconciled
14 Medication Reconciliation ‐ Outpatient Chart Audit for % of Meds Reconciled
15 Patient Transfer to Another Level of Care Receiving RN Satisfaction

CAMIS dependent items are educated with CAMIS rollout
Non-CAMIS dependent items are educated through
Education Department
Implementation

Implementation Process
Compare
• Ministry Current State Workflow to Regional Future State Workflow
Determine
• What parts are CAMIS related? Do we implement now, or wait for our CAMIS go-live?
List
• What action items are needed to move ministry from current state to regional future state?
Gap Analysis and Summaries
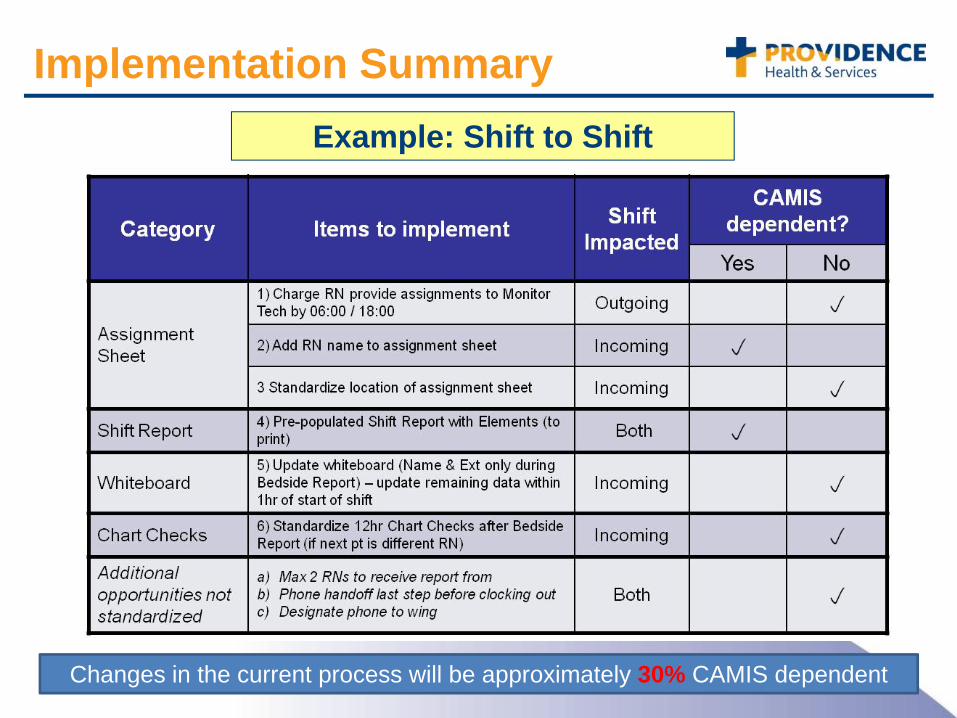
Changes in the current process will be approximately 30% CAMIS dependent
Implementation SummaryExample: Shift to Shift
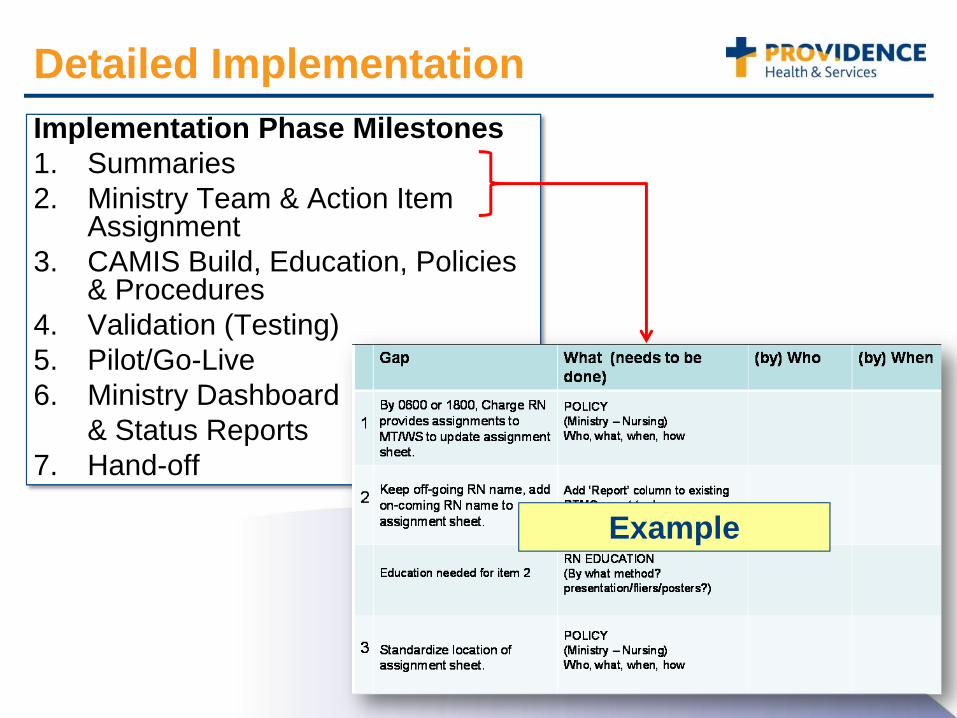
Detailed ImplementationImplementation Phase Milestones1. Summaries 2. Ministry Team & Action Item
Assignment 3. CAMIS Build, Education, Policies
& Procedures 4. Validation (Testing)5. Pilot/Go-Live 6. Ministry Dashboard
& Status Reports 7. Hand-off
Example
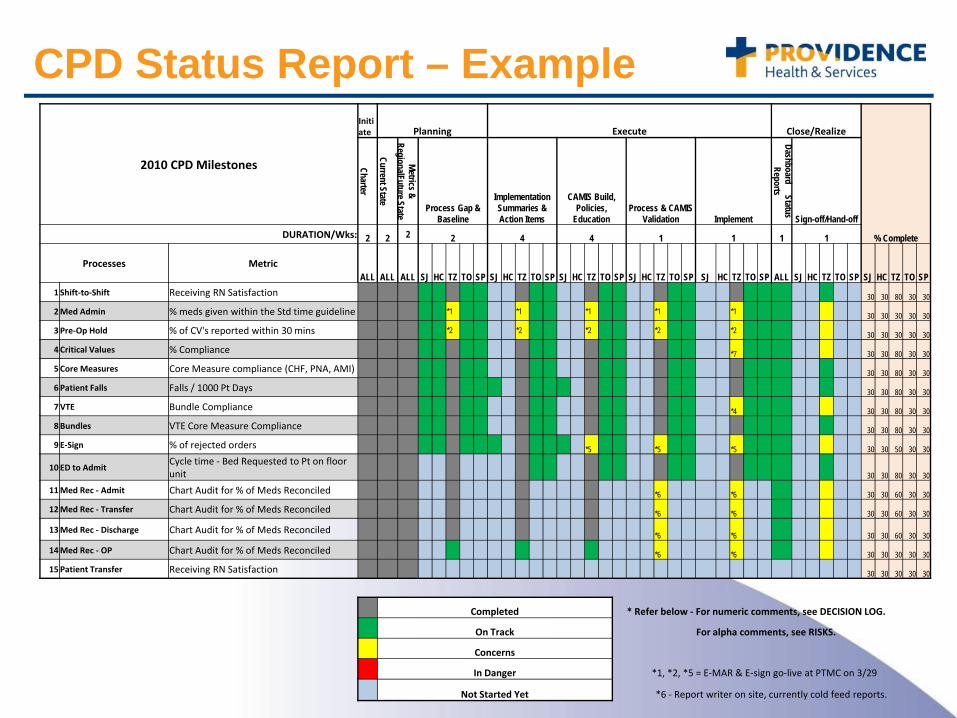
CPD Status Report – Example
2010 CPD Milestones
Initiate Planning Execute Close/Realize
% Complete
Charter
Current State
Metrics & RegionalFuture State
Process Gap & Baseline
Implementation Summaries & Action Items
CAMIS Build, Policies,
EducationProcess & CAMIS
Validation
Implement
Dashboard Status Reports
Sign-off/Hand-offDURATION/Wks: 2 2 2 2 4 4 1 1 1 1
Processes MetricALL ALL ALL SJ HC TZ TO SP SJ HC TZ TO SP SJ HC TZ TO SP SJ HC TZ TO SP SJ HC TZ TO SP ALL SJ HC TZ TO SP SJ HC TZ TO SP
1 Shift‐to‐Shift Receiving RN Satisfaction 30 30 80 30 30
2Med Admin % meds given within the Std time guideline *1 *1 *1 *1 *1 30 30 30 30 30
3Pre‐Op Hold % of CV's reported within 30 mins *2 *2 *2 *2 *2 30 30 30 30 30
4Critical Values % Compliance *7 30 30 80 30 30
5Core Measures Core Measure compliance (CHF, PNA, AMI) 30 30 80 30 30
6Patient Falls Falls / 1000 Pt Days 30 30 80 30 30
7VTE Bundle Compliance *4 30 30 80 30 30
8Bundles VTE Core Measure Compliance 30 30 80 30 30
9 E‐Sign % of rejected orders *5 *5 *5 30 30 50 30 30
10 ED to AdmitCycle time ‐ Bed Requested to Pt on floor unit 30 30 80 30 30
11Med Rec ‐ Admit Chart Audit for % of Meds Reconciled *6 *6 30 30 60 30 30
12Med Rec ‐ Transfer Chart Audit for % of Meds Reconciled *6 *6 30 30 60 30 30
13Med Rec ‐ Discharge Chart Audit for % of Meds Reconciled *6 *6 30 30 60 30 30
14Med Rec ‐ OP Chart Audit for % of Meds Reconciled *6 *6 30 30 30 30 30
15Patient Transfer Receiving RN Satisfaction 30 30 30 30 30
Completed * Refer below ‐ For numeric comments, see DECISION LOG.
On Track For alpha comments, see RISKS.
Concerns
In Danger *1, *2, *5 = E‐MAR & E‐sign go‐live at PTMC on 3/29
Not Started Yet *6 ‐ Report writer on site, currently cold feed reports.
Lessons Learned• Empowering the front line staff• Having a charter to ensure the success of the initiative• Scope needs to be tight and clearly defined• Upfront buy in from senior leadership• Communication, Communication, Communication!!• Revisit the process and make changes necessary to
make it even more efficient • Repeat participants were advantageous• Important to get the right people in the room, not just
those available• Knowing ‘collision’ areas in advance of regional
mappings allowed opportunity to mitigate risks• Mapping as a group produces best outcomes• On going relationship with IS around process build
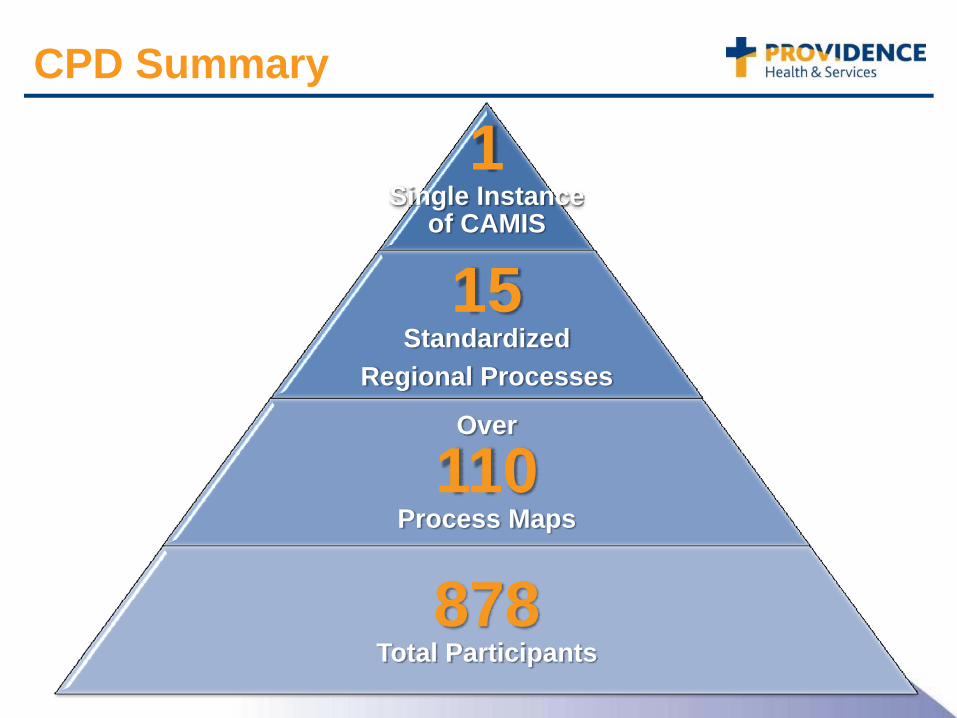
CPD Summary
1Single Instance
of CAMIS
15Standardized
Regional Processes
Over
110Process Maps
878 Total Participants