standard operation procedures for ozone ozone sop 2015.pdfstandard operation procedures for ozone ....
TRANSCRIPT
Standard Operation Procedures
for Ozone
In Use By
Polk County Air Quality Ambient Air Monitoring Personnel
For Calendar Year 2015
Revised: February 26, 2015
Section: 1 Revision: 16
PREPARED BY _________________________________________ ______ Polk County Air Quality Air Pollution Monitoring Specialist Date SIGNATURES/APPROVALS _________________________________________ ______ Polk County Air Quality Assurance Officer Date
Section 1: Ozone Revised: February 26, 2015
Revision Number: 16 POLK COUNTY AIR QUALITY DIVISION STANDARD OPERATING PROCEDURE MANUAL FOR THERMO ENVIRONMENTAL (49i) OZONE ( 3O ) MONITORING
Table of Contents Page # 1.1. Purpose………………………………………………………………………………………………………… 3 1.2. Scope…………………………………………………………………………………………………………… 3 1.3. References……………………………………………………………………………………………………… 3 1.4. Introduction ………………………………………………………………………………………………….. 3 1.5. Sampler Setup …………………………………………………………………………………………………. 4
1.5.1 Site Selection……………………………………………………………………………………….. 4 1.5.1.1 The Monitoring Station………………………………………………………………………. 5 1.5.1.2 Probe Placement………………………………………………………………………………. 5
1.5.2 Inspecting New Equipment……………………………………………………………………….. 5 1.5.3 Equipment Installation……………………………………………………………………………. 6 1.5.4 Programming Equipment…………………………………………………………………………. 6 1.5.4.1 Range and Units………………………………………………………………………….. 6 1.5.4.2 Averaging Time………………………………………………………………………….. 7 1.5.4.3 Temperature Compensation…………………………………………………………….. 7 1.5.4.4 Pressure Compensation………………………………………………………………….. 7 1.5.4.5 Baud Rate…………………………………………………………………………………. 7 1.5.4.6 Clock Set………………………………………………………………………………….. 8
1.6. Standards………………………………………………………………………………………………………. 8 1.6.1 Local Primary Standards ………………………………………………………………………… 8
1.6.2 Transfer Standards ……………………………………………………………………………….. 10 1.6.3 Audit Standards…………………………………………………………………………………… 10
1.7 Qualification, Certification and Recertification ……………………………………………………………. 11 1.8 Calibrations……………………………………………………………………………………………………. 13 1.9 Quality Control ……………………………………………………………………………………………….. 14
1.9.1 Station Inspection …………………………………………………………………………………. 14 1.9.2 Station Log Book ………………………………………………………………………………….. 14 1.9.3 Bi-Weekly Zero, Precision and Span Checks……………………………………………………. 15 1.9.4 Data Quality Objectives …………………………………………………………………………… 16 1.9.5 Data Acquisition and Telemetry………………………………………………………………….. 16
1.10 Equipment, Maintenance and Trouble Isolation…………………………………………………………….. 17 1.10.1 Preventative Maintenance ……………………………………..…………………………………. 17
1.10.1.1 Replace Ozone Scrubber………………………………………………………………… 17 1.10.1.2 Sample Frequency Adjustment…………………………………………………………. 17 1.10.1.3 Automatic Temperature and Pressure Compensation….…………………………….. 17 1.10.1.4 Analyzer Leak Check……………………………………………………………………. 17 1.10.1.5 Sample Line Leak Check………………………………………………………………… 18 1.10.1.6 Pressure Check (psi) Flow Rate…………………………………………………………. 18 1.10.1.7 Solenoid Leak Check ……………………………………………………………………. 18 1.10.1.8 Particulate Filter Changes ………………………………………………………………. 18 1.10.1.9 Replacing the Sample Lines …………………………………………………………….. 19
1.10.2 Trouble Isolation…………………………………………………………………………………… 19 1.10.3 Environmental Control for Monitoring Equipment…………………………………………….. 19
1.11 Quality Assurance (Accuracy Audits)………………………………………………………………………… 19 1.11.1 Direct Comparison Audits………………………………………………………………………… 19 1.11.2 Audit Sequence…………………………………………………………………………………….. 20 1.11.3 Performance Evaluation Audit……………………………………………………………………. 21
1.12 Data Quality Assessment ……………………………………………………………………………………… 21 1.12.1 Precision ……………………………………………………………………………………………. 21 1.12.2 Accuracy ……………………………………………………………………………………………. 21 1.12.3 Data Completeness ………………………………………………………………………………… 21
1.13 Procedures for Bi-Weekly Checks……………………………………………………………………………. 22 1.13.1 Maintenance Mode for Agilaire Data Loggers….……………………………………………….. 22 1.13.2 Remote Mode………………………………………………………………………………………. 23 1.13.3 Maintenance and Diagnostics Check…………………………………………………………….. 23
1

Section 1: Ozone Revised: February 26, 2015
Revision Number: 16 1.13.4 Zero, Precision and Span Checks ……………………………………………………………….. 23
1.13.4.1 Span Check ……………………………………………………………………………….. 23 1.13.4.2 Precision Check ………………………………………………………………………….. 24 1.13.4.3 Zero Air Check…………………………………………………………………………… 24 1.13.4.4 Invalidate Data and Recalibrate…………………………………………………………. 25
1.14 Automated Zero/Precision/Span Checks…………………………………………………………………… 25 1.14.1 Solenoid System…………………………………………………………………………………….. 26 1.14.2 Calibration Program in the 49i Transfer Standard…………………………………………….. 27 1.14.2.1 Next Time………………………………………………………………………………….. 28 1.14.2.2 Period Hours……………………………………………………………………………….28 1.14.2.3 Zero/Precision/Span Duration…………………………………………………………… 28 1.14.2.4 Zero/Span Averaging Time………………………………………………………………. 28 1.14.3 Relay Outputs………………………………………………………………………………………. 29 1.14.4 Calibration Program in AirVision……..………………………………………………………….. 29 1.14.4.1 Configuring Automatic Calibration for Model 8832 Data Loggers…………………… 29 1.14.4.2 Configuring Calibration Phases…………………………………………………………. 32 FIGURES Figure 1-1: Typical Calibration Setup of an Ozone Transfer/Audit Standard………………………………….. 10 Figure 1-2: Typical Setup of a Direct Comparison Audit…………………………………………………………. 21 Figure 1-3: Thermo Scientific 49i Analyzer ……………………………………………………………………….. 22 Figure 1-4: Diagram of Flow Through the Solenoid System During Ambient Air Sampling………………….. 27 Figure 1-5: Diagram of Flow Through the Solenoid System During Automated Checks………………………. 27 Figure 1-6: Data Source Details Screen..………………………………………………………………………….. 29 Figure 1-7: Selecting the Data Logger……………………………………………………………………………… 30 Figure 1-8: Adding an Instrument Controlled Calibration.……………………………………………………… 30 Figure 1-9: Sequence Editor Screen………………………………………………………………………………... 31 Figure 1-10: Phase Editor Screen……………………………………………………………………………………. 32 Figure 1-11: Input Control Screen, Programmed for the Zero Phase…………………………………………….. 33 TABLES Table 1-1: Measurement Quality Objectives…………………………………………………………………………34 Appendix A-Forms and Field Sheets………………………………………………………………………………… 37 Appendix B-Instructions for Using the Annual Ozone Primary Standard Correction Spreadsheet…………… 47 Appendix C-Instructions for Using 1x6 Averages Worksheet for Certification of Ozone Transfer Standards… 50
2

Section 1: Ozone Revised: February 26, 2015
Revision Number: 16 1.0 STANDARD OPERATING PROCEDURE FOR OZONE ( 3O ) MONITORING 1.1 Purpose To establish a standard operating procedure (SOP) manual for the Polk County Air Quality Division personnel concerning the setup, operation, bi-weekly zero, precision and span checks, calibrations, audits and maintenance of ozone monitors maintained and operated by Polk County staff. This SOP is intended for individuals responsible for collecting ambient air monitoring data supported by the Polk County Air Quality Division. The U.S. Environmental Protection Agency (EPA) has determined ground level ozone is a health and environmental concern. For this reason, National Ambient Air Quality Standards (NAAQS) have been established for ozone. As a result, an air monitoring network to monitor for ground level ozone was established in the Des Moines Metropolitan Statistical Area (MSA) and is maintained by Polk County Air Quality Division, Iowa.
1.2 Scope These procedures are to be used by Polk County Air Quality Division personnel. The objective of this SOP is to familiarize the station operator with procedures used in the collection of air monitoring data. The accuracy of data obtained from any instrument depends upon the instrument's performance and the operator's skill. It is important that the station operator become familiar with both this manual as well as the manufacturer's instruction manual in order to achieve a high level of data quality. This SOP is to be used as an outline and is not intended to replace the equipment manufacturer’s manual or procedures. This SOP describes the proper procedures for the setup, operation, bi-weekly zero, precision and span checks, calibrations, audits and maintenance of ozone equipment operated by Polk County Air Quality personnel. 1.3 References
1.3.1 Model 49i, UV Photometric Ozone Analyzer, Instruction Manual. Part Number 102434-00,
November 30, 2006. 1.3.2 EPA‐454/B‐13‐004-Technical Assistance Document, October, 2013. Transfer Standards for
the Calibration of Ambient Air Monitoring Analyzers for Ozone. 1.3.3 EPA-600/4-79-057, September 1979. Technical Assistance Document for the Calibration of
Ambient Ozone Monitors. 1.3.4 EPA-454/B-13-003, May, 2013. Quality Assurance Handbook for Air Pollution
Measurement Systems, Volume II, Ambient Air Quality monitoring Program. 1.3.5 40 Code of Federal Regulations (CFR) Part 50, Appendix D. Measurement Principle and
Calibration Procedure for the Measurement of Ozone in the Atmosphere. 1.3.6 40 Code of Federal Regulations (CFR) Part 58, Appendix A. Quality Assurance
Requirements for State and Local Air Monitoring Stations (Slams). 1.3.8 40 Code of Federal Regulations (CFR) Part 58, Appendix D. Network Design for State and
Local Air Monitoring Stations (SLAMS), National Air Monitoring Stations (NAMS), and Photochemical Assessment Monitoring Stations (PAMS).
1.3.9 Determination of Ozone by Ultraviolet Analysis, A New Method for Volume II, Ambient Air Specific Methods, Quality Assurance Handbook for Air Pollution Measurement Systems, Final Draft, May 1, 1997.
1.4 Introduction Ozone is a unique pollutant in that it is exclusively a secondary pollutant. This means that it is formed through a complex series of chemical reactions initiated by the release of a primary pollutant such as gasoline vapors. When a volatile organic compound, such as the VOC’s in gasoline vapors, reacts with nitrogen dioxide (N02) in
3
Section 1: Ozone Revised: February 26, 2015
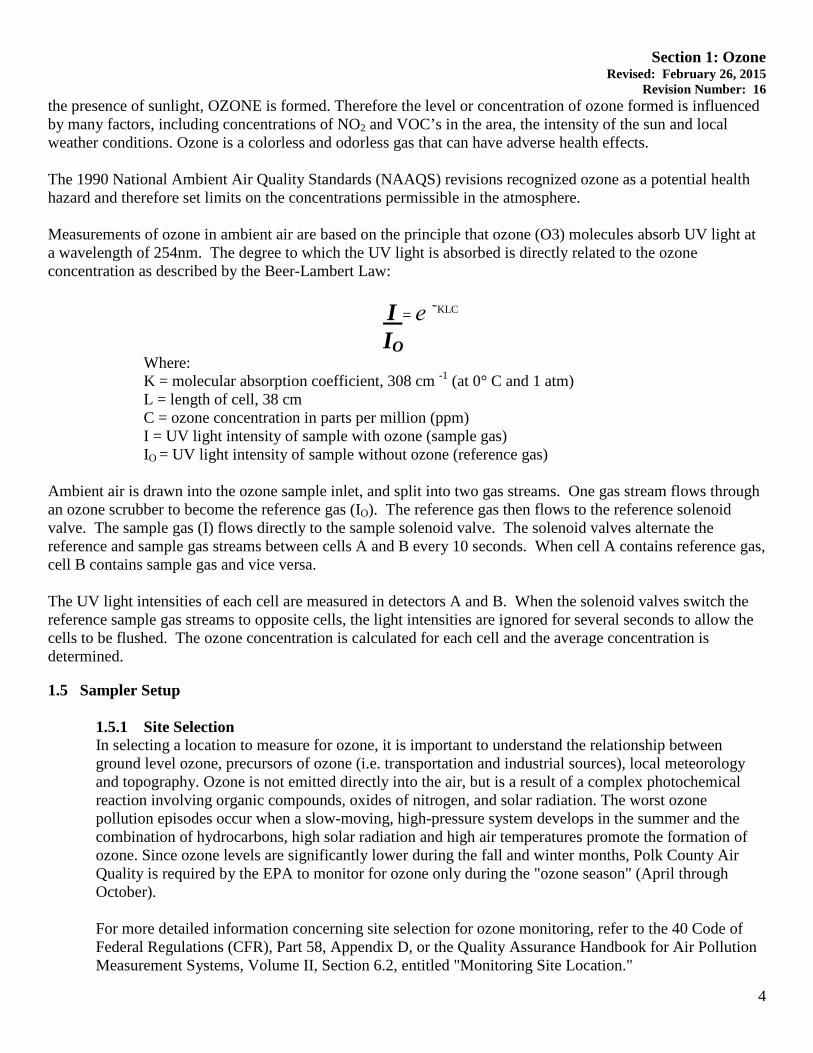
Revision Number: 16 the presence of sunlight, OZONE is formed. Therefore the level or concentration of ozone formed is influenced by many factors, including concentrations of NO2 and VOC’s in the area, the intensity of the sun and local weather conditions. Ozone is a colorless and odorless gas that can have adverse health effects. The 1990 National Ambient Air Quality Standards (NAAQS) revisions recognized ozone as a potential health hazard and therefore set limits on the concentrations permissible in the atmosphere. Measurements of ozone in ambient air are based on the principle that ozone (O3) molecules absorb UV light at a wavelength of 254nm. The degree to which the UV light is absorbed is directly related to the ozone concentration as described by the Beer-Lambert Law: I = е -KLC
IO Where: K = molecular absorption coefficient, 308 cm -1 (at 0° C and 1 atm) L = length of cell, 38 cm C = ozone concentration in parts per million (ppm) I = UV light intensity of sample with ozone (sample gas) IO = UV light intensity of sample without ozone (reference gas) Ambient air is drawn into the ozone sample inlet, and split into two gas streams. One gas stream flows through an ozone scrubber to become the reference gas (IO). The reference gas then flows to the reference solenoid valve. The sample gas (I) flows directly to the sample solenoid valve. The solenoid valves alternate the reference and sample gas streams between cells A and B every 10 seconds. When cell A contains reference gas, cell B contains sample gas and vice versa. The UV light intensities of each cell are measured in detectors A and B. When the solenoid valves switch the reference sample gas streams to opposite cells, the light intensities are ignored for several seconds to allow the cells to be flushed. The ozone concentration is calculated for each cell and the average concentration is determined. 1.5 Sampler Setup
1.5.1 Site Selection In selecting a location to measure for ozone, it is important to understand the relationship between ground level ozone, precursors of ozone (i.e. transportation and industrial sources), local meteorology and topography. Ozone is not emitted directly into the air, but is a result of a complex photochemical reaction involving organic compounds, oxides of nitrogen, and solar radiation. The worst ozone pollution episodes occur when a slow-moving, high-pressure system develops in the summer and the combination of hydrocarbons, high solar radiation and high air temperatures promote the formation of ozone. Since ozone levels are significantly lower during the fall and winter months, Polk County Air Quality is required by the EPA to monitor for ozone only during the "ozone season" (April through October). For more detailed information concerning site selection for ozone monitoring, refer to the 40 Code of Federal Regulations (CFR), Part 58, Appendix D, or the Quality Assurance Handbook for Air Pollution Measurement Systems, Volume II, Section 6.2, entitled "Monitoring Site Location."
4

Section 1: Ozone Revised: February 26, 2015
Revision Number: 16 1.5.1.1 The Monitoring Station The structure housing the monitoring equipment may consist of a trailer, a room in a building, or a shelter designed specifically for air monitoring purposes. A clean, dry, secure and temperature controlled space is required so that the sampling equipment can operate properly.
Careful thought and planning is required in locating a monitoring station. The individual responsible for the installation must consider:
• Proximity to the nearest power source. A 120 VAC source is required for operation of the ozone monitoring instruments.
• The space where the equipment is housed must maintain a temperature range of 20-30ºC. This usually requires the need for an air conditioner and a heater controlled by a thermostat.
• The accessibility of the equipment to the operator. The operator must be able to safely access the equipment during regular business hours.
• The security of the equipment. Monitoring instruments are expensive. They must be placed in a location where security can be assured.
• Contracts for rental of space or power. Contracts need to be signed with the owner of the property where the instruments are to be located.
• Telephone lines for data transmission to a central computer. A four-wire, dedicated 1200 baud (minimum) telephone data line is needed to access the Polk County Air Quality telemetry.
• Local building codes. In most cases, the contractor installing the power, structure, concrete, etc. know the local building codes.
1.5.1.2 Probe Placement Once the location of the station has been identified, the individual responsible for the installation must be familiar with the criteria for locating the probe. The location of the sample probe is critical and individuals performing the installation must follow specific guidelines involving:
• The distance of the probe inlet from nearby obstructions (buildings and trees) • The vertical and horizontal distance of the probe inlet from the ground and
support structure • Air flow around the inlet of the probe • The distance of the probe inlet from nearby roads
For specific information on monitoring site criteria refer to 40 Code of Federal Regulations, Part 58 (40 CFR 58).
1.5.2 Inspecting New Equipment When shipment of the monitor is received, verify that the package contents are complete as ordered. Inspect the instrument for external physical damage due to shipping, such as scratched or dented panel surfaces and broken knobs or connectors. Remove the instrument cover and all interior foam packing and save (in case future shipments of the instrumentation are needed). Make note of how the foam packing was installed. Inspect the interior of the instrument for damage, such as broken components or loose circuit boards. Make sure that all of the circuit boards are completely secured. (Loose boards could short out the
5

Section 1: Ozone Revised: February 26, 2015
Revision Number: 16 motherboard). If no damage is evident, the monitor is ready for calibration, installation and operation. If any damage due to shipping is observed contact Thermo Scientific at 1-866-282-0430 for instructions on how to proceed. 1.5.3 Equipment Installation Installation of an ozone monitor consists of connecting the sample tubing to the sample gas inlet fitting and connecting the primary power and the data logger device. The sampler inlet line connection should be made with ¼ -inch outer diameter Teflon tubing. The entrance of the sampling system must have provision for a water drop-out or other means of ensuring that rain cannot enter the system. An inverted funnel and sample line must be placed outside the trailer or enclosure to prevent water from entering the sample line. A water drop-out must be placed inside the trailer or enclosure between the ceiling and particulate filter housing. Place this water drop-out as far as possible from any sources that could contaminate the sample. During analyzer zero/precision/span checks and audits the water drop-out is bypassed.
Because the analyzer is an optical instrument, it is possible that particulate in the gas sample could interfere with the ozone readings, although the sampling/referencing cyclic operation of the instrument is designed to eliminate such interference. In order to avoid frequent cleaning of the optics and flow handling components, installation of a Teflon filter between the ambient sample line and the sample port of the analyzer must be done before the operation of the analyzer. A 0.5-micron Teflon filter will not degrade the ozone concentration. However, if particulate matter builds up on the filter, the particulate matter will destroy some of the ozone in the sample. The filter must be inspected on a bi-weekly basis and changed as needed. Since the instrument’s exhaust consists of ambient air with some ozone removed, ensure that the exhaust cannot re-enter the sample system. Install the monitor’s electrical connections as indicated in the operating manual. The power backup, data acquisition equipment, and any monitoring equipment, calibration equipment, or other ancillary equipment should be installed according to information supplied in the appropriate operating manuals. 1.5.4 Programming Equipment When the instrument is first turned on, the exhaust fan will start and the Power-Up and Self-Test screens will be displayed. These screens will be displayed until the instrument has completed its warm up and self-checks. Allow 30 minutes for the instrument to stabilize. After the warm-up period the Run Screen, or Normal Operating Screen, is displayed. The Run Screen displays the ozone concentration. Press the MENU button to access the Main Menu, which contains a list of submenus. Instrument parameters and features are divided into the submenus according to their function. Use the ↑ or ↓ buttons to move the cursor to each submenu.
1.5.4.1 Range and Units The Range Screen defines the concentration range of the analog outputs. The Polk County Air Quality Department will use the “Single Range” option with the selected range of 0 – 0.250 ppm for the analyzer. To set the range for the instrument, press the MENU button to access the Main
6
Section 1: Ozone Revised: February 26, 2015
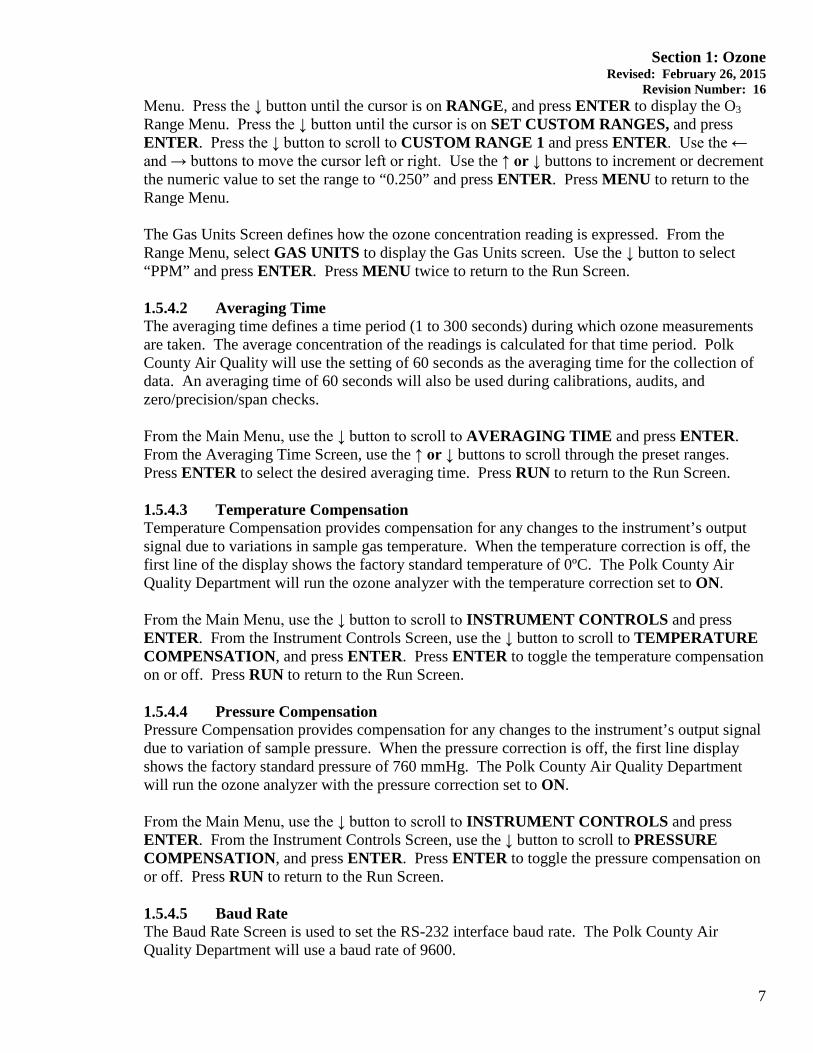
Revision Number: 16 Menu. Press the ↓ button until the cursor is on RANGE, and press ENTER to display the O3 Range Menu. Press the ↓ button until the cursor is on SET CUSTOM RANGES, and press ENTER. Press the ↓ button to scroll to CUSTOM RANGE 1 and press ENTER. Use the ← and → buttons to move the cursor left or right. Use the ↑ or ↓ buttons to increment or decrement the numeric value to set the range to “0.250” and press ENTER. Press MENU to return to the Range Menu. The Gas Units Screen defines how the ozone concentration reading is expressed. From the Range Menu, select GAS UNITS to display the Gas Units screen. Use the ↓ button to select “PPM” and press ENTER. Press MENU twice to return to the Run Screen. 1.5.4.2 Averaging Time The averaging time defines a time period (1 to 300 seconds) during which ozone measurements are taken. The average concentration of the readings is calculated for that time period. Polk County Air Quality will use the setting of 60 seconds as the averaging time for the collection of data. An averaging time of 60 seconds will also be used during calibrations, audits, and zero/precision/span checks. From the Main Menu, use the ↓ button to scroll to AVERAGING TIME and press ENTER. From the Averaging Time Screen, use the ↑ or ↓ buttons to scroll through the preset ranges. Press ENTER to select the desired averaging time. Press RUN to return to the Run Screen. 1.5.4.3 Temperature Compensation Temperature Compensation provides compensation for any changes to the instrument’s output signal due to variations in sample gas temperature. When the temperature correction is off, the first line of the display shows the factory standard temperature of 0ºC. The Polk County Air Quality Department will run the ozone analyzer with the temperature correction set to ON. From the Main Menu, use the ↓ button to scroll to INSTRUMENT CONTROLS and press ENTER. From the Instrument Controls Screen, use the ↓ button to scroll to TEMPERATURE COMPENSATION, and press ENTER. Press ENTER to toggle the temperature compensation on or off. Press RUN to return to the Run Screen. 1.5.4.4 Pressure Compensation Pressure Compensation provides compensation for any changes to the instrument’s output signal due to variation of sample pressure. When the pressure correction is off, the first line display shows the factory standard pressure of 760 mmHg. The Polk County Air Quality Department will run the ozone analyzer with the pressure correction set to ON. From the Main Menu, use the ↓ button to scroll to INSTRUMENT CONTROLS and press ENTER. From the Instrument Controls Screen, use the ↓ button to scroll to PRESSURE COMPENSATION, and press ENTER. Press ENTER to toggle the pressure compensation on or off. Press RUN to return to the Run Screen. 1.5.4.5 Baud Rate The Baud Rate Screen is used to set the RS-232 interface baud rate. The Polk County Air Quality Department will use a baud rate of 9600.
7
Section 1: Ozone Revised: February 26, 2015
Revision Number: 16 From the Main Menu, use the ↓ button to scroll to INSTRUMENT CONTROLS and press ENTER. From the Instrument Controls Screen, use the ↓ button to scroll to COMMUNICATION SETTINGS and press ENTER. From the Communication Settings Screen, use the ↓ button to scroll to BAUD RATE, and press ENTER. Use the ↑ or ↓ buttons to scroll through the preset rates. Press ENTER to select the desired baud rate. Press RUN to return to the Run Screen. 1.5.4.6 Clock Set To set the correct time and date on the instrument, press MENU to return to the Main Menu. Use the ↓ button to scroll to INSTRUMENT CONTROLS and press ENTER. Use the ↓ buttons to scroll to DATE/TIME and press ENTER. The date and time should be set to the Agilaire Model 8832 Data logger time. Use the → button to select: year, month, day, hour, minutes, or seconds. Use the ↑ or ↓ buttons to increase/decrease the desired value. Set the appropriate date and time and press ENTER. Press RUN to return to the Run Screen. The instrument is now set with the appropriate time, date, full scale range and units. NOTE: The clock should be checked at each site visit and synced to the time on the data logger. NOTE: It is recommended that you allow the 49i 24-hours before you attempt checks or calibration.
1.6 Standards In ambient air monitoring applications, precise ozone concentrations called standards are required for the calibration of ozone analyzers. Ozone standards cannot be stored for any practical length of time due to the reactivity and instability of the gas. Therefore, ozone standards must be generated and certified on site. Environmental Protection Agency (EPA)-Region 7 maintains a highly accurate standard photometer known as a Standard Reference Photometer (SRP) to serve in lieu of Standard Reference Materials (SRMs). The EPA-Region 7 SRPs provides National Institute of Standards and Technology (NIST) traceable ozone standards that are accessible to Polk County Air Quality for verifying the local primary standards. Polk County Air Quality maintains ozone standards which are classified into two basic groups: primary standards and transfer/audit standards. Polk County Air Quality operates its own local primary standard photometer that serves as the single master standard for all ozone calibrations performed by Polk County Air Quality. The local primary standard photometer is operated as described in reference 1.3.3. The transfer and audit standards described in sections 1.6.2 and 1.6.3 are used as working standards to calibrate and audit the ozone monitoring analyzers. These transfer and audit standards are all referenced to the local primary standard.
1.6.1 Local Primary Standards The local primary standard (PS) is used to check the accuracy of ozone transfer/audit standards and analyzers. An ultraviolet (UV) photometer is designated as the primary standard, recognized as the authority capable of generating and measuring ozone concentrations with impeccable accuracy. The concentrations generated by the designated primary ozone standard are recognized as the most accurate ozone concentrations available. It is required that the primary photometer used for the calibration of these standards be dedicated exclusively to such use, never used for ambient air sampling and maintained under meticulous conditions.
8

Section 1: Ozone Revised: February 26, 2015
Revision Number: 16 Primary standards are compared against EPA Region VII’s Standard Reference Photometer (SRP) once a year prior to the start of ozone season. EPA-Region VII requires that the local PS be transported to the EPA-Region VII laboratory for the annual calibration. When EPA Region VII certifies a PS against their SRP, the certification may be done on a single day, or EPA may perform 6 separate comparisons on 6 separate days. Assuming the comparison involves zero and six non-zero points; a single day comparison could be referred to as a “1x7” comparison. An aggregation of the six “1x7” comparisons done on 6 different days will be designated as a “6x7” comparison. Occasionally it may become necessary for Polk County Air Quality to switch from their primary PS to a back-up PS. If both primary standards were certified at opposite ends of the EPA’s acceptable limits, the portable transfer standards might lose their certification as a result of the transition between primary standards. Consequently, Polk County Air Quality has adopted the policy of correcting the readings of their primary standards to better match the SRP. The Annual Ozone Primary Standard Correction Worksheet (Form 1, Appendix A) and the 1x6 Averages Worksheet for Certification of Ozone Transfer Standards (Form 2, Appendix A) facilitate the process of making this correction. See Appendix B for detailed instructions for using the Annual Ozone Primary Standard Correction Worksheet. If EPA has performed a 6x7 certification of the PS, the average of the six slopes, and the average of the six y intercepts, will be used to correct that PS for the forthcoming ozone season. The “Annual Ozone Primary Standard Correction Worksheet” should be used to generate a slope and intercept from the comparison of Polk County Air Quality’s PS (Y axis) against EPA’s SRP (X axis). If EPA has only performed a 1x7 certification of the lab standard in that year, the most recent 1x7 data results will be substituted for the oldest 1x7 data results in the 6x7 linear regression analysis, such that the average of six slopes and the average of six intercepts will always be used to correct the PS for the ozone season. While the Annual Ozone Primary Standard Correction Worksheet will generate the appropriate slope and intercept needed to correct the PS, the 1x6 Averages Worksheet for Certification of Ozone Transfer Standards will actually make the correction. This worksheet adjusts the raw ten minute average of the PS, based on the slope and intercept entered into the cells in its extreme upper right corner “Slope (m) of PS Correction Equation” and “Intercept (I) of PS Correction Equation. These cells will use a slope and intercept based on the aggregation of six 1x7 certifications (m6x7, and I6x7). The equation embedded in the formulas of the “Corrected Averages” row in the 1x6 Averages Worksheet for Certification of Ozone Transfer Standards is:
Corrected Primary Standard conc. = 1/m (Indicated Primary Standard conc. – I).
See Appendix C for detailed instructions for using the 1x6 Averages Worksheet for Certification of Ozone Transfer Standards.
NOTE: the ten minute averages for the transfer standard are the same in both the “Average” and “Corrected Average” rows of the “1x6 Averages Worksheet”. Corrected 10 minute averages for the primary standard should be obtained from the “Corrected Averages” row of the “6x7 Averages Worksheet” and transferred to the “Ozone Transfer Standard Certification Worksheet” in the column labeled “Corr. Primary Std (ppb)”.
9

Section 1: Ozone Revised: February 26, 2015
Revision Number: 16 Figure 1-1: Typical Calibration Setup of an Ozone Transfer/Audit Standard
1.6.2 Transfer Standards Transfer standards are used to calibrate the station "field" analyzer and to perform precision and calibration checks. Instruments designated as transfer standards are used so the primary standard can remain at a fixed laboratory location where conditions can be carefully controlled and damage to the instrument minimized. Transfer standards are calibrated against the higher-level, primary standards. By using transfer standards, all of the ozone analyzer calibrations in Polk County Air Quality’s air monitoring network are related to the UV photometer designated as the primary standard. All transfer standards must meet the qualification requirements described in reference 1.3.3. All transfer standards must be accompanied by the following:
● A zero air generator that gives an output of at least 10 psig. The generator is equipped with dual scrubbers of charcoal and “Perma Pure” to remove any water vapor or contaminants which may result in scrubbing. See Polk County Air Quality SOP Section 25 for instructions for the Teledyne 701 Zero Air Generator.
● The manufacturer's manuals for the instruments. ● The current certification relationship information (slope and intercept) applicable to
current use of the transfer standard, together with any corrections or restrictions in the operating conditions.
● A logbook including a complete chronological record of all certification and recertification data as well as all ozone analyzer calibrations carried out with the transfer standard.
● A complete listing and description of all equipment, materials, and supplies necessary or incidental to the use of the transfer standard.
● A complete and detailed operational procedure for using the transfer standard, including all operational steps, specifications and quality control checks.
1.6.3 Audit Standards Audit standards are used to challenge the station "field" analyzer and to perform accuracy checks on a quarterly basis. Instruments designated as audit standards are used so the primary standard can remain at
10
Section 1: Ozone Revised: February 26, 2015
Revision Number: 16 a fixed laboratory location where conditions can be carefully can be carefully controlled and damage to the instrument minimized. Audit standards are calibrated against the higher-level, primary standards. By using audit standards, all of the ozone analyzer calibrations in Polk County Air Quality’s air monitoring network are related to the UV photometer designated as the primary standard. All audit standards must be accompanied by the following:
● A zero air generator that gives an output of at least 10 psig. The generator is equipped with dual scrubbers of charcoal and “Perma Pure” to remove any water vapor or contaminants which may result in scrubbing. See Polk County Air Quality SOP Section 25 for instructions for the Teledyne 701 Zero Air Generator.
● The manufacturer's manuals for the instruments. ● The current certification relationship information (slope and intercept) applicable to
current use of the audit standard, together with any corrections or restrictions in the operating conditions.
● A logbook including a complete chronological record of all certification and recertification data as well as all ozone analyzer calibrations carried out with the audit standard.
● A complete listing and description of all equipment, materials, and supplies necessary or incidental to the use of the audit standard.
● A complete and detailed operational procedure for using the audit standard, including all operational steps, specifications and quality control checks.
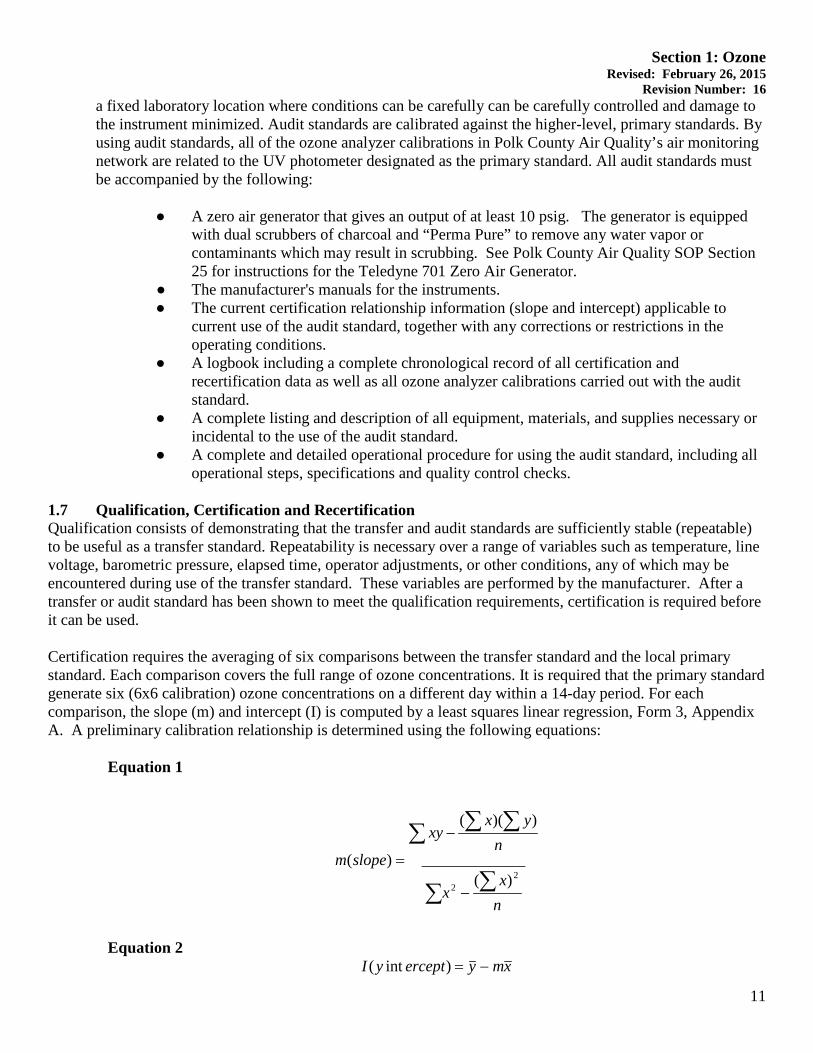
1.7 Qualification, Certification and Recertification Qualification consists of demonstrating that the transfer and audit standards are sufficiently stable (repeatable) to be useful as a transfer standard. Repeatability is necessary over a range of variables such as temperature, line voltage, barometric pressure, elapsed time, operator adjustments, or other conditions, any of which may be encountered during use of the transfer standard. These variables are performed by the manufacturer. After a transfer or audit standard has been shown to meet the qualification requirements, certification is required before it can be used. Certification requires the averaging of six comparisons between the transfer standard and the local primary standard. Each comparison covers the full range of ozone concentrations. It is required that the primary standard generate six (6x6 calibration) ozone concentrations on a different day within a 14-day period. For each comparison, the slope (m) and intercept (I) is computed by a least squares linear regression, Form 3, Appendix A. A preliminary calibration relationship is determined using the following equations:
Equation 1
nx
x
nyx
xy
slopem∑∑
∑ ∑ ∑
−
−
=2
2 )(_____________
))((
)(
Equation 2 xmyerceptyI −=)int(
11
Section 1: Ozone Revised: February 26, 2015
Revision Number: 16
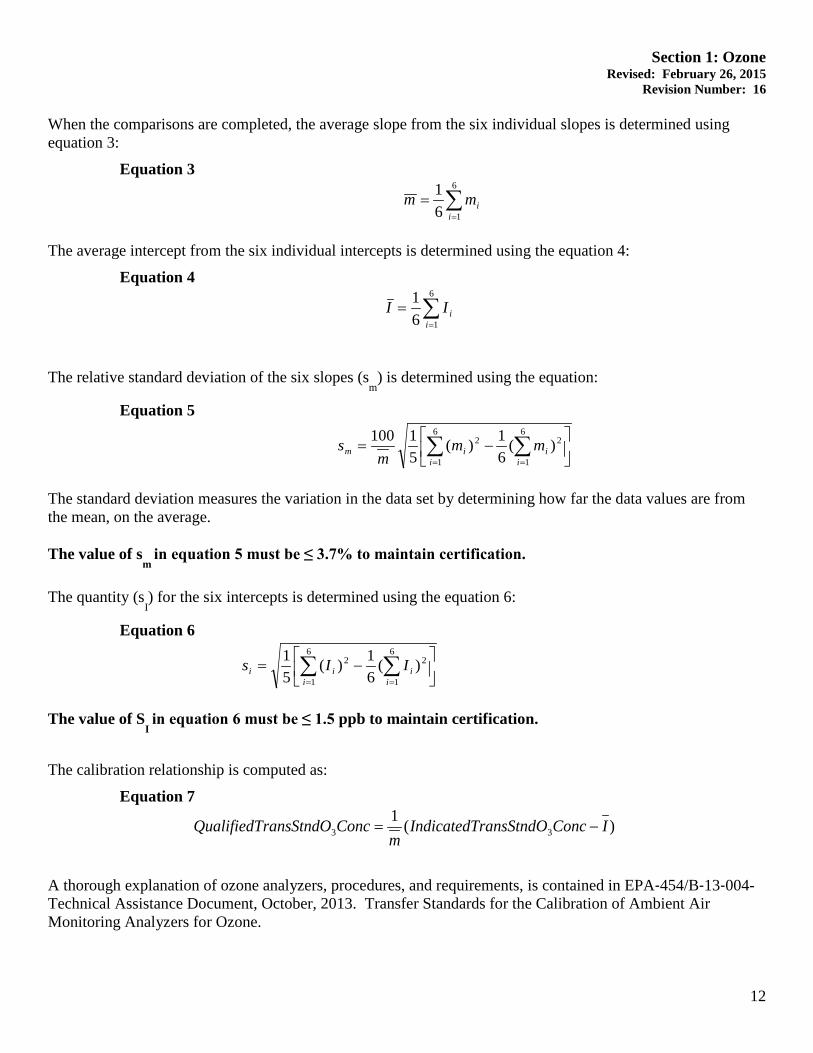
When the comparisons are completed, the average slope from the six individual slopes is determined using equation 3:
Equation 3
∑=
=6
161
iimm
The average intercept from the six individual intercepts is determined using the equation 4:
Equation 4
∑=
=6
161
iiII
The relative standard deviation of the six slopes (sm
) is determined using the equation:
Equation 5
−= ∑ ∑
= =
6
1
6
1
22 )(61)(
51100
i iiim mm
ms
The standard deviation measures the variation in the data set by determining how far the data values are from the mean, on the average. The value of s
m in equation 5 must be ≤ 3.7% to maintain certification.
The quantity (s
I) for the six intercepts is determined using the equation 6:
Equation 6
−= ∑ ∑
= =
6
1
6
1
22 )(61)(
51
i iiii IIs
The value of S
I in equation 6 must be ≤ 1.5 ppb to maintain certification.
The calibration relationship is computed as:
Equation 7
)(133 IConcransStndOIndicatedT
mConcransStndOQualifiedT −=
A thorough explanation of ozone analyzers, procedures, and requirements, is contained in EPA‐454/B‐13‐004-Technical Assistance Document, October, 2013. Transfer Standards for the Calibration of Ambient Air Monitoring Analyzers for Ozone.
12

Section 1: Ozone Revised: February 26, 2015
Revision Number: 16 Documentation of calibration and certification to the local primary standard must always remain with the transfer or audit standard for ready access if data collection procedures are questioned during audits. Recertification involves annual and quarterly six point comparisons between the primary standard and the transfer standard. EPA recommends that a transfer standard, which remains at a fixed monitoring site, be recertified once per quarter if it is sufficiently stable to avoid loss of certification over that time period. To demonstrate the stability of the instrument, the operator must perform and document routine checks during each station inspection.
To recertify a transfer standard during ozone season after an initial 6x6 comparison against the primary standard, the following steps will be taken:
• A new 1x6 comparison is made between the transfer standard and the primary standard • Determine if the slope of the newest 1x6 is within + 5% of the average slope for the 6x6 • If the slope of the newest 1x6 is within + 5% of the average slope for the 6x6, the oldest 1x6 is
tentatively replaced with the most recent 1x6 • Compute a new average slope, new average y intercept, a new Sm and a new Si. If the
acceptance criteria specified above for Sm and Si are met, the replacement of the oldest 1x6 with the 1x6 just completed can be considered final
• Substitute the new average slope and new average y intercept in equation 7, to compute a new correction equation
Should the transfer standard fail to meet the acceptance criteria during the latest 1x6 comparison, it loses its certification and the problem must be investigated and corrected. Under these circumstances, all the initial certification steps (six comparisons on different days within a 14 day period) must be repeated. Although the calibration factors (O3 BKG and O3 COEF) on the transfer standard can be adjusted during the first run of a 6x6 comparison, any subsequent adjustments require that all 6 runs of the 6x6 comparison be redone. All 6 runs of the 6x6 comparison are also performed at the start of each ozone season.
1.8 Calibrations The Thermo Scientific Model 49i Ozone monitor is calibrated whenever the following occurs: prior to the start of the ozone monitoring season, following instrument repair, and when an automated nightly or manual bi-weekly zero/precision/span check fails to meet acceptance criteria limits. The local primary standard, transfer standard and audit standard calibrations are outlined in detail in Sections 1.7 and 1.8. The site analyzers are typically calibrated in the field against the transfer standard with generated ozone concentrations of approximately: 0.200 ppm, 0.150 ppm, 0.100 ppm, 0.050 ppm, and zero air. On the main screen of the 49i Transfer Standard (TS), Press the RUN button until the zero display lights up in the lower left corner on the display screen. The TS is now in zero air sampling mode. With the zero air flowing, verify that the transfer standard and data logger reads 0.000 ppm ± 0.005 ppm. Allow the analyzer to sample zero air until a stable reading is obtained on the O3 channel. Press the front panel MENU button on the 49i site analyzer to display the Main Menu. Use the arrow keys to select CALIBRATION and press ENTER to display the Calibration Menu. Select CALIBRATE ZERO and press ENTER. In the Calibrate Zero Screen, press ENTER to set the O3 reading to zero. Press the MENU button to return to the Calibration Menu.
13
Section 1: Ozone Revised: February 26, 2015
Revision Number: 16 On the TS, turn the ozonator on. Push the MENU button, scroll to INSTRUMENT CONTROLS and press ENTER. Scroll to OZONATOR SOLENOID and press ENTER twice to turn the ozonator on. On the main screen of the Transfer Standard, Press the RUN button on the TS until the LEVEL 1 display lights up in the lower left corner on the display screen. Press the MENU button, scroll to INSTRUMENT CONTROLS and press ENTER. Scroll to CUSTOM O3 LEVELS and press ENTER. Scroll to LEVEL 1 and press ENTER. Adjust the O3 concentration to approximately 90% the upper range limit (URL) of 0.250 ppm (i.e. 0.225 ppm). Allow the TS and data logger to obtain stable readings on the O3 channel.
Press the front panel MENU button on the 49i site analyzer to display the Main Menu. Use the arrow keys to select CALIBRATION and press ENTER. Scroll to CAL O3 COEF and press ENTER. Use the ← and → buttons to move the cursor left and right. Use the ↓ or ↑ buttons to increment and decrement the digit to the expected O3 concentration and press ENTER.
After the zero and 90% URL points have been set, determine at least 3 approximately evenly spaced points between zero and the 90% URL without further adjustment to the analyzer. Perform the calibration check by a direct comparison between the 49i TS and data logger. Allow the TS and data logger to obtain stable readings on the O3 channel and record ten (10) readings. Record all information on the Calibration Field Sheet, Form 4, Appendix A.
Generate the regression analysis calculations by least squares the slope, intercept, and correlation coefficient of the site analyzer response versus the calibration standard concentrations, Form 5, Appendix A. Acceptance criteria can be found in Table 1-1: The Measurement Quality Acceptance Tables from the Quality Assurance Handbook for Air Pollution Measurement Systems, Volume II, Appendix D. EPA-454/B-13-003, May 2013. A thorough explanation of ozone analyzers, procedures, and requirements, is contained “EPA-600/4-79-057 September 1979, Technical Assistance Document for the Calibration of Ambient Ozone Monitors”. 1.9 Quality Control
1.9.1 Station Inspection Before entering the station, the perimeter should be inspected for damage. Extreme weather conditions, neglect of station maintenance or vandalism that may have resulted in damage to the site since the operator's last visit. Check that the sample probe is intact and has not been damaged.
1.9.2 Station Log Book A station log book must be maintained at each monitoring site and should accurately reflect site operations. The log book will be identified with the station name, station number, date, time, operator, instrument identification, parameter, scale and units. All entries shall include the date, time, quality control checks, and maintenance on equipment, audits, equipment changes and missing or invalid data. Additional information should include: maintenance performed on the station, abnormal traffic patterns, nearby construction, or sample line cleaning. Should the data be challenged, the information recorded in the log book is invaluable. A written record of observations concerning abnormal operations or localized occurrences is critical if a violation of ambient air standards were recorded during this period. Completed log books be maintained by Polk County Air Quality and will be archived for future reference.
14

Section 1: Ozone Revised: February 26, 2015
Revision Number: 16 Once the operator has entered the monitoring station, she/he should first:
● Check for any obvious analyzer malfunctions. For example, check to see that the equipment is running, the pumps are operating and the instrument is cycling properly.
● Note any unusual odors or noise. An unusual odor may indicate a point source of a pollutant or a strange new noise can indicate a malfunction in the equipment. These observations should be recorded in the station log book and may prove to be invaluable if the data is challenged.
Once the initial inspection is made, the operator must proceed with a routine inspection and perform a zero/precision/span check on the ozone analyzer. The station operator is responsible for making several observations during the station inspection. Any of the above described observation must be thoroughly detailed in the site log book. 1.9.3 Bi-Weekly Zero, Precision and Span Checks The zero/precision/span check is a quality control procedure used to verify that the air monitoring system is operating properly. The check involves comparing the response of the station analyzer to ozone concentrations generated by the station transfer standard. The deviation between the "indicated" value of the analyzer and the "actual" or "true" value of the transfer standard is then determined. Zero air and ozone concentrations of 0.060-0.100 ppm (the precision) and 0.175-0.225 ppm (the span) are generated by the transfer standard. Each concentration is measured by the transfer standard and the station analyzer. The results are recorded on the Ozone Field Sheet, Form 6, Appendix A. Following the zero, precision and span check, the deviation from the true ozone value is determined using Equation 7. The following critical criteria require recalibration of the field analyzer and invalidation of the data unless there is compelling reason and justification not to do so: if the precision check results in a percent difference + 7%, or if the zero drift is > 0.003 ppm, or if the span drift is + 7%. Acceptance criteria can be found in Table 1-1: The Measurement Quality Acceptance Tables from the Quality Assurance Handbook for Air Pollution Measurement Systems, Volume II, Appendix D. EPA-454/B-13-003, May 2013. For assessing bi-weekly zero and span drift, the current measured instrument response will be compared to the current known value. Corrective action will be taken if the difference is outside of historically established control limits. The zero/precision/span check must be performed at a minimum of once every fourteen days and is always performed in the same manner. Failure to perform and document zero/precision/span data within the required frequency and concentration may result in the invalidation of data. The operator is required to submit the completed field sheet form to the Quality Assurance Officer for review. Refer to Section 1.14.4 for more detailed procedures on Zero, Precision and Span Checks. 1.9.4 Data Quality Objectives Data collected for the ambient air quality-monitoring program are used to make very specific decisions that can have an economic impact on the area represented by the data. Data Quality Objectives (DQO's) are a full set of performance constraints needed to design an environmental data collection activity (EDCA). This
15

Section 1: Ozone Revised: February 26, 2015
Revision Number: 16 includes a specification of the level of uncertainty that a data user is willing to accept in the data to which the decision will apply. The DQO will be based on the data requirements of the decision-maker. Decision-makers need to feel confident that the data used to make environmental decisions are of adequate quality. Data used in these decisions are never error free and always contain some level of uncertainty. Because of these uncertainties some false positive or false negative error may occur. Decision-makers need to understand and set limits on the probability of making incorrect decisions with these data. One needs to understand and control uncertainty. Uncertainty is the sum of all sources of error associated with an EDCA. Some of these measurement uncertainties include error associated with field, preparation and laboratory activities. The goal of the QA program is to control measurement uncertainty to an acceptable level through various quality control techniques.
Three data quality indicators used in determining total measurement uncertainty, they are:
• Precision- a measure of mutual agreement among individual measurements of the same property usually under prescribed similar conditions. This is the random component of error.
• Bias- the persistent distortion of a measurement process which causes an error in one
direction. Bias determines the positive or negative deviation from the true value. • Detectability- the determination of the low range value that a method specific procedure
can reliably detect. The method detection limit (MDL) or detectability refers to the lowest concentration of a substance that can be determined by a given procedure. The 49i must be able to detect a minimum value of 1.0 ppb of O3. The site specific MDL’s should be determined for each instrument. Use 40 CFR Part 136 App B as the guideline for determining the MDL of the instrument.
1.9.5 Data Acquisition and Telemetry Data acquisition involves retrieval of the ambient air quality data from the data logger. The station operator has the primary responsibility for distinguishing valid measurements from indications caused by malfunctioning instruments or source interferences. The telemetry system can be used by a station operator to scan data transmitted from the monitoring station to a central location. This enables the operator to "call" the monitor site and examine the data recorded at the monitoring station (e.g. ozone concentrations and station temperature). The station operator should be familiar with daily concentration variations (i.e. the times daily maximum concentrations occur and the interrelationship of NOX). By recognizing abnormal data, the operator is alerted that the instruments may not be operating properly and a station visit may be necessary. However, monitoring a station by telemetry is not to be substituted for the site visit. See Polk County Air Quality SOP Section 18 for instructions on data acquisition. In the event of an exceedance of the 8-hour Ozone standard, data averages of no longer that 5 minutes will be critical in validating the data and investigating the cause of the exceedance. All data loggers are set up to collect 1 minute, 5 minute and 1 hour averages, with 1 minute being the “base average”. The 5 minute and hourly averages are called “extended average #1 and #2, respectively. The 1 minute, 5 minute and 1 hour averages are polled and stored before the data is overwritten. For more specific instructions on data acquisition, see Polk County Air Quality AirVision SOP Section 18.
16
Section 1: Ozone Revised: February 26, 2015
Revision Number: 16 1.10 Equipment, Maintenance and Trouble Isolation
1.10.1 Preventative Maintenance Each instrument must be periodically examined and serviced to anticipate and prevent instrument failure. Scheduled maintenance on the instruments will prevent costly repairs and loss of data. The routine maintenance required on the analyzers by the station operator is minimal and outlined in the manufacturer’s manual. By keeping track of the instrument responses from week to week, the operator can observe trends, which would alert the operator of a potential problem, and to correct the situation before the instrument fails. A preventative maintenance schedule is provided for the operator at the end of these procedures.
1.10.1.1 Replace Ozone Scrubber The ozone scrubber should be replaced prior to the beginning of ozone season and six months later. If a problem with the ozone scrubber is suspected, a scrubber efficiency test described in the operator’s manual should be performed. If the scrubber efficiency test fails then the scrubber must be replaced.
1.10.1.2 Sample Frequency Adjustment The sample frequency will decrease as dirt and dust particles collect throughout the optical path, as the UV lamp output decays, or as the efficiency of the detector diminish. If the adjusting procedures fail to restore the frequency to adequate levels, cleaning of the optics or replacement of the UV lamp may be necessary (this procedure is detailed in the manufacturer's manual). The manufacturer's manual contains several good diagrams which will help the operator locate the source block. 1.10.1.3 Automatic Temperature and Pressure Compensation The automatic temperature and pressure compensation features of the Thermo 49i must be enabled. The temperature and pressure sensors will be verified yearly prior to the ozone season. 1.10.1.4 Analyzer Leak Check An analyzer leak check should be performed on a yearly basis, or as needed for trouble shooting purposes. To perform an analyzer leak check, disconnect the sample line from the SAMPLE INLET on the back panel, and plug the fitting. Press the MENU button to display the Main Menu. Use the ↓ buttons to scroll to DIAGNOSTICS and press ENTER. From the Diagnostic Menu, use the ↓ buttons to scroll to SAMPLE FLOW and press ENTER. The flow reading should slowly drop to zero. Press the MENU button to return to the Diagnostics Menu. Use the ↓ buttons to scroll to PRESSURE and press ENTER. The pressure reading should drop below 250 mmHg. If the flow and pressure do not drop to their desired limits, there is a leak in the system. Check to see that all fittings are tight, and none of the input lines are cracked or broken. 1.10.1.5 Sample Line Leak Check A sample line leak check should be performed on a yearly basis, and anytime a new sample line is installed. Unscrew the sample line from the back of the analyzer, and connect the vacuum pressure gauge. The sample line must be capped off on the top side of the roof before proceeding.
17

Section 1: Ozone Revised: February 26, 2015
Revision Number: 16 Turn vacuum pump on and wait for the pump to remove all air from the sample line. The vacuum gauge will indicate a steady reading of approximately 21 inches of Hg vacuum when the lines have been evacuated. The vacuum reading must be at least 15 inches of Hg for the leak check to take place. Close the valve that is located between the vacuum gauge and the pump. Once the valve is closed record the reading from the gauge and start a timer. Shut the pump off and wait 1 minute. Record the reading from the vacuum gauge. The acceptable leak rate for the sample lines is 0.5 inches of Hg for the 1 minute check. If the leak check fails, make sure all lines are connected securely to the vacuum gauge and the line is capped off the roof, and repeat the check. If a second leak check fails, look for the leak and/or replace sample line if needed. 1.10.1.6 Pressure Check (psi) Flow Rate Before each zero/precision/span check, audit or calibration the internal pressure of the transfer or audit standard must be set to 10 psi. This will ensure that the zero air and ozone concentrations are delivered at excess to the analyzer. 1.10.1.7 Solenoid Leak Check To perform a solenoid valve leak check, remove the sample line from the SAMPLE INLET on the back panel. Remove the ozone scrubber, and locate the Kynar elbow on the solenoid valve. This is the ZERO AIR INLET. Plug the ZERO AIR INLET (a finger may be used). The flow, as indicated on the flow meter, should drop to zero. If it does not, there is a leak in the system. If no leaks were found, reconnect all in-cabinet plumbing and perform a system leak check. 1.10.1.8 Particulate Filter Changes A 0.5 micron Teflon filter housed in a Teflon filter holder is located on the outside of the analyzer and is connected to the sample line. The filter should be checked once every two weeks and changed when noticeably dirty. Slow response of the analyzer during the zero/precision/span check is an indication of a dirty filter or contaminants in the sample line. To replace the used filter, loosen the two halves of the filter holder and replace the dirty filter with a new filter. Following a filter change, perform a high span check (approximately 0.200 ppm) for at least half an hour. This is to condition the new filter and serves as a check to see if there any leaks in the reassembled filter holder. 1.10.1.9 Replacing Sample Lines It is the operator’s responsibility to maintain the sample lines. The sample lines must be replaced if the operator suspects a loss in Ozone concentrations due to contamination in the line, or every two years.
1.10.2 Trouble Isolation The instruments in Polk County Air Quality’s air monitoring network are very reliable. However, after a period of continuous use problems may occur. Leaks in the system, dirt build up and UV lamp failure
18

Section 1: Ozone Revised: February 26, 2015
Revision Number: 16 are typical. After time, the operator should be able to quickly distinguish the symptoms and causes of equipment failure. It is suggested that each station operator consult the Models 49i, UV Photometric Ozone Analyzer, Instruction Manuals and compile personal notes on troubleshooting as they gain experience with the Thermo Scientific. The operator is encouraged to contact the manufacturer when attempting any repairs. The manufacturer’s manual is the best resource the station operator has for the information on the operation and maintenance of the ozone analyzer.
1.10.3 Environmental Control for Monitoring Equipment Instrument vibration should be reduced as much as possible. Use shock-absorbing feet for the monitor. Any pumps must be fitted with rubber feet to reduce vibration. All pumps connected to the analyzer should be connected using tubing that will prevent the transfer of vibrations back to the instrument and/or the instrument rack. All instruments should be shielded from natural or artificial light.
Ensure constant voltage to surge protection devices and equipment. Regulate the housing temperature between 20-30°C. The operators’ manual indicates that in non-condensing environments or when a water drop-out is present the instrument may be safely operated over the rage of 0-45°C. Hourly temperature readings are collected by the polling computer during daily polling. Polk County will make every effort to operate the monitor in the 20-30°C range. Data will be investigated to determine the validity of the data for hourly concentrations where the shelter temperatures fall outside the range of (20-30°C).
1.11 Quality Assurance (Accuracy - Audits) Once during each calendar quarter, the designated Quality Assurance Officer utilizing the procedures and calculations specified in 40 CFR 58, Appendix A, "Quality Assurance Requirements for State and Local Air Monitoring Stations (SLAMS)," each of the operating ozone analyzers will be audited using a direct comparison.
1.11.1 Direct Comparison Audits During a direct comparison audit, an audit standard and the monitoring station’s ozone analyzer assay the same ozone concentrations at the same time. An audit standard that has meet the qualification and certification requirements in Section 1.7 – Qualification, Certification, and Re-certification, is required before it can be used. The responses of the on-site analyzer are then compared against the output of the audit standard and a linear regression is generated. 1.11.2 Audit Sequence Connect the audit standard and the site monitor as shown in Figure 1-2. Allow the site monitor and audit standard to sample the zero air until the site monitors response does not vary by more then + 2% of the measurement range over a 5-minute period. For Polk County Air Quality monitors the upper range limit is set to 0.250 ppm. The zero air reading should not vary by more than 0.003 ppm over a 5-minute period. Record the zero air readings on the Audit Sheet, Form 7, Appendix A.
19

Section 1: Ozone Revised: February 26, 2015
Revision Number: 16 Generate at least three of the following SLAMS consecutive audit concentrations: 0.310-0.900 ppm, 0.210-0.300 ppm, 0.110-0.200 ppm, 0.060-0.100 ppm, and 0.020-0.050 ppm. The audit levels selected should represent 80 percent of the ambient concentrations measured by the analyzer. Allow each audit concentration to stabilize for a minimum of 5 minutes. Record ten consecutive display updates of the audit standard for each audit point and calculate and record the means of these ten updates. Record the site analyzers response from the data logger display. Both the audit standard and site analyzer readings should be taken only after a stable response is exhibited by both instruments. Calculate the audit concentrations using equation 7, Section 1.8. Note: adjust the audit response based on the audit analyzer 6x6 linear regression. Generate the highest audit concentration level first. Then consecutively generate the decreasing concentrations. After challenging the site analyzer with all audit concentrations, record all data on the audit form. Calculate the percent difference for all audit levels using the following equation:
Equation 8:
100% ×−
=A
AM
CCCDifference
Where: =MC ESC data logger concentration, ppm
=AC Calculated audit standard concentration from equation 7, ppm
Generate the regression analysis calculations by least squares the slope, intercept, and correlation coefficient of the site analyzer response versus the audit standards concentrations. If the percent difference of each audit level is outside ±15% or there is reason to believe the results are incorrect or not representative of the analyzers performance, the cause for the error must be investigated and corrected. An investigation initiated by audit results that are outside the above limits may require the invalidation of data. Record all information in the site log. NOTE: For more detailed information concerning audit performances for O3 monitoring, refer to the “Quality Assurance Handbook for Air Pollution Measurement Systems, Volume II” or 40 CFR 58. Figure 1-2: Typical Setup of a Direct Comparison Audit
20
Section 1: Ozone Revised: February 26, 2015
Revision Number: 16 1.11.3 Performance Evaluation Audit Agency staff may be sent an audit device, such as for the National Performance Audit Program (NPAP). The agency staff does not know the ozone concentrations produced by the audit equipment. Responses of the on-site analyzer are then compared against those of the generator and a linear regression is calculated. The Polk County Air Quality Department will participate in the USEPA performance audit program for ozone and in all other EPA audit programs, which may arise in the future. The results of these audits do not have an acceptance criteria however Polk County hopes to have results of +/-10%. A review of the monitoring system shall be conducted if the results are above this. These blind audits will indicate any deficiency in the monitoring system in respect to precision and accuracy, calibrations and maintenance.
1.12 Data Quality Assessment For each calendar quarter and year, Polk County Air Quality will prepare data precision, accuracy and completeness reports for the Iowa Department of Natural Resources (Iowa DNR) and EPA-Region 7 in accordance with the current Letter of Agreement (LOA).
1.12.1 Precision The precision will be evaluated and reported employing the frequencies, procedures and calculations in 40 CFR Part 58, Appendix A, "Quality Assurance Requirements for State and Local Air Monitoring Stations (SLAMS)". 1.12.2 Accuracy Using results from the performance audits and the calculations specified in 40 CFR 58, Appendix A, "Quality Assurance Requirements for State and Local Air Monitoring Stations". The accuracy will be evaluated and reported.
1.12.3 Data Completeness The completeness of the data will be determined for each monitoring instrument and expressed as a percentage. Percent valid data will be a gauge of the amount of valid data obtained from the monitoring instrument, compared to the amount expected under ideal conditions (24 hours per day, 365 days per year). Exceptions will be made for analyzers which have a seasonal sampling period, which were not installed at the beginning, or which were discontinued prior to the end of any reporting period for calculation purposes.
1.13 Procedures for Bi-Weekly Checks New station operators will be provided with on-site training by an experienced operator before they operate a station on their own. The following procedures are intended to assist the operator in performing and documenting monitoring procedures. Monitoring personnel must become familiar with the Instruction Manual for Model 49i UV Photometric Ozone Analyzer, Figure 1-3. A zero/precision/span check is required once every fourteen days. These checks must not be performed during periods of data collection which approach National Ambient Air Quality Standards (NAAQS) but postponed and performed after the air pollution episode. If the ambient ozone concentrations are exceeding or approaching 0.060 ppm, the check must be postponed. No instrument adjustments are to be made prior to the zero/precision/span check. The purpose of the check is to verify that the air monitoring system is operating properly.
21
Section 1: Ozone Revised: February 26, 2015
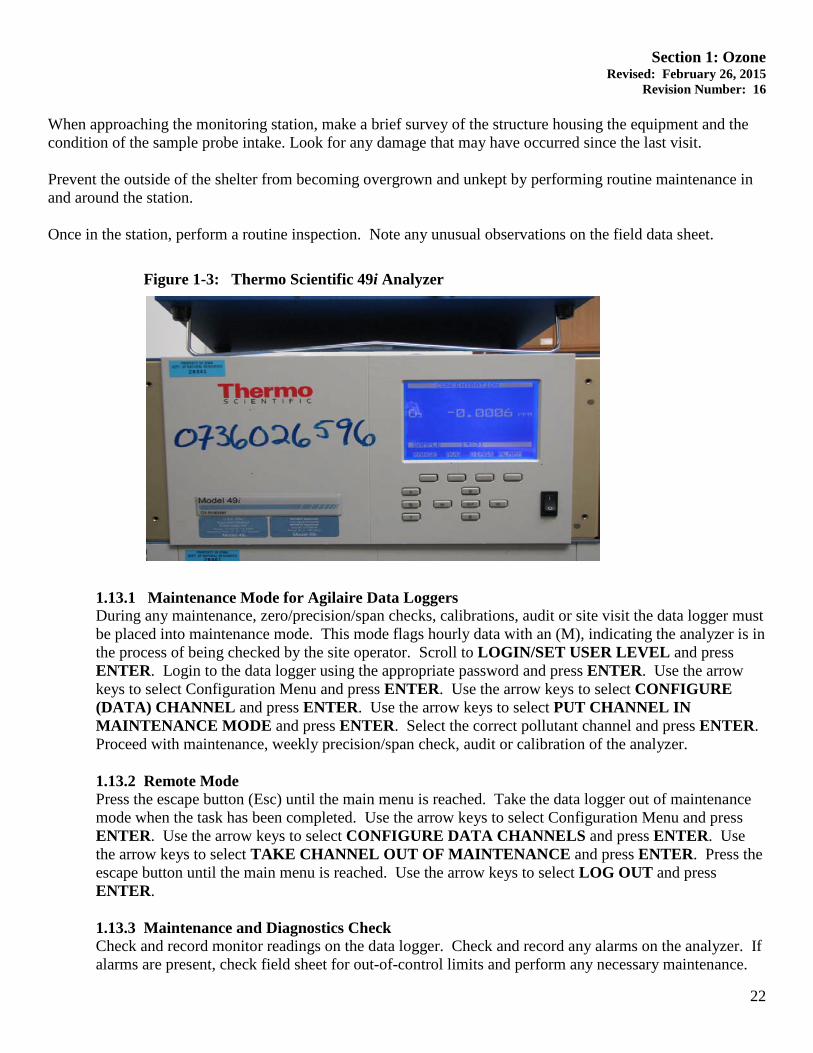
Revision Number: 16 When approaching the monitoring station, make a brief survey of the structure housing the equipment and the condition of the sample probe intake. Look for any damage that may have occurred since the last visit. Prevent the outside of the shelter from becoming overgrown and unkept by performing routine maintenance in and around the station. Once in the station, perform a routine inspection. Note any unusual observations on the field data sheet.
Figure 1-3: Thermo Scientific 49i Analyzer
1.13.1 Maintenance Mode for Agilaire Data Loggers During any maintenance, zero/precision/span checks, calibrations, audit or site visit the data logger must be placed into maintenance mode. This mode flags hourly data with an (M), indicating the analyzer is in the process of being checked by the site operator. Scroll to LOGIN/SET USER LEVEL and press ENTER. Login to the data logger using the appropriate password and press ENTER. Use the arrow keys to select Configuration Menu and press ENTER. Use the arrow keys to select CONFIGURE (DATA) CHANNEL and press ENTER. Use the arrow keys to select PUT CHANNEL IN MAINTENANCE MODE and press ENTER. Select the correct pollutant channel and press ENTER. Proceed with maintenance, weekly precision/span check, audit or calibration of the analyzer.
1.13.2 Remote Mode Press the escape button (Esc) until the main menu is reached. Take the data logger out of maintenance mode when the task has been completed. Use the arrow keys to select Configuration Menu and press ENTER. Use the arrow keys to select CONFIGURE DATA CHANNELS and press ENTER. Use the arrow keys to select TAKE CHANNEL OUT OF MAINTENANCE and press ENTER. Press the escape button until the main menu is reached. Use the arrow keys to select LOG OUT and press ENTER.
1.13.3 Maintenance and Diagnostics Check Check and record monitor readings on the data logger. Check and record any alarms on the analyzer. If alarms are present, check field sheet for out-of-control limits and perform any necessary maintenance.
22

Section 1: Ozone Revised: February 26, 2015
Revision Number: 16 See Model 49i Instruction Manuals, Chapter 7-Servicing, and Section 1.1.15 Preventative Maintenance in this SOP. Then record any maintenance performed in the ozone maintenance log. Check and record monitor’s calibration factors. Press MENU and scroll down to CALIBRATION FACTORS and press ENTER. Record the O3 BKG and O3 COEF. Write down any maintenance that was performed on the instrument or additional comments that may affect the air monitoring system. Examples include:
● replacement of UV lamps, pumps or tubing ● repairs or maintenance made to or around the shelter ● abnormal localized occurrences nearby ● suggestions for improvements to the system ● supplies that are needed ● checks or audits that were performed
1.13.4 Zero, Precision and Span Checks On the TS, turn the ozonator on. Push the MENU button, scroll to INSTRUMENT CONTROLS and press ENTER. Scroll to OZONATOR SOLENOID and press ENTER twice to turn the ozonator on. Follow the same procedure to turn the ozonator off. The data logger should display readings in ppm for ease of comparison between the site analyzer and data logger. Allow the site monitor and transfer standard to sample the zero air for until the site monitors response does not vary by more than + 2% of the measurement range. For Polk County Air Quality monitors the upper range limit is set to 0.250 ppm. The zero air reading should not vary by more than 0.005 ppm.
1.13.4.1 Span Check The internal ozone level produced is a function of light intensity at 185 nanometers (nm) and gas flow. The light intensity is varied by changing the current, expressed as a percentage, into the lamp. The gas flow is held constant by a pressure regulator followed by a capillary. Connect the TS ozone port to the site analyzer’s sample port prior to the Teflon filter. Push the RUN button on the TS until the display reads Level 2. Press the MENU button, scroll to INSTRUMENT CONTROLS and press ENTER. Select CUSTOM LEVELS and press ENTER. Select LEVEL 2 and press ENTER. If a stable reading for level 2 is between 0.175-0.225 ppm perform the span check. If the readings fall outside the range 0.175-0.225 ppm adjust the LEVEL 2 OUTPUT percentage so that the TS reads between 0.175-0.225 ppm. Polk County Air Quality uses the Agilaire Model 8832 data loggers for data recording. The values indicated on the data logger are the values that are being transmitted to, and recorded by the central computer. Therefore, it is important that the data logger readings are recorded on the field sheet. Perform the span check by a direct comparison between the TS and the data logger. Allow the TS to obtain a stable reading and record ten (10) reading for the TS and the data logger. Read the ten analyzer ppm concentration values from the data logger and the TS at the same time and record them on the field sheet. After ten readings have been taken, calculate the average of the ten readings from the data logger and the transfer standard and record the average on the field sheet.
23
Section 1: Ozone Revised: February 26, 2015
Revision Number: 16 Acceptance criteria can be found in Table 1-1: The Measurement Quality Acceptance Tables from the Quality Assurance Handbook for Air Pollution Measurement Systems, Volume II, Appendix D. EPA-454/B-13-003, May 2013.
1.13.4.2 Precision Check At this point the zero air readings have been recorded, perform the precision level check. With the OZONATOR SOLENOID turned on, allow the instruments time to measure the concentration by waiting several minutes until a stable reading is achieved. Push the RUN button on the TS until the display reads Level 1. Press the MENU button, scroll to INSTRUMENT CONTROLS and press ENTER. Select CUSTOM LEVELS and press ENTER. Select LEVEL 1 and press ENTER. If a stable reading for level 1 is between 0.060-0.100 ppm perform the precision check, if the readings fall outside the range 0.060-0.100 ppm adjust the Level 1 Output percentage so that the TS reads between 0.060-0.100 ppm.
Perform the precision check by a direct comparison between the TS and the data logger. Allow the TS to obtain a stable reading and record ten (10) reading for the TS and the data logger. Read the ten analyzer ppm concentration values from the data logger and the TS at the same time and record them on the field sheet. After ten readings have been taken, calculate the average of the ten readings from the data logger and the transfer standard and record the average on the Field Sheet, Form 6, Appendix A.
Use Equation 8 to determine the percent difference between the analyzer and the transfer standard. See Section 1.9.3 for acceptance criteria and corrective actions relating to zero, precision, and span checks. Record all information in the site log.
1.13.4.3 Zero Air Check At this point the precision readings have been recorded, perform the zero air check. Press the RUN button on the TS until the zero display lights up in the lower left corner on the display screen. The TS is now in zero air sampling mode. With the zero air flowing, verify that the transfer standard and data logger reads 0.000 ppm ± 0.005 ppm. Average concentrations are determined by using a "ten count ". Ten readings of the instruments response are taken over a period of ten to fifteen minutes and recorded on the field sheet. See Section 1.9.3 for acceptance criteria and corrective actions relating to zero, precision, and span checks. Turn the Ozonator Solonoid off. Change the monitor to ambient sampling by pushing the RUN button until the display reads SAMPLE. Log all site visits into the logbook (every detail of the visit must be logged). Take the data logger out of maintenance mode. See Section 1.13.2. NOTE: If a problem is recognized while performing maintenance, diagnostic, weekly zero, precision or span checks which has or could affect data, a corrective action form is to be filled out describing the problem identified and the action taken to correct the problem,
24

Section 1: Ozone Revised: February 26, 2015
Revision Number: 16 Form 8, Appendix A. All forms and documentation must be submitted to the Quality Assurance Officer.
1.13.4.4 Invalidate Data and Recalibrate If the precision check results in a percent difference + 7%, or if the zero drift is > 0.005 ppm, or if the span drift is + 7%, the site analyzer must be recalibrated and the data will be invalidated back to the last valid zero/precision/span check unless there is compelling reason and justification not to do so. See Section 1.8 for calibration procedures.
NOTE: In order to minimize data loss, Polk County personal will recalibrate the instrument when the results of bi-weekly checks reach exceed recalibration thresholds, unless there is compelling reason and justification not to do so. Recalibration criteria refer to thresholds that typically require recalibrating the analyzer, but do not require the invalidation of data. Recalibration criteria should be set to levels that are as tight as practically possible, and based on historical performance data. They may change after reviewing typical differences from control charts.
1.14 Automated Zero/Precision/Span Checks An external 24-hour Level 1 Zero/Precision/Span Check is performed using the auto function of the Thermo Scientific 49i. The auto checks are initiated by the 49i transfer standard to challenge the 49i site analyzer. The data is flagged for this period with a “C” on the data logger. The automated zero, precision and span checks are used to determine if the 49i is operating properly, and if drift in instrument response has occurred. For these checks, the challenge gas should be sampled through as much of the sampling inlet system as practical to mimic the actual sampling of ambient air. The results of the Level 1 zero/precision/span checks should be plotted to graphically illustrate the trends in the response of the analyzer to the challenge gases. Polk County Air Quality Division will analyze “drift” as a direct comparison of the current indicated concentration collected from the site analyzer to the actual concentration collected from the Transfer Standard. Polk County Air Quality Division will strive to obtain a zero drift < 0.003 ppm, a span drift < 7% of the span level, and a % difference for precision < 7%. If the daily automated precision check results are outside ± 7%, the instrument will be recalibrated and the data will be invalidated to the last acceptable check, unless there is a compelling reason and justification not to do so. Site visits should be conducted if the daily results exceed the following limits. (All differences refer to the current analyzer reading compared to the current qualified known reading from the transfer standard):
• A Zero difference of 0.003 ppm • A Span difference of greater than 5% • A Precision difference of greater than 5%
There are several components to a successful automated zero/precision/span check:
• A zero air generator that gives an output of at least 10 psig. The generator is equipped with dual scrubbers of charcoal and “Perma Pure” to remove any water vapor or contaminants which may
25

Section 1: Ozone Revised: February 26, 2015
Revision Number: 16 result in scrubbing. See Polk County Air Quality SOP Section 25 for instructions for the Teledyne 701 Zero Air Generator.
• A solenoid system with timer
• A Calibration Program setup in the 49i Transfer Standard
• A Relay Output Program setup in the 49i Transfer Standard
• A Calibration Program setup in the AirVision Software for the Agilaire Model 8832 data logger
1.14.1 Solenoid System A solenoid system is required to dictate air flow for the automated zero/precision/span checks. A two-way solenoid is used to allow for zero air to flow to the transfer standard during the automated checks. The valve is only open during the automated check period. Otherwise, it is closed.
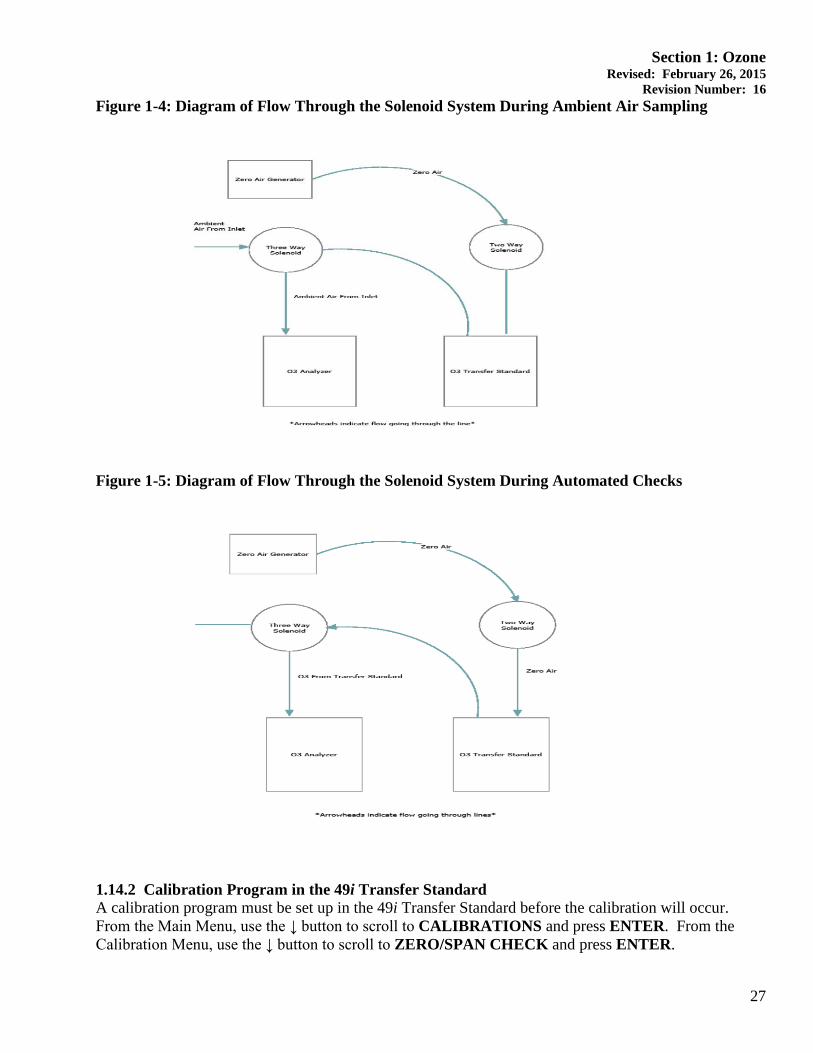
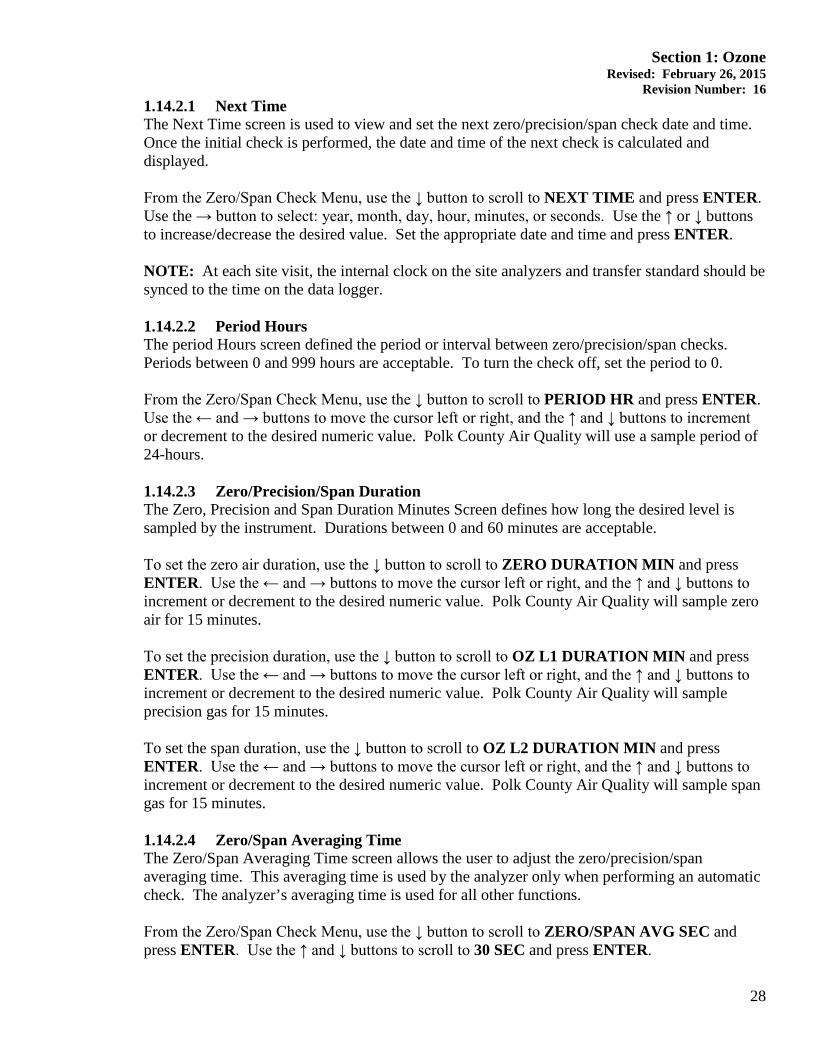
A three-way solenoid valve is used to dictate whether the air flow to the site analyzer is ambient air from the sample inlet, or ozone generated by the transfer standard during automated checks. Figure 1-4 displays the air flow through the solenoid system during ambient air sampling. The valve is open to allow ambient air to enter and be sampled by the site analyzer. The valve connected to the transfer standard is closed so that only ambient air will be sampled during that time. Figure 1-5 displays air flow through the solenoid system during automated checks. The valve is open to allow ozone generated by the transfer standard to be sampled by the site analyzer. The valve connected to the sample inlet is closed so that no ambient air will be sampled during that time. An industrial timer is used to determine when the solenoid valves are opened or closed. The timer is checked at each site visit and adjusted if off from the data logger by more than 1 minute. The two-way solenoid is set to open at 2 minutes prior to the start of the hour in which auto-calibration occurs, and close 2 minutes following the completion of the auto-calibration.
The three-way solenoid is set to change to its auto-calibration configuration at 2 minutes prior to the start of the hour in which auto-calibration occurs, and return to its ambient sampling configuration 2 minutes following the completion of the auto-calibration.
26
Section 1: Ozone Revised: February 26, 2015
Revision Number: 16 Figure 1-4: Diagram of Flow Through the Solenoid System During Ambient Air Sampling
Figure 1-5: Diagram of Flow Through the Solenoid System During Automated Checks
1.14.2 Calibration Program in the 49i Transfer Standard A calibration program must be set up in the 49i Transfer Standard before the calibration will occur. From the Main Menu, use the ↓ button to scroll to CALIBRATIONS and press ENTER. From the Calibration Menu, use the ↓ button to scroll to ZERO/SPAN CHECK and press ENTER.
27
Section 1: Ozone Revised: February 26, 2015
Revision Number: 16 1.14.2.1 Next Time The Next Time screen is used to view and set the next zero/precision/span check date and time. Once the initial check is performed, the date and time of the next check is calculated and displayed. From the Zero/Span Check Menu, use the ↓ button to scroll to NEXT TIME and press ENTER. Use the → button to select: year, month, day, hour, minutes, or seconds. Use the ↑ or ↓ buttons to increase/decrease the desired value. Set the appropriate date and time and press ENTER. NOTE: At each site visit, the internal clock on the site analyzers and transfer standard should be synced to the time on the data logger. 1.14.2.2 Period Hours The period Hours screen defined the period or interval between zero/precision/span checks. Periods between 0 and 999 hours are acceptable. To turn the check off, set the period to 0. From the Zero/Span Check Menu, use the ↓ button to scroll to PERIOD HR and press ENTER. Use the ← and → buttons to move the cursor left or right, and the ↑ and ↓ buttons to increment or decrement to the desired numeric value. Polk County Air Quality will use a sample period of 24-hours. 1.14.2.3 Zero/Precision/Span Duration The Zero, Precision and Span Duration Minutes Screen defines how long the desired level is sampled by the instrument. Durations between 0 and 60 minutes are acceptable. To set the zero air duration, use the ↓ button to scroll to ZERO DURATION MIN and press ENTER. Use the ← and → buttons to move the cursor left or right, and the ↑ and ↓ buttons to increment or decrement to the desired numeric value. Polk County Air Quality will sample zero air for 15 minutes. To set the precision duration, use the ↓ button to scroll to OZ L1 DURATION MIN and press ENTER. Use the ← and → buttons to move the cursor left or right, and the ↑ and ↓ buttons to increment or decrement to the desired numeric value. Polk County Air Quality will sample precision gas for 15 minutes. To set the span duration, use the ↓ button to scroll to OZ L2 DURATION MIN and press ENTER. Use the ← and → buttons to move the cursor left or right, and the ↑ and ↓ buttons to increment or decrement to the desired numeric value. Polk County Air Quality will sample span gas for 15 minutes. 1.14.2.4 Zero/Span Averaging Time The Zero/Span Averaging Time screen allows the user to adjust the zero/precision/span averaging time. This averaging time is used by the analyzer only when performing an automatic check. The analyzer’s averaging time is used for all other functions. From the Zero/Span Check Menu, use the ↓ button to scroll to ZERO/SPAN AVG SEC and press ENTER. Use the ↑ and ↓ buttons to scroll to 30 SEC and press ENTER.
28
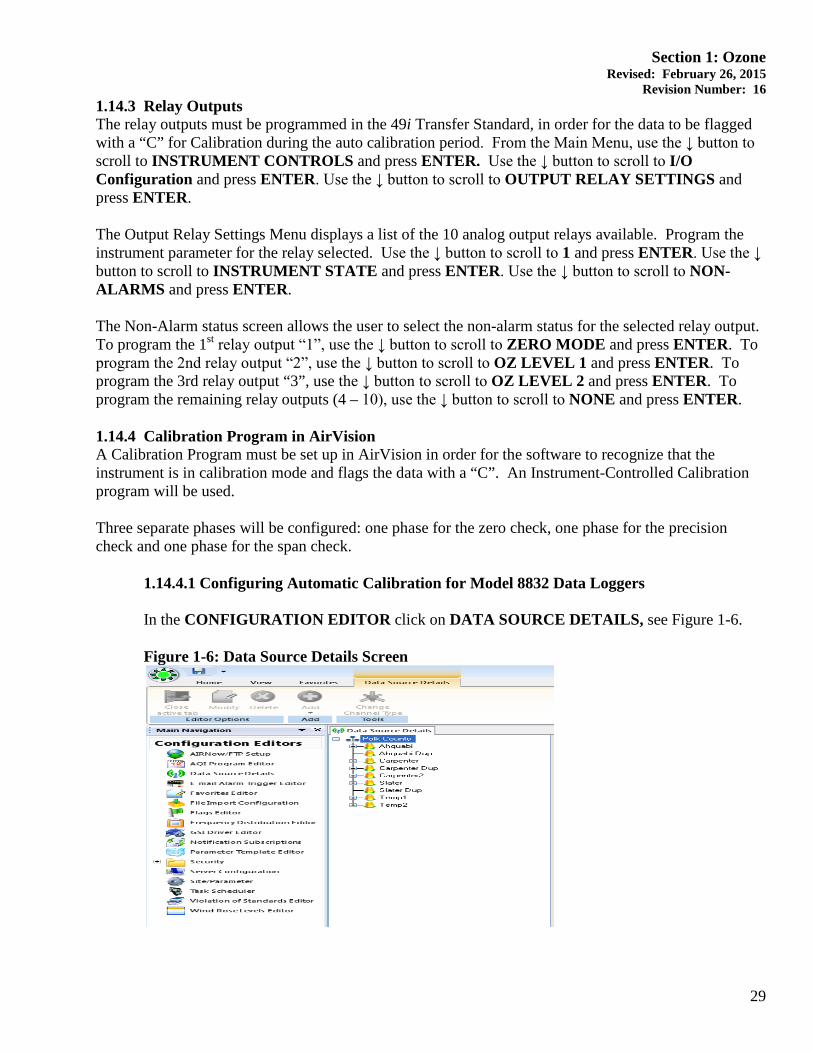
Section 1: Ozone Revised: February 26, 2015
Revision Number: 16 1.14.3 Relay Outputs The relay outputs must be programmed in the 49i Transfer Standard, in order for the data to be flagged with a “C” for Calibration during the auto calibration period. From the Main Menu, use the ↓ button to scroll to INSTRUMENT CONTROLS and press ENTER. Use the ↓ button to scroll to I/O Configuration and press ENTER. Use the ↓ button to scroll to OUTPUT RELAY SETTINGS and press ENTER. The Output Relay Settings Menu displays a list of the 10 analog output relays available. Program the instrument parameter for the relay selected. Use the ↓ button to scroll to 1 and press ENTER. Use the ↓ button to scroll to INSTRUMENT STATE and press ENTER. Use the ↓ button to scroll to NON-ALARMS and press ENTER. The Non-Alarm status screen allows the user to select the non-alarm status for the selected relay output. To program the 1st relay output “1”, use the ↓ button to scroll to ZERO MODE and press ENTER. To program the 2nd relay output “2”, use the ↓ button to scroll to OZ LEVEL 1 and press ENTER. To program the 3rd relay output “3”, use the ↓ button to scroll to OZ LEVEL 2 and press ENTER. To program the remaining relay outputs (4 – 10), use the ↓ button to scroll to NONE and press ENTER. 1.14.4 Calibration Program in AirVision A Calibration Program must be set up in AirVision in order for the software to recognize that the instrument is in calibration mode and flags the data with a “C”. An Instrument-Controlled Calibration program will be used. Three separate phases will be configured: one phase for the zero check, one phase for the precision check and one phase for the span check.
1.14.4.1 Configuring Automatic Calibration for Model 8832 Data Loggers In the CONFIGURATION EDITOR click on DATA SOURCE DETAILS, see Figure 1-6. Figure 1-6: Data Source Details Screen
29
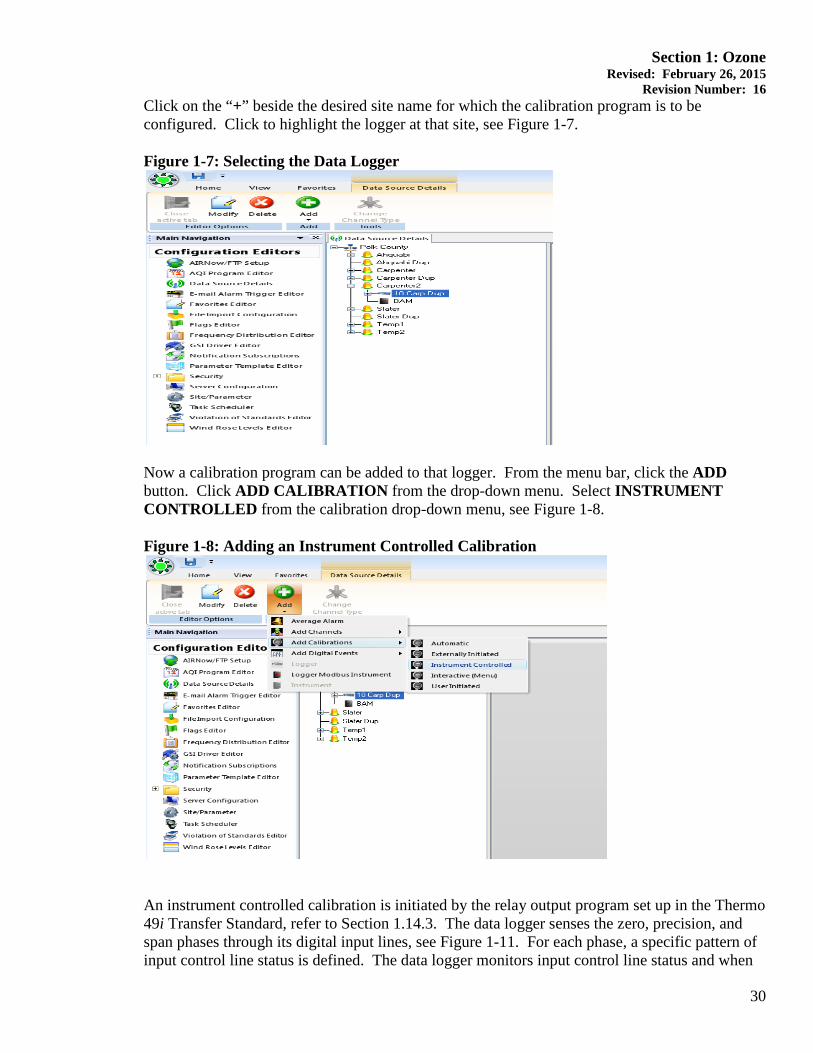
Section 1: Ozone Revised: February 26, 2015
Revision Number: 16 Click on the “+” beside the desired site name for which the calibration program is to be configured. Click to highlight the logger at that site, see Figure 1-7. Figure 1-7: Selecting the Data Logger
Now a calibration program can be added to that logger. From the menu bar, click the ADD button. Click ADD CALIBRATION from the drop-down menu. Select INSTRUMENT CONTROLLED from the calibration drop-down menu, see Figure 1-8. Figure 1-8: Adding an Instrument Controlled Calibration
An instrument controlled calibration is initiated by the relay output program set up in the Thermo 49i Transfer Standard, refer to Section 1.14.3. The data logger senses the zero, precision, and span phases through its digital input lines, see Figure 1-11. For each phase, a specific pattern of input control line status is defined. The data logger monitors input control line status and when
30

Section 1: Ozone Revised: February 26, 2015
Revision Number: 16 the specified pattern is met, the corresponding calibration phase is initiated. There is no predefined duration for individual phases programmed into the AirVision calibration program; each phase will continue until the input line pattern is no longer met. The duration of each phase is determined by the calibration program in the Thermo 49i Transfer Standard, refer to Section 1.14.2. Polk County uses a duration of 15 minutes for each desired phase. At the end of each phase, the concentrations are written into the calibration report. A SEQUENCE EDITOR Screen appears, see Figure 1-9. Figure 1-9: Sequence Editor Screen
Complete the following fields:
• Calibration Type – will already be filled in as Instrument(Controlled)
• Calibration Name – is required to identify the calibration program
• Enabled – check if the calibration is to run
• Number of Calibration Records – determines how many calibrations the data logger will store before overwriting
• Recovery Time – specifies the time required to purge the calibration gases after calibration phases are competed. This function provides a delay before normal sampling and averaging resumes. Polk County Air Quality will use a recovery time of 10 minutes.
• Affected Channels – determines which channels will be taken off-line during the calibration. Select from a list of previously configured parameters.
31

Section 1: Ozone Revised: February 26, 2015
Revision Number: 16 1.14.4.2 Configuring Calibration Phases At least one phase must be configured for each calibration. Polk County Air Quality uses three phases for the ozone auto checks: a zero phase, a precision phase and a span phase. Click the ADD PHASE button in the Sequence Editor Screen. The PHASE EDITOR SCREEN will appear, see Figure 1-10. Figure 1-10: Phase Editor Screen
To set up, complete the following fields:
• Name of Phase – Enter a user-defined name that identifies each phase of the calibration sequence. Valid values are A-Z and 0-9.
• Phase Number – Enter to specify the order in which the phase will occur within the calibration. Phase numbers must be in sequence, beginning with 01.
• Response Time – Enter a time to specify how long data will be averaged during a calibration phase. Polk County Air Quality will use a Response Time of one minute.
Press SELECT LINES under STATUS PATTERN to set up the specific pattern of input control line status. Each phase will have a unique pattern. The zero phase, displayed in Figure 1-11, will have a pattern of 1 = on and 2,3 = off. The precision phase will have a pattern of 2 = on and 1,3 = off. The span phase will have a pattern of 3 = on and 1,2 = off. Normal sample mode will have a pattern of 1,2,3, = off.
32
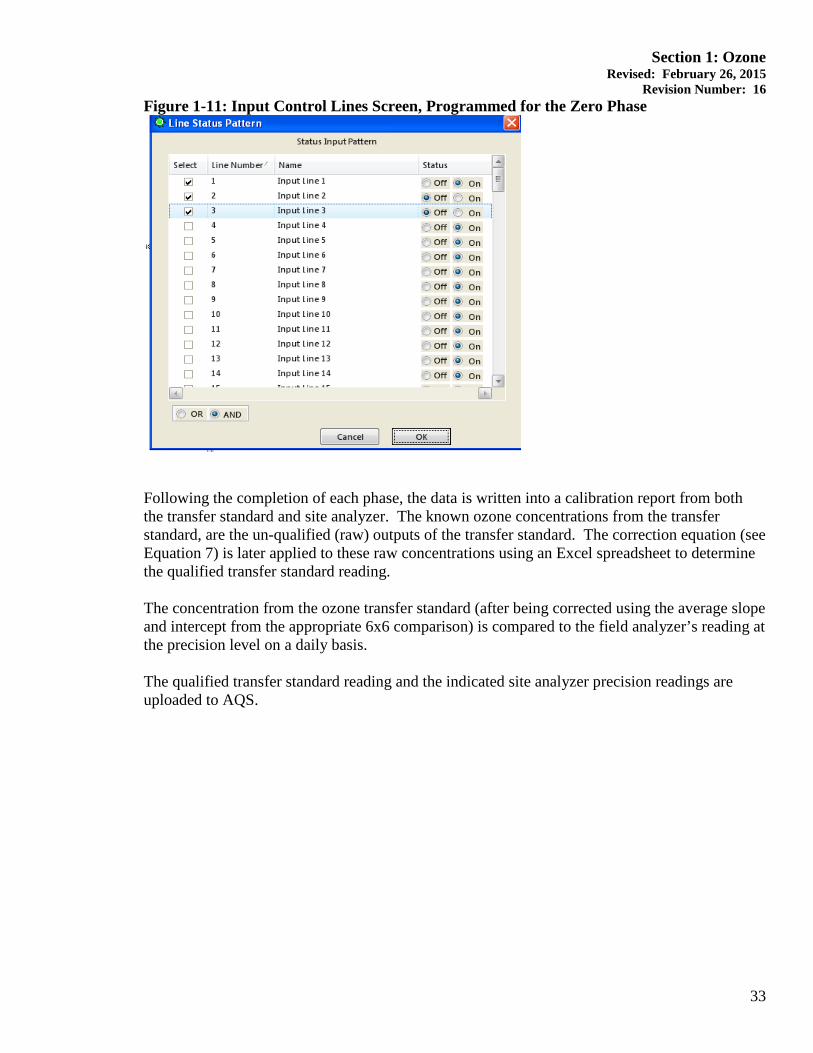
Section 1: Ozone Revised: February 26, 2015
Revision Number: 16 Figure 1-11: Input Control Lines Screen, Programmed for the Zero Phase
Following the completion of each phase, the data is written into a calibration report from both the transfer standard and site analyzer. The known ozone concentrations from the transfer standard, are the un-qualified (raw) outputs of the transfer standard. The correction equation (see Equation 7) is later applied to these raw concentrations using an Excel spreadsheet to determine the qualified transfer standard reading. The concentration from the ozone transfer standard (after being corrected using the average slope and intercept from the appropriate 6x6 comparison) is compared to the field analyzer’s reading at the precision level on a daily basis. The qualified transfer standard reading and the indicated site analyzer precision readings are uploaded to AQS.
33

Section 1: Ozone Revised: February 26, 2015
Revision Number: 16
Table 1-1: Measurement Quality Objectives
34
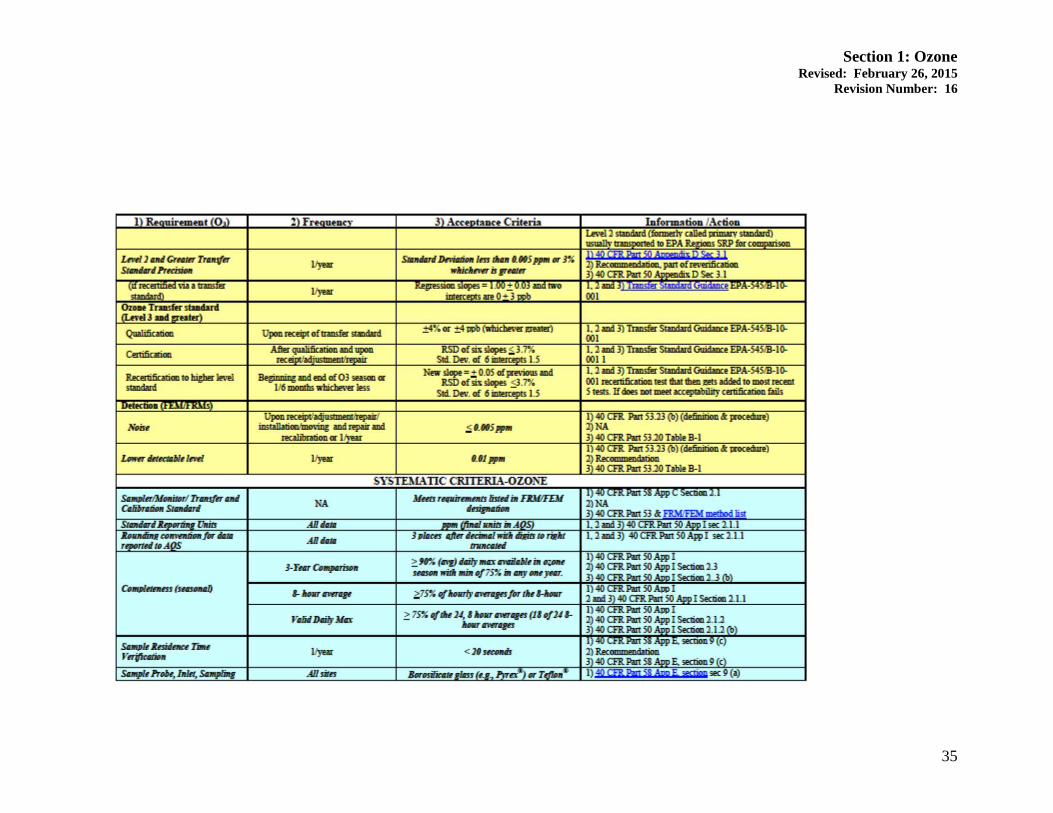
Section 1: Ozone Revised: February 26, 2015
Revision Number: 16
35
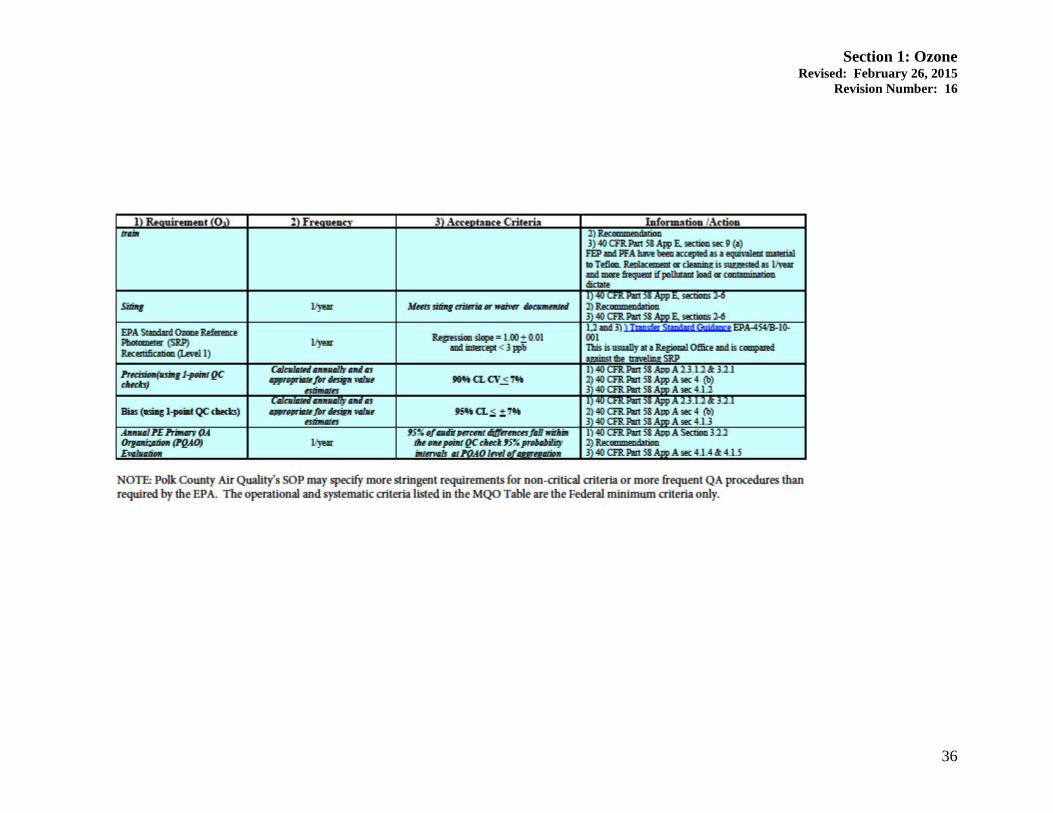
Section 1: Ozone Revised: February 26, 2015
Revision Number: 16
36

Section 1: Ozone Revised: February 26, 2015
Revision Number: 16
APPENDIX A-Critical Forms and Field Sheets
Form 1………………………Annual Ozone Primary Standard Correction Worksheet Form 2………………………1x6 Averages Worksheet for Certification of Ozone Transfer Standards Form 3………………………(1x6) & (6x6) Linear Regression Form 4………………………Calibration Field Sheet Form 5………………………Calibration Linear Regression Form 6………………………Zero/Precision/Span Field Sheet Form 7………………………Audit Field Sheet Form 8………………………Corrective Action Form
37

Section 1: Ozone Revised: February 26, 2015
Revision Number: 16 Form 1 – Annual Ozone Primary Standard Correction Worksheet
SRP13 820631079TEI 49i 1.008
Yes -0.8Yes 500
EPA Cert. Date: SRP (ppb) PS (ppb)7/7/11 421.7 425.1 m I r2
7/7/11 322.1 325.0 1.006429 0.699677 0.9999997/7/11 223.0 225.07/7/11 123.5 124.97/7/11 73.9 75.07/7/11 33.8 35.07/7/11 0.1 0.77/8/11 422.9 425.3 m I r2
7/8/11 322.9 325.1 1.005151 0.473663 0.9999957/8/11 223.2 225.17/8/11 123.6 125.07/8/11 74.0 75.07/8/11 34.0 34.07/8/11 0.0 0.67/11/11 423.6 425.4 m I r2
7/11/11 323.8 325.1 1.004042 0.175617 0.9999987/11/11 223.5 225.07/11/11 124.4 125.07/11/11 74.3 75.07/11/11 34.8 35.07/11/11 0.7 0.77/12/11 421.3 425.1 m I r2
7/12/11 322.2 325.1 1.006442 0.999158 0.9999997/12/11 222.6 225.07/12/11 123.0 125.07/12/11 73.5 75.07/12/11 33.8 35.07/12/11 -0.2 0.77/13/11 421.1 425.1 m I r2
7/13/11 322.1 325.0 1.007660 0.647214 0.9999987/13/11 222.6 225.07/13/11 123.5 125.07/13/11 73.7 75.07/13/11 33.8 35.07/13/11 0.3 0.77/14/11 422.0 425.0 m I r2
7/14/11 322.1 325.1 1.004317 1.303584 0.9999867/14/11 222.8 225.07/14/11 123.6 125.07/14/11 73.6 75.07/14/11 34.4 37.0 m6x7 I6x7 r2
6x7
7/14/11 0.1 0.8 1.005673 0.716486 0.999996
Annual Ozone Primary Standard Correction WorksheetStd. Ref. Photometer (SRP) ID: Primary Standard (PS) Serial No:PS Make/Model No: PS Span Coeff. (SP) During EPA Cert.*:
Calculations
PS Temperature Correction On? PS Background Coeff. (BC) (ppb) During EPA PS Pressure Correction On? Full Scale Range for PS (ppb):
Initial Ozone Primary Standard Correction
38
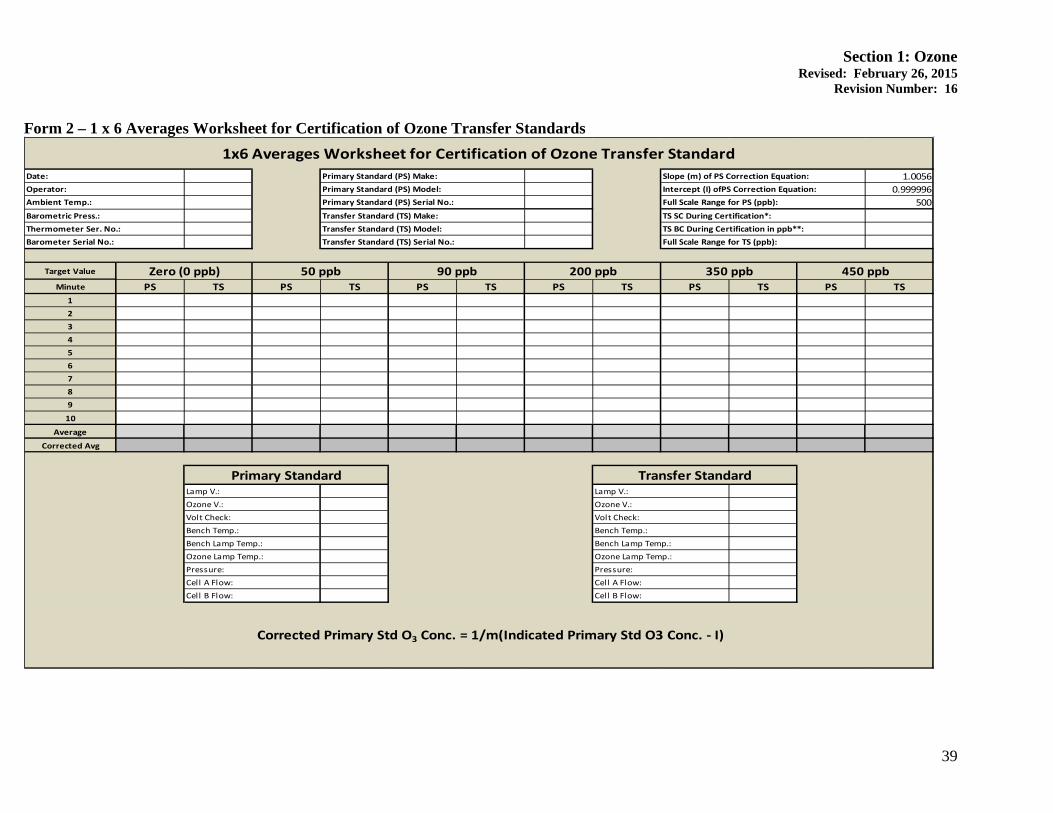
Section 1: Ozone Revised: February 26, 2015
Revision Number: 16
Form 2 – 1 x 6 Averages Worksheet for Certification of Ozone Transfer Standards
1.00560.999996
500
Target Value
Minute PS TS PS TS PS TS PS TS PS TS PS TS123456789
10
Average
Corrected Avg
1x6 Averages Worksheet for Certification of Ozone Transfer StandardDate: Primary Standard (PS) Make: Slope (m) of PS Correction Equation:Operator: Primary Standard (PS) Model: Intercept (I) ofPS Correction Equation:Ambient Temp.: Primary Standard (PS) Serial No.: Full Scale Range for PS (ppb):
Barometric Press.: Transfer Standard (TS) Make: TS SC During Certification*:
Primary Standard Transfer Standard
450 ppb
Thermometer Ser. No.: Transfer Standard (TS) Model: TS BC During Certification in ppb**:Barometer Serial No.: Transfer Standard (TS) Serial No.: Full Scale Range for TS (ppb):
Zero (0 ppb) 50 ppb 90 ppb 200 ppb 350 ppb
Lamp V.:Ozone V.:Volt Check:
Lamp V.:Ozone V.:Volt Check:
Bench Temp.:Bench Lamp Temp.:Ozone Lamp Temp.:
Bench Temp.:Bench Lamp Temp.:Ozone Lamp Temp.:
Corrected Primary Std O3 Conc. = 1/m(Indicated Primary Std O3 Conc. - I)
Pressure:Cell A Flow:Cell B Flow:
Pressure:Cell A Flow:Cell B Flow:
39
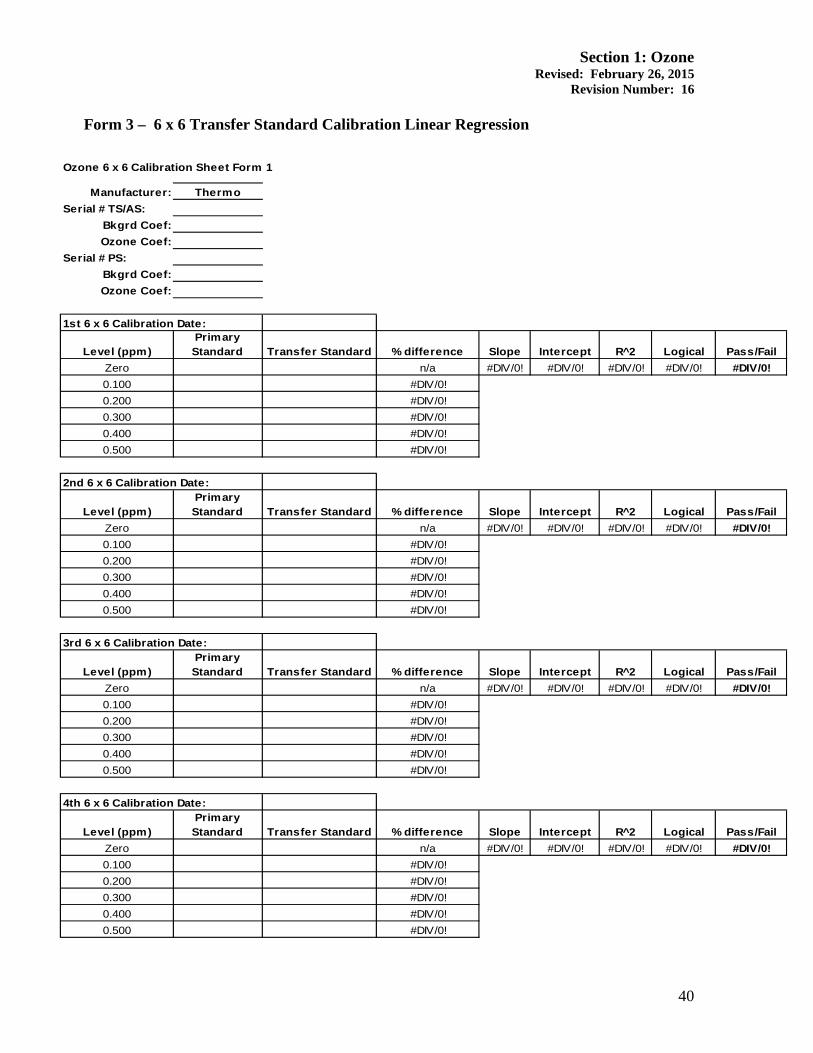
Section 1: Ozone Revised: February 26, 2015
Revision Number: 16
Form 3 – 6 x 6 Transfer Standard Calibration Linear Regression Ozone 6 x 6 Calibration Sheet Form 1
Manufacturer: ThermoSerial # TS/AS:
Bkgrd Coef:Ozone Coef:
Serial # PS:Bkgrd Coef:Ozone Coef:
Level (ppm)Primary Standard Transfer Standard % difference Slope Intercept R^2 Logical Pass/Fail
Zero n/a #DIV/0! #DIV/0! #DIV/0! #DIV/0! #DIV/0! 0.100 #DIV/0! 0.200 #DIV/0! 0.300 #DIV/0! 0.400 #DIV/0!0.500 #DIV/0!
Level (ppm)Primary Standard Transfer Standard % difference Slope Intercept R^2 Logical Pass/Fail
Zero n/a #DIV/0! #DIV/0! #DIV/0! #DIV/0! #DIV/0!0.100 #DIV/0! 0.200 #DIV/0! 0.300 #DIV/0! 0.400 #DIV/0!0.500 #DIV/0!
Level (ppm)Primary Standard Transfer Standard % difference Slope Intercept R^2 Logical Pass/Fail
Zero n/a #DIV/0! #DIV/0! #DIV/0! #DIV/0! #DIV/0!0.100 #DIV/0! 0.200 #DIV/0! 0.300 #DIV/0! 0.400 #DIV/0!0.500 #DIV/0!
Level (ppm)Primary Standard Transfer Standard % difference Slope Intercept R^2 Logical Pass/Fail
Zero n/a #DIV/0! #DIV/0! #DIV/0! #DIV/0! #DIV/0!0.100 #DIV/0! 0.200 #DIV/0! 0.300 #DIV/0! 0.400 #DIV/0!0.500 #DIV/0!
1st 6 x 6 Calibration Date:
2nd 6 x 6 Calibration Date:
3rd 6 x 6 Calibration Date:
4th 6 x 6 Calibration Date:
40
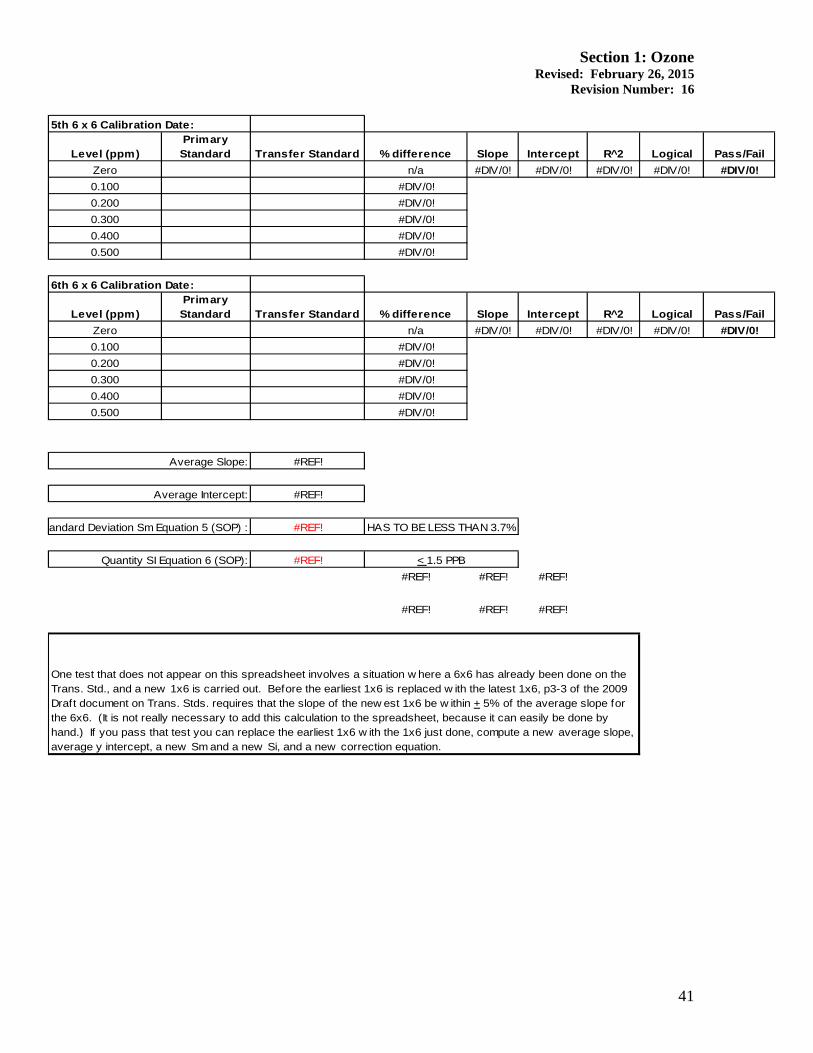
Section 1: Ozone Revised: February 26, 2015
Revision Number: 16
Level (ppm)Primary Standard Transfer Standard % difference Slope Intercept R^2 Logical Pass/Fail
Zero n/a #DIV/0! #DIV/0! #DIV/0! #DIV/0! #DIV/0!0.100 #DIV/0! 0.200 #DIV/0! 0.300 #DIV/0! 0.400 #DIV/0!0.500 #DIV/0!
Level (ppm)Primary Standard Transfer Standard % difference Slope Intercept R^2 Logical Pass/Fail
Zero n/a #DIV/0! #DIV/0! #DIV/0! #DIV/0! #DIV/0!0.100 #DIV/0! 0.200 #DIV/0! 0.300 #DIV/0! 0.400 #DIV/0!0.500 #DIV/0!
#REF!
#REF!
#REF!
#REF!#REF! #REF! #REF!
#REF! #REF! #REF!
HAS TO BE LESS THAN 3.7%
5th 6 x 6 Calibration Date:
6th 6 x 6 Calibration Date:
One test that does not appear on this spreadsheet involves a situation w here a 6x6 has already been done on the Trans. Std., and a new 1x6 is carried out. Before the earliest 1x6 is replaced w ith the latest 1x6, p3-3 of the 2009 Draft document on Trans. Stds. requires that the slope of the new est 1x6 be w ithin + 5% of the average slope for the 6x6. (It is not really necessary to add this calculation to the spreadsheet, because it can easily be done by hand.) If you pass that test you can replace the earliest 1x6 w ith the 1x6 just done, compute a new average slope, average y intercept, a new Sm and a new Si, and a new correction equation.
Average Intercept:
Average Slope:
andard Deviation Sm Equation 5 (SOP) :
Quantity SI Equation 6 (SOP): < 1.5 PPB
41

Section 1: Ozone Revised: February 26, 2015
Revision Number: 16 Form 4 – Calibration Field Sheet Ozone Calibration Sheet Site_________________________ 1) Routine Site Information 2) Diagnostic Check (Site Analyzer)
Date/Time
Alarm Value Corrective Action
Operator/Auditor
Voltages
Analyzer Serial #: Date of Last Calibration:
Bench Temp (5 – 50°C)
Transfer Standard Serial #: Date of Last Calibration:
Bench Lamp (50 – 60°C)
Zero Air Serial #: Date of Last Calibration:
Pressure (200-1000 mmHg)
Station Observations Made Y or N Flow (0.4 – 1.6 LPM)
A B
Moisture Trap Checked
Y or N Intensities (Hz) (100,000-150,000)
A B
Changed Filter on site Analyzer, If “Y” condition filter @0.200ppm for 30 min.
Y or N
Clock Synced to Data Logger Y or N Level 4 (~ 0.200 ppm)
Ozone Transfer Standard
Sample Line Checked Y or N 1 Temperature Probe Verification: A.S. Temp. Celsius 2 Site Temp. Celsius 3 Transfer Standard Internal Pressure =>10psi 4 5 6 Background Coef. (Site Analyzer) 7 Ozone Coef. (Site Analyzer) 8 9 Reading (ppm) 10 Ambient Time: Total Average Qualified Average %Difference
3)Zero Air Check 4) Level 1 (~ 0.050 ppm) 5) Level 2 (~ 0.100 ppm) 6) Level 3 (~0.150 ppm) Ozonator (%):__________ Ozonator (%):_________ Ozonator (%):_________
3) Ozone
TS
4) Ozone
TS
5) Ozone
TS.
6) Ozone
TS
1. 1. 1. 1.
2. 2. 2. 2. 3. 3. 3. 3. 4. 4. 4. 4. 5. 5. 5. 5. 6. 6. 6. 6. 7. 7. 7. 7. 8. 8. 8. 8. 9. 9. 9. 9.
10. 10. 10. 10.
Total:
Total:
Total:
Total:
Average: Average: Average: Average:
Qual. O3 Qual. O3 Qual. O3 Qual. O3
% diff. % diff. % diff. % diff.
A multi point calibration must be performed once every 12 months including zero and 4 upscale points. Perform a linear regression analysis on calibration concentrations. All points should fall within + 2% of full scale of best fit straight line. Use Form 2, Appendix A from Polk County SOP Section 1-Ozone. For Qualified Ozone: use Equation 7 from Section 1.8 –SOP –Ozone.
)(133 IionConcentratIndicatedO
mQualifiedO −= Current AS (6x6) slope(m)___________Intercept(I)_________
DifferenceXSAverageQualifiedA
XSAverageQualifiedAYAveragesDataLogger ______%100)(
)()(=×
−
42

Section 1: Ozone Revised: February 26, 2015
Revision Number: 16 Form 5 – Site Analyzer Calibration Linear Regression
EXAMPLE Ozone Multi-Point CalibrationSite Analyzer
Analyzer: TECO 49C BKG -2.8Site: Phillips Ozone 03 Coef. 1.052Date: May 12, 2005 TS Serial# 49c-54956-302Site Serial# 49c-60343-328
LevelTS
(ppm)Qualified TS
(ppm)Site Analyzer
(ppm) rpd slope intercept R^2 logical Pass/FailZero 0.001 0.000 0.002 n/a 1.010442 0.00286 0.999973 TRUE PASS
1 0.062 0.061 0.065 6.9% 2 0.113 0.111 0.116 4.3% 3 0.239 0.236 0.241 2.2% 4 0.382 0.377 0.385 2.1% 5 0.476 0.470 0.477 1.4% TS Qualified
logical = acceptance criteria for multipoint curve slope 1.01120Intercept 0.00053
Acceptance Criteria: 0.9<=slope<=1.1(ppm) 0.01>=intercept>=-0.01
rsq>=0.995
Monitor Reading (ppm) vs Transfer/Audit Standard (ppm)
y = 1.0104x + 0.0029R2 = 1
00.10.20.30.40.50.6
0.000 0.050 0.100 0.150 0.200 0.250 0.300 0.350 0.400 0.450 0.500
Transfer/Audit Standard (ppm)
Mon
itor R
eadi
ng (p
pm)
Series1Linear (Series1)
43

Section 1: Ozone Revised: February 26, 2015
Revision Number: 16
Form 6- Ozone Field Sheet Ozone Field Sheet Site:____________________
1)Routine Site Information
Date/Time:___________________________________ Operator:____________________________________
Mak
e ad
just
men
ts p
er se
rvic
e m
anua
l
2) Diagnostic Check ALARMS DETECTED:
Site Analyzer Serial #:__________________________ Alarm Value Corrective Action
Date of Last Calibration:________________________ TS Serial #:___________________________________ Date of Last Calibration:________________________ Zero Air Serial #:______________________________
Voltages Consult Manual
Last Annual Maintenance:______________________ Bench Temp (5 – 50°C) Consult Manual
Station Observations Made (Y or N)
Changed Filter? (Y or N) If “Y” condition filter @ 0.200 ppm ozone for 30minutes
Bench Lamp (50 – 60°C) Consult Manual
Moisture Trap Checked? (Y or N) Pressure (200-1000 mmHg) Replace pressure
transducer Sample Line Checked? (Y or N) Is Temp. Probe Operational? (Y or N) TS Internal pressure 10 psi? (Y or N)
Flow (0.4 – 1.6 LPM)
A Replace pump Replace flow sensor Clock Synced to Data Logger (Y or N) B
Reading (ppm):____________________________ Intensities (Hz) (100,000-150,000)
A Adjust lamp setting Replace O3 lamp Replace bench detector 1) Record Bkgrd Coef:______________________ B
2) Record Ozone Coef:______________________ Leak Check (Flow = 0; Pressure <250 mmHg)
Locate leak Replace solenoid valves Replace capillaries Ambient: ________________________
Date Last Zero/Prec/SpanCheck________Days_______ 3) Zero Air Check 4) Precision Check (.060-.100ppm) 5) Span Check (.175-.225ppm)
Ozonator Level 1 (%):__________ Ozonator Level 2 (%):________ Prev. Week % Difference:__________ Prev. Week % Drift:_________
3) Ozone
(Indicated) Reading
T.S.
(Actual) Reading
4) Ozone
(Indicated) Reading
T.S. (Actual) Reading
5) Ozone
(Indicated) Reading
T.S. (Actual) Reading
1. 1. 1. 2. 2. 2. 3. 3. 3. 4. 4. 4. 5. 5. 5. 6. 6. 6. 7. 7. 7. 8. 8. 8. 9. 9. 9.
10. 10. 10.
Total: Total: Total:
Average: Average: Average:
Qual. O3 Qual. O3 Qual. O3
Drift % Diff. % Drift
If the difference in zero drift between the current indicated and Qualified Actual readings is outside ± 0.005 ppm, invalidate to last 0/span check and re-calibrate.
If the % difference between the current Indicated and Qualified Actual readings is outside + 7% invalidate to last 0/span check and recalibrate.
If the difference in span drift between the current Indicated and Qualified Actual readings is outside ± 7%, invalidate to last 0/span check and re-calibrate.
Qualified Ozone: Use Equation 7 from section 1.8 –SOP –Ozone
)(133 IConcransStndOIndicatedT
mConcransStndOQualifiedT −= Current (6x6) slope(m)_________Intercept(I)________
DifferenceXConcransStndOQualifiedT
XConcransStndOQualifiedTYAveragesDataLogger ______%100)(
)()(
3
3 =×−
44
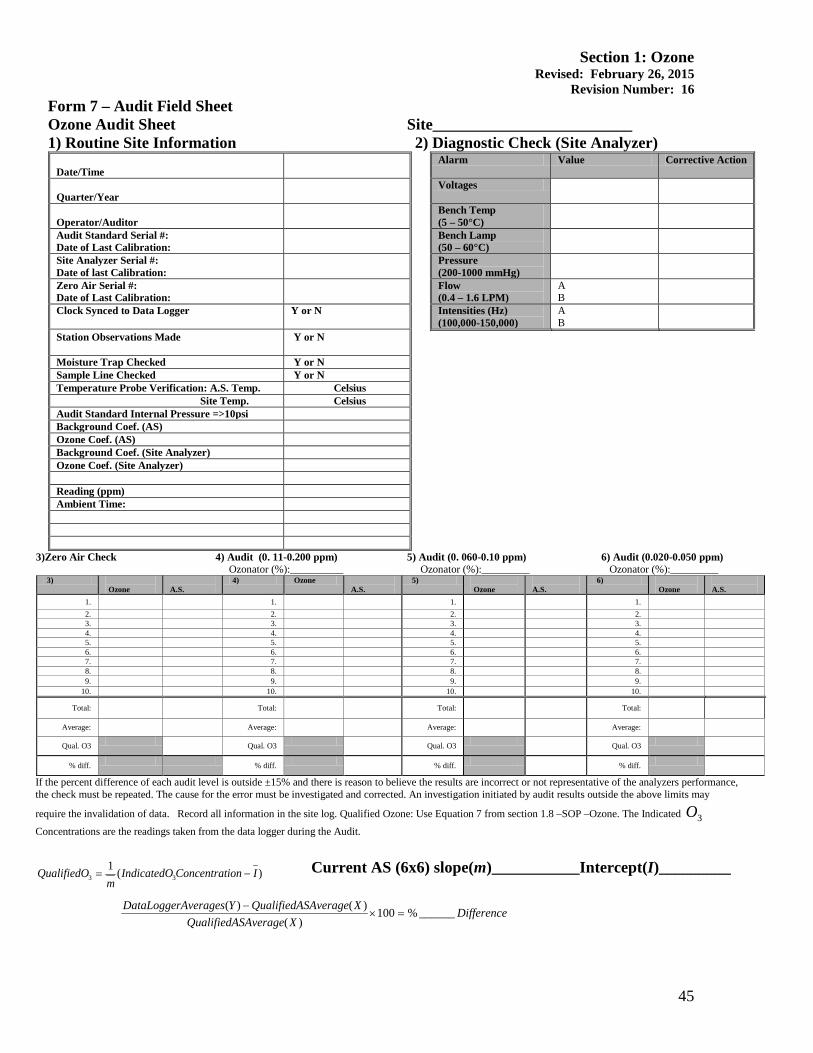
Section 1: Ozone Revised: February 26, 2015
Revision Number: 16 Form 7 – Audit Field Sheet Ozone Audit Sheet Site_________________________ 1) Routine Site Information 2) Diagnostic Check (Site Analyzer)
Date/Time
Alarm Value Corrective Action
Quarter/Year
Voltages
Operator/Auditor
Bench Temp (5 – 50°C)
Audit Standard Serial #: Date of Last Calibration:
Bench Lamp (50 – 60°C)
Site Analyzer Serial #: Date of last Calibration:
Pressure (200-1000 mmHg)
Zero Air Serial #: Date of Last Calibration:
Flow (0.4 – 1.6 LPM)
A B
Clock Synced to Data Logger Y or N Intensities (Hz) (100,000-150,000)
A B
Station Observations Made Y or N
Moisture Trap Checked Y or N Sample Line Checked Y or N Temperature Probe Verification: A.S. Temp. Celsius Site Temp. Celsius Audit Standard Internal Pressure =>10psi Background Coef. (AS) Ozone Coef. (AS) Background Coef. (Site Analyzer) Ozone Coef. (Site Analyzer) Reading (ppm) Ambient Time:
3)Zero Air Check 4) Audit (0. 11-0.200 ppm) 5) Audit (0. 060-0.10 ppm) 6) Audit (0.020-0.050 ppm) Ozonator (%):__________ Ozonator (%):_________ Ozonator (%):_________
3) Ozone
A.S.
4) Ozone A.S.
5) Ozone
A.S.
6) Ozone
A.S.
1. 1. 1. 1.
2. 2. 2. 2. 3. 3. 3. 3. 4. 4. 4. 4. 5. 5. 5. 5. 6. 6. 6. 6. 7. 7. 7. 7. 8. 8. 8. 8. 9. 9. 9. 9.
10. 10. 10. 10.
Total:
Total:
Total:
Total:
Average: Average: Average: Average:
Qual. O3 Qual. O3 Qual. O3 Qual. O3
% diff. % diff. % diff. % diff.
If the percent difference of each audit level is outside ±15% and there is reason to believe the results are incorrect or not representative of the analyzers performance, the check must be repeated. The cause for the error must be investigated and corrected. An investigation initiated by audit results outside the above limits may
require the invalidation of data. Record all information in the site log. Qualified Ozone: Use Equation 7 from section 1.8 –SOP –Ozone. The Indicated 3O
Concentrations are the readings taken from the data logger during the Audit.
)(133 IionConcentratIndicatedO
mQualifiedO −= Current AS (6x6) slope(m)___________Intercept(I)_________
DifferenceXSAverageQualifiedA
XSAverageQualifiedAYAveragesDataLogger ______%100)(
)()(=×
−
45

Section 1: Ozone Revised: February 26, 2015
Revision Number: 16 Form 8 – Corrective Action Form
Polk County Air Quality - Corrective Action Form
To: Polk County Air Quality (position) From: Copies of completed form to: AQ Supervisor, File Urgency: Emergency (immediate action needed) Urgent (24 Hr.) Routine (7 days) Next scheduled visit Information only Problem Identification: Site: System: Date: Description of Problem: Recommended Action: Signature of Initiator: Date: Problem Resolution: Date of Corrective Action: Summary of Corrective Action: Result of Corrective Action: Signature of Resolver: Date: Signature of QA Officer: ___________________________________ Date: _____________________
46
Section 1: Ozone Revised: February 26, 2015
Revision Number: 16 Appendix B: Instructions for Using the Annual Ozone
Primary Standard Correction Spreadsheet
Note: The Annual Ozone Primary Standard Correction Spreadsheet, and following instructions, originated from the IDNR.
• References and General Terminology Used in Definitions:
TAD: Refers to EPA’s November 2010 Final Technical Assistance Document entitled “Transfer Standards for Calibration of Air Monitoring Analyzers for Ozone”. This document is available at the following web link: http://www.epa.gov/ttnamti1/files/ambient/qaqc/OzoneTransferStandardGuidance.pdf
• Definition of Terms at the Top of Page 1 of the Spreadsheet:
Standard Reference Photometer (SRP) ID: SRP denotes EPA Region 7’s standard reference photometer.
Primary Standard (PS) Serial No: the phrase “primary standard” denotes the Polk County primary standard(s) which are taken to Kansas City and certified against EPA’s Region 7 standard.
PS Make/Model No: The manufacturer and manufacturer’s model number of the primary standard (for example, Thermo 49i-PS).
PS Temperature Correction On? Indicate “Yes”, “No”, or “Not Applicable”. This refers to the temperature correction or compensation feature found on some primary standards.
PS Pressure Correction On? Indicate “Yes”, “No”, or “Not Applicable”. This refers to the pressure correction or compensation feature found on some primary standards.
PS Span Coeff. (SP) During EPA Cert.: is the span coefficient for the primary standard when it is certified against the SRP, and used during the forthcoming ozone season.
PS Background Coeff. (BC) (ppb) During EPA Cert.: is the background coefficient for the primary standard when it is certified against the SRP, and used during the forthcoming ozone season.
Full Scale Range for PS (ppb): is the full scale range for the primary standard. If the full scale range was 500 ppb at the time the Primary standard was compared to EPA Region VII’s standard, and the “6x6” comparison performed by Polk County only uses a 250 ppb range, the full scale range for the primary standard is still 500 ppb.
EPA Cert. Date: The date of a “6x7” run, where the primary standard is compared once against the SRP at zero and six non-zero concentration levels.
47
Section 1: Ozone Revised: February 26, 2015
Revision Number: 16 SRP (ppb): Each cell below this heading represents the average of 10 readings from the SRP.
PS (ppb): Each cell below this heading represents the average of 10 readings from the primary standard.
• Definition of Terms in the Calculations Part of the Spreadsheet:
Note: Cell labels are presented in the order that they appear, going from left to right in the first tier; and then going from left to right in the second tier.
m: is the slope of a “1x7” run, where the primary standard is compared once against the SRP at zero and six non-zero concentration levels.
I: is the “Y intercept” of a “1x7” run, where the primary standard is compared once against the SRP at zero and six non-zero concentration levels.
r2: is the “r-squared value” (Pearson product moment correlation coefficient) of a “1x7” run, where the primary standard is compared once against the SRP at zero and six non-zero concentration levels. Note: this number is not used as acceptance criteria, but may be useful in trouble shooting.
m6x7: is the average of the slopes from the six most recent “1x7” runs
I6x7: is the average of the “Y intercepts” from the six most recent “1x7” runs
r26x7: is the average of the “r-squared values” from the six most recent “1x7” runs
• Procedure:
This spreadsheet is to be used after the primary standard is returned from EPA, where it was compared to Region 7’s standard reference photometer (SRP). The comparison concentrations from the EPA certification letter will be used to correct the raw output of the primary standard to better match the SRP. One reason for correcting the primary standard values is if the need ever arises to switch from the primary PA to a back-up PS. If the two primary standards were certified at opposite ends of the EPA’s acceptable limits, the portable transfer standards might lose their certification as a result of the transition between primary standards.
When EPA Region 7 certifies a primary standard against their SRP, the certification may be done on a single day, or EPA may do 6 separate comparisons on 6 separate days. Assuming the comparison involves zero and six non-zero points; the single day comparison could be referred to as a “1x7” comparison. (A “1x7” comparison is made by plotting the readings of the SRP on the X axis, and the readings from the primary standard on the Y axis.) An aggregation of the six “1x7” comparisons done on 6 different days will be designated as a “6x7” comparison. EPA is more likely to perform the “6x7" type of certification on new primary standards, or primary standards being returned to EPA for certification for the first time after substantive repairs, or those that have had their span or background coefficients changed since the last EPA certification.
48

Section 1: Ozone Revised: February 26, 2015
Revision Number: 16 • If EPA has performed a 6x7 certification of the primary standard, the average of the six
slopes, and average of the six y intercepts, will be used to correct that primary standard for the forthcoming ozone season.
• If EPA has only performed a 1x7 certification of the lab standard in that year, the most recent 1x7 data results will be substituted for the oldest 1x7 data results in the 6x7 linear regression analysis, such that the average of six slopes and the average of six intercepts will always be used to correct the PS for the ozone season.
Ordinarily the span and background coefficients will never be adjusted on the primary standard, but their values should be entered on the “Annual Ozone Primary Standard Correction Worksheet” and verified each year. The rare circumstances where the span and background coefficients on the primary standard might be adjusted are: when a brand new primary standard is received from the manufacturer, after failure to meet EPA’s acceptance criteria for certification against the SRP, or after major repairs. When either the span or background coefficient of the primary standard is permanently changed, the current certification will be rendered invalid. To obtain (or regain) certification from EPA in these scenarios, EPA may require 6 separate comparisons on 6 separate days. Then, the average of the six slopes, and average of the six y intercepts, will be used to correct the primary standard for the forthcoming ozone season.
The primary standard will be corrected “externally”. It will not be corrected by attempting to “program” the correction equation into its zero and span coefficients. The Excel sheet labeled “1x6 Averages Worksheet for Certification of Ozone Transfer Standard” will convert the readings of the primary standard when the slope and intercept [derived from comparison(s) of the primary standard against EPA’s SRP] of the primary standard correction equation are entered into the two cells in the extreme upper right corner.
The formula used by the “1x6 Averages Worksheet for Certification of Ozone Transfer Standard” is:
Corrected Primary Standard conc. = 1/m (Indicated Primary Standard conc. – I).
49

Section 1: Ozone Revised: February 26, 2015
Revision Number: 16 Appendix C: Instructions for Using the 1x6 Averages
Worksheet for Certification of Ozone Transfer Standards Spreadsheet
Note: The 1x6 Averages Worksheet for Certification of Ozone Transfer Standards Spreadsheet, and the following instructions, originated from the IDNR.
• Definition of key terms from upper right block:
Slope (m) of PS Correction Equation: is obtained from the “Annual Ozone Primary Standard Correction” Spreadsheet.
Intercept (I) of PS Correction Equation: is obtained from the “Annual Ozone Primary Standard Correction” Spreadsheet.
Full Scale Range for PS (ppb): is the full scale range for the primary standard. If the full scale range was 500 ppb at the time the primary standard was compared to EPA Region 7’s standard, and the “6x6” comparison performed by Polk County only uses a 250 ppb range, the full scale range for the primary standard is still 500 ppb.
TS SC During Certification: the span coefficient for the transfer standard during certification as well as when it’s used in the field. Span coefficients are typically near 1.
TS BC During Certification in ppb: the background coefficient for the transfer standard during certification as well as when it’s used in the field. Background coefficients are typically near 0.
Full Scale Range for TS (ppb): is the full scale range for the transfer standard.
• Definition of key terms from middle block:
Primary Std.: Enter raw (uncorrected) 5 minute averages from the LCD display of the primary standard (or its analog or digital outputs) in this column.
Transfer Std.: Enter raw (uncorrected) 5 minute averages from the LCD display of the transfer standard (or its analog or digital outputs) in this column.
Average: This row simply averages the ten “one minute” averages for each column. If a data logger is used to obtain a ten minute average, that average from the data logger can be inserted into this row with the preceding 10 rows left blank.
Corrected Average: The two “five minute” averages from the primary standard are corrected using the “Primary Standard Correction Equation” indicated at the bottom of the spreadsheet. The two “five minute” averages for the transfer standard are simply repeated (unchanged). The
50

Section 1: Ozone Revised: February 26, 2015
Revision Number: 16 averages from these rows should be entered into "Form 3 – 6 x 6 Transfer Standard Calibration Linear Regression" in the column labeled “Primary Standard”.
• Procedure:
This worksheet is used for comparison of the transfer standard to the primary standard during each individual 1x6 run. The corrected primary standard ten minute averages, and uncorrected transfer standard ten minute averages, are taken from this worksheet and transferred to “Form 3 – 6 x 6 Transfer Standard Calibration Linear Regression”.
51