stakeholders empowerment services raj ... empowerment services raj rayon industries ltd. =
TRANSCRIPT
Stakeholders’ Education | Corporate Governance Research | Corporate Governance Score | Proxy Advisory
STAKEHOLDERS EMPOWERMENT SERVICES
1 | P A G E
SECTOR: TEXTILES REPORTING DATE: 24TH JANUARY, 2018
RAJ RAYON INDUSTRIES LTD. www.rajrayon.com
Raj Rayon Industries Ltd. NSE Code - RAJRAYON TABLE 1 - MARKET DATA (STANDALONE) (AS ON 23rd JANUARY, 2018)
Sector - Textiles NSE Market Price (`) 0.65 NSE Market Cap. (₹ Cr.) 19.40
Face Value (`) 1.00 Equity (` Cr.) 34.65
Business Group – N.A. 52 weeks High/Low (₹) 0.85/0.10 Net worth (₹ Cr.)* -463.23
Year of Incorporation - 1993 TTM P/E (TTM) N.A. Traded Volume (Shares) 1,32,526
TTM P/BV N.A. Traded Volume (lacs) 0.86
Registered Office - Source - Capitaline, TTM - Trailing Twelve Months, N.A. - Not Applicable, *As on 30th September, 2017
Survey No. 177/1/3, COMPANY BACKGROUND
Village – Surangi, Silvassa, Raj Rayon Industries Limited is engaged in manufacturing textured yarn of polyesters and
polyesters chips. The Company is also engaged in manufacturing of Polyester Texturized
Yarn (PTY), Partially Oriented Yarn (POY) and Fully Drawn Yarn (FDY).
The Company's plants are designed to produce a range of specialty yarns, such as Bright
Yarns (Trilobal), Cationic Yarn, Cotluk (Full Dull), Coloured Yarns (Dope Dyed), yarns of
various cross sections, such as Tri-lobal and Octa-lobal, and Fire retardant and Anti-
Microbial Yarns. It offers products in various deniers and filaments, such as POY in Semi
Dull, Full Dull-Cotluk, Cationic Yarns, Dope Dyed and Micro filaments; FDY in Semi Dull, Full
Dull-Cotluk, Cationic, Trilobal Bright and Cationic Bright, and PTY in Semi Dull, Full Dull-
Cotluk, Dope Dyed, Micro Filaments, Non-Intermingle, Low/Slight Intermingle and High
Intermingle. The Company exports its products to South America, Europe, Middle East,
Africa, Far East and South-East Asia.
Dadra & Nagar Haveli - 396 230
Company Website:
www.rajrayon.com
Revenue and Profit Performance
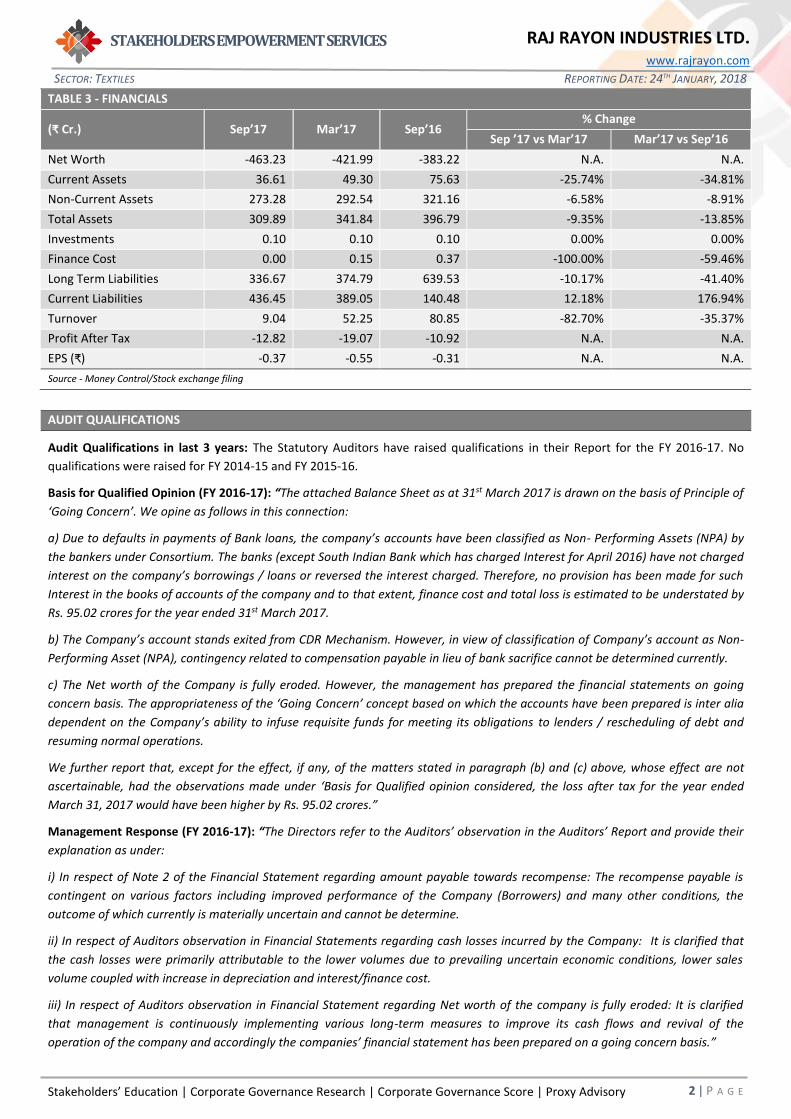
The revenue of the Company decreased from ₹80.86 crores to
₹9.04 crores from quarter ending Sep’16 to quarter ending
Sep’17. The Company made a loss of ₹12.82 crores in quarter
ending Sep’17 vis-a-vis making a loss of ₹10.92 crores in quarter
ending Sep’16.
Source: Moneycontrol
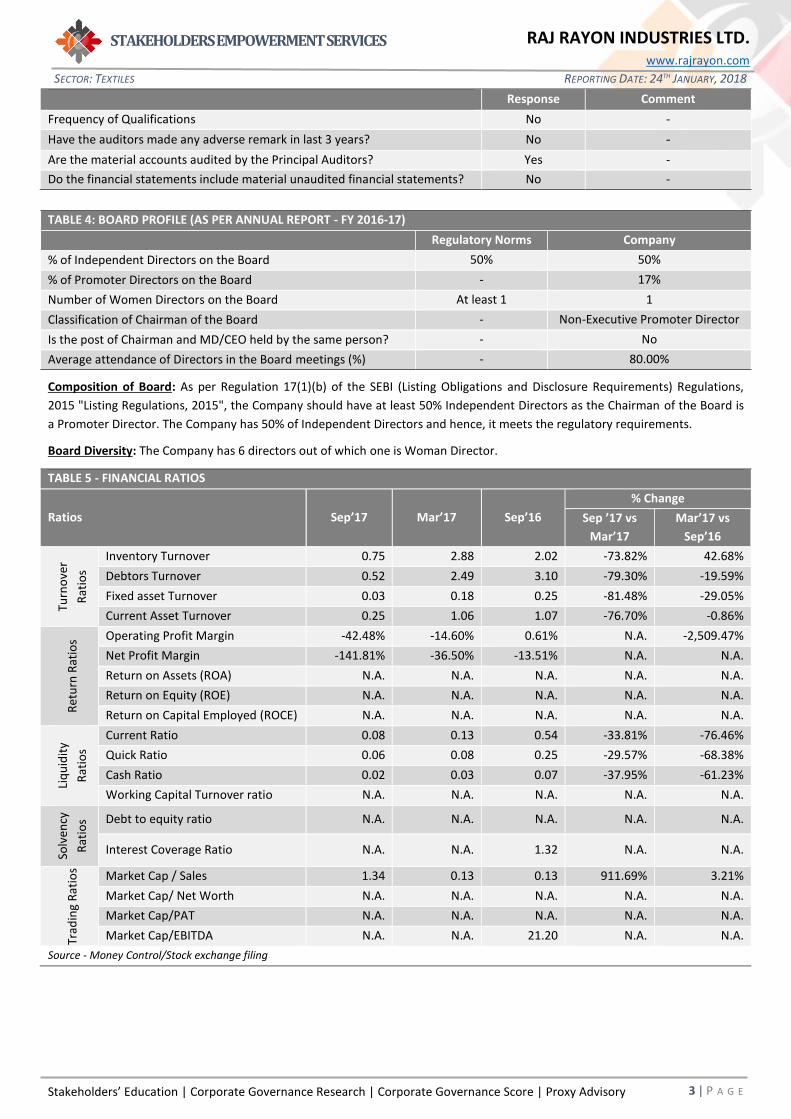
Performance vis-à-vis Market
TABLE 2- Returns
1-m 3-m 6-m 12-m
Raj Rayon
Industries Ltd. 116.67% 61.54% 160.00% 116.67%
Nifty 5.63% 6.86% 10.61% 29.46%
Source - Capitaline/NSE
9.04
52.25
80.86
-12.82
-19.07-10.92
-50
0
50
100
Sep'17 Mar'17 Sep'16
Quarterly revenue and Profit (₹ CRORE)
Revenue Profit
0.00
0.50
1.00
1.50
2.00
2.50
3.00
Jan 17 Mar 17 May 17 Jul 17 Sep 17 Nov 17 Jan 18
Raj Rayon Industries Ltd NIFTY
Stakeholders’ Education | Corporate Governance Research | Corporate Governance Score | Proxy Advisory
STAKEHOLDERS EMPOWERMENT SERVICES
2 | P A G E
SECTOR: TEXTILES REPORTING DATE: 24TH JANUARY, 2018
RAJ RAYON INDUSTRIES LTD. www.rajrayon.com
TABLE 3 - FINANCIALS
(₹ Cr.) Sep’17 Mar’17 Sep’16 % Change
Sep ’17 vs Mar’17 Mar’17 vs Sep’16
Net Worth -463.23 -421.99 -383.22 N.A. N.A.
Current Assets 36.61 49.30 75.63 -25.74% -34.81%
Non-Current Assets 273.28 292.54 321.16 -6.58% -8.91%
Total Assets 309.89 341.84 396.79 -9.35% -13.85%
Investments 0.10 0.10 0.10 0.00% 0.00%
Finance Cost 0.00 0.15 0.37 -100.00% -59.46%
Long Term Liabilities 336.67 374.79 639.53 -10.17% -41.40%
Current Liabilities 436.45 389.05 140.48 12.18% 176.94%
Turnover 9.04 52.25 80.85 -82.70% -35.37%
Profit After Tax -12.82 -19.07 -10.92 N.A. N.A.
EPS (₹) -0.37 -0.55 -0.31 N.A. N.A.
Source - Money Control/Stock exchange filing
AUDIT QUALIFICATIONS
Audit Qualifications in last 3 years: The Statutory Auditors have raised qualifications in their Report for the FY 2016-17. No
qualifications were raised for FY 2014-15 and FY 2015-16.
Basis for Qualified Opinion (FY 2016-17): “The attached Balance Sheet as at 31st March 2017 is drawn on the basis of Principle of
‘Going Concern’. We opine as follows in this connection:
a) Due to defaults in payments of Bank loans, the company’s accounts have been classified as Non- Performing Assets (NPA) by
the bankers under Consortium. The banks (except South Indian Bank which has charged Interest for April 2016) have not charged
interest on the company’s borrowings / loans or reversed the interest charged. Therefore, no provision has been made for such
Interest in the books of accounts of the company and to that extent, finance cost and total loss is estimated to be understated by
Rs. 95.02 crores for the year ended 31st March 2017.
b) The Company’s account stands exited from CDR Mechanism. However, in view of classification of Company’s account as Non-
Performing Asset (NPA), contingency related to compensation payable in lieu of bank sacrifice cannot be determined currently.
c) The Net worth of the Company is fully eroded. However, the management has prepared the financial statements on going
concern basis. The appropriateness of the ‘Going Concern’ concept based on which the accounts have been prepared is inter alia
dependent on the Company’s ability to infuse requisite funds for meeting its obligations to lenders / rescheduling of debt and
resuming normal operations.
We further report that, except for the effect, if any, of the matters stated in paragraph (b) and (c) above, whose effect are not
ascertainable, had the observations made under ‘Basis for Qualified opinion considered, the loss after tax for the year ended
March 31, 2017 would have been higher by Rs. 95.02 crores.”
Management Response (FY 2016-17): “The Directors refer to the Auditors’ observation in the Auditors’ Report and provide their
explanation as under:
i) In respect of Note 2 of the Financial Statement regarding amount payable towards recompense: The recompense payable is
contingent on various factors including improved performance of the Company (Borrowers) and many other conditions, the
outcome of which currently is materially uncertain and cannot be determine.
ii) In respect of Auditors observation in Financial Statements regarding cash losses incurred by the Company: It is clarified that
the cash losses were primarily attributable to the lower volumes due to prevailing uncertain economic conditions, lower sales
volume coupled with increase in depreciation and interest/finance cost.
iii) In respect of Auditors observation in Financial Statement regarding Net worth of the company is fully eroded: It is clarified
that management is continuously implementing various long-term measures to improve its cash flows and revival of the
operation of the company and accordingly the companies’ financial statement has been prepared on a going concern basis.”
Stakeholders’ Education | Corporate Governance Research | Corporate Governance Score | Proxy Advisory
STAKEHOLDERS EMPOWERMENT SERVICES
3 | P A G E
SECTOR: TEXTILES REPORTING DATE: 24TH JANUARY, 2018
RAJ RAYON INDUSTRIES LTD. www.rajrayon.com
Response Comment
Frequency of Qualifications No -
Have the auditors made any adverse remark in last 3 years? No -
Are the material accounts audited by the Principal Auditors? Yes -
Do the financial statements include material unaudited financial statements? No -
TABLE 4: BOARD PROFILE (AS PER ANNUAL REPORT - FY 2016-17)
Regulatory Norms Company
% of Independent Directors on the Board 50% 50%
% of Promoter Directors on the Board - 17%
Number of Women Directors on the Board At least 1 1
Classification of Chairman of the Board - Non-Executive Promoter Director
Is the post of Chairman and MD/CEO held by the same person? - No
Average attendance of Directors in the Board meetings (%) - 80.00%
Composition of Board: As per Regulation 17(1)(b) of the SEBI (Listing Obligations and Disclosure Requirements) Regulations,
2015 "Listing Regulations, 2015", the Company should have at least 50% Independent Directors as the Chairman of the Board is
a Promoter Director. The Company has 50% of Independent Directors and hence, it meets the regulatory requirements.
Board Diversity: The Company has 6 directors out of which one is Woman Director.
TABLE 5 - FINANCIAL RATIOS
Ratios Sep’17 Mar’17 Sep’16
% Change
Sep ’17 vs
Mar’17
Mar’17 vs
Sep’16
Turn
ove
r
Rat
ios
Inventory Turnover 0.75 2.88 2.02 -73.82% 42.68%
Debtors Turnover 0.52 2.49 3.10 -79.30% -19.59%
Fixed asset Turnover 0.03 0.18 0.25 -81.48% -29.05%
Current Asset Turnover 0.25 1.06 1.07 -76.70% -0.86%
Ret
urn
Rat
ios Operating Profit Margin -42.48% -14.60% 0.61% N.A. -2,509.47%
Net Profit Margin -141.81% -36.50% -13.51% N.A. N.A.
Return on Assets (ROA) N.A. N.A. N.A. N.A. N.A.
Return on Equity (ROE) N.A. N.A. N.A. N.A. N.A.
Return on Capital Employed (ROCE) N.A. N.A. N.A. N.A. N.A.
Liq
uid
ity
Rat
ios
Current Ratio 0.08 0.13 0.54 -33.81% -76.46%
Quick Ratio 0.06 0.08 0.25 -29.57% -68.38%
Cash Ratio 0.02 0.03 0.07 -37.95% -61.23%
Working Capital Turnover ratio N.A. N.A. N.A. N.A. N.A.
Solv
ency
Rat
ios Debt to equity ratio N.A. N.A. N.A. N.A. N.A.
Interest Coverage Ratio N.A. N.A. 1.32 N.A. N.A.
Trad
ing
Rat
ios
Market Cap / Sales 1.34 0.13 0.13 911.69% 3.21%
Market Cap/ Net Worth N.A. N.A. N.A. N.A. N.A.
Market Cap/PAT N.A. N.A. N.A. N.A. N.A.
Market Cap/EBITDA N.A. N.A. 21.20 N.A. N.A.
Source - Money Control/Stock exchange filing
Stakeholders’ Education | Corporate Governance Research | Corporate Governance Score | Proxy Advisory
STAKEHOLDERS EMPOWERMENT SERVICES
4 | P A G E
SECTOR: TEXTILES REPORTING DATE: 24TH JANUARY, 2018
RAJ RAYON INDUSTRIES LTD. www.rajrayon.com
TABLE 6 - TRADING VOLUME
Particulars Dec’17 June’17 Dec’16
% Change
Dec ’17 vs
June’17
June’17 vs
Dec’16
Trading Volume (shares) (avg. of 1 qtr) 2,61,814 47,907 43,515 446.50% 10.09%
Trading Volume (shares) (high in 1 qtr) 37,48,920 12,21,222 4,27,971 206.98% 185.35%
Trading Volume (shares) (low in 1 qtr) 1,002 110 2,000 810.91% -94.50%
Ratio - High/low trading volume 3,741.44 11,102.02 213.99 -66.30% 5,088.21%
Ratio - High/average trading volume 14.32 25.49 9.84 -43.83% 159.19%
Source - Capitaline
TABLE 7 (A): OWNERSHIP & MANAGEMENT RISKS
Dec-17 Jun-17 Dec-16 Comments
Shar
eho
ldin
g (%
)
Promoter shareholding 34.07 34.07 34.07 • No new equity shares issued during the period
from 1st Jan’17 to 31st Dec’17.
• No change in the promoter shareholding during
the said period.
• No change was observed in the shareholding
pattern during the said period.
• The promoters have pledged 100% of their
shareholding.
Public - Institutional
shareholding 0.41 0.41 0.41
Public - Others shareholding 65.52 65.52 65.52
Non-Promoter Non-Public
Shareholding 0.00 0.00 0.00
Source - NSE
MAJOR SHAREHOLDERS (AS ON 31st DECEMBER 2017)
S. No. Promoters Shareholding S. No. Public Shareholders Shareholding
1 Raj Money Market Limited 27.34% 1 Fine Fashion Private Limited 7.59%
2 Rajkumari Kanodia 2.65% 2 Jitendra B Salecha 4.04%
3 Sushil Kumar Kanodia 1.96% 3 Subramanian P 3.52%
4 Akanksha Jatin Mehta 0.52% 4 Sampoodevi Kailashchandra Kanodia 3.02%
5 Radheshyam Kanodia (H.U.F.) 0.49% 5 Ajaykumar Kailashchandra Kanodia 3.02%
Source - NSE
TABLE 7 (B): OWNERSHIP & MANAGEMENT RISKS
Market Activity of Promoters The promoters have not sold/bought any shares in FY 2016-17.
Preferential issue to promoters No preferential issue of shares was made to the promoters in FY 2016-17.
Preferential issue to others No preferential issue of shares was made to other shareholders during FY 2016-17.
GDRs issued by the Company The Company did not issue any GDRs during last FY 2016-17.
Issue of ESOPs The Company did not issue any shares to the employees under its ESOP Scheme in FY2016-17.
Source - Annual Report FY 2016-17
TABLE 8: PRINCIPAL BUSINESS ACTIVITIES OF THE COMPANY
Sr. No. Name and Description of main products / services % to Total turnover of the Company
1 Textured Yarn of Polyesters & Polyesters Chips 96.25
Source - Annual Report FY 2016-17
Stakeholders’ Education | Corporate Governance Research | Corporate Governance Score | Proxy Advisory
STAKEHOLDERS EMPOWERMENT SERVICES
5 | P A G E
SECTOR: TEXTILES REPORTING DATE: 24TH JANUARY, 2018
RAJ RAYON INDUSTRIES LTD. www.rajrayon.com
Glossary
Equity: The equity shares capital of the Company
Net Worth: The amount by which the Assets exceeds the liabilities excluding shareholders’ funds of the Company
Turnover: The revenue earned from the operations of the Company
EPS: Earning Per Share is net profit earned by the Company per share
𝐸𝑃𝑆 =Profit After Tax
Number of outstanding shares
P/E ratio: It is the ratio of the Company’s share price to earnings per share of the Company
𝑃/𝐸 𝑟𝑎𝑡𝑖𝑜 =Price of each share
Earnings per share
Current Assets: Cash and other assets that are expected to be converted to cash in one year
Fixed Assets: assets which are purchased for long-term use and are not likely to be converted quickly into cash, such as land,
buildings, and equipment
Total Assets: Current Assets + Fixed Assets
Investments: An investment is an asset or item that is purchased with the hope that it will generate income or appreciate in
the future.
Finance Cost: The Financing Cost (FC), also known as the Cost of Finances (COF), is the cost and interest and other charges
incurred during the year in relation to borrowed money.
Long Term Liabilities: Long-term liabilities are liabilities with a maturity period of over one year.
Current Liabilities: A company's debts or obligations that are due within one year.
Inventory Turnover ratio: Inventory Turnover is a ratio showing how many times a company's inventory is sold and replaced
over a period.
𝐼𝑛𝑣𝑒𝑛𝑡𝑜𝑟𝑦 𝑇𝑢𝑟𝑛𝑜𝑣𝑒𝑟 𝑟𝑎𝑡𝑖𝑜 =Sales Turnover
Inventory
Debtors Turnover: Accounts receivable turnover is an efficiency ratio or activity ratio that measures how many times a business
can turn its accounts receivable into cash during a period
𝐷𝑒𝑏𝑡𝑜𝑟𝑠 𝑇𝑢𝑟𝑛𝑜𝑣𝑒𝑟 𝑟𝑎𝑡𝑖𝑜 =Sales Turnover
Accounts recievables
Fixed Asset Turnover: The fixed-asset turnover ratio is a financial ratio of net sales to fixed assets
𝐹𝑖𝑥𝑒𝑑 𝐴𝑠𝑠𝑒𝑡 𝑇𝑢𝑟𝑛𝑜𝑣𝑒𝑟 𝑟𝑎𝑡𝑖𝑜 =Sales Turnover
Fixed Assets
Current Asset Turnover: The current-asset turnover ratio is a financial ratio of net sales to fixed assets
𝐶𝑢𝑟𝑟𝑒𝑛𝑡 𝐴𝑠𝑠𝑒𝑡 𝑇𝑢𝑟𝑛𝑜𝑣𝑒𝑟 𝑟𝑎𝑡𝑖𝑜 =Sales Turnover
Current Assets
Operating Profit Margin: Operating margin is a measurement of what proportion of a Company’s revenue is left over after
paying for variable costs of production such as wages, raw materials etc. It can be calculated by dividing a Company’s operating
income (also known as “operating profit”) during a given period by its sales during the same period.
𝑂𝑝𝑒𝑟𝑎𝑡𝑖𝑛𝑔 𝑃𝑟𝑜𝑓𝑖𝑡 𝑀𝑎𝑟𝑔𝑖𝑛 =Operating profit
Sales Turnover
Net Profit Margin: Net profit margin is the percentage of revenue left after all expenses have been deducted from sales
𝑁𝑒𝑡 𝑃𝑟𝑜𝑓𝑖𝑡 𝑀𝑎𝑟𝑔𝑖𝑛 =Net profit
Sales Turnover
Stakeholders’ Education | Corporate Governance Research | Corporate Governance Score | Proxy Advisory
STAKEHOLDERS EMPOWERMENT SERVICES
6 | P A G E
SECTOR: TEXTILES REPORTING DATE: 24TH JANUARY, 2018
RAJ RAYON INDUSTRIES LTD. www.rajrayon.com
Return on Assets: ROA tells you what earnings were generated from invested capital (assets)
𝑅𝑒𝑡𝑢𝑟𝑛 𝑜𝑛 𝐴𝑠𝑠𝑒𝑡𝑠 =Net profit
Total Assets
Return on equity/net worth: return on equity (ROE) is the amount of net income returned as a percentage of shareholders’
equity.
𝑅𝑒𝑡𝑢𝑟𝑛 𝑜𝑛 𝐸𝑞𝑢𝑖𝑡𝑦 =Net profit
Net worth
Return on Capital Employed: Return on capital employed (ROCE) is a financial ratio that measures a company's profitability
and the efficiency with which its capital is employed.
𝑅𝑒𝑡𝑢𝑟𝑛 𝑜𝑛 𝐶𝑎𝑝𝑖𝑡𝑎𝑙 𝐸𝑚𝑝𝑙𝑜𝑦𝑒𝑑 =Net profit
Total Debt + Equity share capital
Current ratio: The current ratio is a financial ratio that measures whether or not a firm has enough resources to pay its debts
over the next 12 months. It compares a firm's current assets to its current liabilities.
𝐶𝑢𝑟𝑟𝑒𝑛𝑡 𝑟𝑎𝑡𝑖𝑜 =Current Assets
Current Liabilities
Quick ratio: The quick ratio is a measure of how well a Company can meet its short term financial liabilities.
𝑄𝑢𝑖𝑐𝑘 𝑟𝑎𝑡𝑖𝑜 =Current Assets − Inventories
Current Liabilities
Cash ratio: The ratio of the liquid assets of a Company to its current liabilities.
𝑄𝑢𝑖𝑐𝑘 𝑟𝑎𝑡𝑖𝑜 =Current Assets − Inventories − Account Recievables
Current Liabilities
Working Capital Turnover ratio: The working capital turnover ratio is also referred to as net sales to working capital. It indicates
a Company's effectiveness in using its working capital.
𝑊𝑜𝑟𝑘𝑖𝑛𝑔 𝐶𝑎𝑝𝑖𝑡𝑎𝑙 𝑇𝑢𝑟𝑛𝑜𝑣𝑒𝑟 𝑟𝑎𝑡𝑖𝑜 =𝑆𝑎𝑙𝑒𝑠 𝑇𝑢𝑟𝑛𝑜𝑣𝑒𝑟
Current Assets − Current Liabilities
Debt to Equity ratio: The debt-to-equity ratio (D/E) is a financial ratio indicating the relative proportion of
shareholders' equity and debt used to finance a company's assets.
𝐷𝑒𝑏𝑡 𝑡𝑜 𝐸𝑞𝑢𝑖𝑡𝑦 𝑟𝑎𝑡𝑖𝑜 =𝑆ℎ𝑜𝑟𝑡 𝑇𝑒𝑟𝑚 𝐷𝑒𝑏𝑡 + 𝐿𝑜𝑛𝑔 𝑇𝑒𝑟𝑚 𝐷𝑒𝑏𝑡
𝑁𝑒𝑡 𝑊𝑜𝑟𝑡ℎ
Interest Coverage ratio: The Interest coverage ratio is a debt ratio and profitability ratio used to determine how easily a
Company can pay interest on outstanding debt.
𝐼𝑛𝑡𝑒𝑟𝑒𝑠𝑡 𝐶𝑜𝑣𝑒𝑟𝑎𝑔𝑒 𝑅𝑎𝑡𝑖𝑜 =𝐸𝑎𝑟𝑛𝑖𝑛𝑔 𝐵𝑒𝑓𝑜𝑟𝑒 𝐼𝑛𝑡𝑒𝑟𝑒𝑠𝑡 𝑎𝑛𝑑 𝑇𝑎𝑥
𝐹𝑖𝑛𝑎𝑛𝑐𝑒 𝐶𝑜𝑠𝑡
Market Cap/Sales ratio: Market Cap/sales ratio, Price–sales ratio, P/S ratio, or PSR, is a valuation metric for stocks. It is
calculated by dividing the company's market cap by the revenue in the most recent year; or, equivalently, divide the per-
share stock price by the per-share revenue.
𝑀𝑎𝑟𝑘𝑒𝑡 𝐶𝑎𝑝/𝑆𝑎𝑙𝑒𝑠 𝑟𝑎𝑡𝑖𝑜 =𝑀𝑎𝑟𝑘𝑒𝑡 𝐶𝑎𝑝
𝑆𝑎𝑙𝑒𝑠 𝑇𝑢𝑟𝑛𝑜𝑣𝑒𝑟
Market Cap/ Net Worth ratio: It is a valuation ratio calculated by dividing Company’s market cap to net worth.
𝑀𝑎𝑟𝑘𝑒𝑡 𝐶𝑎𝑝/𝑁𝑒𝑡𝑤𝑜𝑟𝑡ℎ 𝑟𝑎𝑡𝑖𝑜 =𝑀𝑎𝑟𝑘𝑒𝑡 𝐶𝑎𝑝
𝑁𝑒𝑡𝑤𝑜𝑟𝑡ℎ
Market Cap/ PAT ratio: It is a valuation ratio calculated by dividing Company’s market cap to net profit.
𝑀𝑎𝑟𝑘𝑒𝑡 𝐶𝑎𝑝/𝑃𝐴𝑇 𝑟𝑎𝑡𝑖𝑜 =𝑀𝑎𝑟𝑘𝑒𝑡 𝐶𝑎𝑝
𝑛𝑒𝑡 𝑝𝑟𝑜𝑓𝑖𝑡
Market Cap/ EBITDA ratio: It is a valuation ratio calculated by dividing Company’s market cap to EBITDA.

Stakeholders’ Education | Corporate Governance Research | Corporate Governance Score | Proxy Advisory
STAKEHOLDERS EMPOWERMENT SERVICES
7 | P A G E
SECTOR: TEXTILES REPORTING DATE: 24TH JANUARY, 2018
RAJ RAYON INDUSTRIES LTD. www.rajrayon.com
𝑀𝑎𝑟𝑘𝑒𝑡 𝐶𝑎𝑝/𝐸𝐵𝐼𝑇𝐷𝐴 𝑟𝑎𝑡𝑖𝑜 =𝑀𝑎𝑟𝑘𝑒𝑡 𝐶𝑎𝑝
𝐸𝐵𝐼𝑇𝐷𝐴
Trading Volume (shares) (avg. of 1 year): Average number of shares/day traded in 1 year
Trading volume (shares) (high in 1 year): Highest number of shares/day traded in 1 year
Trading volume (shares) (minimum in 1 year): Lowest number of shares traded on any one day in 1 year
Stakeholders’ Education | Corporate Governance Research | Corporate Governance Score | Proxy Advisory
STAKEHOLDERS EMPOWERMENT SERVICES
8 | P A G E
SECTOR: TEXTILES REPORTING DATE: 24TH JANUARY, 2018
RAJ RAYON INDUSTRIES LTD. www.rajrayon.com
DISCLAIMER
Sources Company Information
Only publicly available data has been used while making the factsheet. Our data sources include: BSE, NSE, SEBI, Capitaline, Moneycontrol, Businessweek, Reuters, Annual Reports, IPO Documents and Company Website.
Analyst Certification
The analysts involved in development of this factsheet certify that no part of any of the research analyst’s compensation was, is, or will be directly or indirectly related to the contents of this factsheet.
Disclaimer
While SES has made every effort and has exercised due skill, care and diligence in compiling this factsheet based on publicly available information, it neither guarantees its accuracy, completeness or usefulness, nor assumes any liability whatsoever for any consequence from its use. This factsheet does not have any approval, express or implied, from any authority, nor is it required to have such approval. The users are strongly advised to exercise due diligence while using this factsheet. This factsheet in no manner constitutes an offer, solicitation or advice to buy or sell securities, nor solicits votes or proxies on behalf of any party. SES, which is a not-for-profit Initiative or its staff, has no financial interest in the companies covered in this factsheet except what is disclosed on its website. The factsheet is released in India and SES has ensured that it is in accordance with Indian laws. Person resident outside India shall ensure that laws in their country are not violated while using this factsheet; SES shall not be responsible for any such violation. All disputes subject to jurisdiction of High Court of Bombay, Mumbai.
SEBI Reg. No. INH000000016
This factsheet or any portion hereof may not be reprinted, sold, reproduced or redistributed without the written consent of Stakeholders Empowerment Services
Contact Information
Stakeholders Empowerment Services
A 202, Muktangan, Upper Govind Nagar,
Malad East, Mumbai – 400 097
Tel +91 22 4022 0322
www.sesgovernance.com
Research Analyst: Sudarshan Shetty