staffing statistics · this staffing statistics report provides the information needed to monitor...
TRANSCRIPT

Staffing Statistics Including Equality Act 2010 publication of equality information
December 2017
Produced by Human Resources

2
Introduction
This is the tenth annual staffing statistics report produced by HR. The purpose of the report is to provide managers and other users with up to date information about UWE’s workforce profile and to highlight emerging trends. Managers will be able to use this information to identify where we need to make improvements. UWE has a longstanding commitment to the promotion of equality, diversity and inclusivity and undertakes a wide range of activities to promote better outcomes and meet the needs of different groups of staff. In November 2016, we published Inclusivity 2020, our second full single equality scheme (2017-2020) which spells out how we intend to embed inclusivity in both strategic and day-to-day activities. It can be accessed on the UWE website: www.uwe.ac.uk/equalityanddiversity. This staffing statistics report provides the information needed to monitor progress; it also provides a rich source of data for managers carrying out equality analysis. This report will additionally assist us to track our equality objectives on staff recruitment, development and promotion. The data is taken from a snapshot of the staff population on 31 December 2017 held in the University’s new HR payroll system (iTrent) which went live in August 2017. The database is populated from information supplied by new staff on their application forms. iTrent Employee Self Service went live in January 2018 enabling staff to update their own equality data directly into the system. As a result of the new system the format of the report has changed this year, and for this one edition only provides one previous year of data for comparison; please see the earlier editions if data prior to 2016 is needed. The new system has also resulted in some changes to the way data is held so the counts cannot be directly compared with those in our earlier editions. This report should be read in conjunction with results from the 2017 staff survey available in the HR intranet. I hope you find the report interesting and informative. If you have any ideas for how it might be improved, or have any queries relating to the data and its analysis, then please contact Lesley Donnithorne in the HR Systems and Information Team ([email protected]) or Valerie Russell Emmott in the Equality and Diversity Unit ([email protected]). Debbie England Director of HR and OD May 2018

3
Contents
The report is separated into sections covering different topic areas.
Section 1 – Staff Employment Page
Staff/students full time equivalent (FTE) ratios………………………………………………….. 5 Total UWE expenditure and staff costs……………………………………………………………… 5 Staff by faculties or services…………………………………………………………………………….. 6 Staff by employee group…………………………………………………………………………………. 6 Section 1.1 – Staff Employment by Gender Employee group by gender …………………………………………………………… 8 Female staff in senior academic/management grades………………………. 8 Female staff in senior professional services grades…………………………… 9 Gender pay gap……………………………………………………………………………. 9 Family friendly leave……………………………………………………………………… 11 Child care vouchers……………………………………………………………………….. 12 Section 1.2 – Staff Employment by Ethnicity Staff by ethnicity and by ethnic origin....………………………………………….. 13 Black and minority ethnic staff in senior grades...…………………………….. 16 Staff by nationality………………………………………………………………………... 16 Section 1.3 – Staff Employment by Disability Disabled staff, overall and in senior grades………………………………………. 17 Section 1.4 – Staff Employment by Age Staff by age band by gender…………………………………………………………... 19 Section 1.5 – Staff Employment by LGB Staff by sexual orientation………………………………………………………………. 20 Section 1.6 – Staff Employment by Religion and Belief Staff by religion and belief………………………………………………………….…… 21 Section 1.7 – Staff Employment by Trans/Transgender Staff by trans/transgender …………………….……………………………………….. 22 Section 1.8 – Staff Employment by Contract Term Staff by permanent, fixed term, temporary by equality group…………..… 23 Section 1.9 – Staff Employment by Contract Mode Staff by full time/ part time contract by equality group………..…..………… 24

4
Section 2 – Staff Recruitment Success rates by equality group…………………………………………………………………..….. 25 Temporary Staff Unit recruitment success rates by equality group…………….………… 27 Internal candidate success rates by equality group……………………………………..…….. 29
Section 3 – Leavers Turnover rates……………………………………………………………………………………….………. 31 Reasons for leaving………………………………………………………………………………………… 31
Section 4 – Staff Development and Career Progression Internal training attendances by equality group…………………………………….…………. 33 Career progressions by equality group………………………………………………………..…… 34
Section 5 – Formal Procedures Staff grievances by equality group…………………………………………………………………… 36 Staff disciplinary cases by equality group…………………………………………….…………… 37
Section 6 – Sickness Absence UWE sickness rates overall and by faculty/service……………………………………..……… 38 UWE sickness rates by equality group…………….………………………………………..……… 39 Reasons for sickness absence…………………………………………………………………………. 40 ..
Section 7 – Employee Assistance Programme (EAP)
Use of EAP Services……………………………………………………………………………………….. 42
Section 8 – Benchmark Performance Indicators
Comparisons with other Universities and UWE targets……………………………….………. 43

5
Section 1 – Staff Employment
This chart shows over time the ratio of student FTEs to each staff FTE, including all employee groups (senior management, academic and professional services). The ratio increased in 2009/10 due to an increase in student FTEs, and in 2011/12 due to a decrease in staff FTEs resulting from change programmes affecting both academic and professional services staff.
UWE’s staff costs as a proportion of its total expenditure increased in 2016/17 to 61.5%.

6
In 2017 50% of staff were located in faculties and 50% in services. The 2010 and 2011 figures reflect the position prior to the One University Administration restructuring in January 2012. In 2017 there has been a 3.9% increase in staffing numbers and 4.7% increase in FTEs compared to 2016. A breakdown of the data, including by individual faculty and service, is in Table 1 on page 7.
Staff by Employee Group 2017
In term of headcount, the largest employee group is administrative/ professional and the smallest is senior management.

7
TABLE 1 – STAFF IN POST AT 31/12/2017
* FTE = full time equivalent 1 FTE relates to the total for the previous academic year
FACULTY/SERVICE
HEADS
2017 FTE* 2017
HEADS
2016
FTE*
2016
ACE Faculty of Arts, Creative Industries & Education 332 269 332 263
FBL Faculty of Business & Law 305 279 290 260
FET Faculty of Environment & Technology 472 431 441 402
HAS Faculty of Health & Applied Sciences 585 508 565 491
Faculty totals 1694 1487 1628 1417
APD Academic Practice Directorate 6 5 7 6
COM Commercial Services 14 13 16 15
DIR Directorate 40 38 19 17
FAC Facilities 477 369 472 366
FIN Finance Department 85 78 94 87
HRS Human Resources 73 64 76 64
ITS IT Services 168 161 161 152
RBI Research Business & Innovation 82 69 86 72
SAS Academic Services 193 169 190 171
SAS Student Services 274 224 260 220
SCE Strategic Communications & Engagement 74 64 66 52
SFS Future Students 99 83 83 71
SPO Strategic Programmes Office 23 21 16 15
SSS Library Services 142 109 129 102
Service totals 1750 1467 1675 1410
Faculty and Service sub total 3444 2954 3304 2826
Associate Lecturers/Instructors 1 269 72 300 75
Temporary staff (in assignment) 149 49 112 35
All staff 3862 3075 3716 2936
8
Section 1.1 - Staff by Gender
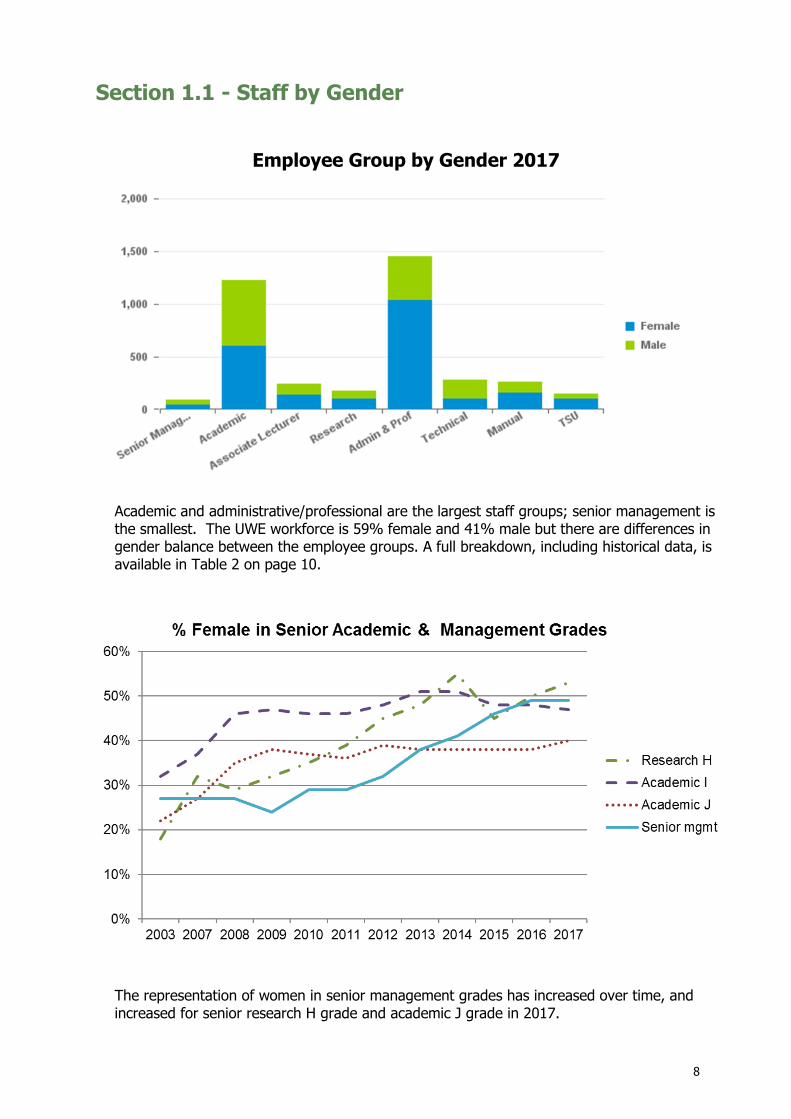
Employee Group by Gender 2017
Academic and administrative/professional are the largest staff groups; senior management is the smallest. The UWE workforce is 59% female and 41% male but there are differences in gender balance between the employee groups. A full breakdown, including historical data, is available in Table 2 on page 10.
The representation of women in senior management grades has increased over time, and increased for senior research H grade and academic J grade in 2017.

9
The representation of women in senior professional services grades increased significantly with the implementation of the University wide job evaluation exercise in 2008. In 2017 the representation of women in senior technical grades has increased, but decreased slightly in senior administrative/professional and senior manual grades.
The gender pay gap is the percentage by which average female pay is lower than average male pay. Data up to 2015 is based on periodic equal pay audits of staff on permanent and fixed term contracts. The pay gap at 2017 is 13.15%, the figure produced for the annual statutory Gender Pay Gap reporting which is for all staff paid in March 2017, including temporary staff and casual work claimants.

10
TABLE 2 – EMPLOYEE GROUP AND GRADE BY GENDER
MALE % FEMALE FEMALE
%
51% 43 49%
51% 41 49%
60% 48 40%
62% 45 38%
53% 83 47%
53% 85 47%
49% 420 51%
49% 400 51%
53% 47 47%
48% 39 52%
33% 6 67%
50% 3 50%
44% 133 56%
45% 164 55%
47% 16 53%
53% 14 47%
44% 79 56%
49% 67 51%
39% 260 61%
38% 236 62%
24% 778 76%
26% 747 74%
71% 20 29%
75% 17 25%
64% 76 36%
64% 72 36%
72% 28 28%
69% 29 31%
25% 123 75%
28% 106 72%
33% 100 67%
38% 70 63%
2027 58%
1901 58%
2260 59%
2135 57%
MALE
64
164
146
248
263
50
50
135
44
42
73
73
93
94
400
1580
381
52
36
3
3
105
133
14
16
61
130
71
65
40
42
49
42
42%
42%
41%
43%
ALL
HEADS
131
424
382
1026
1010
70
67
211
87
83
121
118
176
179
820
3475
3306
3862
3715
781
99
75
9
6
238
297
30
30
140
202
99
94
163
148
149
112
1448
1405
1602
2016
2017
2017
2016
2017
2016
2017
2016
2016
2017
2016
2017
2016
2017
YEAR
2016
2017
2016
2017
2016
2017
2016
2017
2017
2016
2017
2016
2017
2016
2017
2016
2017
GRADE
Grade A to F
Grade A to F
Grade J
Grade I
Grade H
Grade G &
Above
Grade G &
Above
ALL STAFF (excluding ALs/&TSU)
ALL STAFF
Grade G
Grade F
Grade H
Grade F&G
Grade C & D
Grade A & B
2017
2016
2017
2016
2016
Manual
Senior Management
TSU
Academic
JOB GROUP
Admin & Prof
Technical
Associate Lecturer
Research

11
Academic staff (including associate lecturing and research) and administrative/ professional/technical staff make up 42% and 48% of the workforce respectively; 6.8% of the workforce is manual staff and 2.3% senior management. The chart illustrates that in 2017 family friendly leave was taken up in greatest proportion by administrative/ professional/technical staff, the staff group with the highest proportion of women (65%).
TABLE 3 – TAKE UP OF FAMILY FRIENDLY LEAVE BY EMPLOYEE GROUP
% indicates the proportion of the workforce
CATEGORY YEAR ALLSNR MGMT ACADEMIC
ADMIN/PROF/
TECHMANUAL
Adoption 2017 3 1 2
2016 1 1
Carers Leave 2017 262 1 17 225 19
2016 286 1 19 231 35
Maternity 2017 61 22 37 2
2016 72 1 23 47 1
Paternity 2017 28 3 11 12 2
2016 45 15 28 2
Shared Parental Leave 2017 7 1 6
2016 1 1
All Leave Types 2017 361
(9%)
5
(5.7%)
51
(3.1%)
282
(15%)
23
(8.8%)
405
(11%)
2
(2.4%)
58
(3.7%)
307
(17%)
38
(16%)2016

12
Child care vouchers are taken up by female and male staff approximately in proportion to the workforce gender split. This chart shows that as a proportion of the workforce, child care vouchers are taken up in much lower numbers by manual staff, an employee group with a high proportion of women but the lowest pay rates. See table below for historical data by gender .
TABLE 4 – TAKE UP OF CHILD CARE VOUCHERS
YEAR ALL MALE FEMALE
Heads Heads % Heads %
2017 2016
288 275
115 101
40% 37%
173 174
60% 63%

13
Section 2.2 - Staff by Ethnicity
UWE’s BME staff percentage has increased over time to 9.6% in 2017. See Table 6 on page 15 for a breakdown by employee group and grade.
BME Ethnic Origin 2017
The UWE workforce is 87% White. Data is not held for 3.6% of staff. A full breakdown, including historical data, is available in Table 5 below.

14
TABLE 5 – ETHNIC ORIGIN
Sub total
Sub total
Sub total
All staff
167
3325
3862 100.0% 100.0%
4.3% 3.9%
9.6% 8.9%
86% 87%
GROUP
Arab
Asian or Asian British - Bangladeshi
Asian or Asian British - Indian
Asian or Asian British - Pakistani
Black or Black British - African
Black or Black British - Caribbean
HEADS
2017
12
8
40
20
57
35
PERCENTAGE
2017
0.3%
0.2%
1.0%
0.5%
1.5%
0.9%
Chinese
Mixed - White and Asian
Mixed - White and Black African
Mixed - White and Black Caribbean
No Data Held
Other Asian Background
Other Black Background
Other Ethnic Background
Other Mixed Background
Other White Background
Prefer Not to Say
White - British
White - English
White - Gypsy or Traveller
White - Irish
White - Northern Irish
White - Scottish
White - Welsh
51
17
10
19
125
41
4
22
34
370
309
42
2672
198
1
53
8
16
68
1.3%
0.4%
0.3%
0.5%
3.2%
1.1%
0.1%
0.6%
0.9%
8.0%
1.1%
69.2%
5.1%
0.0%
1.4%
0.2%
0.4%
1.8%
PERCENTAGE
2016
0.2%
0.2%
1.1%
0.5%
1.3%
0.8%
1.2%
0.5%
0.2%
5.0%
0.0%
1.3%
0.2%
0.4%
1.6%
0.3%
2.7%
1.0%
0.2%
0.6%
0.9%
7.5%
1.2%
71.1%

15
TABLE 6 – EMPLOYEE GROUP AND GRADE BY ETHNICITY
F
E
M
BME BME % WHITE WHITE %
Senior Management 6 6.9% 81 93%
5 6.0% 77 93%
10 8.3% 110 91%
8 6.8% 108 92%
16 9.1% 155 88%
16 8.9% 157 88%
83 10.1% 702 86%
74 9.5% 674 86%
22 22.2% 74 75%
19 25.3% 55 73%
1 11.1% 8 89%
1 16.7% 5 83%
23 9.7% 193 81%
22 7.4% 259 87%
2 6.7% 28 93%
3 10.0% 27 90%
24 17.1% 111 79%
22 16.8% 104 79%
24 5.7% 390 92%
20 5.2% 353 92%
82 8.0% 921 90%
68 6.7% 916 91%
2 2.9% 62 89%
1 1.5% 59 88%
21 10.0% 172 82%
26 12.9% 169 84%
12 12.1% 85 86%
11 11.7% 81 86%
20 12.3% 125 77%
15 10.1% 111 75%
22 14.8% 108 72%
21 18.8% 83 74%
JOB GROUP
Admin & Prof
Technical
Associate Lecturer
Research
Manual
TSU
Academic
Grade G
Grade F
Grade H
Grade F&G
Grade C & D
Grade A & B
2016
GRADE
Grade A to F
Grade A to F
Grade J
Grade I
Grade H
Grade G &
Above
Grade G &
Above
YEAR
2016
2017
2016
2017
2016
2017
2016
2017
2017
2016
2017
2016
2017
2016
2017
2016
2017
2016
2017
2017
2016
2017
2016
2017
2016
2016
2017
2016
2017
2016
2017
781
99
75
9
6
238
297
30
30
140
202
99
94
163
148
149
112
ALL
HEADS
131
424
382
1026
1010
70
67
211
87
83
121
118
176
179
820
ETHNICITY
NOT
KNOWN
5
10
9
23
26
6
7
33
3
1
22
16
18
7
2
2
18
22
19
8
1
1
2
5
6
35
5
4.2%
3.0%
1.3%
9.2%
5.4%
3.6%
3.5%
2.0%
2.1%
11.0%
14.9%
12.8%
7.1%
ETHNICITY
NOT KNOWN
%
3.8%
2.4%
2.4%
2.2%
2.6%
8.6%
10.4%
8.5%
1.2%
0.8%
1.7%
2.8%
3.4%
4.3%
325 9.4% 3024 87% 126
289 8.7% 2896 88% 121
370 9.6% 3325 86% 167
332 8.9% 3238 87% 145
ALL STAFF (excluding
ALs/&TSU)
ALL STAFF
2017
2016
2017
2016
3475
3306
3862
3715
3.6%
3.7%
4.3%
3.9%

16
Top 10 Nationalities 2017
TABLE 7 – NATIONALITY
GROUP HEADS 2017
PERCENTAGE 2017
PERCENTAGE 2016
British 3304 87% 88%
Irish 33 0.9% 0.8%
German 31 0.9% 0.9%
American 27 0.7% 0.8%
Italian 26 0.7% 0.6%
Polish 25 0.6% 0.6%
Greek 21 0.5% 0.6%
Nigerian 21 0.5%
French 20 0.5% 0.5%
Spanish 18 0.5% 0.6%
Chinese 16 0.4% 0.4%
Sub total 3542 92% 94% All staff 3862 100% 100%
The UWE workforce is 87% British. Historical data, is available in Table 7 below.
Overall, the BME staff percentage in the senior grades has continued to
increase.

17
Section 1.3 - Staff by Disability
UWE staff with a declared disability has decreased to 5.6% in 2017. There was a higher proportion of disabled leavers in 2017, and also a number of staff updated their disability status when Employee Self Service went live. A full breakdown, including historical data, is available in Table 8 on page 18.
Disabled staff representation in senior grades has decreased in 2017 – see Table 8 on page 18 for details.

18
TABLE 8 – EMPLOYEE GROUP AND GRADE BY DISABILITY
F
E
Senior Management
JOB GROUP
Admin & Prof
Technical
Associate Lecturer
Research
Manual
TSU
Academic
94%
93%
94%
94%
96%
97%
93%
89%
83%
98%
97%
93%
93%
96%
94%
93%
93%
94%
92%
97%
98%
NOT DISABLED/
NOT KNOWN %
94%
92%
90%
93%
92%
99%
97%
94%
97%
96%
98%
98%
95%
95%
95%
ALL STAFF (excluding
ALs/&TSU)
ALL STAFF
Grade G
Grade F
Grade H
Grade F&G
Grade C & D
Grade A & B
2017
2016
2017
2016
2016
GRADE
Grade A to F
Grade A to F
Grade J
Grade I
Grade H
Grade G &
Above
Grade G &
Above
YEAR
2016
2017
2016
2017
2016
2017
2016
2017
2017
2016
2017
2016
2017
2016
2017
2016
2017
2016
2017
2017
2016
2017
2016
2017
2016
2016
2017
2016
2017
2016
2017
3475
3306
3862
3715
781
99
75
9
6
238
297
30
30
140
202
99
94
163
148
149
112
ALL
HEADS
131
424
382
1026
1010
70
67
211
87
83
121
118
176
179
820
209
215
217
226
33
3
5
1
1
4
9
2
2
6
13
7
7
10
12
4
2
6.0%
6.5%
5.6%
6.1%
4.2%
3.0%
80
1
2
13
3
3
3
2
9
9
40
6.7%
6.7%
4.3%
DISABLED
%
DISABLED
8
35
38
76
3.4%
7.4%
6.1%
8.1%
2.7%
1.8%
3.6%
2.5%
1.7%
5.1%
5.0%
4.9%
6.1%
8.3%
9.9%
7.4%
7.9%
1.4%
3.0%
6.2%
6.4%
6.7%
11.1%
16.7%
3266
3091
3645
3489
748
96
70
8
5
234
288
28
28
134
189
92
87
153
136
145
110
7.1%
1.7%
3.0%
NOT DISABLED/
NOT KNOWN
123
389
344
950
930
69
65
198
84
80
118
116
167
170
780

19
Section 1.4 - Staff by Age
The average age of a UWE employee in 2017 is 44 years, up from 43 years in 2016.
TABLE 9 – AGE BY GENDER
AGE BAND HEADS
2017
Under 25 160
25-34 713
35-44 1045
45-54 1028
55-64 806
65-74 107
75 plus 3
PERCENTAGE
2016
3.3%
18.5%
26.6%
27.7%
21.2%
2.6%
0.1%
PERCENTAGE
2017
4.1%
18.5%
27.1%
26.6%
20.9%
2.8%
0.1%
FEMALE
2017
102
441
599
593
484
39
2
MALE
2017
58
272
446
435
322
68
1
20
Section 1.5 - Staff by Sexual Orientation
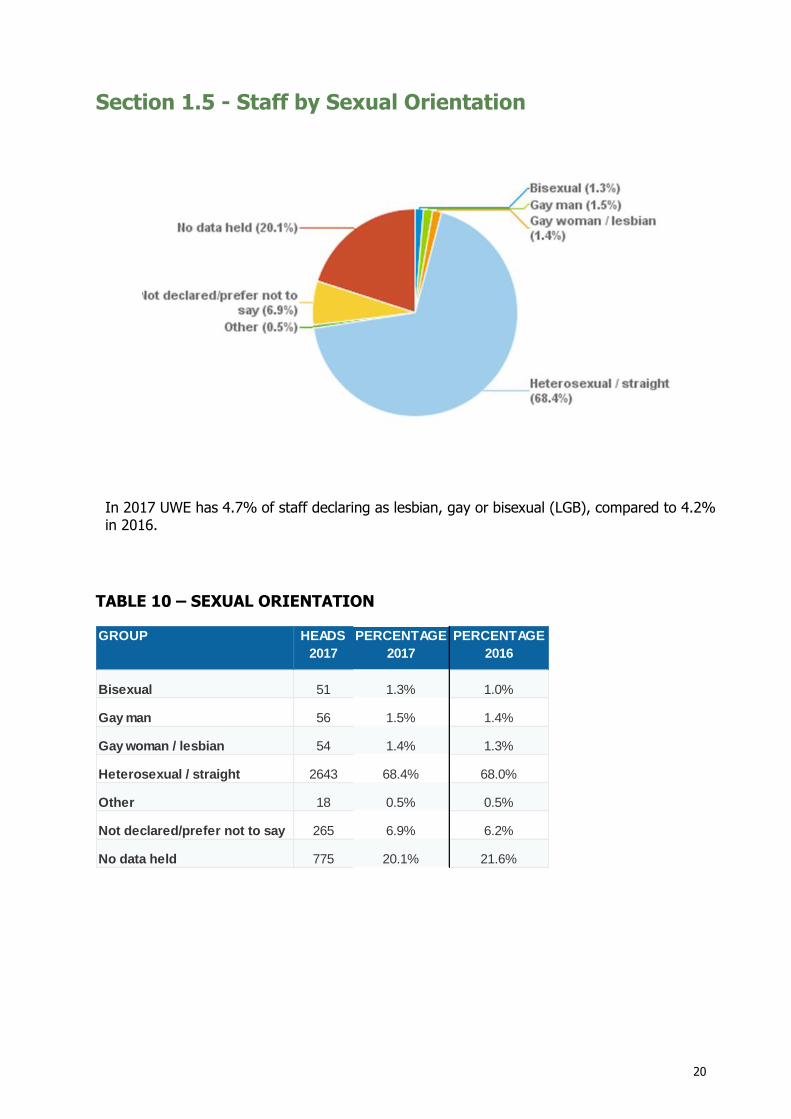
In 2017 UWE has 4.7% of staff declaring as lesbian, gay or bisexual (LGB), compared to 4.2% in 2016.
TABLE 10 – SEXUAL ORIENTATION
GROUP
Bisexual
Gay man
Gay woman / lesbian
Heterosexual / straight
Other
Not declared/prefer not to say
PERCENTAGE
2017
1.3%
1.5%
1.4%
68.4%
0.5%
6.9%
No data held
HEADS
2017
51
56
54
2643
18
265
775 20.1%
PERCENTAGE
2016
1.0%
1.4%
1.3%
68.0%
0.5%
6.2%
21.6%

21
Section 1. 6 - Staff by Religion and Belief
33% of UWE staff have declared as having a religion/belief in 2017; the same as in 2016.
TABLE 11 – RELIGION AND BELIEF
GROUP
Buddhist
Christian
Hindu
Jewish
Muslim
Sikh
Other religion or belief
No religion or belief
Not declared/prefer not to say
No data held
106
1466
329
778
38.0%
8.5%
20.1%
HEADS
2017
38
1033
25
8
76
3
PERCENTAGE
2017
1.0%
26.7%
0.6%
0.2%
2.0%
0.1%
2.7%
PERCENTAGE
2016
0.9%
27.0%
0.6%
0.2%
1.5%
0.1%
2.7%
37.0%
8.2%
21.7%

22
Section 1. 7 - Staff by Trans/Transgender
In 2017 UWE’s declared trans/transgender population is 0.5%, the same as in 2016.
TABLE 12 – TRANS/TRANSGENDER
HEADS
2017
18
2878
82
884
CATEGORY
Yes
No
Prefer not to say
PERCENTAGE
2017
0.5%
75%
2.1%
No data held 23%
PERCENTAGE
2016
0.5%
75%
1.6%
23%

23
Section 1.8 - Staff by Contract Term
*NK = not known
TABLE 13 – CONTRACT TYPE BY EQUALITY GROUP
CONTRACT
TYPE
YEAR ALL
HEADS
MALE MALE
%
FEMALE FEMALE
%
BME BME % WHITE WHITE
%
ETHNICITY
NOT
KNOWN
ETHNICITY
NOT
KNOWN %
DISABLED DISABLED
%
NOT
DISABLED/
NOT KNOWN
NOT DISABLED/
NOT KNOWN %
Permanent 2017 3057 1287 42.1% 1770 57.9% 269 8.8% 2687 87.9% 101 3.3% 179 5.9% 2878 94.1%
2016 2946 1248 42.4% 1698 57.6% 239 8.1% 2598 88.2% 109 3.7% 183 6.2% 2763 93.8%
Fixed Term 2017 656 266 40.5% 390 59.5% 79 12.0% 530 80.8% 47 7.2% 34 5.2% 622 94.8%
2016 657 290 44.1% 367 55.9% 72 11.0% 557 84.8% 28 4.3% 41 6.2% 616 93.8%
Temporary 2017 149 49 32.9% 100 67.1% 22 14.8% 108 72.5% 19 12.8% 4 2.7% 145 97.3%
2016 112 42 37.5% 70 62.5% 21 18.8% 83 74.1% 8 7.1% 2 1.8% 110 98.2%
In 2017 a higher proportion of disabled staff were on permanent contracts compared to staff with no declared disability; a higher proportion of BME staff were on fixed term and temporary contracts compared to white staff; a higher proportion of male staff were on permanent contracts than female staff.

24
Section 1.9 - Staff by Contract Mode
*NK = not known
TABLE 14 – MODE OF EMPLOYMENT BY EQUALITY GROUP
MODE YEAR ALL
HEADS
MALE MALE
%
FEMALE FEMALE
%
BME BME % WHITE WHITE % ETHNICITY
NOT
KNOWN
ETHNICITY
NOT
KNOWN %
DISABLED DISABLED
%
NOT
DISABLED/
NOT KNOWN
NOT DISABLED/
NOT KNOWN %
Full Time 2017 2307 1174 50.9% 1133 49.1% 243 10.5% 1987 86.1% 77 3.3% 140 6.1% 2167 93.9%
2016 2209 1136 51.4% 1073 48.6% 217 9.8% 1921 87.0% 71 3.2% 134 6.1% 2075 93.9%
Part Time 2017 1555 428 27.5% 1127 72.5% 127 8.2% 1338 86.0% 90 5.8% 77 5.0% 1478 95.0%
2016 1506 444 29.5% 1062 70.5% 115 7.6% 1317 87.5% 74 4.9% 92 6.1% 1414 93.9%
In 2017 a higher proportion of disabled staff were working full time compared to staff without a declared disability staff; a higher proportion of BME staff were working full time compared to white staff; a higher proportion of male staff were working full time compared to female staff.

25
Section 2 – Staff Recruitment
*NK = not known
Compared to the year 2015/2016, in 2016/17 there was a 15% increase in the number of appointments made and a 37% increase in the number of applicants. The average age of UWE starters in 2017 was 34 years, compared to 36 in 2016.
Applicants declaring a disability were shortlisted in higher proportion to those who did not declare a disability and were appointed in lower proportion; 7.3% of applicants declared a disability. See table 15 on page 26 for historical data.
The 2016/17 data shows the success rate of female applicants though the recruitment process continues to be better than for male applicants. See table 15 on page 26
for historical data.
BME applicants have a lower rate of recruitment success compared to white applicants. See table 15 on page 26 for historical data.

26
TABLE 15 – RECRUITMENT BY EQUALITY GROUP ALL MALE* FEMALE* BME WHITE ETHNICITY
NOT KNOWN DISABLED NOT DISABLED
/ NOT KNOWN Heads Heads % Heads % Heads % Heads % Heads % Heads % Heads %
2017
Applied Shortlisted Appointed
11382 2343 774
5137 1013 297
45% 43% 38%
6073 1305 471
53% 56% 61%
2489 387 105
22% 17% 14%
8619 1912 655
76% 82% 85%
274 44 14
2.4% 1.9% 1.8%
833 205 47
7.3% 8.7% 6.1%
10549 2138 727
93% 91% 94%
2016
Applied Shortlisted Appointed
8314 1843 672
3636 789 286
44% 43% 43%
4483 1027 379
54% 56% 56%
1750 291 83
21% 16% 12%
6305 1502 568
76% 81% 85%
259 50 21
3.1% 2.7% 3.1%
612 148 42
7.4% 8.0% 6.3%
7702 1695 630
93% 92% 94%
2015 Applied
Shortlisted Appointed
8183 1648 600
3743 689 233
46% 42% 39%
4288 948 364
52% 58% 61%
1646 235 64
20% 14% 11%
6274 1390 531
77% 84% 89%
263 23 5
3.2% 1.4% 0.8%
540 93 40
6.6% 5.6% 6.7%
7643 1555 560
93% 94% 93%
* Data excludes applicants who did not declare a gender. Data relates to the period August to July.
27
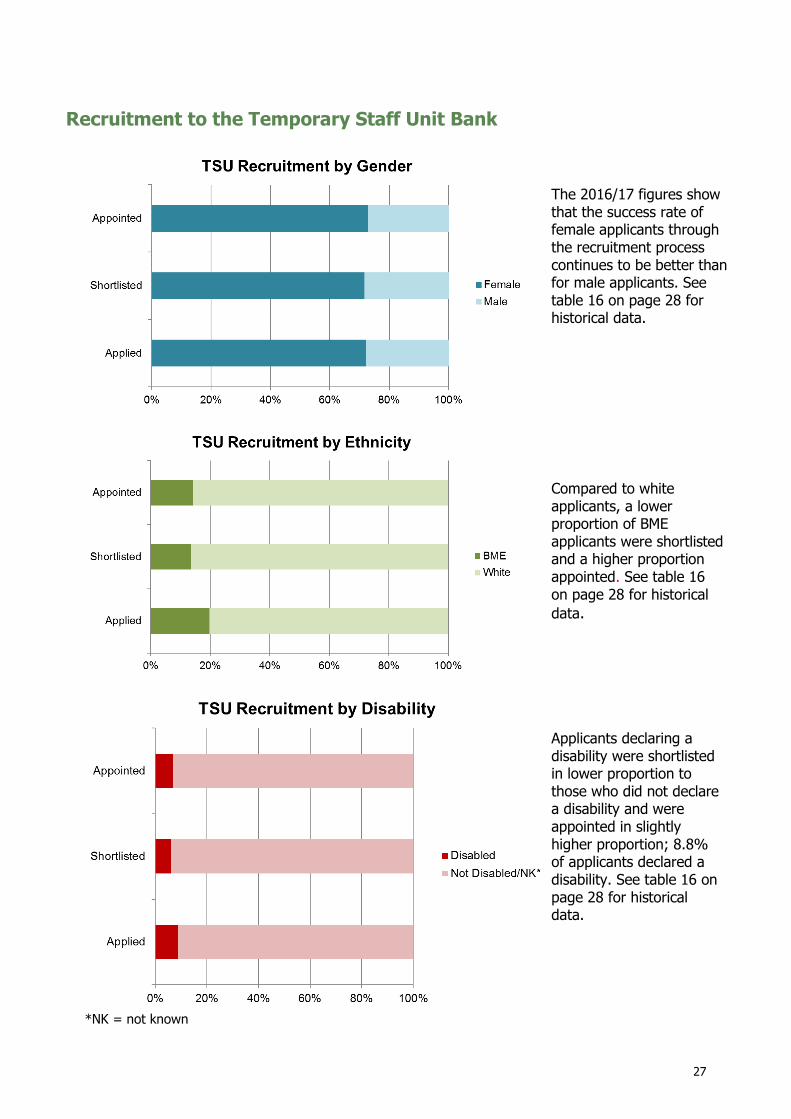
Recruitment to the Temporary Staff Unit Bank
*NK = not known
The 2016/17 figures show that the success rate of female applicants through the recruitment process continues to be better than for male applicants. See table 16 on page 28 for historical data.
Compared to white applicants, a lower proportion of BME applicants were shortlisted and a higher proportion appointed. See table 16 on page 28 for historical
data.
Applicants declaring a disability were shortlisted in lower proportion to those who did not declare a disability and were appointed in slightly higher proportion; 8.8% of applicants declared a disability. See table 16 on page 28 for historical data.

28
TABLE 16 - RECRUITMENT TO THE TEMPORARY STAFF UNIT BANK BY EQUALITY GROUP ALL MALE* FEMALE* BME WHITE ETHNICITY
NOT KNOWN DISABLED NOT
DISABLED / NOT KNOWN
Heads Heads % Heads % Heads % Heads % Heads % Heads % Heads %
2017 Applied
Shortlisted Appointed
226 83 73
62 23 20
27% 28% 27%
159 59 53
70% 71% 73%
44 11 10
19% 13% 14%
175 69 61
77% 83% 84%
7 3 2
3.1% 3.6% 2.7%
20 5 5
8.8% 6.0% 6.8%
206 78 68
91% 94% 93%
2016 Applied
Shortlisted Appointed
271 89 70
94 33 24
35% 37% 34%
176 56 46
65% 63% 66%
40 7 6
15% 7.9% 8.6%
226 82 64
83% 92% 91%
5 0 0
1.8% 0.0% 0.0%
19 5 4
7.0% 5.6% 5.7%
252 84 66
93% 94% 94%
2015 Applied
Shortlisted Appointed
154 76 68
36 14 14
23% 18% 21%
116 62 54
75% 82% 79%
24 8 6
16% 11% 8.8%
126 67 61
82% 88% 90%
4 1 1
2.6% 1.3% 1.5%
5 2 1
3.2% 2.6% 1.5%
149 74 67
97% 97% 99%
* Data excludes applicants who did not declare a gender. Data relates to the period August to July.

29
Recruitment of Internal Candidates
*NK = not known
The proportion of internal applicants declaring as disabled is 8.0% and is higher than the UWE disabled workforce of 5.6%. The figures show a slightly higher proportion were shortlisted and a lower proportion appointed compared to those not declaring as disabled. See table 17 on page 30 for historical data.
BME internal applicants have a lower rate of recruitment success compared to white internal applicants. The proportion of BME internal applicants is higher than the UWE BME workforce of 9.6%. See table 17 on page 30 for historical data.
In 2016/17 female internal applicants were shortlisted in slightly higher proportion and appointed in slightly lower proportion to male internal applicants. See table 17 on page 30 for historical data.

30
TABLE 17 - INTERNAL RECRUITMENT ONLY BY EQUALITY GROUP
ALL MALE* FEMALE* BME WHITE ETHNICITY
NOT KNOWN DISABLED NOT DISABLED
/ NOT KNOWN Heads Heads % Heads % Heads % Heads % Heads % Heads % Heads %
2017 Applied
Shortlisted Appointed
1230 698 329
509 282 139
41% 40% 42%
710 411 189
58% 59% 57%
224 99 40
18% 14% 12%
975 583 281
79% 84% 85%
31 16 8
2.5% 2.3% 2.4%
98 57 20
8.0% 8.2% 6.1%
1132 641 309
92% 92% 94%
2016 Applied
Shortlisted Appointed
1036 615 293
409 241 114
39% 39% 39%
602 359 174
58% 58% 59%
153 61 18
15% 10% 6.1%
844 530 263
81% 86% 90%
39 24 12
3.8% 3.9% 4.1%
88 51 21
8.5% 8.3% 7.2%
948 564 272
92% 92% 93%
2015 Applied
Shortlisted Appointed
940 538 261
358 197 90
38% 37% 34%
572 337 170
61% 63% 65%
148 62 22
16% 12% 8.4%
771 469 239
82% 87% 92%
21 7 0
2.2% 1.3% 0.0%
53 35 17
5.6% 6.5% 6.5%
887 503 244
94% 93% 93%
* Data excludes applicants who did not declare a gender. Data relates to the period August to July.

31
Section 3 - Leavers
Between 2008 and 2010, the rate at which staff left UWE employment (excluding at the end of a fixed term contract) showed the effect of the economic downturn. The peak in 2011 was the result of organisational restructuring. In 2017 the turnover rate has increased to 9.1% from 8.1% in 2016
The average age of UWE leavers in 2017 was 41 years, lower than the average age of all UWE staff.
The main categories of leaver in 2017 were resignation, followed by end of fixed term contract. See table 18 on page 32 for historical data.

32
TABLE 18 – LEAVERS BY CATEGORY BY EQUALITY GROUP
TABLE 19 – REASONS FOR LEAVING (data is taken from the exit survey completed by leavers)
REASON FACULTIES SERVICES TOTALS
2017
TOTALS
2016 Moving out of area 3 2 5 3 Returning to education 0 3 3 5 Giving up employment 0 1 1 1 Personal/domestic reasons 1 3 4 0 Promotion/career devel./prospects 9 17 26 15 Travel difficulties to/from work 2 5 7 1 Organisational culture 1 6 7 4 Management style 1 3 4 4 Working relations 0 0 0 0 Workload demands/stress 3 3 6 4 Discrimination/harassment 1 0 1 0 Retirement 5 2 7 2 Redundancy 0 1 1 3 End of fixed term contract 6 2 8 4 Seeking a more challenging role 2 4 6 5 Seeking more training & development 0 1 1 0 Career change 2 3 5 0 Higher salary 0 2 2 0 Seeking more flexible working 0 1 1 2
NUMBER OF RESPONDENTS 36 59 95 53
HEADS MALE FEMALE BME WHITEETHNICITY
NOT KNOWNDISABLED
NOT DISABLED/
NOT KNOWN
1 1 1 1
1 1 1 1
118 53 65 18 89 11 11 107
3 3 1 2 3
4 2 2 4 4
264 110 154 22 226 16 18 246
35 9 26 3 30 2 4 31
426177
(41%)
249
(59%)
45
(11%)
352
(82%)
29
(7%)
33
(8%)
393
(92%)
416182
(44%)
234
(56%)
51
(12%)
343
(82%)
22
(5.3%)
16
(3.8%)
400
(96%)
Resignation
Voluntary Severance
ALL LEAVERS - 2017
ALL LEAVERS - 2016
LEAVER CATEGORY
Death in Service
Dismissal
End of Fixed Term Contract
Ill Health
Redundancy

33
Section 4 – Staff Development and Career Progression
*NK = not known
TABLE 20 – INTERNAL TRAINING ATTENDANCES BY EQUALITY GROUP
Data includes staff attendances for compulsory fire safety delivered on-line: 2017 = 1154; 2016 = 2268
Data includes staff attendances for compulsory equality training delivered on-line: 2017 = 692; 2016 = 464
YEAR MALE
%
FEMALE FEMALE
%
BME BME % WHITE WHITE
%
ETHNICITY
NOT
KNOWN
ETHNICITY
NOT
KNOWN %
DISABLED DISABLED
%
NOT
DISABLED/
NOT KNOWN
NOT
DISABLED/
NOT KNOWN %
2017 33% 5316 67% 647 8.2% 7038 89% 249 3.1% 527 6.6% 7407 93%
2016 36% 4959 64% 604 7.9% 6849 89% 240 3.1% 561 7.3% 7132 93%
ALL MALE
7934 2618
7693 2734
In 2017 UWE managed training course opportunities were taken up in higher proportion by female staff and disabled staff, and in lower proportion by BME staff and compared to their representation in the workforce.

34
*NK = not known
TABLE 21 – CAREER PROGRESSION BY EQUALITY GROUP
TOTAL
Heads % Heads % Heads % Heads % Heads % Heads % Heads %
2017 207 89 43% 118 57% 19 9.2% 180 87% 8 3.86% 13 6.3% 194 94%
2016 253 109 43% 144 57% 21 8.3% 224 89% 8 3.16% 13 5.1% 240 95%
WHITE ETHNICITY
NOT KNOWN
DISABLED NOT DISABLED/
NOT KNOWN
YEAR MALE FEMALE BME
In 2017 career progression opportunities (promotion, regrading, secondment/ temporary upgrade) were taken up in slightly lower proportion by female staff, slightly higher proportion by disabled staff, and in equal proportion by BME staff and compared to their representation in the workforce.

35
TABLE 22 – CAREER PROGRESSION BY TYPE
TOTAL
Heads % Heads % Heads % Heads % Heads % Heads % Heads %
Promotion 2017 126 61 48% 65 52% 11 8.7% 111 88% 4 3.17% 8 6.3% 118 94%
2016 171 78 46% 93 54% 11 6.4% 154 90% 6 3.5% 11 6.4% 160 94%
Regrading 2017 21 8 38% 13 62% 1 4.8% 19 90% 1 4.76% 0 0.0% 21 100%
2016 28 10 36% 18 64% 4 14.3% 23 82% 1 3.6% 1 3.6% 27 96%
Secondment & Acting up 2017 60 20 33% 40 67% 7 11.7% 50 83% 3 5% 5 8.3% 55 92%
2016 54 21 39% 33 61% 6 11.1% 47 87% 1 1.9% 1 1.9% 53 98%
BME WHITE ETHNICITY
NOT KNOWN
DISABLED NOT DISABLED/
NOT KNOWN
TYPE YEAR MALE FEMALE

36
Section 5 – Formal Procedures
TABLE 23 – STAFF GRIEVANCES BY EQUALITY GROUP YEAR ALL MALE FEMALE BME WHITE ETHNICITY
NOT KNOWN DISABLED NOT
DISABLED/ NOT KNOWN
Heads Heads % Heads % Heads % Heads % Heads % Heads % Heads %
2017 15 6 32% 9 60% 2 13% 12 80% 1 7% 2 13% 13 87%
2016 3* 2 100% - - 1 50% 1 50% - - - - 2 100%
2015 6 3 50% 3 50% - - 6 100% - - - - 6 100%
* One collective grievance not include in equality analysis.
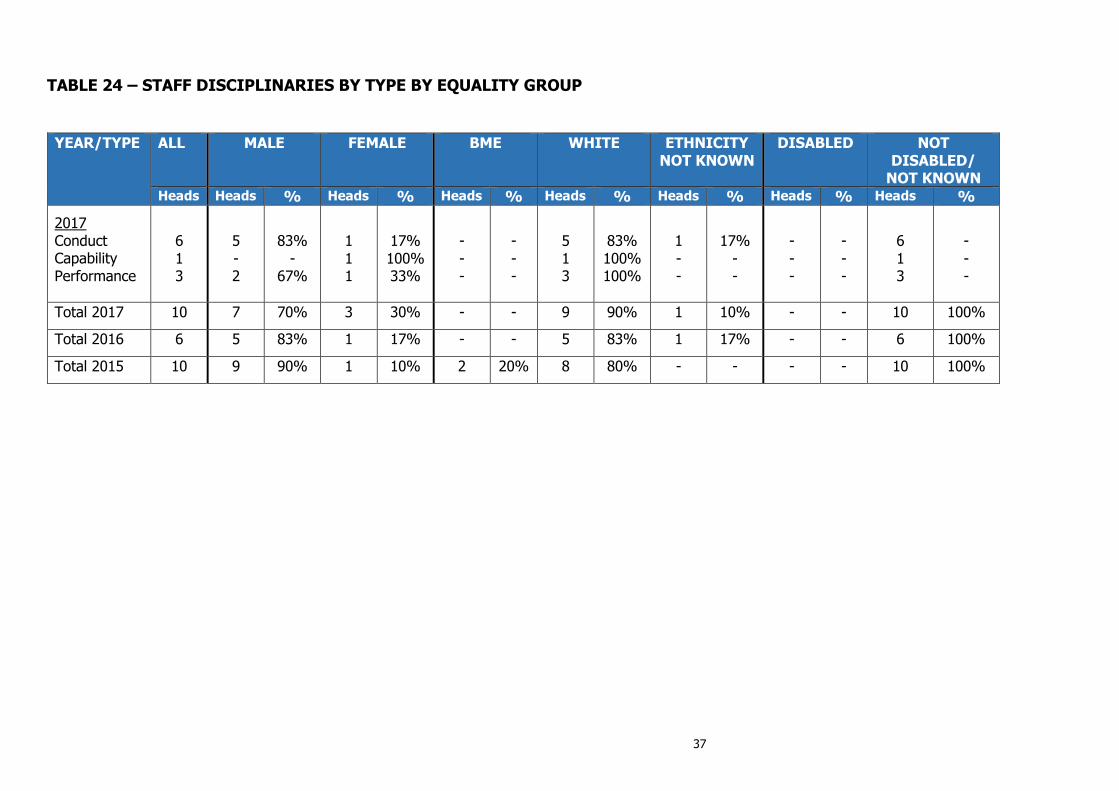
Although varying over time, the number of formal grievances and disciplinary cases remains low. A full breakdown, including historical data and analysis by equality strand, is shown in the tables below, but it is difficult to ascribe statistical significance to the data due to low numbers.
37
TABLE 24 – STAFF DISCIPLINARIES BY TYPE BY EQUALITY GROUP YEAR/TYPE ALL MALE FEMALE BME WHITE ETHNICITY
NOT KNOWN DISABLED NOT
DISABLED/ NOT KNOWN
Heads Heads % Heads % Heads % Heads % Heads % Heads % Heads %
2017 Conduct Capability Performance
6 1 3
5 - 2
83% -
67%
1 1 1
17% 100% 33%
- - -
- - -
5 1 3
83% 100% 100%
1 - -
17% - -
- - -
- - -
6 1 3
- - -
Total 2017 10 7 70% 3 30% - - 9 90% 1 10% - - 10 100%
Total 2016 6 5 83% 1 17% - - 5 83% 1 17% - - 6 100%
Total 2015 10 9 90% 1 10% 2 20% 8 80% - - - - 10 100%

38
Section 6 – Sickness Absence
In 2017 the sickness absence rate was 2.5%. There were 22,602 days lost and 4,254 incidents, so on average sickness incidents were 5.3 days in duration.
TABLE 25 – SICKNESS ABSENCE RATES BY FACULTY/SERVICE
FACULTY/ SERVICE
DAYS
LOST
2017
INCIDENTS
2017
ABSENCE
RATE 2017
ABSENCE
RATE 2016
ACE Faculty of Arts Creative Inds & Education 2401 234 2.8% 1.3%
FBL Faculty of Business & Law 1674 110 2.1% 1.5%
FET Faculty of Environment & Technology 858 127 0.7% 1.0%
HAS Faculty of Health & Applied Sciences 3020 355 1.9% 1.9%
Faculty sub total 7953 826 1.8% 1.5%
APD Academic Practice Directorate 30 2 1.8%
COM Commercial Services 112 42 3.0% 4.3%
DIR Directorate 24 16 0.2% 0.7%
FAC Facilities 5510 818 4.2% 5.3%
FIN Finance Department 722 193 3.2% 3.2%
HRS Human Resources 467 150 2.2% 3.8%
ITS IT Services 1147 294 2.6% 3.3%
RBI Research Business & Innovation 669 190 3.0% 3.1%
SAS Student & Academic Services 4221 1100 3.6% 5.4%
SCE Strategic Communications & Engagement 324 99 1.9% 3.6%
SFS Future Students 645 208 2.7% 2.7%
SPO Strategic Programmes Office 64 29 1.2% 1.2%
SSS Student Success Services 714 287 2.1% 2.9%
Services sub total 14649 3428 3.2% 3.2%
All services excluding manual staff 10929 2954 2.9% 3.8%
Manual staff only 3720 474 5.3% 6.2%
All Staff 22602 4254 2.5% 2.8%

39
*NK = not known.
TABLE 26 – SICKNESS ABSENCE RATES BY EQUALITY GROUP
Data includes disability related absence. In 2017, 30 staff reported disability related absence, amounting to 76 days and 46 incidents.
YEAR ALL MALE FEMALE BME WHITEETHNICITY
NOT KNOWNDISABLED
NOT DISABLED/
NOT KNOWN
2017 2.5% 1.7% 3.1% 1.8% 2.5% 3.2% 4.1% 2.4%
2016 2.8% 2.1% 3.3% 2.5% 2.8% 2.3% 4.7% 2.7%
In 2017 the absence percentage rate was higher for female staff, lower for BME staff and higher for disabled staff (NB: data includes disability-related absence – see below).

40
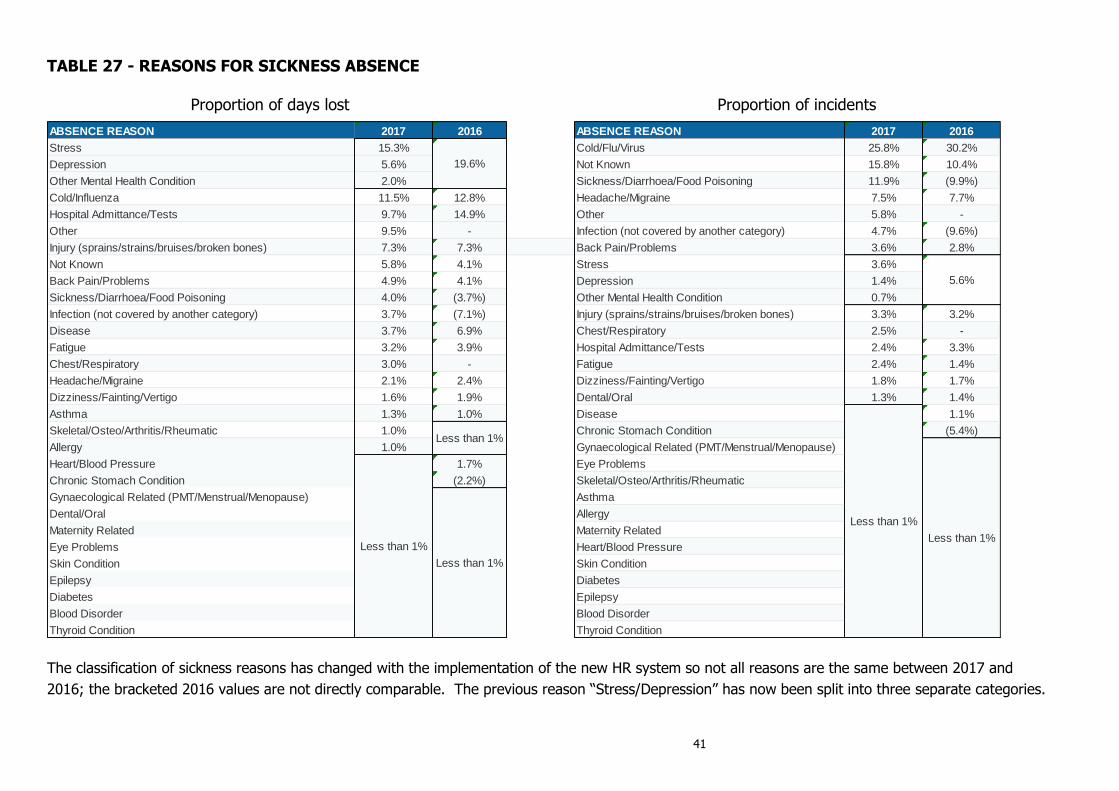
In 2017 the most days lost were due to stress/depression/other mental health condition at 5,251 days (up from 4,588 in 2016). Cold/flu/virus continues to be the reason with the highest incident rate at 1,116 (down from 1,369 in 2016). The chart is restricted to reasons with an absence rate of 1% or more; data on all reasons and historical data is available in table 27 on page 41.
41
TABLE 27 - REASONS FOR SICKNESS ABSENCE Proportion of days lost Proportion of incidents
The classification of sickness reasons has changed with the implementation of the new HR system so not all reasons are the same between 2017 and
2016; the bracketed 2016 values are not directly comparable. The previous reason “Stress/Depression” has now been split into three separate categories.
ABSENCE REASON 2017 2016 ABSENCE REASON 2017 2016
Stress 15.3% Cold/Flu/Virus 25.8% 30.2%
Depression 5.6% Not Known 15.8% 10.4%
Other Mental Health Condition 2.0% Sickness/Diarrhoea/Food Poisoning 11.9% (9.9%)
Cold/Influenza 11.5% 12.8% Headache/Migraine 7.5% 7.7%
Hospital Admittance/Tests 9.7% 14.9% Other 5.8% -
Other 9.5% - Infection (not covered by another category) 4.7% (9.6%)
Injury (sprains/strains/bruises/broken bones) 7.3% 7.3% Back Pain/Problems 3.6% 2.8%
Not Known 5.8% 4.1% Stress 3.6%
Back Pain/Problems 4.9% 4.1% Depression 1.4%
Sickness/Diarrhoea/Food Poisoning 4.0% (3.7%) Other Mental Health Condition 0.7%
Infection (not covered by another category) 3.7% (7.1%) Injury (sprains/strains/bruises/broken bones) 3.3% 3.2%
Disease 3.7% 6.9% Chest/Respiratory 2.5% -
Fatigue 3.2% 3.9% Hospital Admittance/Tests 2.4% 3.3%
Chest/Respiratory 3.0% - Fatigue 2.4% 1.4%
Headache/Migraine 2.1% 2.4% Dizziness/Fainting/Vertigo 1.8% 1.7%
Dizziness/Fainting/Vertigo 1.6% 1.9% Dental/Oral 1.3% 1.4%
Asthma 1.3% 1.0% Disease 1.1%
Skeletal/Osteo/Arthritis/Rheumatic 1.0% Chronic Stomach Condition (5.4%)
Allergy 1.0% Gynaecological Related (PMT/Menstrual/Menopause)
Heart/Blood Pressure 1.7% Eye Problems
Chronic Stomach Condition (2.2%) Skeletal/Osteo/Arthritis/Rheumatic
Gynaecological Related (PMT/Menstrual/Menopause) Asthma
Dental/Oral Allergy
Maternity Related Maternity Related
Eye Problems Heart/Blood Pressure
Skin Condition Skin Condition
Epilepsy Diabetes
Diabetes Epilepsy
Blood Disorder Blood Disorder
Thyroid Condition Thyroid Condition
5.6%
Less than 1%
19.6%
Less than 1%
Less than 1%
Less than 1%
Less than 1%

42
Section 7 – Employee Assistance
TABLE 28 – USE OF EAP SERVICES
TYPE 2017 2016 2015
HEADS MALE FEMALE HEADS MALE FEMALE HEADS MALE FEMALE
Legal helpline
41
49
52
Telephone counselling helpline
134
120
101
TOTAL HELPLINE USAGE 175 16% 84% 169 28% 72% 153 24% 76%
Referrals for structured counselling 68 59 48
Data relates to the period October to September.
The number of staff accessing the services of the Employee Assistance Programme increased slightly in 2017. The UWE workforce is 59% female and 41% male, therefore the data shows that a higher proportion of female staff use the service; the proportion of male staff has decreased in 2017.

43
Section 8 – Benchmark Performance Indicators
Category
DLA Piper Benchmark data* UWE performance
HEI averag
e
HEI upper
quartile (UQ)
Public sector averag
e
Actual** Target
2015 2016 2017 2019 2020 Long term
HR staff: all employees 1:75 1:81 1:77 1:65 1:61 1:62 HEI average
HR staff cost per employee £560 £650 £549 £526 £575 £572 HEI average
Staff costs as % of total UWE costs 61% 60% 61% 58% 58%
Female staff in top 5% of earners 34% 41% 35% 40% 42% 42% 46% 50%
BME staff 12% 17% 12% 8.1% 8.5% 9.5% 12% 16%
Disabled staff 5.2% 5.7% 4.5% 6.2% 6.1% 6.2% 7.4% 9%
Staff on temporary/fixed term contracts 19% 25% 16% 23% 23% 24% - - -
Part time staff 30% 34% 30% 40% 39% 40% - - -
Voluntary staff turnover 8.7% 9.6% 8.5% 6.6% 6.5% 7.1% - - -
Grievances (per 1,000 employees)*** 3.0 0.9 3.9 1.5 1.5 1.0 HEI Average
Disciplinaries (per 1,000 employees)*** 6.0 3.3 8.4 1.8 2.5 1.4 HEI Average
Tribunal applications (per 1,000 employees)*** 0.9 0.3 1.2 0 0 0 HEI LQ
Sickness: days off per employee*** 5.8 4.9 6.9 7.2 8.2 8 HEI LQ
Sickness: % of working days lost*** 2.6% 2.0% 3.1% 2.8% 3.2% 3.1% HEI LQ
Staff recommending UWE as a place to work 65% 75% 77% 80%
Staff feeling valued/recognised for their work 57% 61% 75% 80%
Staff feeling proud to work for UWE 71% 79% 80% 80% * The year shown is the year of the DLA Piper Benchmark survey publication – the data is that returned for the previous year.
** Where DLA Piper benchmark data is provided the data for UWE relates to UWE’s DLA Piper Benchmark survey response for that publication year based the DLA Piper data definitions so will be different from values for the same metric shown elsewhere in the compendium.
*** Values in HEI upper quarter (UQ) column are lower quartile values for these categories.