stability improvement solution of the smart power grid by
TRANSCRIPT

Stability Improvement Solution of the Smart Power Grid by an Analysis of Voltage
Variation in Intelligent Buildings
Abid Ahmad Khan, Torsten Wiens and Michael Massoth Department of Computer Science
Hochschule Darmstadt — University of Applied Sciences, Germany
abid.a.khan | torsten.wiens | [email protected]
Abstract — This paper describes an approach to minimize the
uneven effect of voltage and power in smart buildings and on
electrical networks. The analysis is performed by considering
diverse scenarios in smart power grids. The idea is to calculate
the actual power consumption and power reserves of selected
Smart Homes. In a second step, the effect of voltage variation
on intelligent buildings and on electrical networks is
investigated. In the last part, the control application of Next
Generation Network (NGN) and stationary storages for
improving the stability, especially those with a high percentage
of in-feeds from renewable energy sources (RES) are discussed
and evaluated. We consider intelligent buildings or Smart
Homes based on Next Generation Network (NGN) components.
The NGN components are applied as a communication and
integration platform between the smart phone of smart home
owners, the home automation and building control system as
well as the energy suppliers of the smart power grid. Smart
Home appliances based on the KNX bus, the Session Initiation
Protocol (SIP) and the Presence Service are used to build a
well performing and scalable system based on open source
software.
Keywords - Energy Management, Home Automation;Smart
Power Grid, NGN, Presence Service.
I. INTRODUCTION
Intelligent power grids are the core of the future power
supply. As a part of smart cities, smart buildings (facilities
or houses), smart appliances, smart thermostats, smart
meters, real-time dynamic pricing and next-day energy
information feedback to electricity users play an important
role in this intelligent management infrastructure. Every part
of our environment will be connected to each other and can
be controlled with the given rights from central points, and
to exchange both energy and information. The actual
intelligence is the IT-supported structure and control tactics
especially to match fluctuating Smart Grids, which are
supposed to guarantee stable power supplies within the
European Norms. For the stability of a system with a Smart
Grid, there are two main criteria: First, the generation has to
match the demand at any time and has to hold a reserve
(battery storage) for immediate outages. Second, the grid
has to provide sufficient capacity for the voltage stability at
every portion. According to our particular status and main
problems, all countries need to simplify the Smart cities and
adjust it to fit their own features. The purpose and relevance
of this paper is to describe energy management mechanisms
and tactics that include manual and automated control of
equipment from uncertain energy sources, and to investigate
various issues regarding energy instabilities of the smart
building systems. In our consideration, our Smart Homes
make use of Next Generation Network technologies (NGN),
based on the Session Initiation Protocol (SIP) and the
Presence Service [1]. By this way, a near-real-time push
solution is realized, using the IP Multimedia Subsystem
(IMS) to remotely monitor and control Home Automation
systems via mobile devices with open source software. This
is described in our previous work [1][2]. According to the
latest report by GTM Research, the U.S. home energy
management market is forecasted to be worth over 4 billion
USD by 2017[3]. This forecast shows the business
opportunities and relevance of the proposed document for
home control and energy management services. According
to this source, the sectors with the biggest potential for
saving energy are buildings and mobility.
II. STRUCTURE OF THE PAPER
Following the introduction, Section III shows related
work for the suitability of our previous idea to apply a
control solution based upon NGN technology. In Section IV,
the general concept is outlined and important use cases are
presented. The overall system design is described in Section
V. The calculation is discussed and evaluated in Sections VI
and VII. The components used to analyze the solution are
presented in Section VIII. Section IX concludes the paper
and gives an outlook of future work.
III. RELATED WORK
Many companies and institutions are working on
solutions for energy efficient management for buildings. In
our previous work, [1], [2], [13], [17], we presented the
detailed idea and hands-on work on operational tools and
calculation experiments done on our prototype. The primary
idea is to connect the technology of Next Generation
Networks (NGN) to Smart Homes. The next step is to use
SIP with all its benefits as the main communication protocol
and connect it with a bus system standard, in this case KNX
[4]. For the home appliances (sensors, actors), a signaling
gateway between the KNX home automation and building
control system [5] and SIP, allowing communication of
13Copyright (c) IARIA, 2014. ISBN: 978-1-61208-363-6
SMART 2014 : The Third International Conference on Smart Systems, Devices and Technologies

mobile devices with KNX sensors/actors using existing SIP
infrastructure, is applied.
The focus of this document is to analyze the
instability of NGN based smart homes
today’s power system requirements; it is the upholding of the
voltage regulation within the permitted voltage range in
distribution grids on the low voltage and middle voltage
level. The consumption of electrical power causes the
voltage to drop at the junction point of the smart buildings
whereas injection of power will make it rise. This overshoot
and-dip-effect increases with the power and the distance of
the smart buildings to the substation. If the voltage drop or
rise gets too high, the distribution system operator has to take
counter measures. This is because the end users
and electrical devices are designed for a certain voltage
range defined by European norms EN50160:2007 [16
amplitude of the supply voltage is defined in the N
given in Table I.
TABLE I. TABLE I. AMPLITUDE OF S
Voltage Magnitude LV: U =230V MV: "by convention"
Voltage Magnitude variations
LV, MV: ±10% for 95% week
It is defined in these norms that the magnitudevoltage and high voltage should be in the given range
IV. USE CASES OF SMART
MANAGEMENT
In this section, the uneven effect of two typical use cases
of smart energy management, electric load
regulating are discussed.
A. Use case (UC1): Insufficient or lack of renewable
energy
In our previous work [1], [2], we di
case (UC1), the power consumption and load in the city
reaches its maximum level. During the sam
feed-in of renewable energy is diminishing
e.g., because of wind calm or the lack of sun radiation.
Figure 1 illustrates this situation.
Figure 1. Maximum load scenario
mobile devices with KNX sensors/actors using existing SIP
o analyze the power
instability of NGN based smart homes. In order to meet
is the upholding of the
voltage regulation within the permitted voltage range in
distribution grids on the low voltage and middle voltage
. The consumption of electrical power causes the
drop at the junction point of the smart buildings,
injection of power will make it rise. This overshoot-
effect increases with the power and the distance of
the substation. If the voltage drop or
rise gets too high, the distribution system operator has to take
because the end users’ appliances
and electrical devices are designed for a certain voltage
50160:2007 [16]. The
pply voltage is defined in the Norm and
SUPPLY VOLTAGE
LV: U =230V MV: "by convention"
LV, MV: ±10% for 95% week
magnitudes of the low voltage and high voltage should be in the given range.
SMART ENERGY
ffect of two typical use cases
electric load balancing and
Use case (UC1): Insufficient or lack of renewable
we discussed that in use
the power consumption and load in the city
reaches its maximum level. During the same time frame, the
in of renewable energy is diminishing to the minimum,
because of wind calm or the lack of sun radiation.
load scenario
After further analysis on this topic
times of high load, the voltage at the terminals mig
below 0.9 p. u. (red line) equivalent to 207
supplied or consumed voltage level
European Norm EN50160:2007
with the power and the distance of the smart houses to the
substation. If the voltage drop gets too high, the distribution
system operator has to take counter measures
instrument to counteract this effect
changer transformers, because the end users appliances and
electrical devices are designed for a certain voltage rang
defined by European Norm. This lack of electric power shall
be balanced with an optimum approach at least partly by the
intelligent buildings of the city. In order to do that
of energy is signaled by the power providers towards the
owners of intelligent buildings in the city by means of usual
communication technologies. The house owners can then
react by turning off domestic appliances (e.g.,
set air conditioning units or heat pumps into eco
deactivate charging stations for electric cars and vehicles.
Therefore, the energy supply within the city could be
balanced in a better way by the swarm behavior of the
intelligent consumers by de-activating power loads.
B. Use case (UC2): Surplus or excess of renewable
energy
In our previous work [1]
(UC2), the power consumption and load in the city reaches
its lowest level. During the same time frame, the renewable
energy is fed into the power grid at maximum
of strong winds or strong sun radiation.
this situation.
Figure 2. Low load scenario
In times of high Photo voltaic (PV)
load, this is likely to occur in the morning hours
Voltaic (PV) injection shown here is just to sketch
of getting more power from
Injection of power may make the voltage
up to 1.1 p.u. (red line), equivalent to 253
possible voltage violation according to European
overshoot effect increases with the power and the distance of
smart houses to the substation. If the voltage rise gets too
high, the distribution system operator has to take counter
After further analysis on this topic, we have found that in
times of high load, the voltage at the terminals might fall
equivalent to 207 V, which is a
supplied or consumed voltage level violation according to
EN50160:2007. This dip effect increases
ith the power and the distance of the smart houses to the
substation. If the voltage drop gets too high, the distribution
system operator has to take counter measures. The typical
instrument to counteract this effect is the application of tap-
because the end users appliances and
electrical devices are designed for a certain voltage range
. This lack of electric power shall
optimum approach at least partly by the
ity. In order to do that, the lack
of energy is signaled by the power providers towards the
owners of intelligent buildings in the city by means of usual
communication technologies. The house owners can then
off domestic appliances (e.g., white goods),
or heat pumps into eco-mode and
deactivate charging stations for electric cars and vehicles.
Therefore, the energy supply within the city could be
balanced in a better way by the swarm behavior of the
activating power loads.
Use case (UC2): Surplus or excess of renewable
], [2], we also discussed that in
the power consumption and load in the city reaches
its lowest level. During the same time frame, the renewable
energy is fed into the power grid at maximum levels because
of strong winds or strong sun radiation. Figure 2 illustrates
Low load scenario
Photo voltaic (PV) injection and low
load, this is likely to occur in the morning hours. High Photo
injection shown here is just to sketch the idea
of getting more power from the grid to the consumer.
make the voltage at the terminals rise
equivalent to 253 V, which is also a
tion according to European Norm. This
overshoot effect increases with the power and the distance of
t houses to the substation. If the voltage rise gets too
high, the distribution system operator has to take counter
14Copyright (c) IARIA, 2014. ISBN: 978-1-61208-363-6
SMART 2014 : The Third International Conference on Smart Systems, Devices and Technologies

measures, because the end users appliances and electrical
devices are designed for a certain voltage range
above). Again, this surplus or excess of electric power shall
be used with optimum approach by the intelligent buildings
of the city. In order to do that, the surplus of energy is
signaled by the energy suppliers towards the owners of
intelligent buildings in the city. In this
app is used. The house owners with
application can react by turning on additional
such as domestic appliances (e.g., white goods, air
conditioning units or heat pumps), as well as electric cars
and vehicles. Also in this case, the energy supply within the
city could be balanced by the swarm behavior of the
intelligent consumers.
V. CONCEPT AND OVERALL SYSTEM
The core concept is to minimize the uneven
smart buildings on electrical networks a
power grid, by analyzing and controlling the
the intelligent buildings. The use of information technology
allows to improve how the electricity travels from the power
grid with power system stability to consumer consumption
integration. The basic idea is to balance loads in power grids
by using KNX-enabled Smart Homes and a communication
infrastructure based on NGN technologies and the Presence
Service. The advantages of Next Generation Networks are
used to build a communication platform between mobile
devices and an intelligent building with a Home Automation
solution.
Figure 3. Control system with smart loads
Figure 4. Transmission from Grid to distribution network
measures, because the end users appliances and electrical
devices are designed for a certain voltage range only (as
surplus or excess of electric power shall
be used with optimum approach by the intelligent buildings
of the city. In order to do that, the surplus of energy is again
signaled by the energy suppliers towards the owners of
this case, a smart phone
The house owners with a smart phone
application can react by turning on additional power loads
such as domestic appliances (e.g., white goods, air
conditioning units or heat pumps), as well as electric cars
, the energy supply within the
city could be balanced by the swarm behavior of the
SYSTEM DESIGN
The core concept is to minimize the uneven effect of
networks and on the smart
controlling the load profile of
The use of information technology
how the electricity travels from the power
grid with power system stability to consumer consumption
alance loads in power grids
enabled Smart Homes and a communication
infrastructure based on NGN technologies and the Presence
Service. The advantages of Next Generation Networks are
ion platform between mobile
devices and an intelligent building with a Home Automation
Control system with smart loads L9.....L20
Figure 3 depicts the smart loads and
architecture. For simplicity, the
20. To analyze the facts related to smart homes and power
networks, an integrated engineering tool is used
power system calculations. The following features are
provided by “Dig SILENT Power Factory
designed as an advanced integrated and interactive
package dedicated to electrical power system and control
analysis in order to achieve the main objectives of plann
and operation optimization.
load-flow, stability calculation and modal analysis.
To design a Distribution model of
network and a power grid,
applied which include the external grid, transformers, bus
bars etc. (see Figure 4.) At first
voltage) was connected to the bus
bar was connected to a transformer (step
parameters being 120/20 k
connected to the bus-bar (B2).
kV (step-down), the high-voltage end
and the low-voltage end connected to B3. A specific
transmission line, one end connected to B3 and the other
to consumer (load), was set up, the
400V and 230 V Line-Ground. There
houses and 23 normal houses
power factor 0.95 to bus-bar B3. The transmission line
is 5 km in length. The resistance value for each kilometer of
B3 is 0.2215 Ohm, with a reactance of 0.037
voltage is applied to the transmission line (B3), due to
different loads, the voltage sags from 400
voltage 343 V is not according to the E
According to the norms,
magnitude variation of the reference voltage
distribution grid model consists
three transformers 0.4 kV, four
cell) and one motor (battery). E
could be 1 to n number of customers. Three transmission
lines are connected to one bus
transformer (20/0.4 kV). The other two transmission lines are
connected to a separate bus
another transformer (20/0.4 k
tasks: Energy balancing and operational control. Both tasks
Transmission from Grid to distribution network and transmission from distribution to consumer
smart loads and their control system
the loads are named L 9, 10, 19,
o analyze the facts related to smart homes and power
ngineering tool is used for the
. The following features are
Dig SILENT Power Factory” [10]: It has been
designed as an advanced integrated and interactive software
package dedicated to electrical power system and control
ve the main objectives of planning
Some of these functions are
calculation and modal analysis.
model of a smart home electrical
the following steps have been
external grid, transformers, bus-
At first, an external grid (medium
the bus-bar (B1). The specific bus-
a transformer (step-down), the
kV. The low-voltage side was
bar (B2). Transformer T1…T3.20/0.4
voltage end was connected to B2,
voltage end connected to B3. A specific
transmission line, one end connected to B3 and the other end
, was set up, the Line-Line voltage being
Ground. There is a total of 12 smart
houses and 23 normal houses, resp. Loads (1.14 kW each),
bar B3. The transmission line of B3
th. The resistance value for each kilometer of
reactance of 0.037 Ohm. When
transmission line (B3), due to
voltage sags from 400 V to 343 V. The
V is not according to the European norms.
there can be ±10% voltage
of the reference voltage. The
consists of five transmission lines,
, four photo voltaic generators (PV
cell) and one motor (battery). Every load at the consumer
1 to n number of customers. Three transmission
lines are connected to one bus-bar, which is connected to one
The other two transmission lines are
a separate bus-bar, which is connected to
kV). Now, there are mainly two
tasks: Energy balancing and operational control. Both tasks
ransmission from distribution to consumer end
15Copyright (c) IARIA, 2014. ISBN: 978-1-61208-363-6
SMART 2014 : The Third International Conference on Smart Systems, Devices and Technologies

are closely linked, since the power which is generated at
different places and times in the grid mus
transported. According to the German Energy Industry Act,
the power from internal Renewable Energy Sources (RES)
generators must be evacuated [6]. For further coverage of
30% RES, contracts for RES outside the grid have been
made. However, forecast and reality do not always match
neither on the generation nor on the load side
VI. EVALUATION AND ANALYSIS OF THE OUTPUT PLO
The scenario being displayed in Figure 5
load connection. It shows a voltage dip after each
Figure 5. Transmission line with max load smart homes
In Figure 6, the scenario being displayed
Figure 6. Plot: Voltage drop across supply line, high load at terminals
Given that the voltage has dropped from 1 p.u to 0.97
p.u, equivalent to 207V, at the end of the line
shows that when smart high load is connected on a
transmission line, there will be a voltage drop at the
consumer end and the effect is increasing when the distance
to the substation is increasing. Line-to
Phase voltages are reducing drastically. At the end, the
voltage variations are violating the Norms.
EN50160:2007, it should be within the 10% range
tap-changer transformers are used by distribution system
operators as the typical instrument to counteract this effect.
The technique is to choose another tap winding
voltage in the substation increases,
terminal voltage. However, they can only be operated in
load-less state which is a great disadvantage.
supplied from the grid, the feed-in of renewable energy is
diminishing to the minimum and the consumer
load state. The voltage at the transmission
which has to be improved to a standard according to the
Norms. Electrical appliances can be damaged if the voltage
levels are not kept within the Norms. The electrical
appliances at households cannot bear such decreases in
voltage. More current will be drawn by
are closely linked, since the power which is generated at
d must be evacuated and
to the German Energy Industry Act,
the power from internal Renewable Energy Sources (RES)
For further coverage of
30% RES, contracts for RES outside the grid have been
forecast and reality do not always match,
neither on the generation nor on the load side [11].
IS OF THE OUTPUT PLOTS
in Figure 5 shows the high
voltage dip after each load.
Transmission line with max load smart homes
scenario being displayed is high load.
Voltage drop across supply line, high load at terminals
that the voltage has dropped from 1 p.u to 0.97
at the end of the line. The graph
shows that when smart high load is connected on a
transmission line, there will be a voltage drop at the
and the effect is increasing when the distance
to-Line and Line-to-
Phase voltages are reducing drastically. At the end, the
voltage variations are violating the Norms. According to
t should be within the 10% range. Usually,
changer transformers are used by distribution system
ors as the typical instrument to counteract this effect.
another tap winding, so that the
also affecting the
they can only be operated in
less state which is a great disadvantage. If the voltage is
in of renewable energy is
and the consumer is in the high
. The voltage at the transmission line is decreased
andard according to the
lectrical appliances can be damaged if the voltage
levels are not kept within the Norms. The electrical
appliances at households cannot bear such decreases in
by appliances, causing
more expenses and affect
appliances. In the following,
(PV) injection scenario is described (Figure
connected to bus-bar B3 (0.4
connected via a generator to smart houses.
Figure 7. Transmission line with surplus power smart homes
In Figure 8, the scenario being displayed
of in-feed, high Photo voltaic (PV
Figure 8. Plot: High Photo voltaic (PV)
Figure 8 shows the results, in which
from 1.0 p.u to 1.10 p.u equivalent to 253 V, at the end of
the line. Due to the power injection by the generators (PV
panels) on the specific loads
generator, the effect will be distributed and the voltage is
increased after every kilometer. Due to this injection of
power, the transmission line voltage went high.
voltage shows an overshoot from norma
violating the Norms, when excess power is available.
compensation should be made.
generators (roof of house) are replaced with asynchronous
generators, just to implement the idea. The active power of
each generator is 0.0045 MW, the reactive
MVAr, and the consumer is considered
the voltage is now supplied
injection is applied with the consumer
the voltage at the transmission line is increased (overshoot),
which has to be lowered to a standard according to the
Norms. The electrical appliances at households cannot bear
such increase in voltage. D
appliances. Also, the efficiency of these appliances
affected.
VII. CALCULATION AND
The purpose of this calculation is to find the actual power
which is needed to minimize the uneven effect of our smart
houses, so an optimal control and
can be applied. Voltages with
Concerning the given voltage magnitude variations, the
and affecting the efficiency of these
In the following, the second high Photo voltaic
is described (Figure 7). Each load is
bar B3 (0.4 kV). Every alternate load is
enerator to smart houses.
Transmission line with surplus power smart homes
he scenario being displayed is high integration
high Photo voltaic (PV) injection.
igh Photo voltaic (PV) generation violates voltage criteria
, in which the voltage increases
from 1.0 p.u to 1.10 p.u equivalent to 253 V, at the end of
ue to the power injection by the generators (PV
cific loads, which are connected to that
the effect will be distributed and the voltage is
kilometer. Due to this injection of
power, the transmission line voltage went high. The system
voltage shows an overshoot from normal range, therefore
orms, when excess power is available. Then,
made. The Photovoltaic (PV)
(roof of house) are replaced with asynchronous
just to implement the idea. The active power of
each generator is 0.0045 MW, the reactive Power is 0
and the consumer is considered to be a household. If
supplied by the grid and the generator
injection is applied with the consumer having less load state,
he voltage at the transmission line is increased (overshoot),
which has to be lowered to a standard according to the
Norms. The electrical appliances at households cannot bear
Damage can be caused to the
the efficiency of these appliances can be
ALCULATION AND EVALUATION
of this calculation is to find the actual power
which is needed to minimize the uneven effect of our smart
optimal control and balancing technique [1]
ith U=230V are used as reference.
the given voltage magnitude variations, the
16Copyright (c) IARIA, 2014. ISBN: 978-1-61208-363-6
SMART 2014 : The Third International Conference on Smart Systems, Devices and Technologies
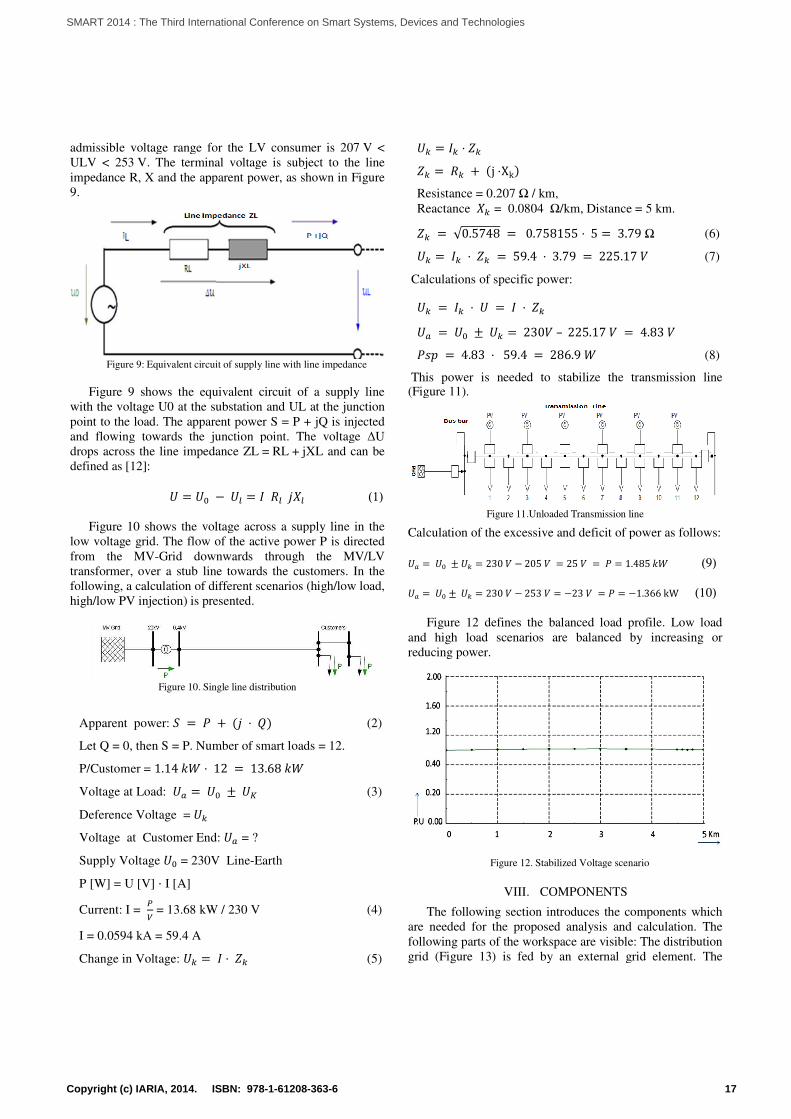
admissible voltage range for the LV consumer
ULV < 253 V. The terminal voltage is subject to the line
impedance R, X and the apparent power, as shown
9.
Figure 9: Equivalent circuit of supply line with line impedance
Figure 9 shows the equivalent circuit of a supply line
with the voltage U0 at the substation and UL at the junction
point to the load. The apparent power S
and flowing towards the junction point. The voltage
drops across the line impedance ZL = RL
defined as [12]:
Figure 10 shows the voltage across a supply line in the
low voltage grid. The flow of the active power P is directed
from the MV-Grid downwards through the MV/LV
transformer, over a stub line towards the customers
following, a calculation of different scena
high/low PV injection) is presented.
Figure 10. Single line distribution
Apparent power: ⋅
Let Q = 0, then S = P. Number of smart
P/Customer = 1.14 ⋅ 12 13.68
Voltage at Load:
Deference Voltage =
Voltage at Customer End: = ?
Supply Voltage = 230V Line-Earth
P [W] = U [V] ⋅ I [A]
Current: I =
= 13.68 kW / 230 V
I = 0.0594 kA = 59.4 A
Change in Voltage: ⋅
admissible voltage range for the LV consumer is 207 V <
V. The terminal voltage is subject to the line
dance R, X and the apparent power, as shown in Figure
: Equivalent circuit of supply line with line impedance
shows the equivalent circuit of a supply line
with the voltage U0 at the substation and UL at the junction
= P + jQ is injected
and flowing towards the junction point. The voltage ∆U
RL + jXL and can be
! (1)
shows the voltage across a supply line in the
low voltage grid. The flow of the active power P is directed
Grid downwards through the MV/LV
transformer, over a stub line towards the customers. In the
of different scenarios (high/low load,
line distribution
(2)
smart loads = 12.
68
(3)
arth
(4)
(5)
⋅
j⋅Xk
Resistance = 0.207 Ω / km,
Reactance ! = 0.0804 Ω
√0.5748 0.758155
⋅ 59.4 ⋅ 3
Calculations of specific power
⋅ ⋅
230*–
,- 4.83 ⋅ 59.4 286
This power is needed to stabilize(Figure 11).
Figure 11.Unloaded Transmission line
Calculation of the excessive and deficit of power as follows
230* 205*
230* 253*
Figure 12 defines the balanced l
and high load scenarios are
reducing power.
Figure 12. Stabilized Voltage scenario
VIII. COMPONENTS
The following section introduces the components which
are needed for the proposed analysis and calculation.
following parts of the workspace are visible:
grid (Figure 13) is fed by an external grid element.
,
Ω/km, Distance = 5 km.
758155 ⋅ 5 3.79Ω (6)
3.79 225.17* (7)
pecific power:
– 225.17* 4.83*
286.9 (8)
to stabilize the transmission line
Unloaded Transmission line
Calculation of the excessive and deficit of power as follows:
25* 1.485 (9)
23* 1.366kW (10)
alanced load profile. Low load
are balanced by increasing or
Stabilized Voltage scenario
COMPONENTS
The following section introduces the components which
are needed for the proposed analysis and calculation. The
ts of the workspace are visible: The distribution
is fed by an external grid element. The
17Copyright (c) IARIA, 2014. ISBN: 978-1-61208-363-6
SMART 2014 : The Third International Conference on Smart Systems, Devices and Technologies
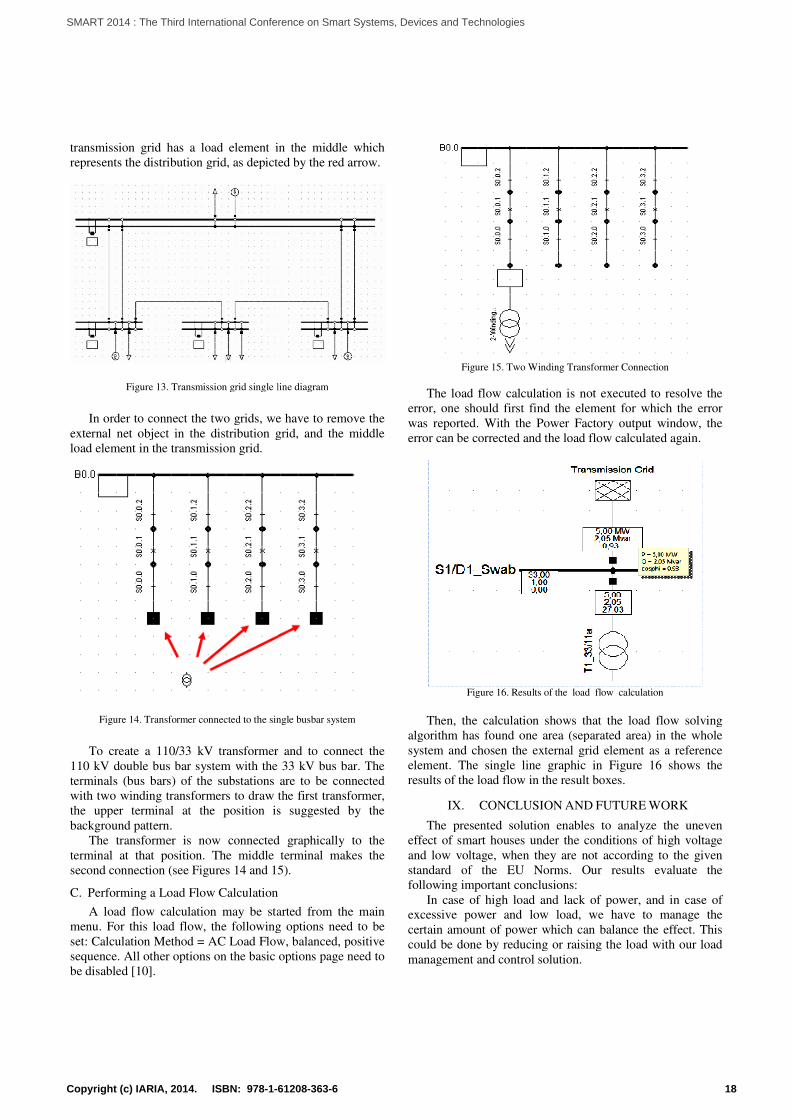
transmission grid has a load element in the middle which
represents the distribution grid, as depicted by the red arrow.
Figure 13. Transmission grid single line diagram
In order to connect the two grids, we have to remove the
external net object in the distribution grid, and
load element in the transmission grid.
Figure 14. Transformer connected to the single busbar system
To create a 110/33 kV transformer and
110 kV double bus bar system with the 33 kV bus bar.
terminals (bus bars) of the substations are to be connected
with two winding transformers to draw the first transformer
the upper terminal at the position is
background pattern.
The transformer is now connected
terminal at that position. The middle terminal make
second connection (see Figures 14 and 15)
C. Performing a Load Flow Calculation
A load flow calculation may be started from the main
menu. For this load flow, the following options
set: Calculation Method = AC Load Flow, balanced, positive
sequence. All other options on the basic options page
be disabled [10].
load element in the middle which
represents the distribution grid, as depicted by the red arrow.
Transmission grid single line diagram
In order to connect the two grids, we have to remove the
external net object in the distribution grid, and the middle
Transformer connected to the single busbar system
create a 110/33 kV transformer and to connect the
110 kV double bus bar system with the 33 kV bus bar. The
terminals (bus bars) of the substations are to be connected
o draw the first transformer,
is suggested by the
transformer is now connected graphically to the
middle terminal makes the
(see Figures 14 and 15).
A load flow calculation may be started from the main
For this load flow, the following options need to be
Calculation Method = AC Load Flow, balanced, positive
ll other options on the basic options page need to
Figure 15. Two Winding Transformer Connection
The load flow calculation is not executed to resolve the
error, one should first find the element for which the
was reported. With the Power Factory output window,
error can be corrected and the load flow calculated again.
Figure 16. Results of the
Then, the calculation shows that the load flow solving
algorithm has found one area (separated area) in the whole
system and chosen the external grid element as
element. The single line graphic
results of the load flow in the resul
IX. CONCLUSION
The presented solution enables to analy
effect of smart houses under
and low voltage, when they are
standard of the EU Norms. Our results evaluate the
following important conclusions:
In case of high load and lack of power, and in case of
excessive power and low load
certain amount of power which can balance the effect
could be done by reducing or raising the load with our load
management and control solution.
Two Winding Transformer Connection
The load flow calculation is not executed to resolve the
first find the element for which the error
was reported. With the Power Factory output window, the
can be corrected and the load flow calculated again.
Results of the load flow calculation
calculation shows that the load flow solving
algorithm has found one area (separated area) in the whole
system and chosen the external grid element as a reference
element. The single line graphic in Figure 16 shows the
results of the load flow in the result boxes.
CONCLUSION AND FUTURE WORK
The presented solution enables to analyze the uneven
nder the conditions of high voltage
when they are not according to the given
U Norms. Our results evaluate the
following important conclusions:
In case of high load and lack of power, and in case of
excessive power and low load, we have to manage the
which can balance the effect. This
reducing or raising the load with our load
management and control solution.
18Copyright (c) IARIA, 2014. ISBN: 978-1-61208-363-6
SMART 2014 : The Third International Conference on Smart Systems, Devices and Technologies

According to our previous work, there is a need of a fully
automated appropriate control and load management
application with near-real-time push properties, which can
respond in real time. This methodic approach could balance
the existing smart buildings. Advancements are required in
the existing power management systems [18].
An interesting alternative is the integration of battery
backup systems. Already a proven technology for
uninterrupted power supply (UPS) units, they become
increasingly interesting for applications in power systems.
They cannot only be used for energy balancing purposes, but
can also serve as primary and secondary control reserve.
Actually, this concept is not new: A battery-based system
was built in Germany for voltage and frequency stabilization
for the supply of the island network used in West Berlin
1986. The 17 MW plant / 14 MWh [13] was to going
through an entire charge and discharge cycle twice per day..
Keeping in view of the fact if emerging renewable energy
sources act as separate generation, they cannot balance the
existing energy demand [14]. It is necessary that RES will be
integrated in the existing power grid. Due to this integration,
the power demands will be balanced at the peak time
duration in the grids. This idea will be addressed in future
work.
The software being used in this work is a limited version
in which only small networks can be analyzed. For future
work, voltage variations are to be looked upon at larger
scales. This will be done with an extended version of the
software, allowing designing a whole city grid model. The
number of transmission lines will be increased as well as the
number of parameters for the distribution grid. Thus, we will
have the knowledge to give an intelligent idea within this
remarkable field of study.
ACKNOWLEDGMENT
This work has been performed within the project “Smart
Home Control” at Hochschule Darmstadt (University of
Applied Sciences). The authors would like to acknowledge
the support of the Energy Lab at the University for Access to
the Dig Silent software and Albrecht JUNG GmbH & Co.
KG for their contribution of KNX actors, sensors and other
KNX home automation devices and kind support.
REFERENCES
[1] M. Massoth and T.Wiens, “Trustful interaction between intelligent building control and Energy suppliers of the smart power Grid". In: Proceedings of the 2nd International Conference on smart system, devices and technology (SMART 2013), IARIA, 2013.
[2] M. Massoth et al., “Ubiquitous Smart Grid Control Solution based on
a Next Generation Network as Integration Platform”. In: Proceedings of the 1st International Conference on Smart Grids, Green Communications and IT Energy-aware Technologies (ENERGY 2011), IARIA, 2011.
[3] Greentech Media, Home Energy Management Systems. [Online]. Available from: http://www.greentechmedia.com/research/report/ home-energy-management-systems-2013-2017 2014.05.01
[4] Android. [Online]. Available from: http://www.android.com 2014.05.06.
[5] KNXAssociation, KNX Standard. [Online]. Available from: http://www.knx.org/knx-standard/standardisation 2014.05.06.
[6] Bundesministerium des Inneren, Energiewirtschaftsgesetz. [Online]. Available from: http://www.gesetze-im-internet.de/ bundesrecht/ Energy Act _[2005]/gesamt.pdf 2014.05.06.
[7] P. Kundur and J. Paserb, “Definition and Classification of Power
System Stability”. In: IEEE Transactions on Power Systems, vol. 19. pp. 1387-1401, Aug 2004.
[8] AsianPower & EnergyFront, China challenging smart grid. [Online]. Available from: http://my.reset.jp/~adachihayao/indexE100319.htm 2014.05.06.
[9] G. M. Shafiullah, Potential challenges: Integrating renewable energy with the SmartGrid. In: Proceedings of the IEEE Universities Power Engineering Conference (AUPEC), 2010.
[10] Dig Silent, Dig Silent Power Factory, version 14.23 software. [Online]. Available from: http://www.digsilent.de/ 2014.05.06.
[11] AsianPower & EnergyFront, Smart Grid. [Online]. Available from: http://my.reset.jp/~adachihayao/indexE100319.htm 2014.05.06.
[12] L. Petry, “Renewable energies - Master of Electrical Engineering (Power)”. University of Applied Sciences Darmstadt, 2011.
[13] T. H. Fiedler, “Mobile and Immobile Components in Modern Power
Grids for Improving Stability”. Faculty of Electrical Engineering, IOSUD, 2010.
[14] M. Liserre, T. Sauter and J. Y. Hung, “Future Energy Systems: Integrating Renewable Energy Sources into the Smart Power Grid through Industrial Electronics”, Industrial Electronics Magazine (IEEE), vol 4, issue 1, 2010.
[15] tED magazine, Special Report. [Online]. Available from: http://www.tedmag.com/news/news-room/special-report/Special- Report/Special-Report-[1-22-20098].aspx 2014.05.06.
[16] Deutsches Institut für Normung, DIN EN 50160 [Online]. Available
from: http://www.leonardo-energy.org/good-practice-guide/standard-en-50160 energy.org/repository/Library/PQGuide/5.Voltage%20Disturbances/5.4.2%20Standard %20EN50160.pdf 2014.05.06.
[17] T. Fiedler, D. Metz, P.-M. Mircea and I. Mircea, “Planning and Training Tools for Intelligent Power Systems”. In: Proceedings of the MedPower Conference, Thessaloniki, Greece, 2008.
[18] Task Force on HarrnonicS Modeling and Shulation, “Modeling and simulation of the propagation of harmonics in electric power networks: Part 1: Concepts, models, and simulation techniques.”, IEEE Transactions on Power Delivery, vol. 11, 1996, pp. 452–465.
19Copyright (c) IARIA, 2014. ISBN: 978-1-61208-363-6
SMART 2014 : The Third International Conference on Smart Systems, Devices and Technologies