st. jude children’s research hospital,inc. and subsidiaries
TRANSCRIPT

St. Jude Children’s Research Hospital, Inc. and Subsidiaries Consolidated Financial Statements as of and for the Years Ended June 30, 2020 and 2019, Supplemental Information for the Year Ended June 30, 2020 and Independent Auditors’ Report
ST. JUDE CHILDREN’S RESEARCH HOSPITAL, INC. AND SUBSIDIARIES
TABLE OF CONTENTS
Page
INDEPENDENT AUDITORS’ REPORT 1–2
CONSOLIDATED FINANCIAL STATEMENTS AS OF AND FOR THE YEARS ENDED JUNE 30, 2020 AND 2019:
Statements of Financial Position 3
Statements of Activities 4
Statements of Functional Expenses 5
Statements of Cash Flows 6
Notes to Consolidated Financial Statements 7–23
SUPPLEMENTAL INFORMATION FOR THE YEAR ENDED JUNE 30, 2020: 24
Schedule of Expenditures of Federal Awards 25–31
Notes to Schedule of Expenditures of Federal Awards 32
Schedule of Amounts Provided to Subawardees 33–35
Schedule of Expenditures of State Financial Assistance 36
Notes to Schedule of Expenditures of State Financial Assistance 37
INDEPENDENT AUDITORS’ REPORT ON INTERNAL CONTROL OVER FINANCIAL REPORTING AND ON COMPLIANCE AND OTHER MATTERS BASED ON AUDIT OF CONSOLIDATED FINANCIAL STATEMENTS PERFORMED IN ACCORDANCE WITH GOVERNMENT AUDITING STANDARDS 38–39
INDEPENDENT AUDITORS’ REPORT ON COMPLIANCE FOR EACH MAJOR FEDERAL PROGRAM, REPORT ON INTERNAL CONTROL OVER COMPLIANCE, AND REPORT ON SCHEDULE OF EXPENDITURES OF FEDERAL AWARDS REQUIRED BY UNIFORM GRANT GUIDANCE 40–42
SCHEDULE OF FINDINGS AND QUESTIONED COSTS 43–45
INDEPENDENT AUDITORS’ REPORT
To the Board of Governors of St. Jude Children’s Research Hospital, Inc. Memphis, Tennessee
We have audited the accompanying consolidated financial statements of St. Jude Children’s Research Hospital, Inc. and its wholly owned subsidiaries (collectively, the “Hospital”), which comprise the consolidated statements of financial position as of June 30, 2020 and 2019, and the related consolidated statements of activities, functional expenses, and cash flows for the years then ended, and the related notes to the consolidated financial statements.
Management’s Responsibility for the Consolidated Financial Statements
Management is responsible for the preparation and fair presentation of these consolidated financial statements in accordance with accounting principles generally accepted in the United States of America; this includes the design, implementation, and maintenance of internal control relevant to the preparation and fair presentation of consolidated financial statements that are free from material misstatement, whether due to fraud or error.
Auditors’ Responsibility
Our responsibility is to express an opinion on these consolidated financial statements based on our audits. We conducted our audits in accordance with auditing standards generally accepted in the United States of America and the standards applicable to financial audits contained in Government Auditing Standards, issued by the Comptroller General of the United States. Those standards require that we plan and perform the audit to obtain reasonable assurance about whether the consolidated financial statements are free from material misstatement.
An audit involves performing procedures to obtain audit evidence about the amounts and disclosures in the consolidated financial statements. The procedures selected depend on the auditors’ judgment, including the assessment of the risks of material misstatement of the consolidated financial statements, whether due to fraud or error. In making those risk assessments, the auditors consider internal control relevant to the Hospital’s preparation and fair presentation of the consolidated financial statements in order to design audit procedures that are appropriate in the circumstances, but not for the purpose of expressing an opinion on the effectiveness of the Hospital’s internal control. Accordingly, we express no such opinion. An audit also includes evaluating the appropriateness of accounting policies used and the reasonableness of significant accounting estimates made by management, as well as evaluating the overall presentation of the consolidated financial statements.
We believe that the audit evidence we have obtained is sufficient and appropriate to provide a basis for our audit opinion.
- 2 -
Opinion
In our opinion, the consolidated financial statements referred to above present fairly, in all material respects, the financial position of St. Jude Children’s Research Hospital Inc. and its wholly owned subsidiaries as of June 30, 2020 and 2019, and the changes in its net assets, and its cash flows for the years then ended in accordance with accounting principles generally accepted in the United States of America.
Other Reporting Required by Government Auditing Standards
In accordance with Government Auditing Standards, we have also issued our report dated October 6, 2020, on our consideration of St. Jude Children’s Research Hospital, Inc.’s internal control over financial reporting and on our tests of its compliance with certain provisions of laws, regulations, contracts, and grant agreements and other matters. The purpose of that report is to describe the scope of our testing of internal control over financial reporting and compliance and the results of that testing, and not to provide an opinion on internal control over financial reporting or on compliance. That report is an integral part of an audit performed in accordance with Government Auditing Standards in considering the Hospital’s internal control over financial reporting and compliance.
October 6, 2020
- 3 -
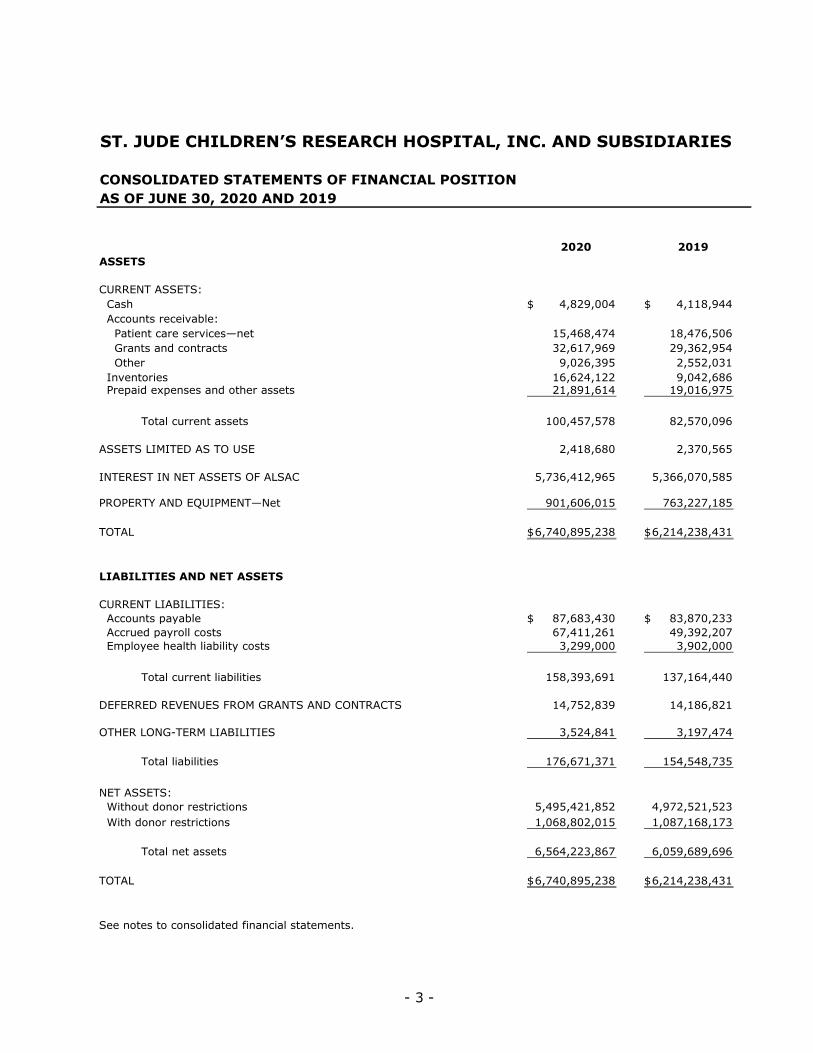
ST. JUDE CHILDREN’S RESEARCH HOSPITAL, INC. AND SUBSIDIARIES
CONSOLIDATED STATEMENTS OF FINANCIAL POSITIONAS OF JUNE 30, 2020 AND 2019
2020 2019ASSETS
CURRENT ASSETS: Cash 4,829,004$ 4,118,944$ Accounts receivable:
Patient care services—net 15,468,474 18,476,506 Grants and contracts 32,617,969 29,362,954 Other 9,026,395 2,552,031
Inventories 16,624,122 9,042,686 Prepaid expenses and other assets 21,891,614 19,016,975
Total current assets 100,457,578 82,570,096
ASSETS LIMITED AS TO USE 2,418,680 2,370,565
INTEREST IN NET ASSETS OF ALSAC 5,736,412,965 5,366,070,585
PROPERTY AND EQUIPMENT—Net 901,606,015 763,227,185
TOTAL 6,740,895,238$ 6,214,238,431$
LIABILITIES AND NET ASSETS
CURRENT LIABILITIES: Accounts payable 87,683,430$ 83,870,233$ Accrued payroll costs 67,411,261 49,392,207 Employee health liability costs 3,299,000 3,902,000
Total current liabilities 158,393,691 137,164,440
DEFERRED REVENUES FROM GRANTS AND CONTRACTS 14,752,839 14,186,821
OTHER LONG-TERM LIABILITIES 3,524,841 3,197,474
Total liabilities 176,671,371 154,548,735
NET ASSETS: Without donor restrictions 5,495,421,852 4,972,521,523 With donor restrictions 1,068,802,015 1,087,168,173
Total net assets 6,564,223,867 6,059,689,696
TOTAL 6,740,895,238$ 6,214,238,431$
See notes to consolidated financial statements.
- 4 -
ST. JUDE CHILDREN’S RESEARCH HOSPITAL, INC. AND SUBSIDIARIES
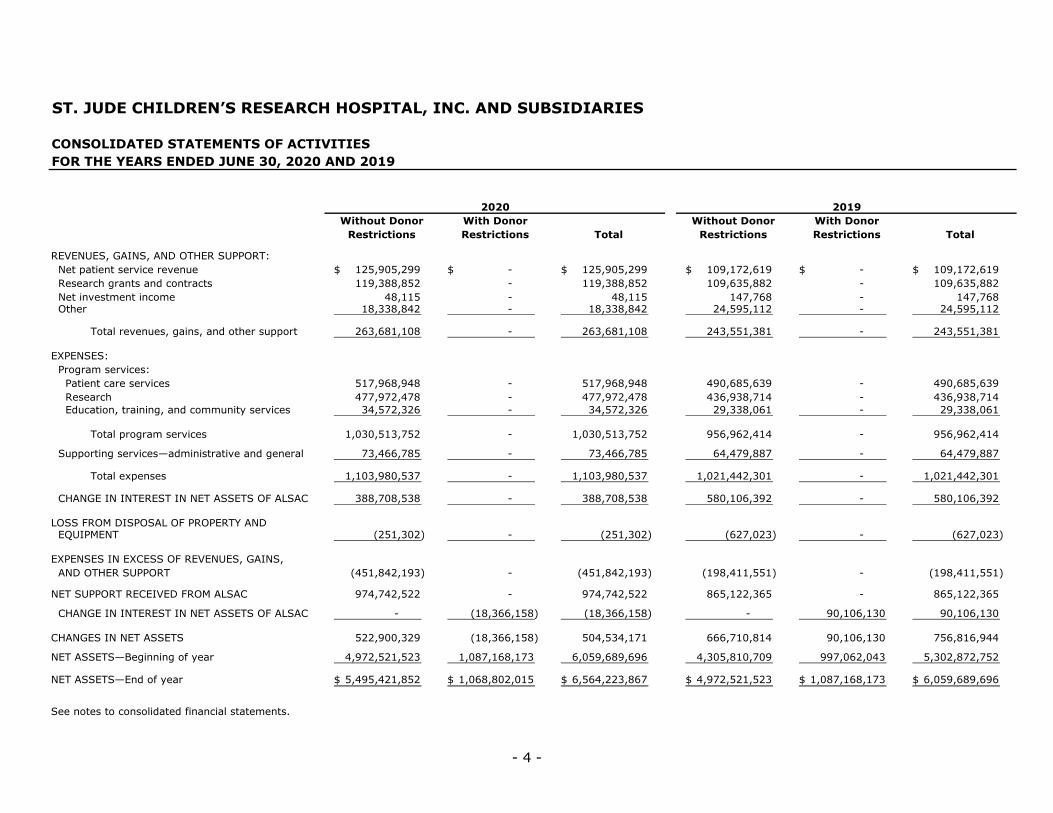
CONSOLIDATED STATEMENTS OF ACTIVITIESFOR THE YEARS ENDED JUNE 30, 2020 AND 2019
Without Donor With Donor Without Donor With DonorRestrictions Restrictions Total Restrictions Restrictions Total
REVENUES, GAINS, AND OTHER SUPPORT: Net patient service revenue 125,905,299$ -$ 125,905,299$ 109,172,619$ -$ 109,172,619$ Research grants and contracts 119,388,852 - 119,388,852 109,635,882 - 109,635,882 Net investment income 48,115 - 48,115 147,768 - 147,768 Other 18,338,842 - 18,338,842 24,595,112 - 24,595,112
Total revenues, gains, and other support 263,681,108 - 263,681,108 243,551,381 - 243,551,381
EXPENSES: Program services:
Patient care services 517,968,948 - 517,968,948 490,685,639 - 490,685,639 Research 477,972,478 - 477,972,478 436,938,714 - 436,938,714 Education, training, and community services 34,572,326 - 34,572,326 29,338,061 - 29,338,061
Total program services 1,030,513,752 - 1,030,513,752 956,962,414 - 956,962,414
Supporting services—administrative and general 73,466,785 - 73,466,785 64,479,887 - 64,479,887
Total expenses 1,103,980,537 - 1,103,980,537 1,021,442,301 - 1,021,442,301
CHANGE IN INTEREST IN NET ASSETS OF ALSAC 388,708,538 - 388,708,538 580,106,392 - 580,106,392
LOSS FROM DISPOSAL OF PROPERTY AND EQUIPMENT (251,302) - (251,302) (627,023) - (627,023)
EXPENSES IN EXCESS OF REVENUES, GAINS, AND OTHER SUPPORT (451,842,193) - (451,842,193) (198,411,551) - (198,411,551)
NET SUPPORT RECEIVED FROM ALSAC 974,742,522 - 974,742,522 865,122,365 - 865,122,365
CHANGE IN INTEREST IN NET ASSETS OF ALSAC - (18,366,158) (18,366,158) - 90,106,130 90,106,130
CHANGES IN NET ASSETS 522,900,329 (18,366,158) 504,534,171 666,710,814 90,106,130 756,816,944
NET ASSETS—Beginning of year 4,972,521,523 1,087,168,173 6,059,689,696 4,305,810,709 997,062,043 5,302,872,752
NET ASSETS—End of year 5,495,421,852$ 1,068,802,015$ 6,564,223,867$ 4,972,521,523$ 1,087,168,173$ 6,059,689,696$
See notes to consolidated financial statements.
20192020
- 5 -
ST. JUDE CHILDREN’S RESEARCH HOSPITAL, INC. AND SUBSIDIARIES
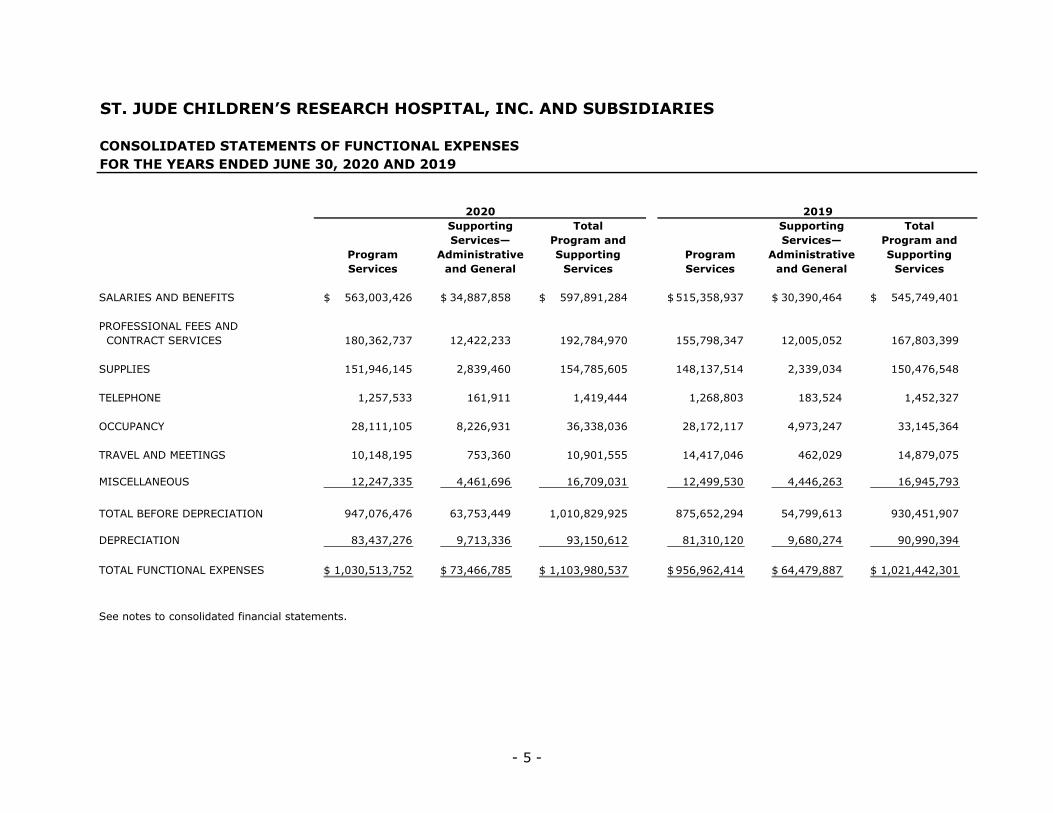
CONSOLIDATED STATEMENTS OF FUNCTIONAL EXPENSESFOR THE YEARS ENDED JUNE 30, 2020 AND 2019
Supporting Total Supporting TotalServices— Program and Services— Program and
Program Administrative Supporting Program Administrative SupportingServices and General Services Services and General Services
SALARIES AND BENEFITS 563,003,426$ 34,887,858$ 597,891,284$ 515,358,937$ 30,390,464$ 545,749,401$
PROFESSIONAL FEES AND CONTRACT SERVICES 180,362,737 12,422,233 192,784,970 155,798,347 12,005,052 167,803,399
SUPPLIES 151,946,145 2,839,460 154,785,605 148,137,514 2,339,034 150,476,548
TELEPHONE 1,257,533 161,911 1,419,444 1,268,803 183,524 1,452,327
OCCUPANCY 28,111,105 8,226,931 36,338,036 28,172,117 4,973,247 33,145,364
TRAVEL AND MEETINGS 10,148,195 753,360 10,901,555 14,417,046 462,029 14,879,075
MISCELLANEOUS 12,247,335 4,461,696 16,709,031 12,499,530 4,446,263 16,945,793
TOTAL BEFORE DEPRECIATION 947,076,476 63,753,449 1,010,829,925 875,652,294 54,799,613 930,451,907
DEPRECIATION 83,437,276 9,713,336 93,150,612 81,310,120 9,680,274 90,990,394
TOTAL FUNCTIONAL EXPENSES 1,030,513,752$ 73,466,785$ 1,103,980,537$ 956,962,414$ 64,479,887$ 1,021,442,301$
See notes to consolidated financial statements.
20192020
- 6 -
ST. JUDE CHILDREN’S RESEARCH HOSPITAL, INC. AND SUBSIDIARIES
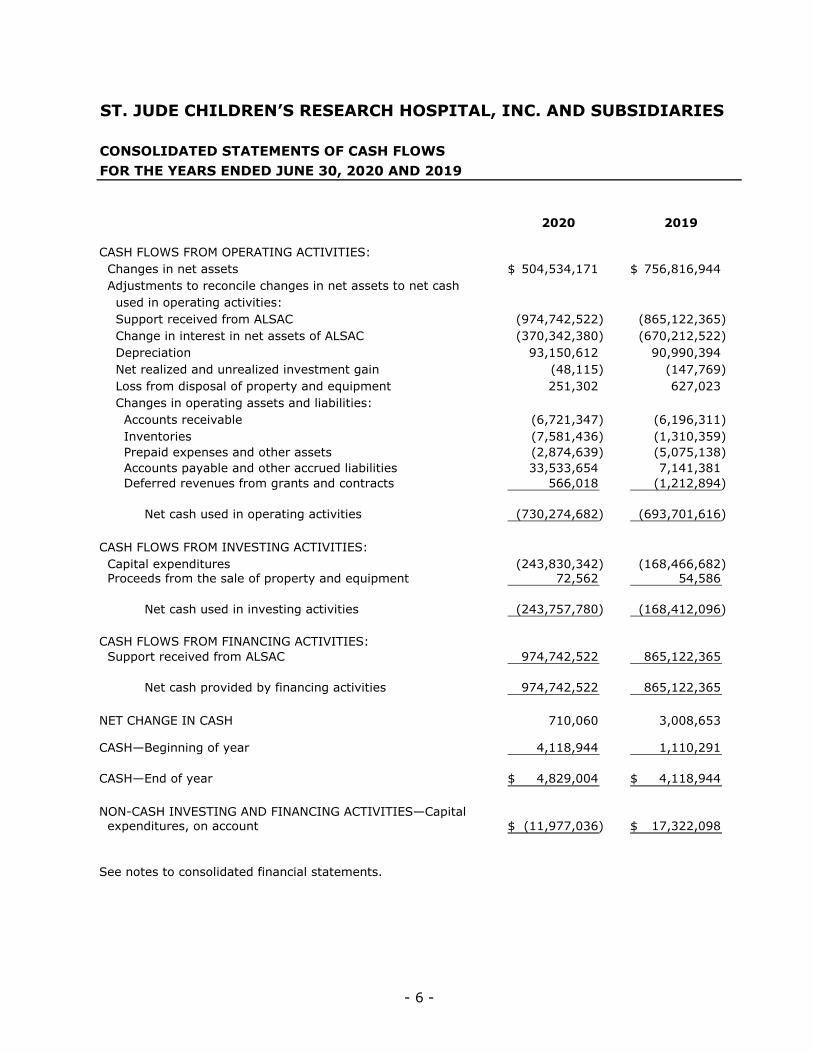
CONSOLIDATED STATEMENTS OF CASH FLOWSFOR THE YEARS ENDED JUNE 30, 2020 AND 2019
2020 2019
CASH FLOWS FROM OPERATING ACTIVITIES: Changes in net assets 504,534,171$ 756,816,944$ Adjustments to reconcile changes in net assets to net cash used in operating activities: Support received from ALSAC (974,742,522) (865,122,365) Change in interest in net assets of ALSAC (370,342,380) (670,212,522) Depreciation 93,150,612 90,990,394 Net realized and unrealized investment gain (48,115) (147,769) Loss from disposal of property and equipment 251,302 627,023 Changes in operating assets and liabilities: Accounts receivable (6,721,347) (6,196,311) Inventories (7,581,436) (1,310,359) Prepaid expenses and other assets (2,874,639) (5,075,138) Accounts payable and other accrued liabilities 33,533,654 7,141,381 Deferred revenues from grants and contracts 566,018 (1,212,894)
Net cash used in operating activities (730,274,682) (693,701,616)
CASH FLOWS FROM INVESTING ACTIVITIES: Capital expenditures (243,830,342) (168,466,682) Proceeds from the sale of property and equipment 72,562 54,586
Net cash used in investing activities (243,757,780) (168,412,096)
CASH FLOWS FROM FINANCING ACTIVITIES: Support received from ALSAC 974,742,522 865,122,365
Net cash provided by financing activities 974,742,522 865,122,365
NET CHANGE IN CASH 710,060 3,008,653
CASH—Beginning of year 4,118,944 1,110,291
CASH—End of year 4,829,004$ 4,118,944$
NON-CASH INVESTING AND FINANCING ACTIVITIES—Capital expenditures, on account (11,977,036)$ 17,322,098$
See notes to consolidated financial statements.

- 7 -
ST. JUDE CHILDREN’S RESEARCH HOSPITAL, INC. AND SUBSIDIARIES
NOTES TO CONSOLIDATED FINANCIAL STATEMENTS AS OF AND FOR THE YEARS ENDED JUNE 30, 2020 AND 2019
1. SUMMARY OF SIGNIFICANT ACCOUNTING POLICIES
St. Jude Children’s Research Hospital, Inc. and its wholly owned subsidiaries (collectively,the “Hospital”) is a research, treatment, and education center whose mission is to savechildren’s lives by finding the causes of catastrophic illnesses, improving relatedtreatments, and finding cures for their diseases. No family ever pays the Hospital for thecare their child receives. More than 7,700 patients are seen at the Hospital yearly, most ofwhom are treated on a continuing outpatient basis as part of ongoing research programsand account for approximately 71,000 hospital visits per year. The current basic scienceand clinical research at the Hospital includes work in gene therapy, chemotherapy, thebiochemistry of normal and cancerous cells, radiation treatment, blood diseases, resistanceto therapy, viruses, hereditary diseases, influenza, pediatric AIDS, and physiological effectsof catastrophic illnesses.
The accompanying consolidated financial statements do not include the individual accountsof the Hospital’s affiliate, American Lebanese Syrian Associated Charities, Inc. (“ALSAC”), anot-for-profit corporation established to build awareness and raise funds to support theoperations of the Hospital. The bylaws of ALSAC provide that all funds raised, except forfunds required for its operations and funds restricted as to other uses by donors, bedistributed to or held for the exclusive benefit of the Hospital.
Hospital operations are overseen by a board of governors (the “Board”). The researchactivities of the Hospital are reviewed annually by a scientific advisory board composed ofinternationally prominent physicians and scientists.
Basis of Presentation—The Hospital’s consolidated financial statements have beenprepared on the accrual basis of accounting in accordance with accounting principlesgenerally accepted in the United States of America (GAAP).
Principles of Consolidation—The consolidated financial statements include the accountsof St. Jude Children’s Research Hospital, Inc. and its wholly owned subsidiaries, Children’sGMP, LLC (“CGL”) and St. Jude Children’s Research Hospital Graduate School of BiomedicalSciences, LLC (“SJGS”). The purpose of CGL is to lease, manage, and operate a facility thatengages in the production of biologics and drugs to be used in research by St. JudeChildren’s Research Hospital, Inc. and by other leading biomedical research institutions.The purpose of SJGS is to train the next generation of academic researchers in amultidisciplinary environment. All intercompany transactions have been eliminated inconsolidation.
COVID-19 Impact—On March 11, 2020 the World Health Organization declared the novelstrain of coronavirus (“COVID-19”) a global pandemic and recommended containment andmitigation measures worldwide. As of June 30, 2020, the Hospital believes the currentimpacts of the COVID-19 pandemic did not warrant an impairment of its property andequipment and has not had significant impacts to the Hospital’s net assets. However, theHospital cannot reasonably estimate the length or severity of this pandemic, or the extentto which a disruption may materially impact the Hospital’s financial position, net assets orcash flows for the year ending June 30, 2021.
- 8 -
Cash—The Hospital has a cash management arrangement with ALSAC, generally providing for ALSAC’s reimbursement of Hospital funds when Hospital expenditures are presented for payment.
Inventories—Inventories, consisting primarily of medical supplies and pharmaceuticals, are stated at the lower of cost (first-in, first-out method) or net realizable value.
Assets Limited as to Use—Assets limited as to use include assets set aside by the Board for self-insurance funding, over which the Board retains control and may, at its discretion, subsequently use for other purposes.
Interest in Net Assets of ALSAC—The Hospital applies the provisions of Financial Accounting Standards Board (FASB) Accounting Standards Codification (ASC) Topic 958, Not-for-Profit Entities. Because of the Hospital’s relationship as ALSAC’s sole beneficiary and the overall financial inter-relationship of the Hospital and ALSAC, ASC Topic 958 requires that the Hospital report its interest in the net assets of ALSAC in the consolidated statements of financial position, with corresponding changes in those net assets reported in a “quasi-equity-method” fashion in the accompanying consolidated statements of activities.
For purposes of classification as net assets without donor restrictions or net assets with donor restrictions, the change in the interest in ALSAC’s net assets is reported in the accompanying consolidated statements of activities consistent with the reporting of such changes in ALSAC’s financial statements.
Property and Equipment—Equipment and computer software are recorded at cost and depreciated on a straight-line basis over estimated useful lives of 3 to 20 years, and 3 to 5 years, respectively. Leasehold interests are recorded at cost and are depreciated on a straight-line basis over the term of their lease or their estimated useful lives, whichever is shorter. The Hospital evaluates the carrying value of its property and equipment under the provisions of ASC Topic 360, Property, Plant, and Equipment. Under ASC Topic 360, when events, circumstances, and operating results indicate that the carrying value of property and equipment assets may be impaired, the Hospital prepares projections of the undiscounted future cash flows expected to result from the use of the assets and their eventual disposition. If the projections indicate that the recorded amounts are not expected to be recoverable, such amounts are reduced to estimated fair value. There was no impairment in 2020 or 2019.
Net Assets—Net assets, revenues, gains, and losses are classified based on the existence or absence of donor-imposed restrictions. Accordingly, net assets and changes therein are classified as follows:
Net Assets without Donor Restrictions—Net assets available for use in general operations and not subject to donor restrictions. The governing board has not designated from net assets without donor restrictions, other than the board-designated endowment fund and board-designated self-insurance funding, any other net assets to be restricted for specific purposes.
Net Assets with Donor Restrictions—Net assets subject to donor-imposed restrictions. Some donor-imposed restrictions are temporary in nature, such as those that will be met by the passage of time or other events specified by the donor. Other donor-imposed restrictions are perpetual in nature, where the donor stipulates that resources be maintained in perpetuity.
- 9 -
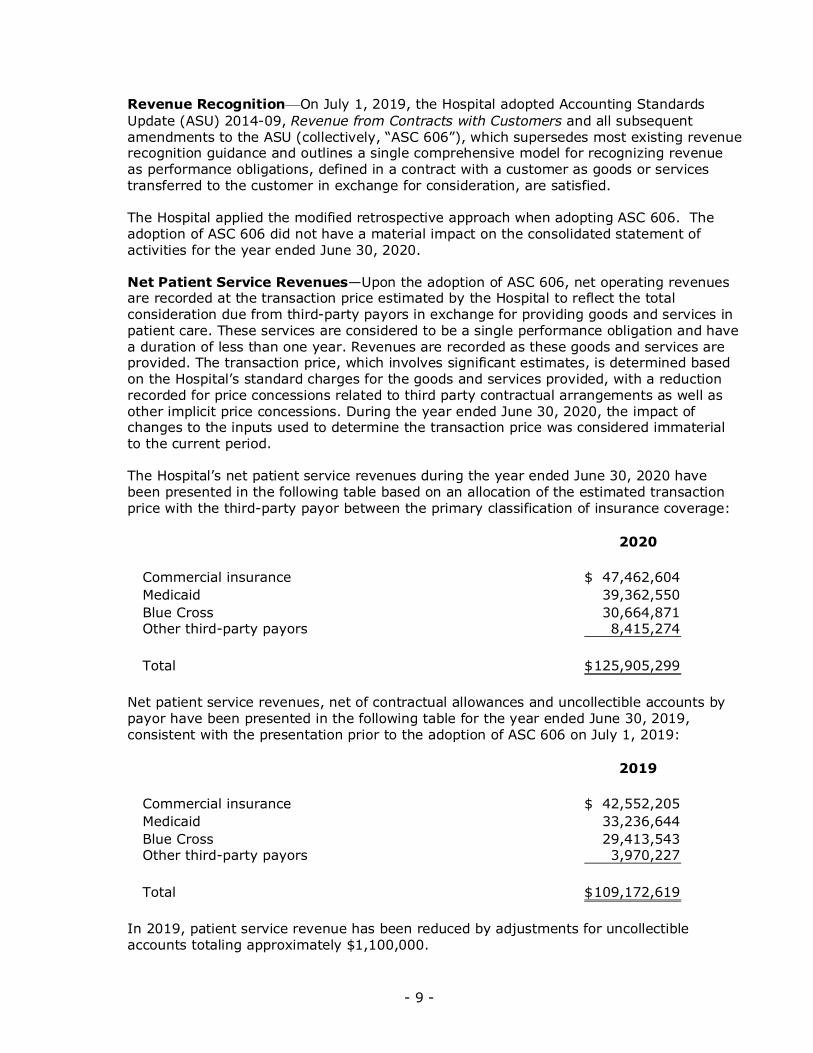
Revenue Recognition—On July 1, 2019, the Hospital adopted Accounting Standards Update (ASU) 2014-09, Revenue from Contracts with Customers and all subsequent amendments to the ASU (collectively, “ASC 606”), which supersedes most existing revenue recognition guidance and outlines a single comprehensive model for recognizing revenue as performance obligations, defined in a contract with a customer as goods or services transferred to the customer in exchange for consideration, are satisfied.
The Hospital applied the modified retrospective approach when adopting ASC 606. The adoption of ASC 606 did not have a material impact on the consolidated statement of activities for the year ended June 30, 2020.
Net Patient Service Revenues—Upon the adoption of ASC 606, net operating revenues are recorded at the transaction price estimated by the Hospital to reflect the total consideration due from third-party payors in exchange for providing goods and services in patient care. These services are considered to be a single performance obligation and have a duration of less than one year. Revenues are recorded as these goods and services are provided. The transaction price, which involves significant estimates, is determined based on the Hospital’s standard charges for the goods and services provided, with a reduction recorded for price concessions related to third party contractual arrangements as well as other implicit price concessions. During the year ended June 30, 2020, the impact of changes to the inputs used to determine the transaction price was considered immaterial to the current period.
The Hospital’s net patient service revenues during the year ended June 30, 2020 have been presented in the following table based on an allocation of the estimated transaction price with the third-party payor between the primary classification of insurance coverage:
2020
Commercial insurance 47,462,604$ Medicaid 39,362,550 Blue Cross 30,664,871 Other third-party payors 8,415,274
Total 125,905,299$
Net patient service revenues, net of contractual allowances and uncollectible accounts by payor have been presented in the following table for the year ended June 30, 2019, consistent with the presentation prior to the adoption of ASC 606 on July 1, 2019:
2019
Commercial insurance 42,552,205$ Medicaid 33,236,644 Blue Cross 29,413,543 Other third-party payors 3,970,227
Total 109,172,619$
In 2019, patient service revenue has been reduced by adjustments for uncollectible accounts totaling approximately $1,100,000.

- 10 -
The Hospital has agreements with governmental and other third-party payors that provide for reimbursement to the Hospital at amounts different from its established rates. The differences between the estimated reimbursement rates and the standard billing rates are accounted for as contractual adjustments, which are deducted from gross revenues to arrive at net patient service revenue. Final settlements under certain programs are subject to adjustment based on administrative review and audit by third parties. Adjustments to the estimated billings are recorded in the periods when such adjustments become known. Adjustments to previous reimbursement estimates are accounted for as contractual allowance adjustments and reported in the period in which final settlements are determined. In addition, the Hospital is reimbursed by non-governmental payors using a variety of payment methodologies.
A summary of the basis for reimbursement with major third-party payors follows:
Commercial—The Hospital has entered into reimbursement arrangements providing for payment methodologies, which include prospectively determined rates per discharge, per diem amounts, case rates, fee schedules, and discounts from established charges.
Medicaid—Inpatient and outpatient services rendered to Medicaid program beneficiaries are generally paid based upon prospective reimbursement methodologies established by the beneficiaries’ state of residence.
Blue Cross—All acute care services rendered to Blue Cross subscribers are reimbursed at prospectively determined rates.
Accounts receivable, patient care services—The Hospital reports accounts receivable from patient care services at net realizable value based on certain assumptions determined for each major third-party payor type. For third-party payors the net realizable value is based on the estimated contractual reimbursement percentage, which is based on current contract prices or historical paid claims data by payor. These estimates are adjusted for expected recoveries and any anticipated changes in trends. As no family ever pays for the care their child receives at the Hospital, there are no self-pay accounts receivable.
Accounts receivable, patient care services and their net realizable value can be impacted by significant changes in payor mix, business office operations, economic conditions, or trends in federal and state governmental healthcare coverage. The Hospital continually reviews the net realizable value of accounts receivable by monitoring historical cash collections as a percentage of trailing net operating revenues, as well as by analyzing current period net revenue, aged accounts receivable by third-party payor and other related factors.
Accounts receivable, patient care services has been reduced by estimated provisions for contractual adjustments and uncollectible accounts of $146,700,000 and $214,800,000 in 2020 and 2019, respectively.
Charity Care—The Hospital provides care to patients for all charges in excess of those realizable from third-party payors. Because the Hospital does not pursue the collection of amounts determined to qualify as charity care, such amounts are not reported as revenue.
As a result, charges foregone, based on established rates, totaled approximately $110,200,000 and $126,100,000 in 2020 and 2019, respectively. Management’s estimate of costs incurred to provide charity care were $96,500,000 and $96,800,000 in 2020 and 2019, respectively.
- 11 -
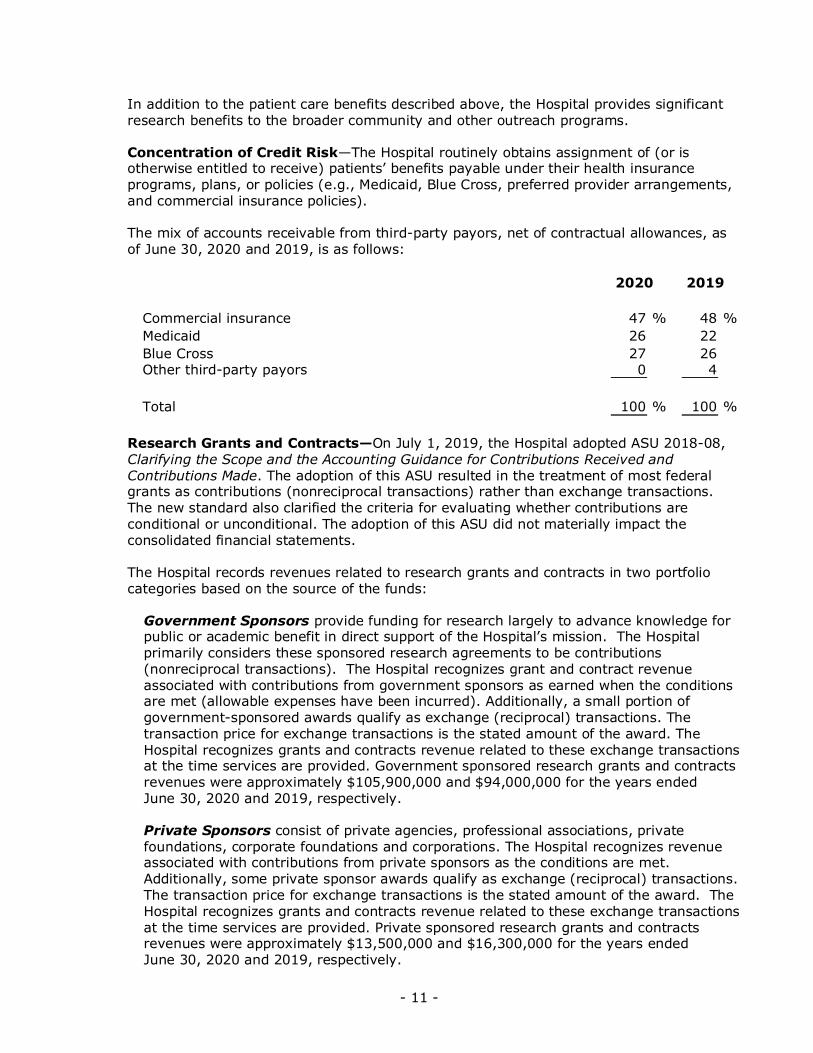
In addition to the patient care benefits described above, the Hospital provides significant research benefits to the broader community and other outreach programs.
Concentration of Credit Risk—The Hospital routinely obtains assignment of (or is otherwise entitled to receive) patients’ benefits payable under their health insurance programs, plans, or policies (e.g., Medicaid, Blue Cross, preferred provider arrangements, and commercial insurance policies).
The mix of accounts receivable from third-party payors, net of contractual allowances, as of June 30, 2020 and 2019, is as follows:
2020 2019
Commercial insurance 47 % 48 % Medicaid 26 22 Blue Cross 27 26 Other third-party payors 0 4
Total 100 % 100 %
Research Grants and Contracts—On July 1, 2019, the Hospital adopted ASU 2018-08, Clarifying the Scope and the Accounting Guidance for Contributions Received and Contributions Made. The adoption of this ASU resulted in the treatment of most federal grants as contributions (nonreciprocal transactions) rather than exchange transactions. The new standard also clarified the criteria for evaluating whether contributions are conditional or unconditional. The adoption of this ASU did not materially impact the consolidated financial statements.
The Hospital records revenues related to research grants and contracts in two portfolio categories based on the source of the funds:
Government Sponsors provide funding for research largely to advance knowledge for public or academic benefit in direct support of the Hospital’s mission. The Hospital primarily considers these sponsored research agreements to be contributions (nonreciprocal transactions). The Hospital recognizes grant and contract revenue associated with contributions from government sponsors as earned when the conditions are met (allowable expenses have been incurred). Additionally, a small portion of government-sponsored awards qualify as exchange (reciprocal) transactions. The transaction price for exchange transactions is the stated amount of the award. The Hospital recognizes grants and contracts revenue related to these exchange transactions at the time services are provided. Government sponsored research grants and contracts revenues were approximately $105,900,000 and $94,000,000 for the years ended June 30, 2020 and 2019, respectively.
Private Sponsors consist of private agencies, professional associations, private foundations, corporate foundations and corporations. The Hospital recognizes revenue associated with contributions from private sponsors as the conditions are met. Additionally, some private sponsor awards qualify as exchange (reciprocal) transactions. The transaction price for exchange transactions is the stated amount of the award. The Hospital recognizes grants and contracts revenue related to these exchange transactions at the time services are provided. Private sponsored research grants and contracts revenues were approximately $13,500,000 and $16,300,000 for the years ended June 30, 2020 and 2019, respectively.
- 12 -
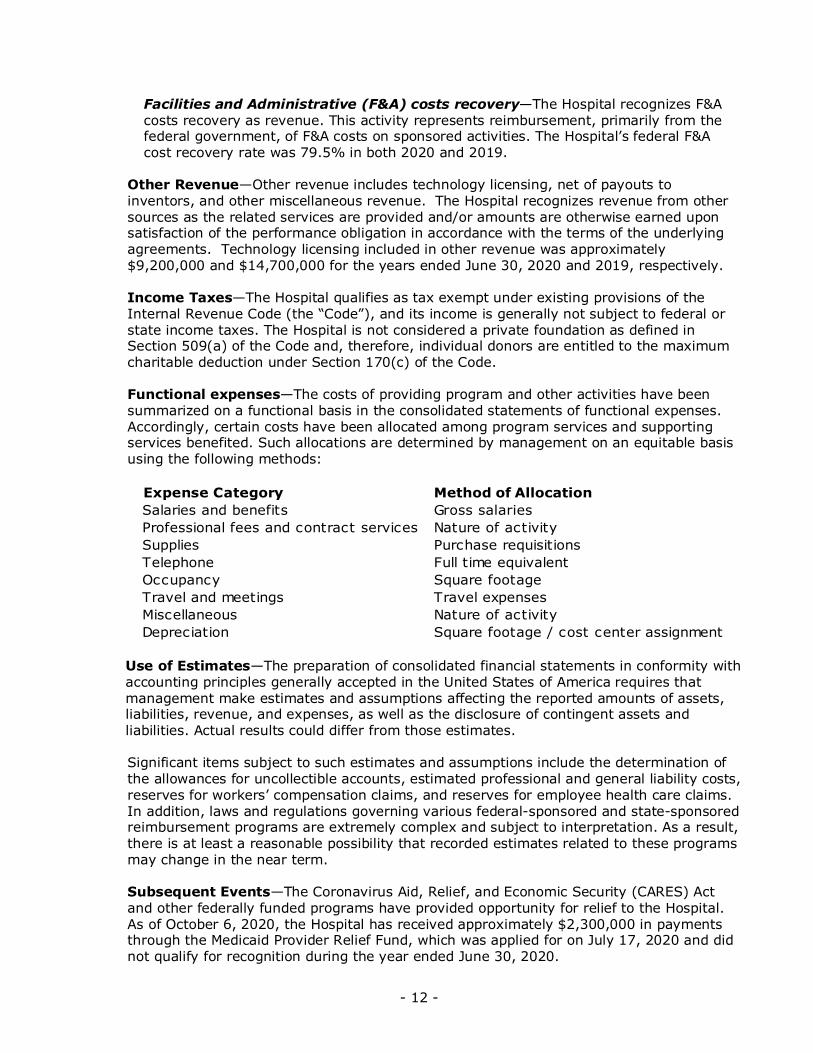
Facilities and Administrative (F&A) costs recovery—The Hospital recognizes F&A costs recovery as revenue. This activity represents reimbursement, primarily from the federal government, of F&A costs on sponsored activities. The Hospital’s federal F&A cost recovery rate was 79.5% in both 2020 and 2019.
Other Revenue—Other revenue includes technology licensing, net of payouts to inventors, and other miscellaneous revenue. The Hospital recognizes revenue from other sources as the related services are provided and/or amounts are otherwise earned upon satisfaction of the performance obligation in accordance with the terms of the underlying agreements. Technology licensing included in other revenue was approximately $9,200,000 and $14,700,000 for the years ended June 30, 2020 and 2019, respectively.
Income Taxes—The Hospital qualifies as tax exempt under existing provisions of the Internal Revenue Code (the “Code”), and its income is generally not subject to federal or state income taxes. The Hospital is not considered a private foundation as defined in Section 509(a) of the Code and, therefore, individual donors are entitled to the maximum charitable deduction under Section 170(c) of the Code.
Functional expenses—The costs of providing program and other activities have been summarized on a functional basis in the consolidated statements of functional expenses. Accordingly, certain costs have been allocated among program services and supporting services benefited. Such allocations are determined by management on an equitable basis using the following methods:
Expense CategorySalaries and benefits
Method of Allocation Gross salaries
Professional fees and contract services Nature of activitySupplies Purchase requisitionsTelephone Full time equivalentOccupancy Square footageTravel and meetings Travel expensesMiscellaneous Nature of activityDepreciation Square footage / cost center assignment
Use of Estimates—The preparation of consolidated financial statements in conformity with accounting principles generally accepted in the United States of America requires that management make estimates and assumptions affecting the reported amounts of assets, liabilities, revenue, and expenses, as well as the disclosure of contingent assets and liabilities. Actual results could differ from those estimates.
Significant items subject to such estimates and assumptions include the determination of the allowances for uncollectible accounts, estimated professional and general liability costs, reserves for workers’ compensation claims, and reserves for employee health care claims. In addition, laws and regulations governing various federal-sponsored and state-sponsored reimbursement programs are extremely complex and subject to interpretation. As a result, there is at least a reasonable possibility that recorded estimates related to these programs may change in the near term.
Subsequent Events—The Coronavirus Aid, Relief, and Economic Security (CARES) Act and other federally funded programs have provided opportunity for relief to the Hospital. As of October 6, 2020, the Hospital has received approximately $2,300,000 in payments through the Medicaid Provider Relief Fund, which was applied for on July 17, 2020 and did not qualify for recognition during the year ended June 30, 2020.
- 13 -
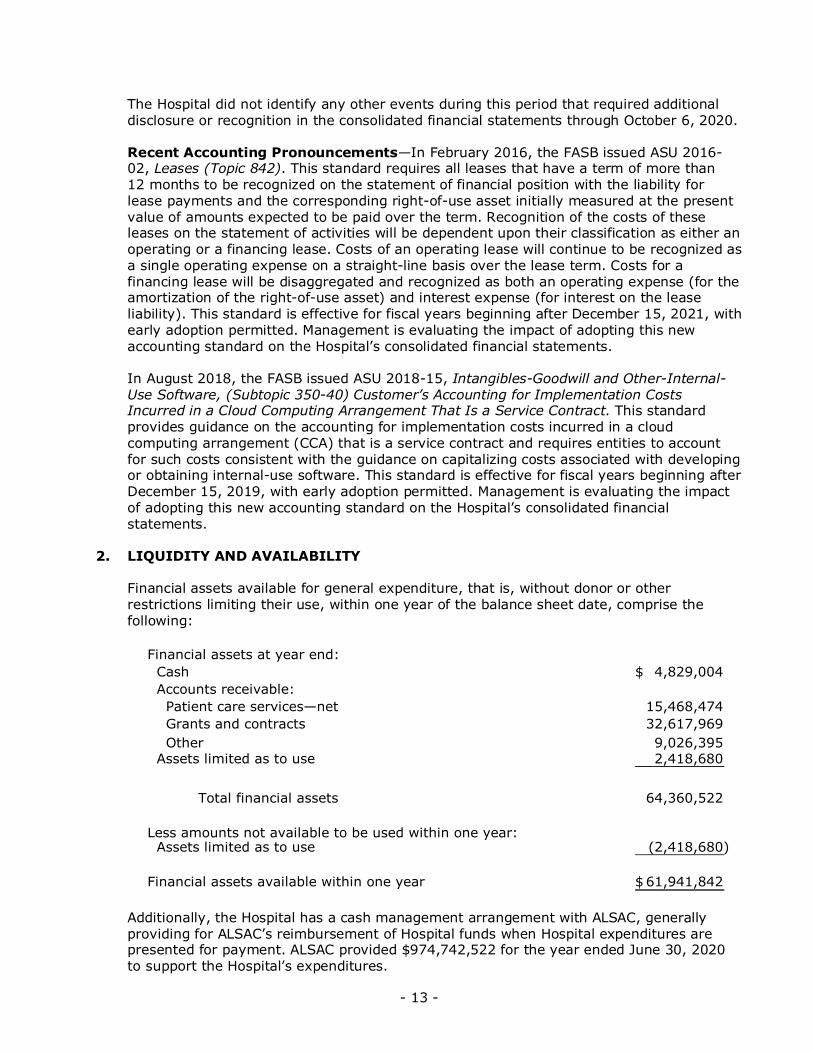
The Hospital did not identify any other events during this period that required additional disclosure or recognition in the consolidated financial statements through October 6, 2020.
Recent Accounting Pronouncements—In February 2016, the FASB issued ASU 2016-02, Leases (Topic 842). This standard requires all leases that have a term of more than 12 months to be recognized on the statement of financial position with the liability for lease payments and the corresponding right-of-use asset initially measured at the present value of amounts expected to be paid over the term. Recognition of the costs of these leases on the statement of activities will be dependent upon their classification as either an operating or a financing lease. Costs of an operating lease will continue to be recognized as a single operating expense on a straight-line basis over the lease term. Costs for a financing lease will be disaggregated and recognized as both an operating expense (for the amortization of the right-of-use asset) and interest expense (for interest on the lease liability). This standard is effective for fiscal years beginning after December 15, 2021, with early adoption permitted. Management is evaluating the impact of adopting this new accounting standard on the Hospital’s consolidated financial statements.
In August 2018, the FASB issued ASU 2018-15, Intangibles-Goodwill and Other-Internal-Use Software, (Subtopic 350-40) Customer’s Accounting for Implementation Costs Incurred in a Cloud Computing Arrangement That Is a Service Contract. This standard provides guidance on the accounting for implementation costs incurred in a cloud computing arrangement (CCA) that is a service contract and requires entities to account for such costs consistent with the guidance on capitalizing costs associated with developing or obtaining internal-use software. This standard is effective for fiscal years beginning after December 15, 2019, with early adoption permitted. Management is evaluating the impact of adopting this new accounting standard on the Hospital’s consolidated financial statements.
2. LIQUIDITY AND AVAILABILITY
Financial assets available for general expenditure, that is, without donor or otherrestrictions limiting their use, within one year of the balance sheet date, comprise thefollowing:
Financial assets at year end: Cash 4,829,004$ Accounts receivable: Patient care services—net 15,468,474 Grants and contracts 32,617,969 Other 9,026,395
Assets limited as to use 2,418,680
Total financial assets 64,360,522
Less amounts not available to be used within one year: Assets limited as to use (2,418,680)
Financial assets available within one year 61,941,842$
Additionally, the Hospital has a cash management arrangement with ALSAC, generally providing for ALSAC’s reimbursement of Hospital funds when Hospital expenditures are presented for payment. ALSAC provided $974,742,522 for the year ended June 30, 2020 to support the Hospital’s expenditures.

- 14 -
3. ASSETS LIMITED AS TO USE
Assets limited as to use under self-insurance funding arrangements represent theHospital’s ownership of a percentage of assets in a diversified pooled investment portfolio(the “Portfolio”) based on the market value after adjusting for the time-weighted holdingperiod of any contributions and withdrawals to the Portfolio. The Portfolio is administeredby a third-party custodian and maintained for the exclusive use of the Hospital. Assetslimited as to use were $2,418,680 and $2,370,565 for the years ended June 30, 2020 and2019, respectively.
The composition of net investment income for the years ended June 30, 2020 and 2019, isas follows:
2020 2019
Interest and dividend income 10,607$ 11,974$ Net realized and unrealized investment gain 37,508 135,794
Total investment income 48,115$ 147,768$
4. PROPERTY AND EQUIPMENT
A summary of property and equipment as of June 30, 2020 and 2019, is as follows:
2020 2019
Leasehold interests: Land improvements 18,393,923$ 14,042,381$ Buildings and improvements 1,067,814,231 1,042,449,718 Owned property: Equipment 379,853,843 362,761,094 Computer software 76,721,159 72,757,094 Construction in progress 360,143,280 186,390,599
1,902,926,436 1,678,400,886
Less accumulated depreciation (1,001,320,421) (915,173,701)
Total 901,606,015$ 763,227,185$
All land improvements, buildings, and building improvements are leased from ALSAC. The major terms of the lease are described in Note 11. The Hospital has reported land improvements and buildings under lease from ALSAC as a capital lease. Land improvements and buildings have been capitalized at cost, which the Hospital estimates approximated the fair value at the inception of the lease.
Construction in progress at June 30, 2020, was principally composed of $284,900,000 of costs related to the Advanced Research Center. The Advanced Research Center, with a total estimated cost of $413,000,000 will be used primarily for laboratory research and scientific collaboration and is expected to be substantially complete in calendar year 2021.
- 15 -
5. EMPLOYEE RETIREMENT BENEFIT PLAN
The Hospital sponsors a defined contribution retirement annuity plan, generally covering allemployees who have completed one year of service. The plan requires that the Hospitalmake annual contributions based on participants’ base compensation and employmentclassification. The plan allows individuals to begin making contributions to the plan as apretax deferral as soon as administratively feasible after the hire date. Hospitalcontributions are 50% vested after two years of service and 100% vested after three yearsof service. Employee contributions are 100% vested immediately. Total cash contributionsby the Hospital to the plan were approximately $27,800,000 and $26,200,000 for theyears ended June 30, 2020 and 2019, respectively.
- 16 -
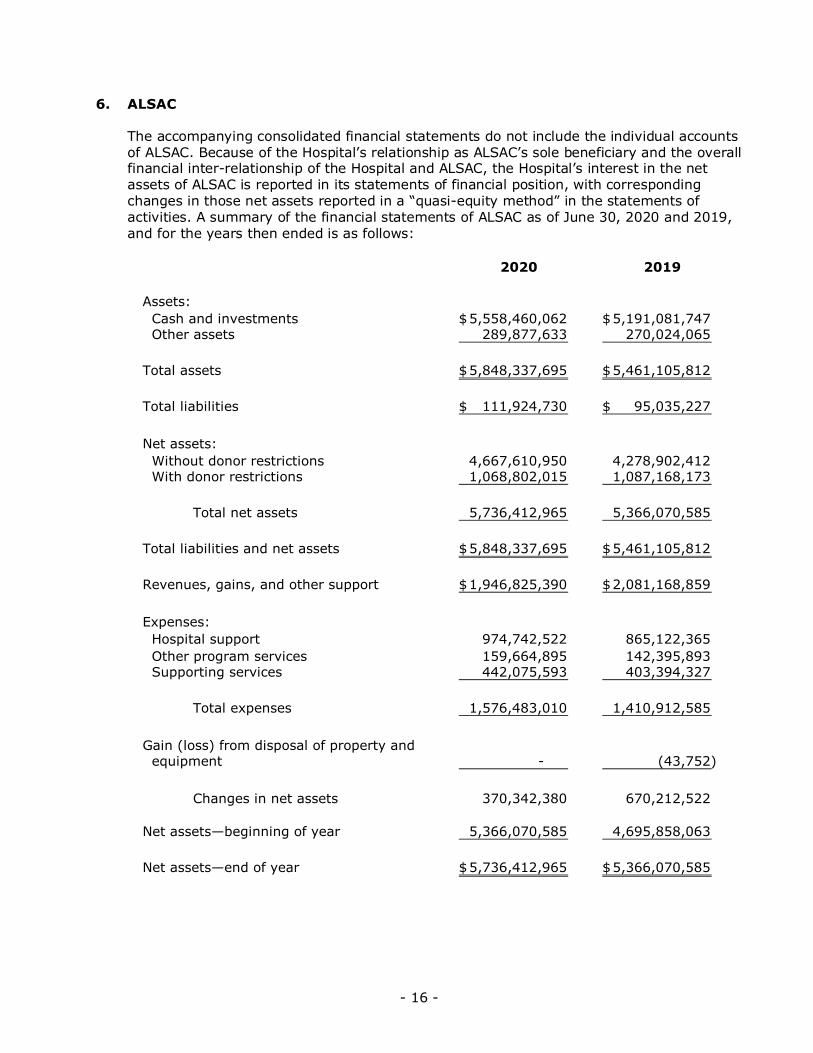
6. ALSAC
The accompanying consolidated financial statements do not include the individual accountsof ALSAC. Because of the Hospital’s relationship as ALSAC’s sole beneficiary and the overallfinancial inter-relationship of the Hospital and ALSAC, the Hospital’s interest in the netassets of ALSAC is reported in its statements of financial position, with correspondingchanges in those net assets reported in a “quasi-equity method” in the statements ofactivities. A summary of the financial statements of ALSAC as of June 30, 2020 and 2019,and for the years then ended is as follows:
2020 2019
Assets: Cash and investments 5,558,460,062$ 5,191,081,747$ Other assets 289,877,633 270,024,065
Total assets 5,848,337,695$ 5,461,105,812$
Total liabilities 111,924,730$ 95,035,227$
Net assets: Without donor restrictions 4,667,610,950 4,278,902,412 With donor restrictions 1,068,802,015 1,087,168,173
Total net assets 5,736,412,965 5,366,070,585
Total liabilities and net assets 5,848,337,695$ 5,461,105,812$
Revenues, gains, and other support 1,946,825,390$ 2,081,168,859$
Expenses: Hospital support 974,742,522 865,122,365 Other program services 159,664,895 142,395,893 Supporting services 442,075,593 403,394,327
Total expenses 1,576,483,010 1,410,912,585
Gain (loss) from disposal of property and equipment - (43,752)
Changes in net assets 370,342,380 670,212,522
Net assets—beginning of year 5,366,070,585 4,695,858,063
Net assets—end of year 5,736,412,965$ 5,366,070,585$
- 17 -
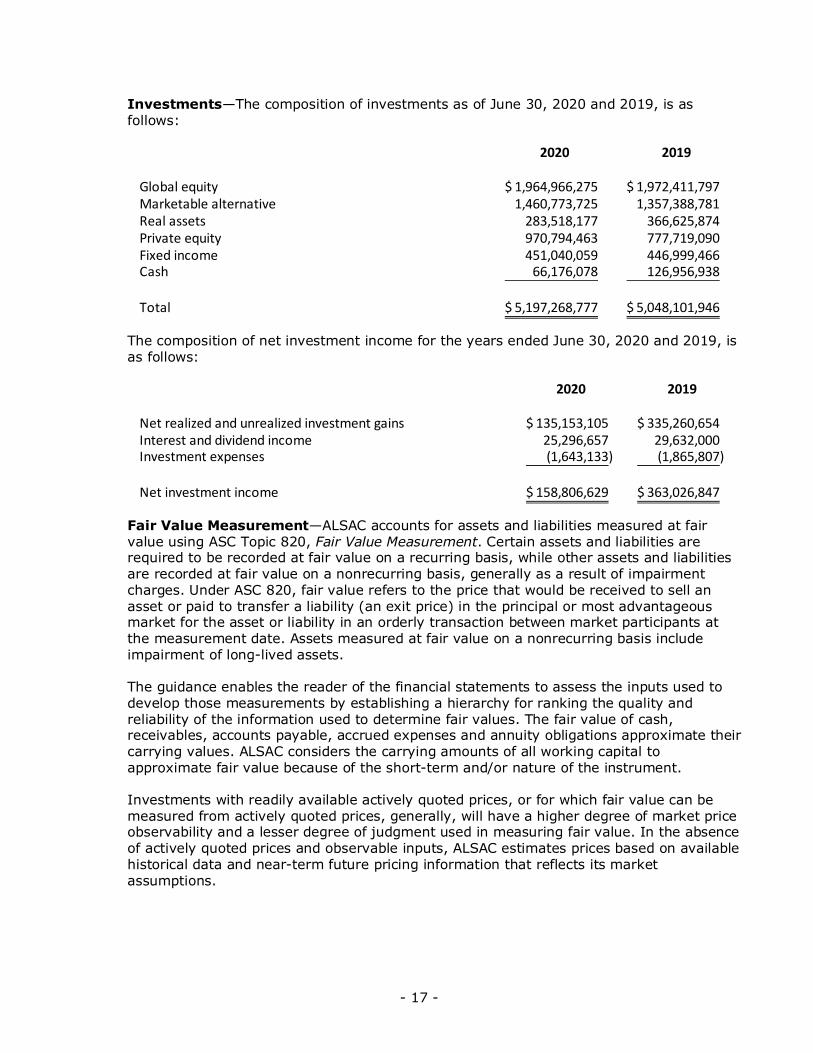
Investments—The composition of investments as of June 30, 2020 and 2019, is as follows:
2020 2019
Global equity 1,964,966,275$ 1,972,411,797$ Marketable alternative 1,460,773,725 1,357,388,781 Real assets 283,518,177 366,625,874 Private equity 970,794,463 777,719,090 Fixed income 451,040,059 446,999,466 Cash 66,176,078 126,956,938
Total 5,197,268,777$ 5,048,101,946$
The composition of net investment income for the years ended June 30, 2020 and 2019, is as follows:
2020 2019
Net realized and unrealized investment gains 135,153,105$ 335,260,654$ Interest and dividend income 25,296,657 29,632,000 Investment expenses (1,643,133) (1,865,807)
Net investment income 158,806,629$ 363,026,847$
Fair Value Measurement—ALSAC accounts for assets and liabilities measured at fair value using ASC Topic 820, Fair Value Measurement. Certain assets and liabilities are required to be recorded at fair value on a recurring basis, while other assets and liabilities are recorded at fair value on a nonrecurring basis, generally as a result of impairment charges. Under ASC 820, fair value refers to the price that would be received to sell an asset or paid to transfer a liability (an exit price) in the principal or most advantageous market for the asset or liability in an orderly transaction between market participants at the measurement date. Assets measured at fair value on a nonrecurring basis include impairment of long-lived assets.
The guidance enables the reader of the financial statements to assess the inputs used to develop those measurements by establishing a hierarchy for ranking the quality and reliability of the information used to determine fair values. The fair value of cash, receivables, accounts payable, accrued expenses and annuity obligations approximate their carrying values. ALSAC considers the carrying amounts of all working capital to approximate fair value because of the short-term and/or nature of the instrument.
Investments with readily available actively quoted prices, or for which fair value can be measured from actively quoted prices, generally, will have a higher degree of market price observability and a lesser degree of judgment used in measuring fair value. In the absence of actively quoted prices and observable inputs, ALSAC estimates prices based on available historical data and near-term future pricing information that reflects its market assumptions.
- 18 -
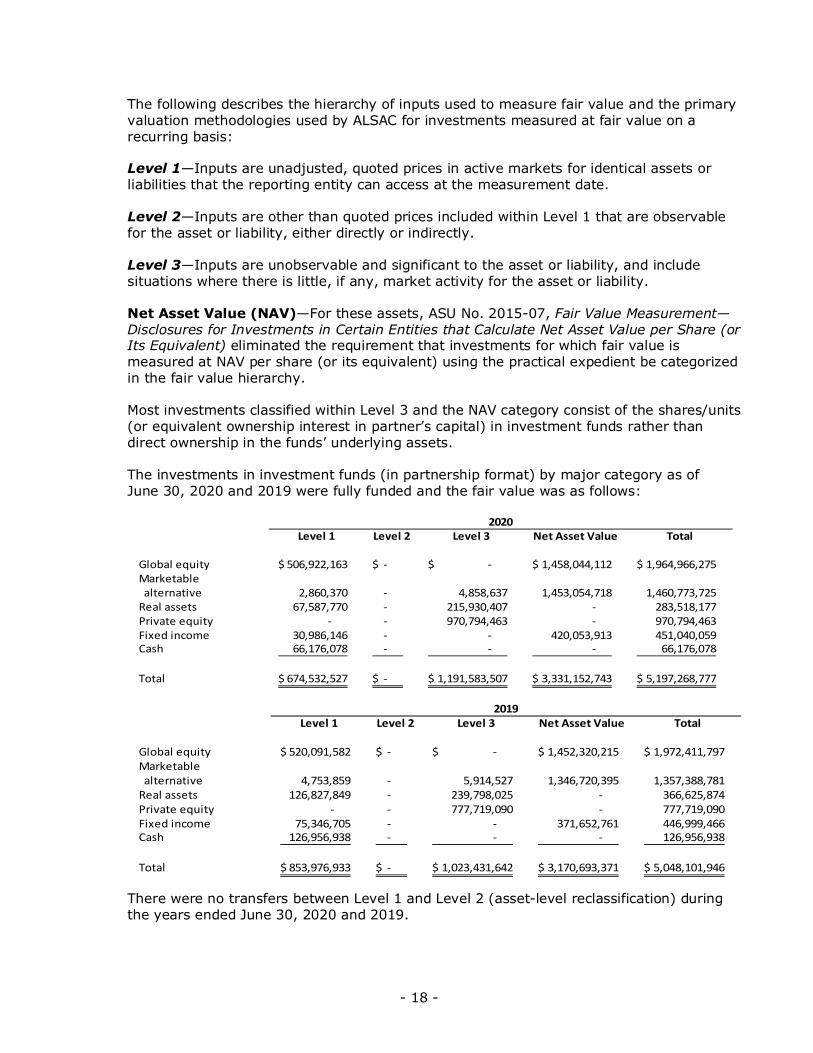
The following describes the hierarchy of inputs used to measure fair value and the primary valuation methodologies used by ALSAC for investments measured at fair value on a recurring basis:
Level 1—Inputs are unadjusted, quoted prices in active markets for identical assets or liabilities that the reporting entity can access at the measurement date.
Level 2—Inputs are other than quoted prices included within Level 1 that are observable for the asset or liability, either directly or indirectly.
Level 3—Inputs are unobservable and significant to the asset or liability, and include situations where there is little, if any, market activity for the asset or liability.
Net Asset Value (NAV)—For these assets, ASU No. 2015-07, Fair Value Measurement—Disclosures for Investments in Certain Entities that Calculate Net Asset Value per Share (or Its Equivalent) eliminated the requirement that investments for which fair value is measured at NAV per share (or its equivalent) using the practical expedient be categorized in the fair value hierarchy.
Most investments classified within Level 3 and the NAV category consist of the shares/units (or equivalent ownership interest in partner’s capital) in investment funds rather than direct ownership in the funds’ underlying assets.
The investments in investment funds (in partnership format) by major category as of June 30, 2020 and 2019 were fully funded and the fair value was as follows:
Level 1 Level 2 Level 3 Net Asset Value Total
Global equity 506,922,163$ - $ -$ 1,458,044,112$ 1,964,966,275$ Marketable alternative 2,860,370 - 4,858,637 1,453,054,718 1,460,773,725 Real assets 67,587,770 - 215,930,407 - 283,518,177 Private equity - - 970,794,463 - 970,794,463 Fixed income 30,986,146 - - 420,053,913 451,040,059 Cash 66,176,078 - - - 66,176,078
Total 674,532,527$ - $ 1,191,583,507$ 3,331,152,743$ 5,197,268,777$
2020
Level 1 Level 2 Level 3 Net Asset Value Total
Global equity 520,091,582$ - $ -$ 1,452,320,215$ 1,972,411,797$ Marketable alternative 4,753,859 - 5,914,527 1,346,720,395 1,357,388,781 Real assets 126,827,849 - 239,798,025 - 366,625,874 Private equity - - 777,719,090 - 777,719,090 Fixed income 75,346,705 - - 371,652,761 446,999,466 Cash 126,956,938 - - - 126,956,938
Total 853,976,933$ - $ 1,023,431,642$ 3,170,693,371$ 5,048,101,946$
2019
There were no transfers between Level 1 and Level 2 (asset-level reclassification) during the years ended June 30, 2020 and 2019.
- 19 -
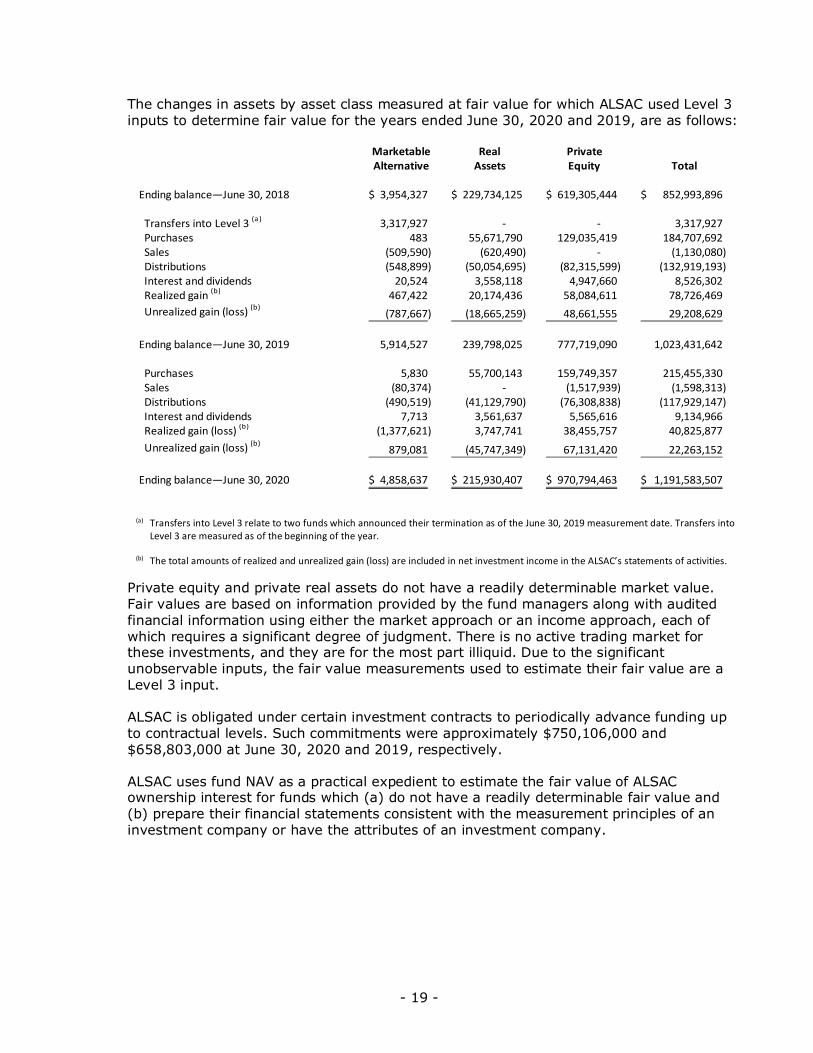
The changes in assets by asset class measured at fair value for which ALSAC used Level 3 inputs to determine fair value for the years ended June 30, 2020 and 2019, are as follows:
Marketable Real PrivateAlternative Assets Equity Total
Ending balance—June 30, 2018 3,954,327$ 229,734,125$ 619,305,444$ 852,993,896$
Transfers into Level 3 (a) 3,317,927 - - 3,317,927 Purchases 483 55,671,790 129,035,419 184,707,692 Sales (509,590) (620,490) - (1,130,080) Distributions (548,899) (50,054,695) (82,315,599) (132,919,193) Interest and dividends 20,524 3,558,118 4,947,660 8,526,302 Realized gain (b) 467,422 20,174,436 58,084,611 78,726,469 Unrealized gain (loss) (b)
(787,667) (18,665,259) 48,661,555 29,208,629
Ending balance—June 30, 2019 5,914,527 239,798,025 777,719,090 1,023,431,642
Purchases 5,830 55,700,143 159,749,357 215,455,330 Sales (80,374) - (1,517,939) (1,598,313) Distributions (490,519) (41,129,790) (76,308,838) (117,929,147) Interest and dividends 7,713 3,561,637 5,565,616 9,134,966 Realized gain (loss) (b) (1,377,621) 3,747,741 38,455,757 40,825,877 Unrealized gain (loss) (b)
879,081 (45,747,349) 67,131,420 22,263,152
Ending balance—June 30, 2020 4,858,637$ 215,930,407$ 970,794,463$ 1,191,583,507$
(a) Transfers into Level 3 relate to two funds which announced their termination as of the June 30, 2019 measurement date. Transfers intoLevel 3 are measured as of the beginning of the year.
(b) The total amounts of realized and unrealized gain (loss) are included in net investment income in the ALSAC’s statements of activities.
Private equity and private real assets do not have a readily determinable market value. Fair values are based on information provided by the fund managers along with audited financial information using either the market approach or an income approach, each of which requires a significant degree of judgment. There is no active trading market for these investments, and they are for the most part illiquid. Due to the significant unobservable inputs, the fair value measurements used to estimate their fair value are a Level 3 input.
ALSAC is obligated under certain investment contracts to periodically advance funding up to contractual levels. Such commitments were approximately $750,106,000 and $658,803,000 at June 30, 2020 and 2019, respectively.
ALSAC uses fund NAV as a practical expedient to estimate the fair value of ALSAC ownership interest for funds which (a) do not have a readily determinable fair value and (b) prepare their financial statements consistent with the measurement principles of aninvestment company or have the attributes of an investment company.

- 20 -
The investments in investment funds (in partnership format) by major category as of June 30, 2020 and 2019 were fully funded and the fair value was as follows:
Redemption Redemption2020 2019 Frequency Notice Period
Global equity (a) 1,458,044,112$ 1,452,320,215$ Daily, monthly, quarterly 0–120 daysgreater than one year
Marketable alternatives (b) 1,453,054,718 1,346,720,395 Monthly, quarterly, annually, 30–180 days
greater than one year
Fixed income (c)420,053,913 371,652,761 Daily 0-30 days
Total 3,331,152,743$ 3,170,693,371$
There is approximately $103,908,000 across 15 funds undergoing full redemption from which ALSAC receives regular distributions, as stated in the funds’ liquidity terms, or through liquidation by fund managers of underlying, illiquid securities. Liquidation of approximately $97,695,000 is expected to be completed within the next year. Illiquid balances expected to be distributed in the longer term remain from funds terminated in 2018, 2017, 2016, and prior years total approximately $1,357,000, $2,904,000, $68,000, and $1,883,000, respectively. There were no unfunded commitments related to investments valued at NAV in either 2020 or 2019. (a) Includes investments in global equity and long/short equity hedge funds. The long/short equity funds
include short positions as well as long positions and use leverage. Managers in this allocation pursuediversified strategies covering multiple capitalizations, styles and geographic focus. Some funds may besubject to lock-up provisions.
(b) Includes hedge fund strategies such as hedged equity, multi-strategy, arbitrage, global macro, distressedsecurities, and open mandate strategies. Underlying investments are primarily liquid instruments and theirderivatives in fixed income, asset backed securities, currencies, trade claims, commodities, and equities.The funds include short positions as well as long positions and use leverage.
(c) Consists of U.S. Treasury securities employing a constant duration strategy and is liquid on a daily basis.
7. NET ASSETS WITH DONOR RESTRICTIONS
Net assets with donor restrictions as of June 30, 2020 and 2019, are restricted for thefollowing purposes:
2020 2019
Endowments: Subject to spending policy and appropriation Future needs of the hospital 670,804,877$ 699,585,399$ Endowed chairs 228,129,087 217,609,474 Treatment and research 35,007,838 34,482,713
Total endowments 933,941,802 951,677,586
Subject to the passage of time 90,751,425 85,476,067 Net assets restricted to purpose 44,108,788 50,014,520
Total net assets with donor restrictions 1,068,802,015$ 1,087,168,173$

- 21 -
Net assets were released from donor restrictions by incurring expenses satisfying the restricted purpose or by occurrence of the passage of time or other events specified by the donors as follows for the years ended June 30, 2020 and 2019:
2020 2019
Spending from donor-restricted endowment funds under an endowment spending policy 54,590,410$ 31,784,955$ Expiration of split interest agreements 8,948,370 5,152,635 Restricted purpose spending Financial assistance - 3,500
Total 63,538,780$ 36,941,090$
8. NET ASSETS WITHOUT DONOR RESTRICTIONS
The composition of net assets without donor restrictions as of June 30, 2020 and 2019 isas follows:
2020 2019
Cash and cash equivalents 320,938,776$ 96,730,532$ Receivables 106,769,948 86,960,687 Investments 4,075,060,413 3,908,880,476 Inventories 16,624,122 9,042,686 Board-designated endowments 99,741,188 103,673,358 Board-designated self-insurance funding 2,418,680 2,370,565 Property and equipment—net 1,130,866,421 983,734,854 Deferred expenses and other assets 31,598,405 30,712,327
Total assets without donorrestrictions 5,784,017,953 5,222,105,485
Less liabilities (288,596,101) (249,583,962)
Net assets without donor restrictions 5,495,421,852$ 4,972,521,523$
9. FINANCIAL INSTRUMENTS
The carrying amounts of all applicable asset and liability financial instruments reported inthe consolidated statements of financial position approximate their estimated fair valuesdue to their short-term nature, in all significant respects, as of June 30, 2020 and 2019.
10. SELF-INSURANCE PROGRAMS
The Hospital is self-insured for the following:
• Comprehensive general and professional liability coverage up to $2 million per claimand $6 million in the aggregate, with $100 million of excess claims-made coverageabove the self-insured retentions. The reserve for the estimated ultimate costs of bothreported claims and claims incurred, but not reported was approximately $1,600,000
- 22 -
and $1,800,000 as of June 30, 2020 and 2019, respectively. The reserve is included in the consolidated statements of financial position as other long-term liabilities.
• Workers’ compensation liabilities up to a specific retention of $500,000, with excesscoverage at statutory limits. The reserve for the estimated ultimate costs of bothreported claims and claims incurred, but not reported was approximately $1,400,000and $1,200,000 as of June 30, 2020 and 2019, respectively. The reserve is included inthe consolidated statements of financial position as other long-term liabilities.
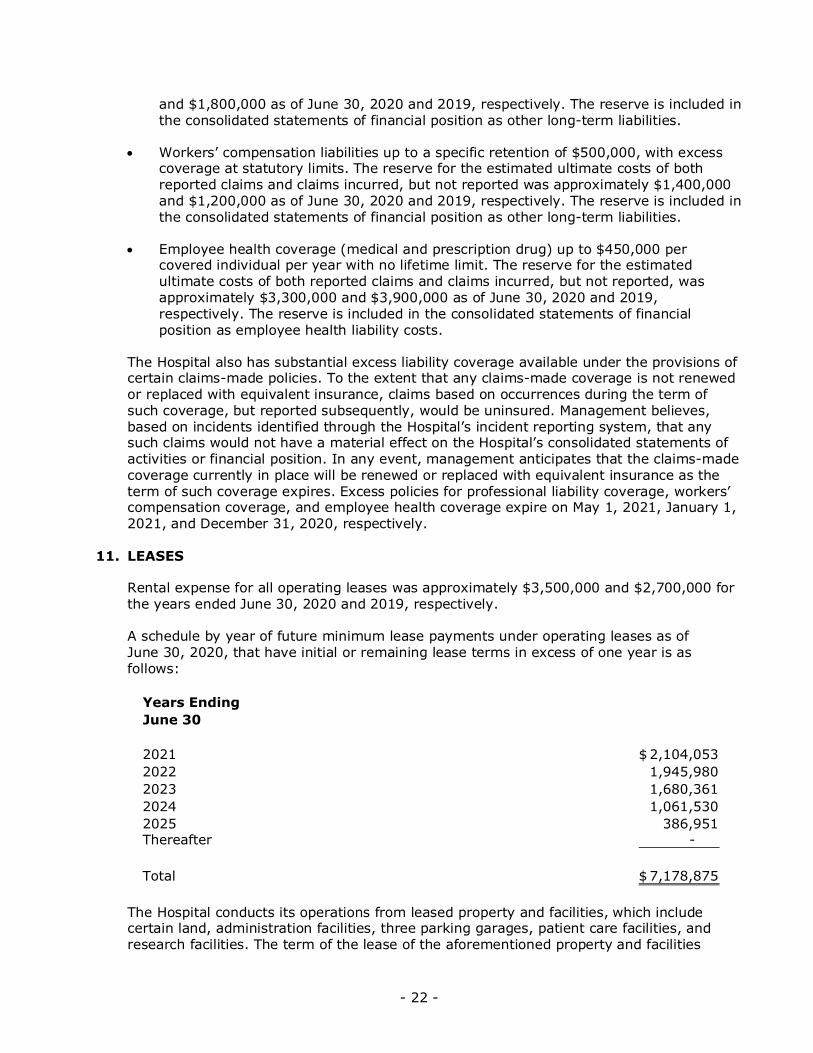
• Employee health coverage (medical and prescription drug) up to $450,000 percovered individual per year with no lifetime limit. The reserve for the estimatedultimate costs of both reported claims and claims incurred, but not reported, wasapproximately $3,300,000 and $3,900,000 as of June 30, 2020 and 2019,respectively. The reserve is included in the consolidated statements of financialposition as employee health liability costs.
The Hospital also has substantial excess liability coverage available under the provisions of certain claims-made policies. To the extent that any claims-made coverage is not renewed or replaced with equivalent insurance, claims based on occurrences during the term of such coverage, but reported subsequently, would be uninsured. Management believes, based on incidents identified through the Hospital’s incident reporting system, that any such claims would not have a material effect on the Hospital’s consolidated statements of activities or financial position. In any event, management anticipates that the claims-made coverage currently in place will be renewed or replaced with equivalent insurance as the term of such coverage expires. Excess policies for professional liability coverage, workers’ compensation coverage, and employee health coverage expire on May 1, 2021, January 1, 2021, and December 31, 2020, respectively.
11. LEASES
Rental expense for all operating leases was approximately $3,500,000 and $2,700,000 forthe years ended June 30, 2020 and 2019, respectively.
A schedule by year of future minimum lease payments under operating leases as ofJune 30, 2020, that have initial or remaining lease terms in excess of one year is asfollows:
Years EndingJune 30
2021 2,104,053$ 2022 1,945,980 2023 1,680,361 2024 1,061,530 2025 386,951 Thereafter -
Total 7,178,875$
The Hospital conducts its operations from leased property and facilities, which include certain land, administration facilities, three parking garages, patient care facilities, and research facilities. The term of the lease of the aforementioned property and facilities
- 23 -
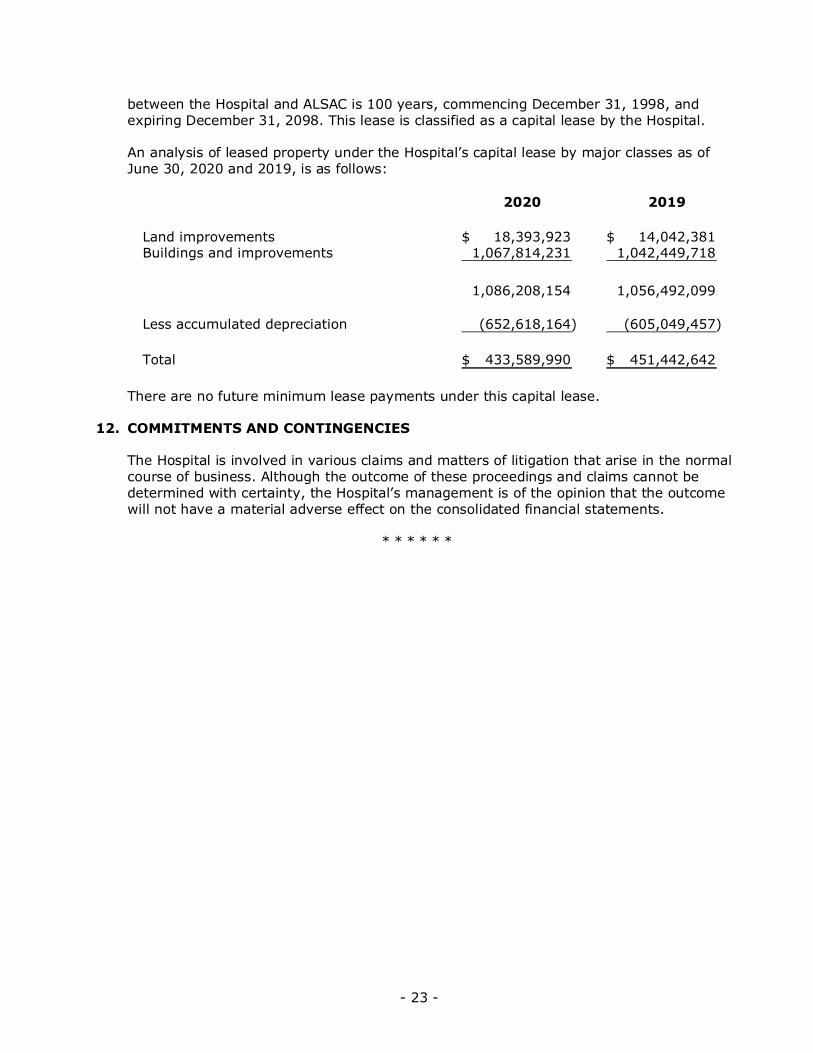
between the Hospital and ALSAC is 100 years, commencing December 31, 1998, and expiring December 31, 2098. This lease is classified as a capital lease by the Hospital.
An analysis of leased property under the Hospital’s capital lease by major classes as of June 30, 2020 and 2019, is as follows:
2020 2019
Land improvements 18,393,923$ 14,042,381$ Buildings and improvements 1,067,814,231 1,042,449,718
1,086,208,154 1,056,492,099
Less accumulated depreciation (652,618,164) (605,049,457)
Total 433,589,990$ 451,442,642$
There are no future minimum lease payments under this capital lease.
12. COMMITMENTS AND CONTINGENCIES
The Hospital is involved in various claims and matters of litigation that arise in the normalcourse of business. Although the outcome of these proceedings and claims cannot bedetermined with certainty, the Hospital’s management is of the opinion that the outcomewill not have a material adverse effect on the consolidated financial statements.
* * * * * *
- 24 -
SUPPLEMENTAL INFORMATION

- 25 -
ST. JUDE CHILDREN’S RESEARCH HOSPITAL, INC. AND SUBSIDIARIES
SCHEDULE OF EXPENDITURES OF FEDERAL AWARDSFOR THE YEAR ENDED JUNE 30, 2020
Program Type CFDA Federal Payments ToFederal Agency Grantor Pass-Through Grantor Pass-Through Grantor ID Number CFDA Program Title Expenditures Subrecipients
RESEARCH AND DEVELOPMENT CLUSTER: Department of Health and Human Services Direct Awards:
93.172 Total Human Genome Research 1,143,535$ 457,531$ 93.173 Total Research Related to Deafness and Communication Disorders 561,919 - 93.242 Total Mental Health Research Grants 1,024,343 - 93.310 Total Trans-NIH Research Support 851,567 36,977 93.353 Total 21st Century Cures Act - Beau Biden Cancer Moonshot 415,757 - 93.393 Total Cancer Cause and Prevention Research 9,302,195 825,158 93.394 Total Cancer Detection and Diagnosis Research 1,158,134 267,353 93.395 Total Cancer Treatment Research 10,118,886 2,675,610 93.396 Total Cancer Biology Research 3,021,309 238,399 93.397 Total Cancer Centers Support Grants 6,341,313 (38,087) 93.398 Total Cancer Research Manpower 818,328 - 93.829 Total Section 223 Demonstration Programs to Improve Community Mental Health Services 125,981 - 93.837 Total Cardiovascular Diseases Research 386,513 58,830 93.839 Total Blood Diseases and Resources Research 4,873,744 1,077,571 93.846 Total Arthritis, Musculoskeletal and Skin Diseases Research 755,830 - 93.847 Total Diabetes, Digestive, and Kidney Diseases Extramural Research 825,755 - 93.853 Total Extramural Research Programs In The Neurosciences and Neurological Disorders 2,842,949 - 93.855 Total Allergy and Infectious Diseases Research 15,468,929 5,827,302 93.859 Total Biomedical Research and Research Training 8,643,003 731,273 93.865 Total Child Health and Human Development Extramural Research 64,780 - 93.866 Total Aging Research 1,190,627 193,728 93.867 Total Vision Research 3,366 - 93.RD Total Federal Contract 21,184,167 10,969,859
Total Direct Awards 91,122,930 23,321,504
Pass-Through Awards from: University of North Carolina 5NU27DD001155-05-00 93.080 Blood Disorder Program: Prevention, Surveillance, and Research 2,979 - University of North Carolina 6NU27DD001155-04-02 93.080 Blood Disorder Program: Prevention, Surveillance, and Research 1,571 - University of Tennessee Health Science Center 1NU58DD000010-01-00 93.080 Blood Disorder Program: Prevention, Surveillance, and Research 7,476 -
93.080 Total 12,026 -
University of Alabama at Birmingham 1R01FD006368-01A1 93.103 Food and Drug Administration Research 25,486 -
93.103 Total 25,486 -
Tennessee Department of Health NU65PS923707 93.118 Acquired Immunodeficiency Syndrome (Aids) Activity 69,999 -
93.118 Total 69,999 -
(Continued)
- 26 -
ST. JUDE CHILDREN’S RESEARCH HOSPITAL, INC. AND SUBSIDIARIES
SCHEDULE OF EXPENDITURES OF FEDERAL AWARDSFOR THE YEAR ENDED JUNE 30, 2020
Program Type CFDA Federal Payments ToFederal Agency Grantor Pass-Through Grantor Pass-Through Grantor ID Number CFDA Program Title Expenditures Subrecipients
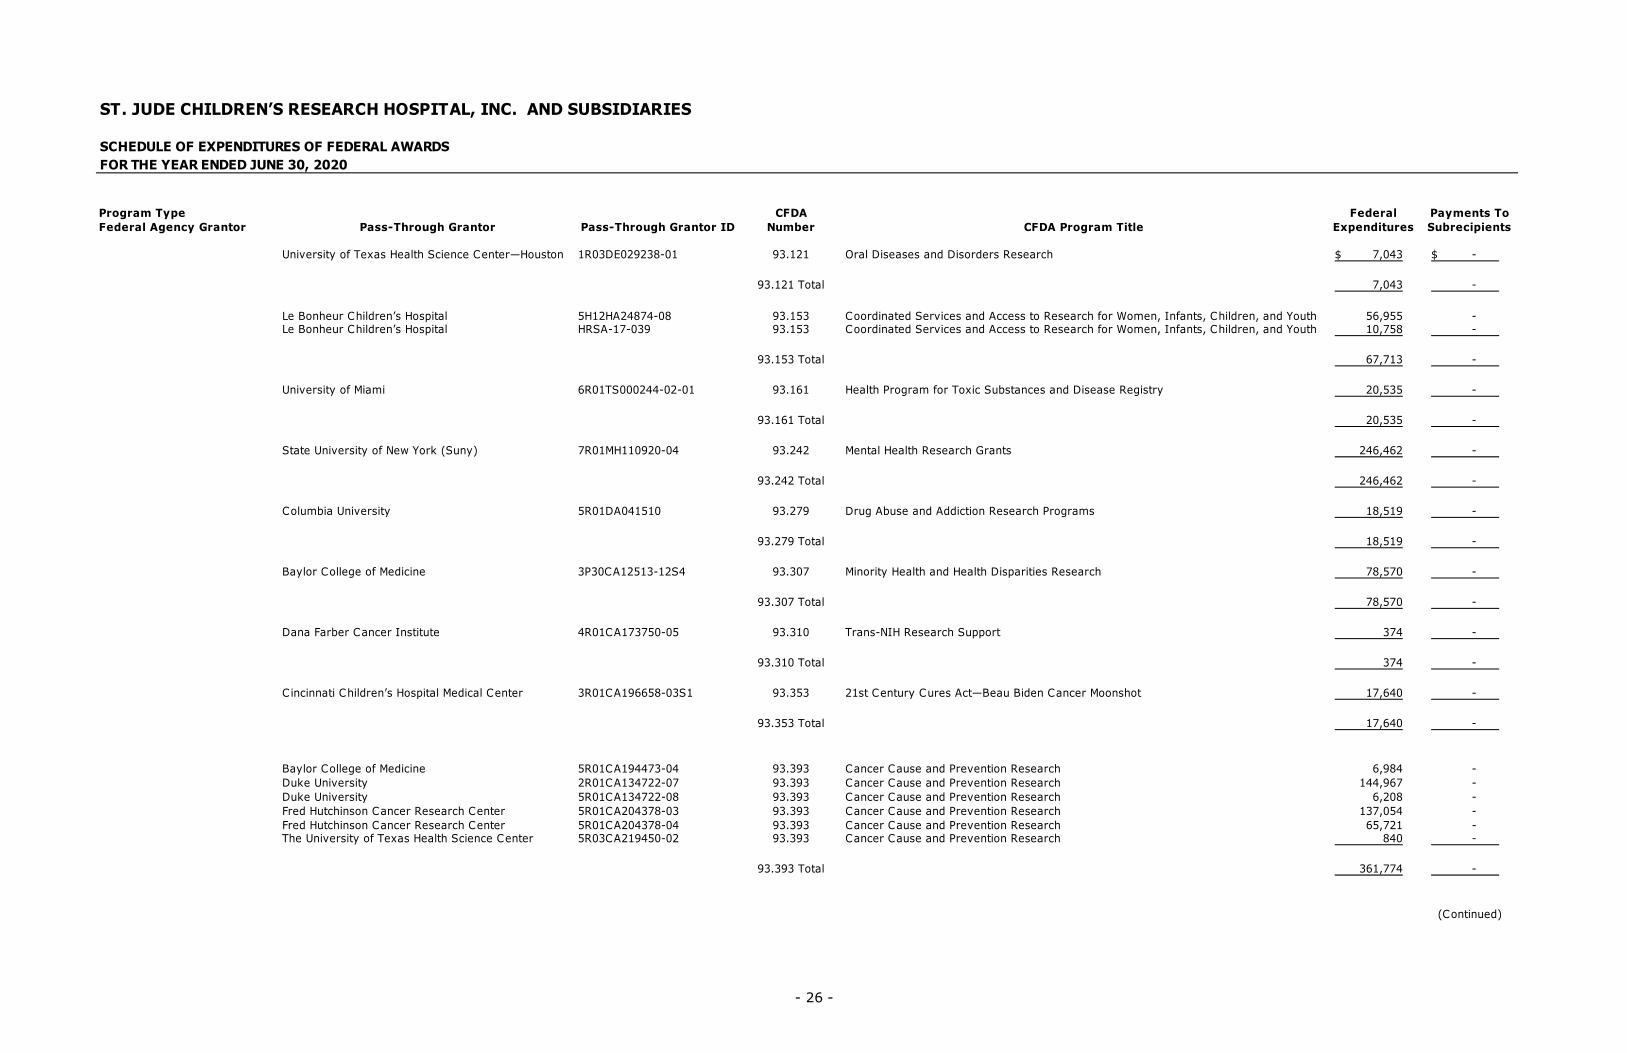
University of Texas Health Science Center—Houston 1R03DE029238-01 93.121 Oral Diseases and Disorders Research 7,043$ - $
93.121 Total 7,043 -
Le Bonheur Children’s Hospital 5H12HA24874-08 93.153 Coordinated Services and Access to Research for Women, Infants, Children, and Youth 56,955 - Le Bonheur Children’s Hospital HRSA-17-039 93.153 Coordinated Services and Access to Research for Women, Infants, Children, and Youth 10,758 -
93.153 Total 67,713 -
University of Miami 6R01TS000244-02-01 93.161 Health Program for Toxic Substances and Disease Registry 20,535 -
93.161 Total 20,535 -
State University of New York (Suny) 7R01MH110920-04 93.242 Mental Health Research Grants 246,462 -
93.242 Total 246,462 -
Columbia University 5R01DA041510 93.279 Drug Abuse and Addiction Research Programs 18,519 -
93.279 Total 18,519 -
Baylor College of Medicine 3P30CA12513-12S4 93.307 Minority Health and Health Disparities Research 78,570 -
93.307 Total 78,570 -
Dana Farber Cancer Institute 4R01CA173750-05 93.310 Trans-NIH Research Support 374 -
93.310 Total 374 -
C incinnati Children’s Hospital Medical Center 3R01CA196658-03S1 93.353 21st Century Cures Act—Beau Biden Cancer Moonshot 17,640 -
93.353 Total 17,640 -
Baylor College of Medicine 5R01CA194473-04 93.393 Cancer Cause and Prevention Research 6,984 - Duke University 2R01CA134722-07 93.393 Cancer Cause and Prevention Research 144,967 - Duke University 5R01CA134722-08 93.393 Cancer Cause and Prevention Research 6,208 - Fred Hutchinson Cancer Research Center 5R01CA204378-03 93.393 Cancer Cause and Prevention Research 137,054 - Fred Hutchinson Cancer Research Center 5R01CA204378-04 93.393 Cancer Cause and Prevention Research 65,721 - The University of Texas Health Science Center 5R03CA219450-02 93.393 Cancer Cause and Prevention Research 840 -
93.393 Total 361,774 -
(Continued)

- 27 -
ST. JUDE CHILDREN’S RESEARCH HOSPITAL, INC. AND SUBSIDIARIES
SCHEDULE OF EXPENDITURES OF FEDERAL AWARDSFOR THE YEAR ENDED JUNE 30, 2020
Program Type CFDA Federal Payments ToFederal Agency Grantor Pass-Through Grantor Pass-Through Grantor ID Number CFDA Program Title Expenditures Subrecipients
Children's Hospital of Philadelphia 5R01CA193478-02 93.394 Cancer Detection and Diagnosis Research 1,342$ - $ Children's Hospital of Philadelphia 5R01CA193776-05 93.394 Cancer Detection and Diagnosis Research 8,463 - Memorial Sloan Kettering Cancer Center 5R01CA187397-05 93.394 Cancer Detection and Diagnosis Research 1,426 - University of Florida 5R01CA132946-11 93.394 Cancer Detection and Diagnosis Research (284) (284)
93.394 Total 10,947 (284)
Beckman Research Institute 5R01CA196854-04 93.395 Cancer Treatment Research (23) - Beckman Research Institute 5R01CA196854-05 93.395 Cancer Treatment Research 17,751 - Boston Children's Hospital 1R01CA227576-01 93.395 Cancer Treatment Research 3,244 - Boston Children's Hospital 5R01CA227576-02 93.395 Cancer Treatment Research 17,031 - Children's Hospital of Philadelphia 1R01CA196854-01 93.395 Cancer Treatment Research (51,614) - Children's Hospital of Philadelphia 1U10CA180886-01 93.395 Cancer Treatment Research (115) - Children's Hospital of Philadelphia 1UG1CA189955-01 93.395 Cancer Treatment Research 5,980 - Children's Hospital of Philadelphia 1UM1CA228823-01 93.395 Cancer Treatment Research 98,418 - Children's Hospital of Philadelphia 2U10CA180886-06 93.395 Cancer Treatment Research 426,883 - Children's Hospital of Philadelphia 5R01CA196854-04 93.395 Cancer Treatment Research 1,891 - Children's Hospital of Philadelphia 5U10CA180886-05 93.395 Cancer Treatment Research 3,448 - Children's Hospital of Philadelphia 5U10CA180886-06 93.395 Cancer Treatment Research 1,956 - Children's Hospital of Philadelphia 1U10CA180886-01 93.395 Cancer Treatment Research (403,298) - Fred Hutchinson Cancer Res Center 2R01CA114567-11 93.395 Cancer Treatment Research 144,427 - Fred Hutchinson Cancer Res Center 5R01CA114567-12 93.395 Cancer Treatment Research 26,360 - Memorial Sloan Kettering Cancer Center 1UG1CA233332-01 93.395 Cancer Treatment Research 131,304 - Ohio State University 5R01CA138744-09 93.395 Cancer Treatment Research 9,595 - Public Health Institute 2U10CA180899-06 93.395 Cancer Treatment Research 544,092 - St. Jude Children's Research Hospital 5UM1CA081457-20 93.395 Cancer Treatment Research 68,291 - St. Jude Children's Research Hospital 3UM1CA081457-20S1 93.395 Cancer Treatment Research 76,590 - University of California—Irvine 1R01CA222012-01 93.395 Cancer Treatment Research (287) - University of California—Irvine 5R01CA222012-02 93.395 Cancer Treatment Research 129,059 - University of Kentucky 1R01CA247365-01A1 93.395 Cancer Treatment Research 132,734 - University of Tennessee Health Science Center 5R01CA148706-09 93.395 Cancer Treatment Research 32,890 - University of Tennessee Health Science Center 5R01CA148706-10 93.395 Cancer Treatment Research 14,415 -
93.395 Total 1,431,022 -
University of Alabama at Birmingham 2P50CA107399-11A1 93.397 Cancer Centers Support Grants 3,588 - University of Alabama at Birmingham 5P50CA107399-12 93.397 Cancer Centers Support Grants 17,601 -
93.397 Total 21,189 -
University of Minnesota 1K08CA234232-01 93.398 Cancer Research Manpower 6,317 -
93.398 Total 6,317 -
Children's Hospital of Philadelphia 2UG1CA189955-06 93.399 Cancer Control 1,330 -
93.399 Total 1,330 -
University of Buffalo 5R01HL137558-04 93.837 Cardiovascular Diseases Research 854 - University of Buffalo 7R01HL137558-03 93.837 Cardiovascular Diseases Research 14,315 -
93.837 Total 15,169 -
(Continued)
- 28 -
ST. JUDE CHILDREN’S RESEARCH HOSPITAL, INC. AND SUBSIDIARIES
SCHEDULE OF EXPENDITURES OF FEDERAL AWARDSFOR THE YEAR ENDED JUNE 30, 2020
Program Type CFDA Federal Payments ToFederal Agency Grantor Pass-Through Grantor Pass-Through Grantor ID Number CFDA Program Title Expenditures Subrecipients
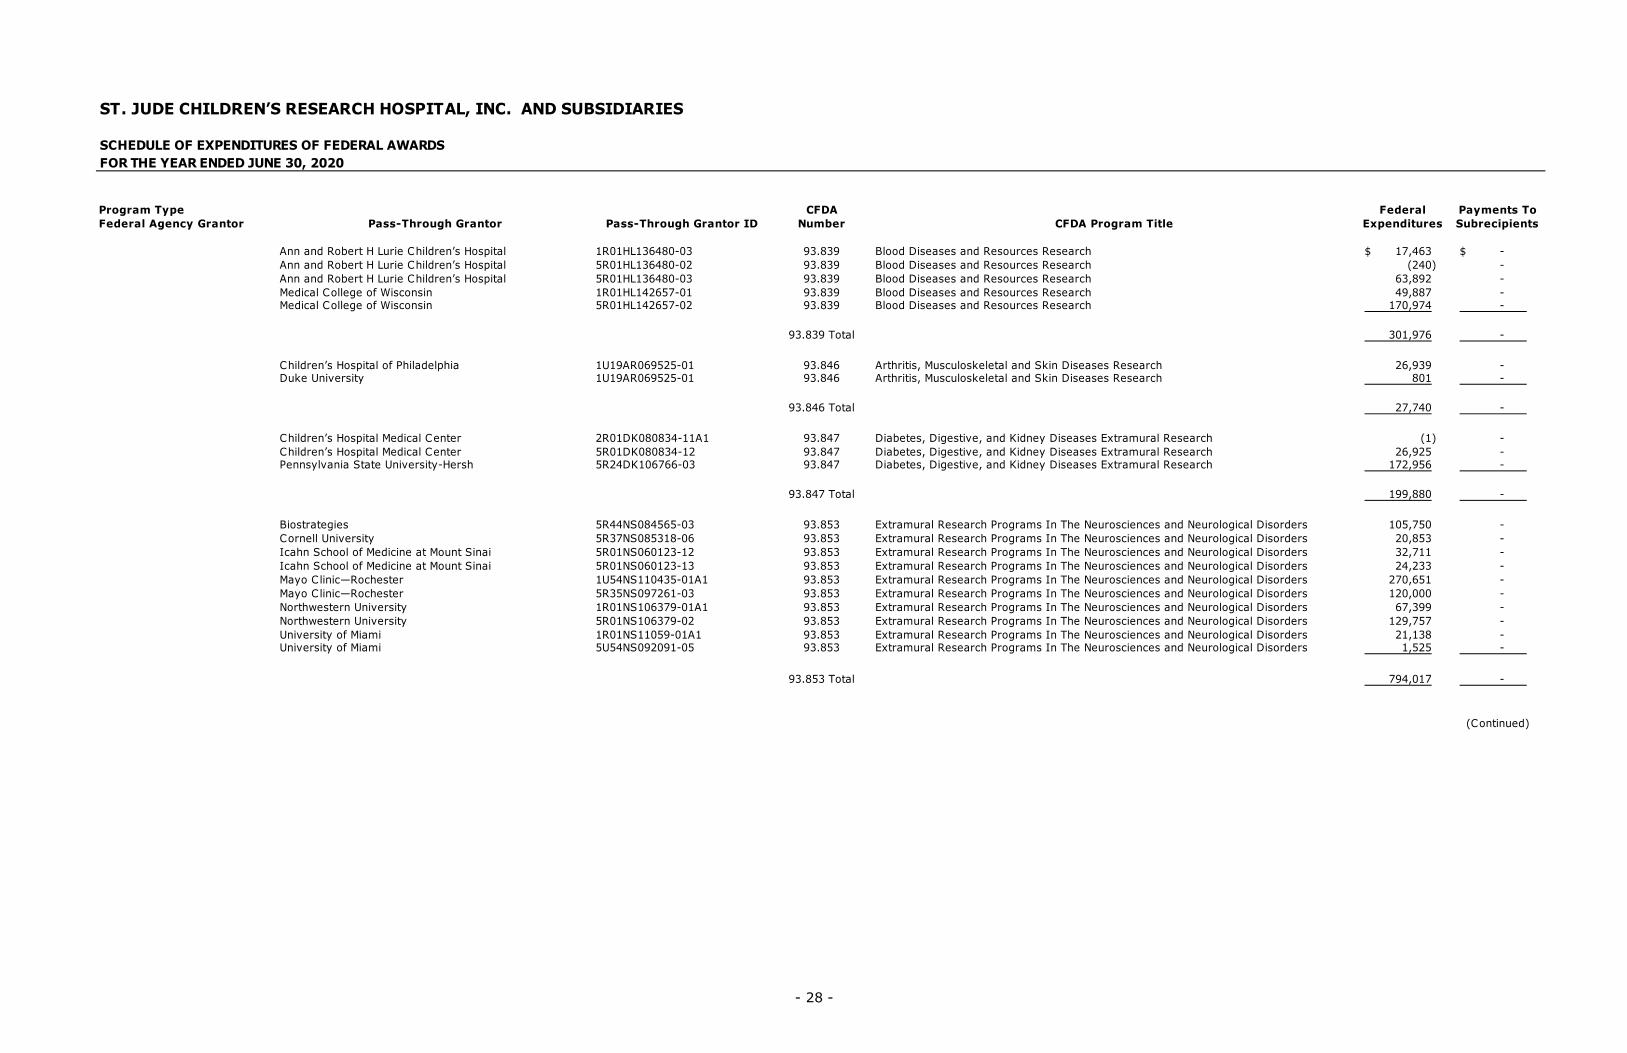
Ann and Robert H Lurie Children’s Hospital 1R01HL136480-03 93.839 Blood Diseases and Resources Research 17,463$ - $ Ann and Robert H Lurie Children’s Hospital 5R01HL136480-02 93.839 Blood Diseases and Resources Research (240) -Ann and Robert H Lurie Children’s Hospital 5R01HL136480-03 93.839 Blood Diseases and Resources Research 63,892 -Medical College of Wisconsin 1R01HL142657-01 93.839 Blood Diseases and Resources Research 49,887 -Medical College of Wisconsin 5R01HL142657-02 93.839 Blood Diseases and Resources Research 170,974 -
93.839 Total 301,976 -
Children’s Hospital of Philadelphia 1U19AR069525-01 93.846 Arthritis, Musculoskeletal and Skin Diseases Research 26,939 - Duke University 1U19AR069525-01 93.846 Arthritis, Musculoskeletal and Skin Diseases Research 801 -
93.846 Total 27,740 -
Children’s Hospital Medical Center 2R01DK080834-11A1 93.847 Diabetes, Digestive, and Kidney Diseases Extramural Research (1) -Children’s Hospital Medical Center 5R01DK080834-12 93.847 Diabetes, Digestive, and Kidney Diseases Extramural Research 26,925 -Pennsylvania State University-Hersh 5R24DK106766-03 93.847 Diabetes, Digestive, and Kidney Diseases Extramural Research 172,956 -
93.847 Total 199,880 -
Biostrategies 5R44NS084565-03 93.853 Extramural Research Programs In The Neurosciences and Neurological Disorders 105,750 - Cornell University 5R37NS085318-06 93.853 Extramural Research Programs In The Neurosciences and Neurological Disorders 20,853 - Icahn School of Medicine at Mount Sinai 5R01NS060123-12 93.853 Extramural Research Programs In The Neurosciences and Neurological Disorders 32,711 - Icahn School of Medicine at Mount Sinai 5R01NS060123-13 93.853 Extramural Research Programs In The Neurosciences and Neurological Disorders 24,233 - Mayo Clinic—Rochester 1U54NS110435-01A1 93.853 Extramural Research Programs In The Neurosciences and Neurological Disorders 270,651 - Mayo Clinic—Rochester 5R35NS097261-03 93.853 Extramural Research Programs In The Neurosciences and Neurological Disorders 120,000 - Northwestern University 1R01NS106379-01A1 93.853 Extramural Research Programs In The Neurosciences and Neurological Disorders 67,399 - Northwestern University 5R01NS106379-02 93.853 Extramural Research Programs In The Neurosciences and Neurological Disorders 129,757 - University of Miami 1R01NS11059-01A1 93.853 Extramural Research Programs In The Neurosciences and Neurological Disorders 21,138 - University of Miami 5U54NS092091-05 93.853 Extramural Research Programs In The Neurosciences and Neurological Disorders 1,525 -
93.853 Total 794,017 -
(Continued)
- 29 -
ST. JUDE CHILDREN’S RESEARCH HOSPITAL, INC. AND SUBSIDIARIES
SCHEDULE OF EXPENDITURES OF FEDERAL AWARDSFOR THE YEAR ENDED JUNE 30, 2020
Program Type CFDA Federal Payments ToFederal Agency Grantor Pass-Through Grantor Pass-Through Grantor ID Number CFDA Program Title Expenditures Subrecipients
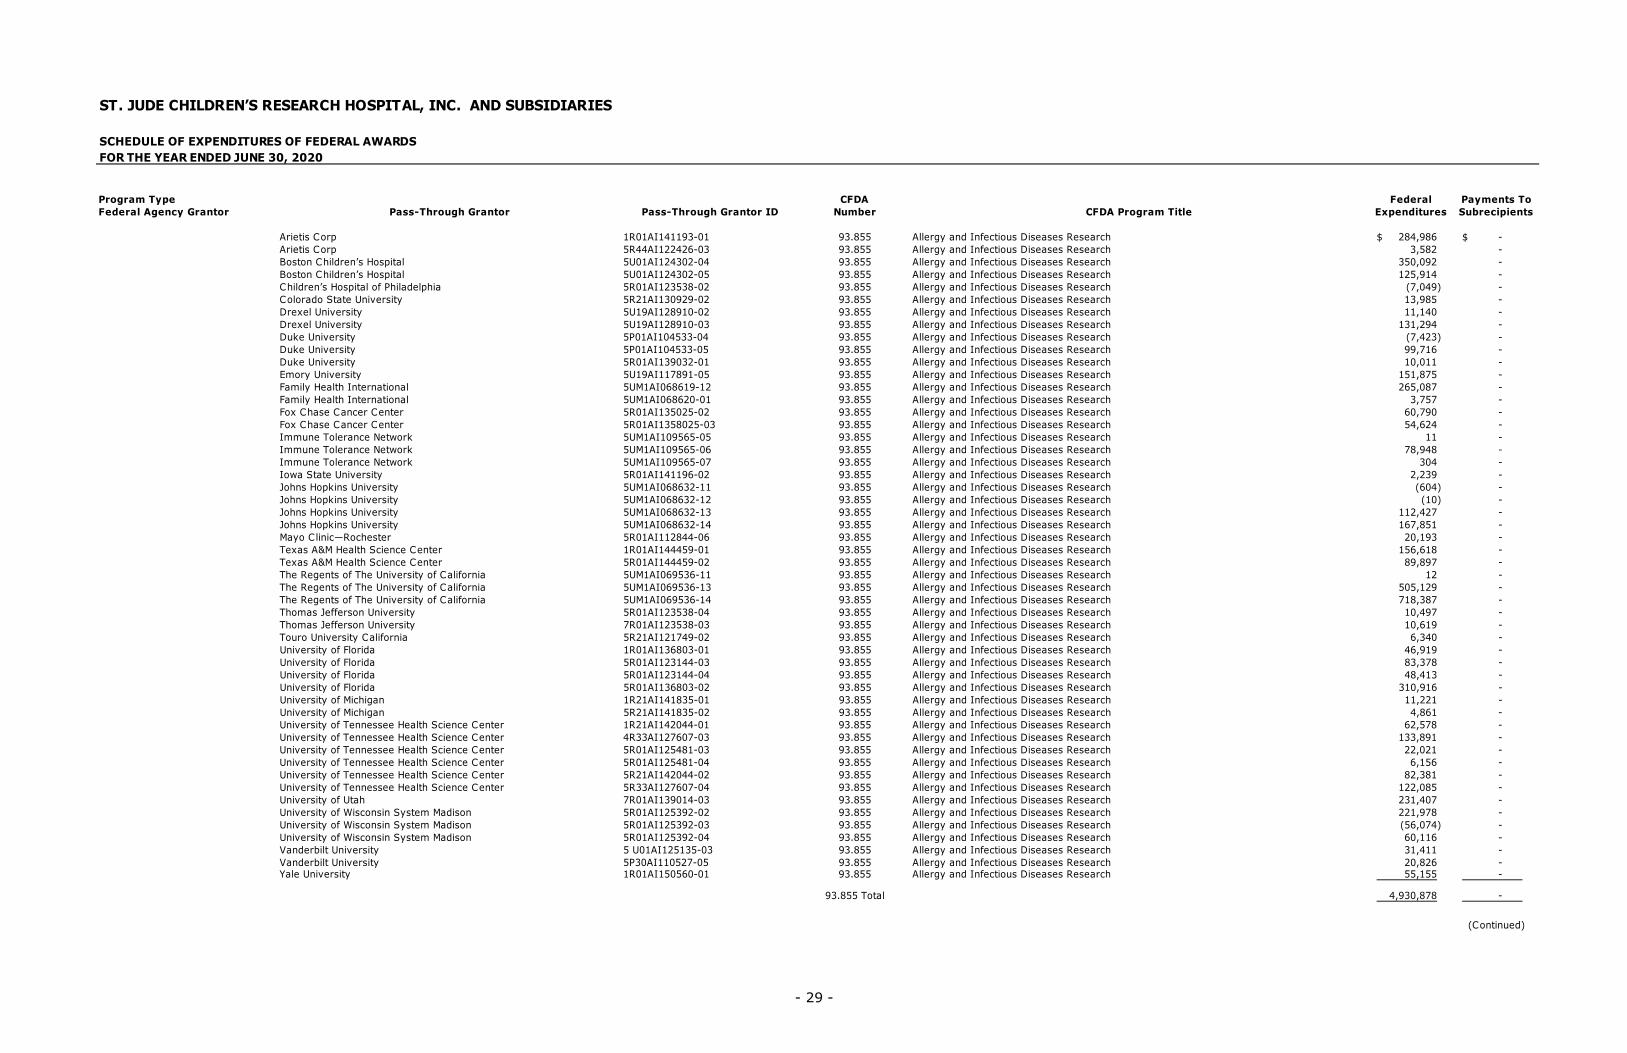
Arietis Corp 1R01AI141193-01 93.855 Allergy and Infectious Diseases Research 284,986$ - $ Arietis Corp 5R44AI122426-03 93.855 Allergy and Infectious Diseases Research 3,582 - Boston Children’s Hospital 5U01AI124302-04 93.855 Allergy and Infectious Diseases Research 350,092 - Boston Children’s Hospital 5U01AI124302-05 93.855 Allergy and Infectious Diseases Research 125,914 - Children’s Hospital of Philadelphia 5R01AI123538-02 93.855 Allergy and Infectious Diseases Research (7,049) - Colorado State University 5R21AI130929-02 93.855 Allergy and Infectious Diseases Research 13,985 - Drexel University 5U19AI128910-02 93.855 Allergy and Infectious Diseases Research 11,140 - Drexel University 5U19AI128910-03 93.855 Allergy and Infectious Diseases Research 131,294 - Duke University 5P01AI104533-04 93.855 Allergy and Infectious Diseases Research (7,423) - Duke University 5P01AI104533-05 93.855 Allergy and Infectious Diseases Research 99,716 - Duke University 5R01AI139032-01 93.855 Allergy and Infectious Diseases Research 10,011 - Emory University 5U19AI117891-05 93.855 Allergy and Infectious Diseases Research 151,875 - Family Health International 5UM1AI068619-12 93.855 Allergy and Infectious Diseases Research 265,087 - Family Health International 5UM1AI068620-01 93.855 Allergy and Infectious Diseases Research 3,757 - Fox Chase Cancer Center 5R01AI135025-02 93.855 Allergy and Infectious Diseases Research 60,790 - Fox Chase Cancer Center 5R01AI1358025-03 93.855 Allergy and Infectious Diseases Research 54,624 - Immune Tolerance Network 5UM1AI109565-05 93.855 Allergy and Infectious Diseases Research 11 - Immune Tolerance Network 5UM1AI109565-06 93.855 Allergy and Infectious Diseases Research 78,948 - Immune Tolerance Network 5UM1AI109565-07 93.855 Allergy and Infectious Diseases Research 304 - Iowa State University 5R01AI141196-02 93.855 Allergy and Infectious Diseases Research 2,239 - Johns Hopkins University 5UM1AI068632-11 93.855 Allergy and Infectious Diseases Research (604) - Johns Hopkins University 5UM1AI068632-12 93.855 Allergy and Infectious Diseases Research (10) - Johns Hopkins University 5UM1AI068632-13 93.855 Allergy and Infectious Diseases Research 112,427 - Johns Hopkins University 5UM1AI068632-14 93.855 Allergy and Infectious Diseases Research 167,851 - Mayo Clinic—Rochester 5R01AI112844-06 93.855 Allergy and Infectious Diseases Research 20,193 - Texas A&M Health Science Center 1R01AI144459-01 93.855 Allergy and Infectious Diseases Research 156,618 - Texas A&M Health Science Center 5R01AI144459-02 93.855 Allergy and Infectious Diseases Research 89,897 - The Regents of The University of California 5UM1AI069536-11 93.855 Allergy and Infectious Diseases Research 12 - The Regents of The University of California 5UM1AI069536-13 93.855 Allergy and Infectious Diseases Research 505,129 - The Regents of The University of California 5UM1AI069536-14 93.855 Allergy and Infectious Diseases Research 718,387 - Thomas Jefferson University 5R01AI123538-04 93.855 Allergy and Infectious Diseases Research 10,497 - Thomas Jefferson University 7R01AI123538-03 93.855 Allergy and Infectious Diseases Research 10,619 - Touro University California 5R21AI121749-02 93.855 Allergy and Infectious Diseases Research 6,340 - University of Florida 1R01AI136803-01 93.855 Allergy and Infectious Diseases Research 46,919 - University of Florida 5R01AI123144-03 93.855 Allergy and Infectious Diseases Research 83,378 - University of Florida 5R01AI123144-04 93.855 Allergy and Infectious Diseases Research 48,413 - University of Florida 5R01AI136803-02 93.855 Allergy and Infectious Diseases Research 310,916 - University of Michigan 1R21AI141835-01 93.855 Allergy and Infectious Diseases Research 11,221 - University of Michigan 5R21AI141835-02 93.855 Allergy and Infectious Diseases Research 4,861 - University of Tennessee Health Science Center 1R21AI142044-01 93.855 Allergy and Infectious Diseases Research 62,578 - University of Tennessee Health Science Center 4R33AI127607-03 93.855 Allergy and Infectious Diseases Research 133,891 - University of Tennessee Health Science Center 5R01AI125481-03 93.855 Allergy and Infectious Diseases Research 22,021 - University of Tennessee Health Science Center 5R01AI125481-04 93.855 Allergy and Infectious Diseases Research 6,156 - University of Tennessee Health Science Center 5R21AI142044-02 93.855 Allergy and Infectious Diseases Research 82,381 - University of Tennessee Health Science Center 5R33AI127607-04 93.855 Allergy and Infectious Diseases Research 122,085 - University of Utah 7R01AI139014-03 93.855 Allergy and Infectious Diseases Research 231,407 - University of Wisconsin System Madison 5R01AI125392-02 93.855 Allergy and Infectious Diseases Research 221,978 - University of Wisconsin System Madison 5R01AI125392-03 93.855 Allergy and Infectious Diseases Research (56,074) - University of Wisconsin System Madison 5R01AI125392-04 93.855 Allergy and Infectious Diseases Research 60,116 - Vanderbilt University 5 U01AI125135-03 93.855 Allergy and Infectious Diseases Research 31,411 - Vanderbilt University 5P30AI110527-05 93.855 Allergy and Infectious Diseases Research 20,826 - Yale University 1R01AI150560-01 93.855 Allergy and Infectious Diseases Research 55,155 -
93.855 Total 4,930,878 -
(Continued)

- 30 -
ST. JUDE CHILDREN’S RESEARCH HOSPITAL, INC. AND SUBSIDIARIES
SCHEDULE OF EXPENDITURES OF FEDERAL AWARDSFOR THE YEAR ENDED JUNE 30, 2020
Program Type CFDA Federal Payments ToFederal Agency Grantor Pass-Through Grantor Pass-Through Grantor ID Number CFDA Program Title Expenditures Subrecipients
University of California—Irvine 5R01GM129264-02 93.859 Biomedical Research and Research Training 45,118$ - $
93.859 Total 45,118 -
Duke University 5R01HD081044-02 93.865 Child Health and Human Development Extramural Research 5,629 - Florida State University 5U19HD089875-03 93.865 Child Health and Human Development Extramural Research 115 - Florida State University 5U19HD089875-05 93.865 Child Health and Human Development Extramural Research 42,655 - Florida State University 5U19HD089875-06 93.865 Child Health and Human Development Extramural Research 3,841 - Florida State University 7U19HD089875-03 93.865 Child Health and Human Development Extramural Research (228) -Harvard Medical School 5U01HD052102-14 93.865 Child Health and Human Development Extramural Research 69,845 -Harvard Medical School 5U01HD052102-15 93.865 Child Health and Human Development Extramural Research 535,643 -Harvard T.H. Chan School of Public Health 5U01HD052102-14 93.865 Child Health and Human Development Extramural Research 38,805 -Harvard T.H. Chan School of Public Health 5U01HD052102-15 93.865 Child Health and Human Development Extramural Research 154,153 -Hudson-Alpha Institute for Biotechnology 2U24HD090744-04 93.865 Child Health and Human Development Extramural Research 393,980 -Hudson-Alpha Institute for Biotechnology 5U24HD090744-03 93.865 Child Health and Human Development Extramural Research (378) -University of Michigan 5U24HD089880-03 93.865 Child Health and Human Development Extramural Research 1,679 - University of Michigan 5U24HD089880-04 93.865 Child Health and Human Development Extramural Research 71,512 - University of Michigan 5U24HD089880-05 93.865 Child Health and Human Development Extramural Research 6,955 - University of North Carolina-Chapel Hill 5U24HD089880-02 93.865 Child Health and Human Development Extramural Research (247) -University of North Carolina-Chapel Hill 5U24HD089880-03 93.865 Child Health and Human Development Extramural Research 115 - University of North Carolina-Chapel Hill 5U24HD089880-04 93.865 Child Health and Human Development Extramural Research 32,545 - University of North Carolina-Chapel Hill 5U24HD089880-05 93.865 Child Health and Human Development Extramural Research 1,932 -
93.865 Total 1,358,551 -
Icahn School of Medicine at Mount Sanai 1R01AG062355-01 93.866 Aging Research (356) -Icahn School of Medicine at Mount Sanai 1RF1AG057440-01 93.866 Aging Research 180,598 -Icahn School of Medicine at Mount Sanai 5R01AG057907-02 93.866 Aging Research (1,165) -Icahn School of Medicine at Mount Sanai 5R01AG057907-03 93.866 Aging Research 58,743 -Icahn School of Medicine at Mount Sanai 5R01AG057907-04 93.866 Aging Research 5,587 -Icahn School of Medicine at Mount Sanai 5R01AG062355-02 93.866 Aging Research 104,559 -Icahn School of Medicine at Mount Sanai 5R01AG062355-03 93.866 Aging Research 12,223 -University of Texas Southwest Medical Center 1R01AG064909-01 93.866 Aging Research 107,733 -University of Texas Southwest Medical Center 1RF1AG064909-01 93.866 Aging Research 100,714 -
93.866 Total 568,636 -
(Continued)
- 31 -
ST. JUDE CHILDREN’S RESEARCH HOSPITAL, INC. AND SUBSIDIARIES
SCHEDULE OF EXPENDITURES OF FEDERAL AWARDSFOR THE YEAR ENDED JUNE 30, 2020
Program Type CFDA Federal Payments ToFederal Agency Grantor Pass-Through Grantor Pass-Through Grantor ID Number CFDA Program Title Expenditures Subrecipients
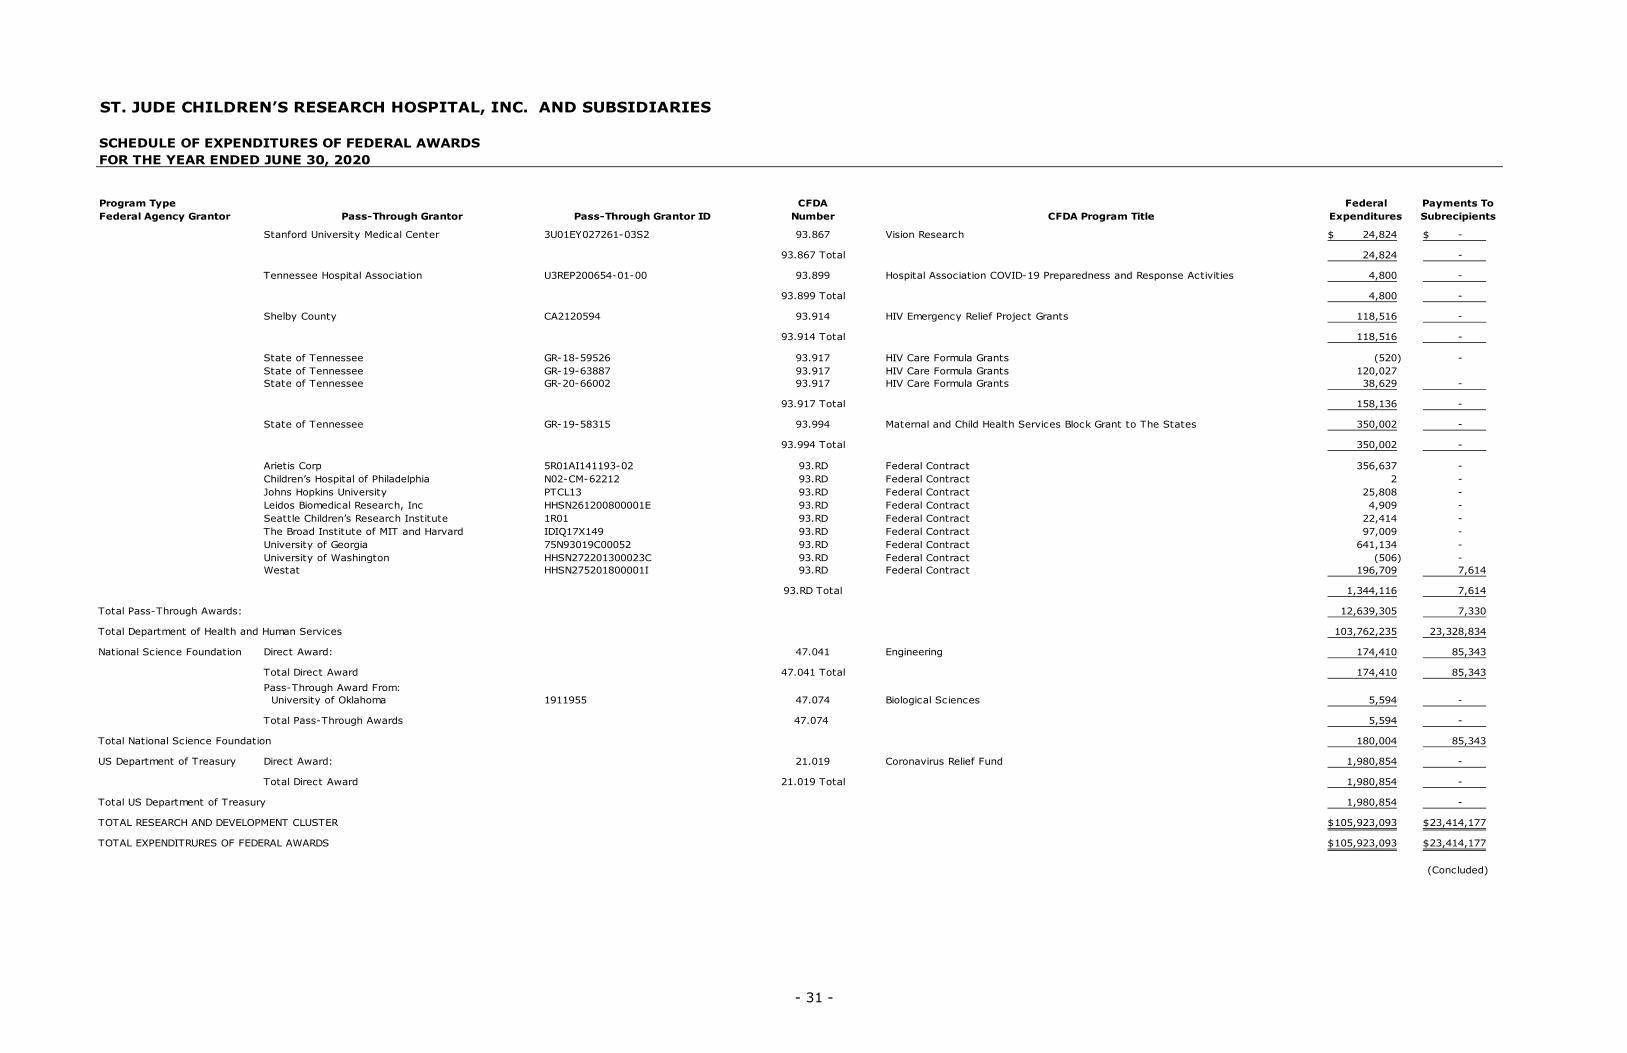
Stanford University Medical Center 3U01EY027261-03S2 93.867 Vision Research 24,824$ - $
93.867 Total 24,824 -
Tennessee Hospital Association U3REP200654-01-00 93.899 Hospital Association COVID-19 Preparedness and Response Activities 4,800 -
93.899 Total 4,800 -
Shelby County CA2120594 93.914 HIV Emergency Relief Project Grants 118,516 -
93.914 Total 118,516 -
State of Tennessee GR-18-59526 93.917 HIV Care Formula Grants (520) - State of Tennessee GR-19-63887 93.917 HIV Care Formula Grants 120,027 State of Tennessee GR-20-66002 93.917 HIV Care Formula Grants 38,629 -
93.917 Total 158,136 -
State of Tennessee GR-19-58315 93.994 Maternal and Child Health Services Block Grant to The States 350,002 -
93.994 Total 350,002 -
Arietis Corp 5R01AI141193-02 93.RD Federal Contract 356,637 - Children’s Hospital of Philadelphia N02-CM-62212 93.RD Federal Contract 2 - Johns Hopkins University PTCL13 93.RD Federal Contract 25,808 - Leidos Biomedical Research, Inc HHSN261200800001E 93.RD Federal Contract 4,909 - Seattle Children’s Research Institute 1R01 93.RD Federal Contract 22,414 - The Broad Institute of MIT and Harvard IDIQ17X149 93.RD Federal Contract 97,009 - University of Georgia 75N93019C00052 93.RD Federal Contract 641,134 - University of Washington HHSN272201300023C 93.RD Federal Contract (506) - Westat HHSN275201800001I 93.RD Federal Contract 196,709 7,614
93.RD Total 1,344,116 7,614
Total Pass-Through Awards: 12,639,305 7,330
Total Department of Health and Human Services 103,762,235 23,328,834
National Science Foundation Direct Award: 47.041 Engineering 174,410 85,343
Total Direct Award 47.041 Total 174,410 85,343 Pass-Through Award From: University of Oklahoma 1911955 47.074 Biological Sciences 5,594 -
Total Pass-Through Awards 47.074 5,594 -
Total National Science Foundation 180,004 85,343
US Department of Treasury Direct Award: 21.019 Coronavirus Relief Fund 1,980,854 -
Total Direct Award 21.019 Total 1,980,854 -
Total US Department of Treasury 1,980,854 -
TOTAL RESEARCH AND DEVELOPMENT CLUSTER 105,923,093$ 23,414,177$
TOTAL EXPENDITRURES OF FEDERAL AWARDS 105,923,093$ 23,414,177$
(Concluded)

- 32 -
ST. JUDE CHILDREN’S RESEARCH HOSPITAL, INC. AND SUBSIDIARIES
NOTES TO SCHEDULE OF EXPENDITURES OF FEDERAL AWARDS FOR THE YEAR ENDED JUNE 30, 2020
1. BASIS OF PRESENTATION
The accompanying schedule of expenditures of federal awards (the “Schedule”) includesthe federal award activity of St. Jude Children’s Research Hospital, Inc. and its whollyowned subsidiaries (collectively, the “Hospital”) under programs of the federal governmentfor the year ended June 30, 2020, in accordance with the requirements of Title 2 US Codeof Federal Regulations Part 200, Uniform Administrative Requirements and AuditRequirements for Federal Awards (the “Uniform Guidance”), and Title 45 US Code ofFederal Regulations Part 75, Appendix IX, Cost Principles for Hospitals. Because theSchedule presents only a selected portion of the operations of the Hospital, it is notintended to, and does not, present the financial position, changes in net assets, or cashflows of the Hospital.
2. SUMMARY OF SIGNIFICANT ACCOUNTING POLICIES
For purposes of the Schedule, expenditures of federal award programs are recognized onthe accrual basis of accounting. These expenditures are recognized following the costprinciples contained in Title 45 US Code of Federal Regulations Part 75, Appendix IX,wherein certain types of expenditures are not allowed or are limited as to reimbursement.Negative amounts shown in the Schedule represent adjustments or credits made in thenormal course of business to amounts reported as expenditures in prior years. The Hospitalhas elected not to use the 10% de minimus indirect cost rate as allowed under the UniformGuidance.
3. FEDERAL LOANS
The Hospital has no federal loans.
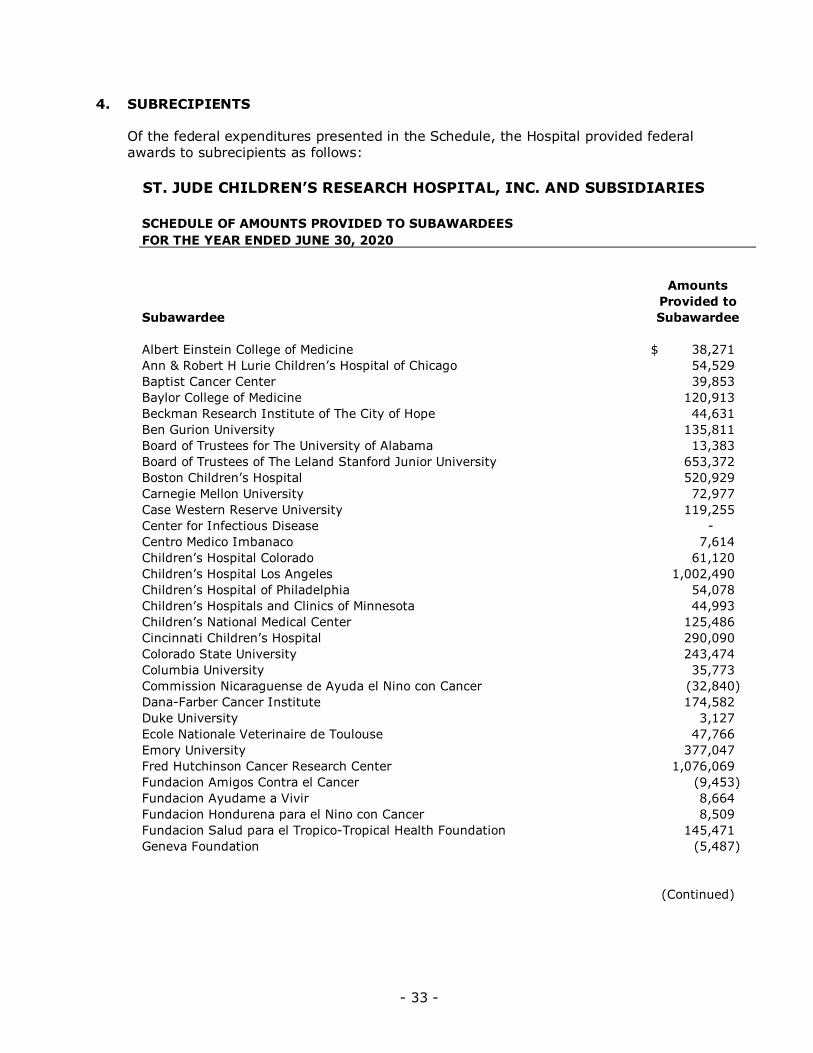
- 33 -
4. SUBRECIPIENTS
Of the federal expenditures presented in the Schedule, the Hospital provided federalawards to subrecipients as follows:
ST. JUDE CHILDREN’S RESEARCH HOSPITAL, INC. AND SUBSIDIARIES
SCHEDULE OF AMOUNTS PROVIDED TO SUBAWARDEESFOR THE YEAR ENDED JUNE 30, 2020
AmountsProvided to
Subawardee Subawardee
Albert Einstein College of Medicine 38,271$ Ann & Robert H Lurie Children’s Hospital of Chicago 54,529 Baptist Cancer Center 39,853 Baylor College of Medicine 120,913 Beckman Research Institute of The City of Hope 44,631 Ben Gurion University 135,811 Board of Trustees for The University of Alabama 13,383 Board of Trustees of The Leland Stanford Junior University 653,372 Boston Children’s Hospital 520,929 Carnegie Mellon University 72,977 Case Western Reserve University 119,255 Center for Infectious Disease - Centro Medico Imbanaco 7,614 Children’s Hospital Colorado 61,120 Children’s Hospital Los Angeles 1,002,490 Children’s Hospital of Philadelphia 54,078 Children’s Hospitals and Clinics of Minnesota 44,993 Children’s National Medical Center 125,486 Cincinnati Children’s Hospital 290,090 Colorado State University 243,474 Columbia University 35,773 Commission Nicaraguense de Ayuda el Nino con Cancer (32,840) Dana-Farber Cancer Institute 174,582 Duke University 3,127 Ecole Nationale Veterinaire de Toulouse 47,766 Emory University 377,047 Fred Hutchinson Cancer Research Center 1,076,069 Fundacion Amigos Contra el Cancer (9,453) Fundacion Ayudame a Vivir 8,664 Fundacion Hondurena para el Nino con Cancer 8,509 Fundacion Salud para el Tropico-Tropical Health Foundation 145,471 Geneva Foundation (5,487)
(Continued)
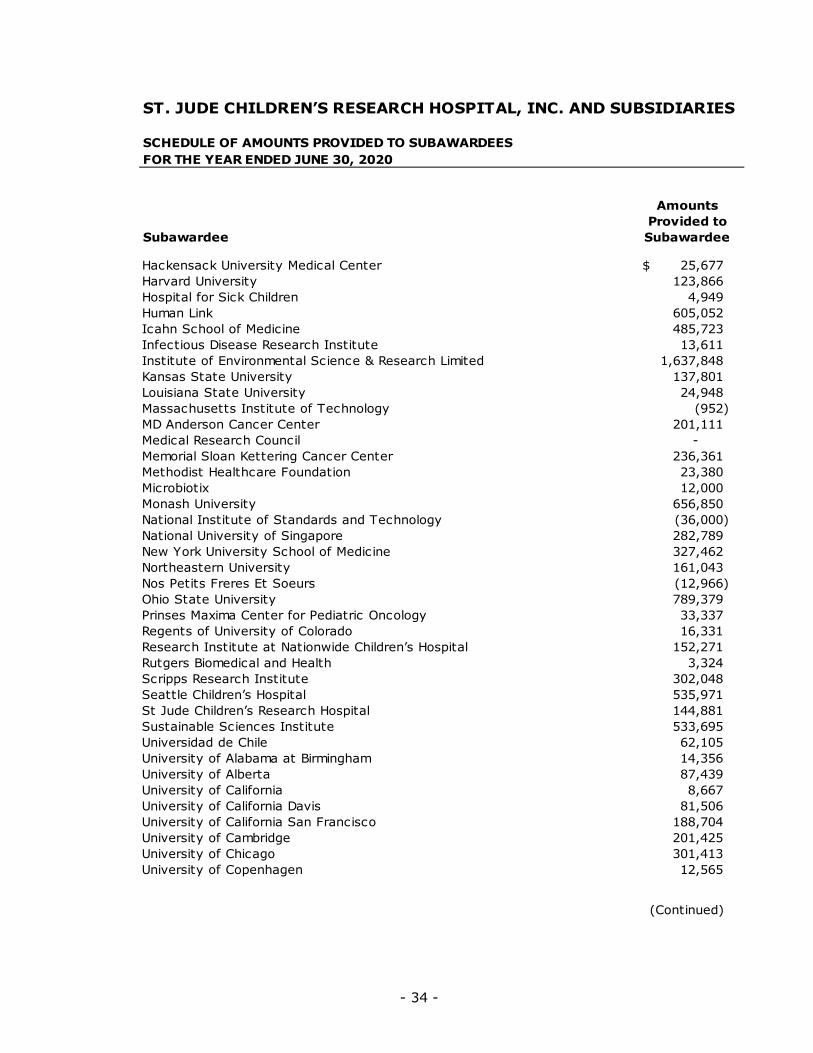
- 34 -
ST. JUDE CHILDREN’S RESEARCH HOSPITAL, INC. AND SUBSIDIARIES
SCHEDULE OF AMOUNTS PROVIDED TO SUBAWARDEESFOR THE YEAR ENDED JUNE 30, 2020
AmountsProvided to
Subawardee Subawardee
Hackensack University Medical Center 25,677$ Harvard University 123,866 Hospital for Sick Children 4,949 Human Link 605,052 Icahn School of Medicine 485,723 Infectious Disease Research Institute 13,611 Institute of Environmental Science & Research Limited 1,637,848 Kansas State University 137,801 Louisiana State University 24,948 Massachusetts Institute of Technology (952) MD Anderson Cancer Center 201,111 Medical Research Council - Memorial Sloan Kettering Cancer Center 236,361 Methodist Healthcare Foundation 23,380 Microbiotix 12,000 Monash University 656,850 National Institute of Standards and Technology (36,000) National University of Singapore 282,789 New York University School of Medicine 327,462 Northeastern University 161,043 Nos Petits Freres Et Soeurs (12,966) Ohio State University 789,379 Prinses Maxima Center for Pediatric Oncology 33,337 Regents of University of Colorado 16,331 Research Institute at Nationwide Children’s Hospital 152,271 Rutgers Biomedical and Health 3,324 Scripps Research Institute 302,048 Seattle Children’s Hospital 535,971 St Jude Children’s Research Hospital 144,881 Sustainable Sciences Institute 533,695 Universidad de Chile 62,105 University of Alabama at Birmingham 14,356 University of Alberta 87,439 University of California 8,667 University of California Davis 81,506 University of California San Francisco 188,704 University of Cambridge 201,425 University of Chicago 301,413 University of Copenhagen 12,565
(Continued)
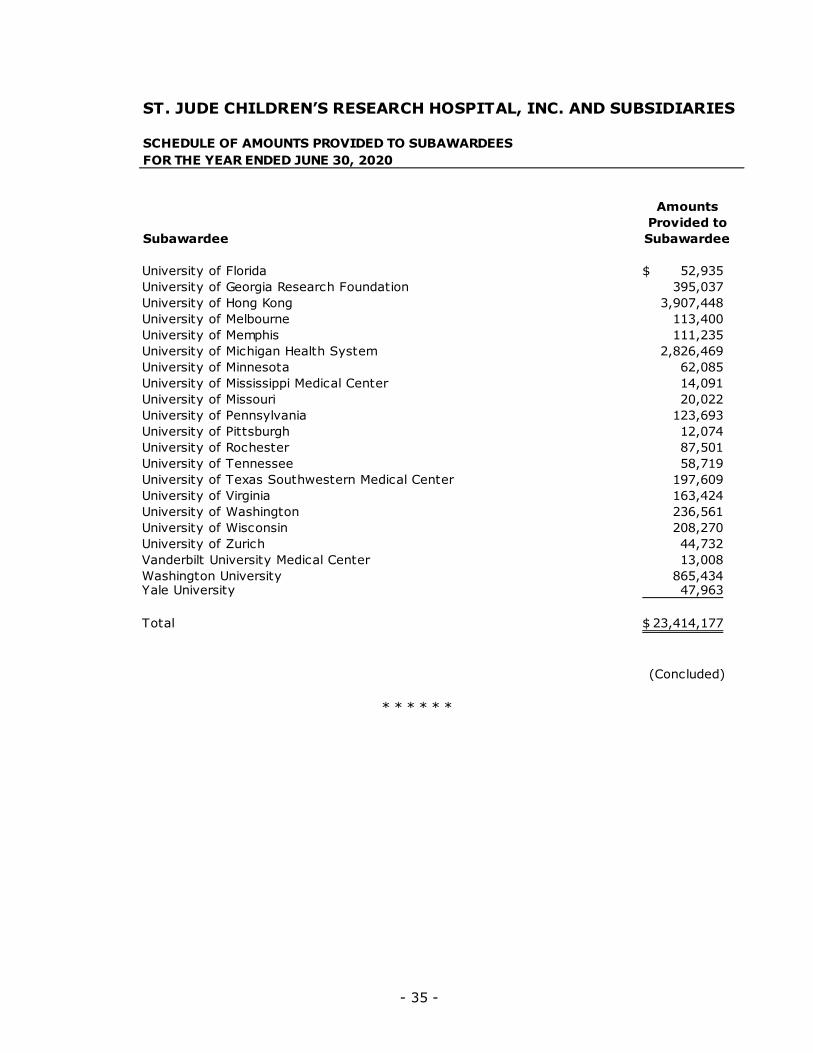
- 35 -
ST. JUDE CHILDREN’S RESEARCH HOSPITAL, INC. AND SUBSIDIARIES
SCHEDULE OF AMOUNTS PROVIDED TO SUBAWARDEESFOR THE YEAR ENDED JUNE 30, 2020
AmountsProvided to
Subawardee Subawardee
University of Florida 52,935$ University of Georgia Research Foundation 395,037 University of Hong Kong 3,907,448 University of Melbourne 113,400 University of Memphis 111,235 University of Michigan Health System 2,826,469 University of Minnesota 62,085 University of Mississippi Medical Center 14,091 University of Missouri 20,022 University of Pennsylvania 123,693 University of Pittsburgh 12,074 University of Rochester 87,501 University of Tennessee 58,719 University of Texas Southwestern Medical Center 197,609 University of Virginia 163,424 University of Washington 236,561 University of Wisconsin 208,270 University of Zurich 44,732 Vanderbilt University Medical Center 13,008 Washington University 865,434 Yale University 47,963
Total 23,414,177$
(Concluded)
* * * * * *
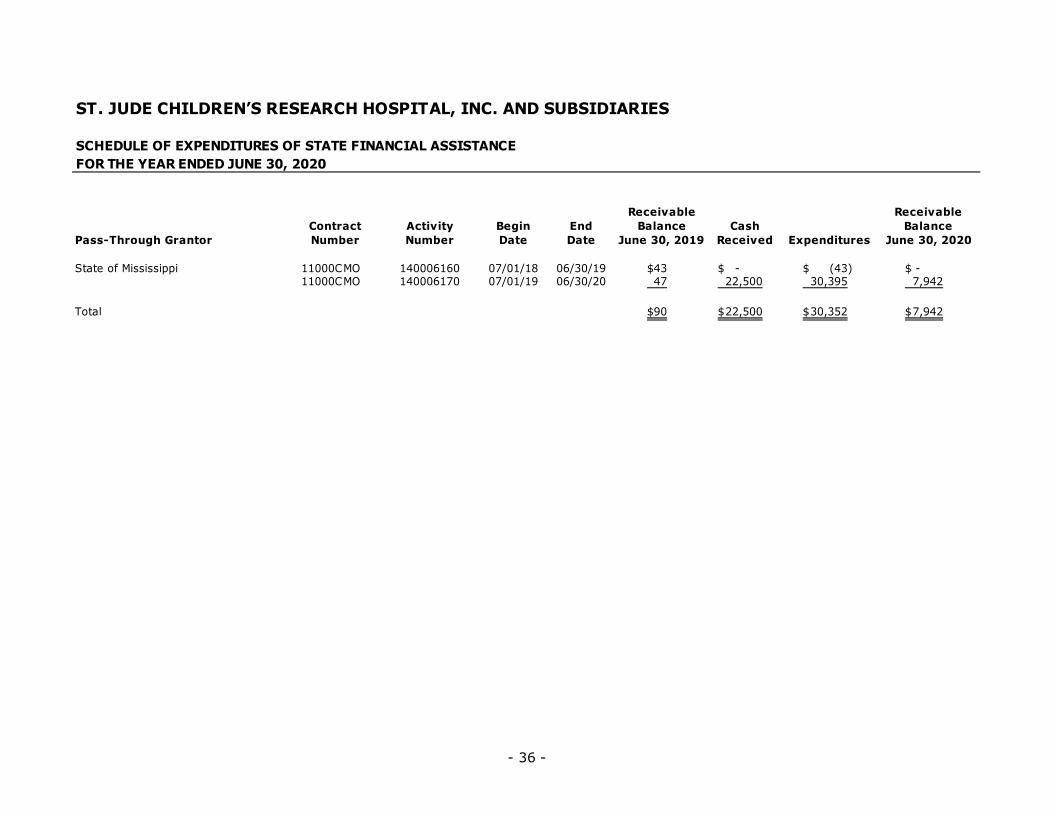
- 36 -
ST. JUDE CHILDREN’S RESEARCH HOSPITAL, INC. AND SUBSIDIARIES
SCHEDULE OF EXPENDITURES OF STATE FINANCIAL ASSISTANCEFOR THE YEAR ENDED JUNE 30, 2020
Receivable ReceivableContract Activity Begin End Balance Cash Balance
Pass-Through Grantor Number Number Date Date June 30, 2019 Received Expenditures June 30, 2020
State of Mississippi 11000CMO 140006160 07/01/18 06/30/19 43$ - $ (43)$ - $ 11000CMO 140006170 07/01/19 06/30/20 47 22,500 30,395 7,942
Total 90$ 22,500$ 30,352$ 7,942$
- 37 -
ST. JUDE CHILDREN’S RESEARCH HOSPITAL, INC. AND SUBSIDIARIES
NOTES TO SCHEDULE OF EXPENDITURES OF STATE FINANCIAL ASSISTANCE FOR THE YEAR ENDED JUNE 30, 2020
1. BASIS OF PRESENTATION
The accompanying schedule of expenditures of state financial assistance includes the stategrant activity of St. Jude Children’s Research Hospital, Inc. and its wholly ownedsubsidiaries (collectively, the “Hospital”). The information in this schedule is presented inaccordance with the requirements of the State of Tennessee Department of Audit, AuditManual for Local Governmental Units and Recipients of Grant Funds. Therefore, someamounts presented in this schedule may differ from amounts presented in, or used in thepreparation of, the Hospital’s consolidated financial statements.
2. SUMMARY OF SIGNIFICANT ACCOUNTING POLICIES
For purposes of the schedule, expenditures of state financial assistance programs arerecognized on the accrual basis of accounting.
* * * * * *
INDEPENDENT AUDITORS’ REPORTS ON INTERNAL CONTROL OVER FINANCIAL REPORTING AND ON COMPLIANCE AND OTHER MATTERS BASED ON AUDITS OF CONSOLIDATED FINANCIAL STATEMENTS PERFORMED IN ACCORDANCE WITH GOVERNMENT AUDITING STANDARDS
To the Board of Governors of St. Jude Children’s Research Hospital, Inc. Memphis, Tennessee
We have audited, in accordance with the auditing standards generally accepted in the United States of America and the standards applicable to financial audits contained in Government Auditing Standards issued by the Comptroller General of the United States, the consolidated financial statements of St. Jude Children’s Research Hospital, Inc. and its wholly owned subsidiaries (collectively, the “Hospital”), as of and for the year ended June 30, 2020, and the related notes to consolidated financial statements, which collectively comprise the Hospital’s basic financial statements, and have issued our reports thereon dated October 6, 2020.
Internal Control over Financial Reporting
In planning and performing our audit of the consolidated financial statements, we considered the Hospital’s internal control over financial reporting (“internal control”) as a basis for designing audit procedures that are appropriate in the circumstances for the purpose of expressing our opinions on the consolidated financial statements, but not for the purpose of expressing an opinion on the effectiveness of the Hospital’s internal control. Accordingly, we do not express an opinion on the effectiveness of the Hospital’s internal control.
A deficiency in internal control exists when the design or operation of a control does not allow management or employees, in the normal course of performing their assigned functions, to prevent, or detect and correct, misstatements on a timely basis. A material weakness is a deficiency, or a combination of deficiencies, in internal control, such that there is a reasonable possibility that a material misstatement of the Hospital’s consolidated financial statements will not be prevented, or detected and corrected on a timely basis. A significant deficiency is a deficiency, or a combination of deficiencies, in internal control that is less severe than a material weakness, yet important enough to merit attention by those charged with governance.
Our consideration of internal control was for the limited purpose described in the first paragraph of this section and was not designed to identify all deficiencies in internal control that might be material weaknesses or significant deficiencies. Given these limitations, during our audit we did not identify any deficiencies in internal control that we consider to be material weaknesses. However, material weaknesses may exist that have not been identified.
- 39 -
Compliance and Other Matters
As part of obtaining reasonable assurance about whether the Hospital’s consolidated financial statements are free from material misstatement, we performed tests of its compliance with certain provisions of laws, regulations, contracts, and grant agreements, noncompliance with which could have a direct and material effect on the consolidated financial statements. However, providing an opinion on compliance with those provisions was not an objective of our audit and, accordingly, we do not express such an opinion. The results of our tests disclosed no instances of noncompliance or other matters that are required to be reported under Government Auditing Standards.
Purpose of this Report
The purpose of this report is solely to describe the scope of our testing of internal control and compliance and the results of that testing and not to provide an opinion on the effectiveness of the Hospital’s internal control or on compliance. This report is an integral part of audit performed in accordance with Government Auditing Standards in considering the Hospital’s internal control and compliance. Accordingly, this communication is not suitable for any other purpose.
October 6, 2020
INDEPENDENT AUDITORS’ REPORT ON COMPLIANCE FOR EACH MAJOR FEDERAL PROGRAM, REPORT ON INTERNAL CONTROL OVER COMPLIANCE, AND REPORT ON SCHEDULE OF EXPENDITURES OF FEDERAL AWARDS REQUIRED BY THE UNIFORM GUIDANCE
To the Board of Governors of St. Jude Children’s Research Hospital, Inc. Memphis, Tennessee
Report on Compliance for Each Major Federal Program
We have audited St. Jude Children’s Research Hospital, Inc. and its wholly owned subsidiaries’ (collectively, the “Hospital”) compliance with the types of compliance requirements described in the OMB Compliance Supplement, that could have a direct and material effect on each of the Hospital’s major federal programs for the year ended June 30, 2020. The Hospital’s major federal programs are identified in the summary of auditors’ results section of the accompanying schedule of findings and questioned costs.
Management’s Responsibility
Management is responsible for compliance with the federal statutes, regulations, contracts, and grants applicable to its federal programs.
Auditors’ Responsibility
Our responsibility is to express an opinion on compliance for each of the Hospital’s major federal programs based on our audit of the types of compliance requirements referred to above. We conducted our audit of compliance in accordance with auditing standards generally accepted in the United States of America; the standards applicable to financial audits contained in Government Auditing Standards, issued by the Comptroller General of the United States; and the audit requirements of Title 2 US Code of Federal Regulations Part 200, Uniform Administrative Requirements, Cost Principles, and Audit Requirements for Federal Awards (the “Uniform Guidance”). Those standards and the Uniform Guidance require that we plan and perform the audit to obtain reasonable assurance about whether noncompliance with the types of compliance requirements referred to above that could have a direct and material effect on a major federal program occurred. An audit includes examining, on a test basis, evidence about the Hospital’s compliance with those requirements and performing such other procedures as we considered necessary in the circumstances.
We believe that our audit provides a reasonable basis for our opinion on compliance for each major federal program. However, our audit does not provide a legal determination of the Hospital’s compliance.

- 41 -
Opinion on Each Major Federal Program
In our opinion, the Hospital complied, in all material respects, with the types of compliance requirements referred to above that could have a direct and material effect on each of its major federal programs for the year ended June 30, 2020.
Report on Internal Control over Compliance
Management of the Hospital is responsible for establishing and maintaining effective internal control over compliance with the types of compliance requirements referred to above. In planning and performing our audit of compliance, we considered the Hospital’s internal control over compliance with the types of requirements that could have a direct and material effect on each major federal program to determine the auditing procedures that are appropriate in the circumstances for the purpose of expressing an opinion on compliance for each major federal program and to test and report on internal control over compliance in accordance with the Uniform Guidance, but not for the purpose of expressing an opinion on the effectiveness of internal control over compliance. Accordingly, we do not express an opinion on the effectiveness of Hospital’s internal control over compliance.
A deficiency in internal control over compliance exists when the design or operation of a control over compliance does not allow management or employees, in the normal course of performing their assigned functions, to prevent, or detect and correct, noncompliance with a type of compliance requirement of a federal program on a timely basis. A material weakness in internal control over compliance is a deficiency, or combination of deficiencies, in internal control over compliance, such that there is a reasonable possibility that material noncompliance with a type of compliance requirement of a federal program will not be prevented, or detected and corrected, on a timely basis. A significant deficiency in internal control over compliance is a deficiency, or a combination of deficiencies, in internal control over compliance with a type of compliance requirement of a federal program that is less severe than a material weakness in internal control over compliance, yet important enough to merit attention by those charged with governance.
Our consideration of internal control over compliance was for the limited purpose described in the first paragraph of this section and was not designed to identify all deficiencies in internal control over compliance that might be material weaknesses or significant deficiencies. We did not identify any deficiencies in internal control over compliance that we consider to be material weaknesses. However, material weaknesses may exist that have not been identified.
The purpose of this report on internal control over compliance is solely to describe the scope of our testing of internal control over compliance and the results of that testing based on the requirements of the Uniform Guidance. Accordingly, this report is not suitable for any other purpose.
- 42 -
Report on Schedule of Expenditures of Federal Awards Required by the Uniform Guidance
We have audited the consolidated financial statements of the Hospital as of and for the year ended June 30, 2020, and have issued our report thereon dated October 6, 2020, which contained an unmodified opinion on those consolidated financial statements. Our audit was conducted for the purpose of forming an opinion on the consolidated financial statements taken as a whole. The accompanying schedule of expenditures of federal awards is presented for purposes of additional analysis as required by the Uniform Guidance and is not a required part of the consolidated financial statements.
Such supplemental information is the responsibility of management and was derived from, and relates directly to, the underlying accounting and other records used to prepare the consolidated financial statements. The supplemental information has been subjected to the auditing procedures applied in the audit of the consolidated financial statements and certain additional procedures, including comparing and reconciling such information directly to the underlying accounting and other records used to prepare the consolidated financial statements or to the consolidated financial statements themselves, and other additional procedures in accordance with auditing standards generally accepted in the United States of America. In our opinion, the schedule of expenditure of federal awards is fairly stated, in all material respects, in relation to the consolidated financial statements taken as a whole.
October 6, 2020
- 43 -
ST. JUDE CHILDREN’S RESEARCH HOSPITAL, INC. AND SUBSIDIARIES
SCHEDULE OF FINDINGS AND QUESTIONED COSTS FOR THE YEAR ENDED JUNE 30, 2020
SECTION I—SUMMARY OF AUDITORS’ RESULTS
Consolidated Financial Statements
Type of auditors’ report issued: Unmodified
Internal control over financial reporting: Material weakness(es) identified? Yes X No
Significant deficiency(ies) identified? Yes X None reported
Noncompliance material to financial statements noted? Yes X No
Federal Awards
Internal control over major programs: Material weakness(es) identified? Yes X No
Significant deficiency(ies) identified? Yes X None reported
Type of auditors’ report issued on compliance for major programs: Unmodified
Any audit findings disclosed that are required to be reported in accordance with 2 CFR 200.516(a)? Yes X No
Identification of major programs:
CFDA Number Name of Federal Program or Cluster
Various Research and Development Cluster
Dollar threshold used to distinguish between Type A and Type B programs: 3,000,000$
Auditee qualified as low-risk auditee? X Yes No
SECTION II—CONSOLIDATED FINANCIAL STATEMENT FINDINGS
There were no findings related to the consolidated financial statements for the year ended June 30, 2020.

- 44 -
SECTION III—FEDERAL AWARD FINDINGS AND QUESTIONED COSTS
There were no findings or questioned costs that were reportable for the year ended June 30, 2020.
• ®
St. Jude Children's Research Hospital
ST. JUDE CHILDREN'S RESEARCH HOSPITAL, INC. AND SUBSIDIARIES
SUMMARY SCHEDULE OF PRIOR YEAR AUDIT FINDINGS
FOR THE YEAR ENDED JUNE 30, 2020
There were no prior-year findings or questioned costs.
262 Danny Thomas Place, Memphis, TN 38105-3678 I t 901.595.3300 I www.stjude.org
- 45 -