sports sponsorship effectiveness
TRANSCRIPT

Sports Sponsorship Effectiveness
Investigating awareness, sponsor equity and efficiency
Merel Walraven

Sports Sponsorship Effectiveness Investigating awareness, sponsor equity and efficiency
Cover design: InneractivePrinted & Lay Out by: Proefschriftmaken.nl || Uitgeverij BOXPressPublished by: Uitgeverij BOXPress, ‘s-HertogenboschISBN: 978-90-8891-716-5
© Merel Walraven, 2013
All rights reserved. No part of this publication may be reproduced or transmitted in any form by any means, without permission of the author.

RIJKSUNIVERSITEIT GRONINGEN
Sports Sponsorship Effectiveness Investigating awareness, sponsor equity and efficiency
Proefschrift
ter verkrijging van het doctoraat in de Economie en Bedrijfskunde
aan de Rijksuniversiteit Groningenop gezag van de
Rector Magnificus, dr. E. Sterken,in het openbaar te verdedigen op
donderdag 7 november 2013om 11.00 uur
door
Merel Walraven
geboren op 3 oktober 1982
te Vlissingen

Promotores: Prof. dr. R.H. Koning Prof. dr. T.H.A. Bijmolt
Beoordelingscommissie: Prof. dr. M. van Bottenburg Prof. dr. C. Breuer Prof. dr. J.E. Wieringa

5
Table of contents
1 Chapter1Introduction 91.1 Introducing the Sponsorship Market 101.2 Definition and Terminology 111.3 Differentiating Sponsorship 121.4 Aim and Research Questions of the Doctoral Thesis 13
2 Chapter 2 Literature Review 172.1 Introduction 182.2 Conceptual Framework 192.3 Sponsorship Market Conditions 212.4 Sponsorship Management Factors 21
2.4.1 Exposure 222.4.2 Sponsorship Leverage and Integration 222.4.3 Sponsorship Duration 23
2.5 Individual Difference Factors 232.5.1 Involvement 232.5.2 Perceived Sponsorship Fit 242.5.3 Attitude toward Sponsorship 242.5.4 Perceived Sincerity of the Sponsor 252.5.5 Familiarity with the Sponsoring Brand 252.5.6 Demographic Characteristics 25
2.6 Sponsorship Processing 262.7 Sponsorship Outcomes 29
2.7.1 Customer-based Brand Equity 29Cognitive outcomes of sponsorship 29Affective and conative outcomes of sponsorship 292.7.2 Strengthening Relations with Employees 302.7.3 Building Relationships with Customers and Other Stakeholders 312.7.4 Shareholder Value 31
2.8 Relation with the Empirical Chapters 32
3 Chapter3DynamicEffectsofSponsoring:HowSponsorshipAwarenessDevelops over Time 33
3.1 Introduction 343.2 Background 35
3.2.1 Sponsorship Awareness 353.2.2 Factors Influencing Sponsorship Awareness 353.2.3 The Effect of Sponsorship Duration 36

6
3.2.4 The Effect of Individual Involvement 373.2.5 The Effect of Sportive Success 39
3.3 Research Design 403.4 Measurement 41
3.4.1 Dependent Variables 413.4.2 Independent Variables 42
3.5 Method of Analysis 453.6 Results 45
3.6.1 Recall and Recognition over Time 463.6.2 Effects of Involvement 483.6.3 Effect of Sportive Success 493.6.4 Country-Specific Effects 493.6.5 Effects of Control Variables 49
3.7 Discussion 503.8 Limitations and Directions for Further Research 53
4 Chapter4InternationalSpinoffEffectsofLeagueSponsorship 554.1 Introduction 564.2 International Sponsorship Effects 574.3 Individual Drivers of Sponsor Equity 59
4.3.1 Brand Usage 594.3.2 Involvement with the Sponsored Property 604.3.3 Perceived Fit 60
4.4 Method 614.4.1 Data Collection 614.4.2 Measurements 62
4.5 Results 644.5.1 Sponsor Equity in Different Countries 644.5.2 Drivers of Sponsor Equity 654.5.3 Interaction Effects 664.5.4 Regression with Country-Specific Effects 67
4.6 Discussion 694.7 Limitations and Directions for Future Research 71
5 Chapter5BenchmarkingSponsorshipPerformance:theLevelofEfficiencyintheDutchSportsSponsoringMarket 73
5.1 Introduction 745.2 Previous Research 755.3 Determinants of Sponsorship Efficiency 77
5.3.1 Sponsorship Clutter 77
TABLEofConTEnTS

7
5.3.2 Sponsorship Duration 775.3.3 Sports Popularity 78
5.4 Research Design 785.4.1 Method First Stage: Data Envelopment Analysis 785.4.2 Input Variables for DEA 805.4.3 Output Variables for DEA 815.4.4 Method Second Stage: Tobit Model 84
5.5 Results 855.5.1 Efficiency Analysis 855.5.2 Alternative DEA models 885.5.3 Tobit results 89
5.6 Discussion 915.7 Limitations and Directions for Further Research 93
6 Chapter6Conclusions 956.1 Overview 966.2 Conclusions 98
6.2.1 Initial Generalizations on Sponsorship Effects 986.2.2 Dynamic Effects of Sponsoring 996.2.3 Global Sponsorship Effects 1016.2.4 Benchmarking Sponsorship Efficiency 102
6.3 Managerial Implications for Sponsors 1036.4 Implications for the Sponsee 1056.5 Limitations and Suggestions for Future Research 106
References 109
Samenvatting(SummaryinDutch) 115
Acknowledgements 121
TABLEofConTEnTS

8

9
Chapter 1
Introduction

10
CHAPTER 1
1.1 Introducing the Sponsorship Market
Over the last decades sponsorship has evolved from a merely philanthropic activity to a popular marketing vehicle and consequently budgets have been rising (Nufer & Bühler, 2010). In the current sponsorship market million-dollar contracts are the rule rather than the exception. The majority of sponsorship investments is in the area of sports, such that sponsorship and media rights are the “main engines” of growth and professionalism in the global sports market (PricewaterhouseCoopers, 2011, p.4). In particular PricewaterhouseCoopers (PwC) projects a worldwide increase in spending on sports sponsorship to $45.3 billion in 2015 (PricewaterhouseCoopers, 2011). Sponsorship managers recognize the commercial value of associating their business with a well-known and beloved property. They hope to achieve a multitude of objectives, including brand equity and customer relations goals, through sponsorship. Yet in the current difficult economic situation, marketing investments, including sponsorships, are under increased scrutiny such that “companies that are signing new or re-signing deals are showing reluctance to sign long-term contracts” (SportBusiness Group 2009, p. 5). Most sponsorship deals are traditionally signed in the western world but the instrument is gaining importance in other regions. PwC particularly recognizes the importance of sponsorship for the total sports market in the BRIC-countries and Asia Pacific region (PricewaterhouseCoopers, 2011). Furthermore, as major sports events are increasingly broadcasted all over the world, sponsorships with an international and even global character are becoming more common (O’Reilly, Lyberger, McCarthy, & Séguin, 2008).Sponsored properties are diverse. In this dissertation the focus is on sports sponsorship, as this contains the largest portion of sponsorships. Within sports, a sponsor can choose between different sports categories with differing fan bases, opportunities, and differing degrees of risk involved. Furthermore, within a certain sports category, sponsored properties include sport teams or clubs (such as Manchester United soccer team), individual athletes (for example tennis player Roger Federer), leagues (for example UEFA Champions League), sport accommodations (for example soccer stadium Allianz Arena) and events (such as the Olympics). Following the diversity in sponsored objects, sponsorship contracts have multiple characteristics, which vary for example with regard to the offered level of exclusivity, time horizon (long-term versus one shot), the quality and quantity of sponsorship exposure (i.e. billboards, clothing, name-mentioning), the possibility for hospitality arrangements and the amount of financial resources involved. With this multitude of options, applications and the increasing required budgets, sponsorship managers need to know what factors determine sponsorship success to substantiate their decisions and define their objectives properly. However, in practice, measurement of sponsorship effects is often restricted to exposure reports and many businesses fail to evaluate their sponsorships accordingly (Crompton, 2004). Moreover, PwC recognizes effect measurement of

11
IntroductIon
sponsorship as a major challenge for sport properties because the sponsorship market is increasingly competitive and sponsors have numerous possible properties to invest in (PricewaterhouseCoopers, 2011).Parallel to the growing importance in business practice, interest in sponsorship has increased in the academic world. The topic received greater attention resulting in multiple theoretical and empirical investigations. A review article of 2003 reported a number of 230 studies about sponsorship between 1985 and 2003 (Walliser, 2003) and since then many more studies have been published. While this previous research has definitely improved our understanding of sponsorship, certain key areas remain unexplored and the need for further (empirical) investigation is recognized. For example, it has been argued that “the area still suffers from lack of strong understanding of how sponsorships work in the mind of the consumer and how it might be made more effectively” (Cornwell, 2008). Therefore, the central topic of this thesis is sports sponsorship effectiveness. This research consists of several studies which provide insight in the possible outcomes of sports sponsorship and the different factors influencing the success of sports sponsorship.
1.2 Definition and Terminology
When sponsorship research was first conducted in the 1980s and early 1990s, scholars devoted most effort to the definition of sponsorship (Walliser, 2003). A general characteristic of sponsorship is that it contains an agreement between two parties: the sponsor and the sponsored property (or: the sponsee). We adopt the definition proposed by Meenaghan (1983, p. 9): “….sponsorship can be regarded as the provision of assistance either financial or in-kind to an activity by a commercial organization for the purpose of achieving commercial objectives”. An important implication is that sponsorship is directed at achieving commercial goals, so from the sponsor’s perspective a certain return from the sponsee is expected. This return sets sponsorship apart from donations, which have a purely philanthropic character. Signing a sponsorship contract does not automatically mean that the link between the sponsor and the sponsored object is set in consumers’ minds. Thus, complementary marketing activity is crucial in reaping the benefits of sponsorship. This premise leads to an explicit definition of sponsorship-linked marketing by Cornwell (1995, p. 15): “the orchestration and implementation of marketing activities for the purpose of building and communicating an association to a sponsorship”. The investment in marketing activities on top of the negotiated sponsorship agreement is often termed sponsorship leverage or activation.This research is concerned with sports sponsorship effectiveness and efficiency. Effectiveness generally refers to “the extent to which an activity fulfils its intended purpose or function” (Harvey, 2004). Thus, sponsorship effectiveness can be interpreted as the degree to which formulated sponsorship objectives are achieved. The different

12
CHAPTER 1
objectives and possible outcomes of sponsorship are further discussed in chapter 2 of this dissertation. Chapter 3 and 4 contain empirical investigations of sports sponsorship effectiveness.Effectiveness is usually determined without reference to costs involved. Yet, efficiency pertains to a level of performance where the lowest possible amount of inputs are used to create the greatest possible amount of outputs (Coelli, Rao, O’Donnell, & Battese, 2005). Sponsorship efficiency is the subject of chapter 5.
1.3 Differentiating Sponsorship
Although several authors suggested that sponsorship should be viewed as a strategic resource instead of a tactical instrument (Roy, 2005), sponsorship is generally considered in the light of marketing communications. Therefore, it seems worthwhile to briefly discuss what distinguishes sponsorship from other marketing communication instruments, particularly traditional advertising. Sponsorship and advertising overlap to a certain extent in that they can share the same objectives (for instance awareness and image goals) and target audience. The two instruments can be considered complementary elements in the marketing communication mix, both directed at achieving that same goal; to evoke target group responses. Indeed, advertising is often used to leverage a sponsorship and communicate the sponsorship connection (Cornwell, Weeks & Roy, 2005). Several authors (i.e. Quester & Thompson, 2001) acknowledge that impact of sponsorship is greatest when it is part of an integrated communication strategy and when it is leveraged properly. Although complementary, there are some important differences between advertising and sponsorship, which are relevant to consider when assessing sponsorship effectiveness.First, advertising and sponsorship differ with regard to message content and tone of voice (Meenaghan, 1991; Walliser, 2003). As Walliser (2003, p. 9) stated: “advertising messages are generally more direct, explicit and can be more easily controlled”. Generally sponsorship brings a higher degree of risk for the sponsoring organisation than traditional advertising. The explanation is that a second party (the sponsored property) is involved and the sponsor does not possess complete control over the actions of the sponsee (Speed & Thompson, 2000).Additionally, there is a difference in audience reaction between the two instruments. More specifically, in the case of sponsorship the activity in itself is expected to be appreciated, whereas the target audience may be more sceptical towards the practice of advertising (McDonald, 1991). However, with the increasing commercialization of sports, consumers tend to realize that sponsorship also has a commercial character, which creates a more critical attitude (Meenaghan & Shipley, 1999). Practitioners should realize that sport fans may be sensitive to commercial exploitation of sport properties, especially when commercial objectives seem to conflict with the best interest of the

13
IntroductIon
sport events and athletes (Zhang, Won, & Pastore, 2005). For example, sometimes events are scheduled to suit the best interest of sponsors rather than athletes and this practice might be questioned by the audience.A final characteristic of sponsorship that contributes to its distinctiveness is the reach and scope. Sponsors can achieve multiple objectives involving different target audiences at a time, so sponsorship goals are not limited to advertising goals like exposure and brand equity, but may for example also involve internal objectives (Meenaghan, 1983). Moreover, sponsorship has the potential to cross geographical borders and to reach audiences that are difficult to reach with traditional advertising (Parker, 1991). The potential of traditional advertising is decreasing as for example the popularity of print media is declining and television advertisements are increasingly skipped through zapping and internet viewing. Still, managers believe advertising around major sports events to be effective, as investments increase considerably in these periods (Gijsenberg, 2013).
1.4 Aim and Research Questions of the Doctoral Thesis
Previously, the issue of sponsorship effects received considerable attention from scholars and practitioners (Cornwell & Maignan, 1998; Walliser, 2003). Yet research on sponsorship remains less developed than traditional advertising research and particularly the issue of measuring sponsorship results is subject to substantive debate (Crimmins & Horn, 1996; Wakefield, Becker-Olsen, & Cornwell, 2007). We add to the current body of research by examining different aspects of sponsorship effectiveness and with a benchmark of sponsorship efficiency. As sponsorship involves two parties, the sponsor and the sponsee, effectiveness may be examined from both perspectives. This research mainly focuses on the sponsor, but also has implications for the sponsee, since higher sponsor effectiveness means higher sponsorship value, which is favorable for the sponsored property. The problem statement of this thesis is formulated as follows:
This thesis investigates the effectiveness and efficiency of sports sponsorship from the perspective of the sponsor and aims to reveal different factors influencing sports sponsorship’s success.
First, it seems reasonable to gain insight in the current state of research on sponsorship effects. Therefore, we start in chapter 2 with an overview of previous research in this area. We develop an integrated framework of sponsorship outcomes. In the framework, sponsorship processing is visualized and several important antecedents of sponsorship

14
CHAPTER 1
success are identified. As such, the model forms the conceptual foundation for the remainder of the thesis. The main research questions of chapter 2 are defined as:
1. How does sponsorship create value for the sponsor?2. What factors influence sponsorship outcomes?
Then, in response to the notion that insights in the long term effects of sponsorship are limited (Carrillat, Harris, & Lafferty, 2010; Pope, Voges, & Brown, 2009), we present an empirical investigation of consumer cognitive processing of sponsorship over time. This study adds a dynamic, long-term perspective to previous sponsorship research through the investigation of sponsorship recall in a multiple year, international context. The research questions of chapter 3 are the following:
3. How does sponsorship awareness develop over time?4. Does sportive success influence sponsorship awareness?5. How do different involvement types influence sponsorship awareness? 6. What other factors influence sponsorship awareness?
In chapter 4, we proceed with a global study on consumer affective and conative responses to sponsorship. This study adds a cross-national dimension by investigating sponsor equity and its’ antecedents in nine different countries. Sponsor equity refers to a favorable change in brand equity of the sponsor resulting from the sponsorship. With this research we address the concern that extant research of sponsorship effects is limited in terms of geographical scope (Séguin, Lyberger, O’Reilly, & McCarthy, 2005). In particular we answer the following research questions in chapter 4:
7. Does league sponsorship create sponsor equity in multiple countries following international exposure?
8. Does this sponsor equity differ between participating and non-participating countries?
9. Are the antecedents of sponsor equity different in participating and non-participating countries?
Our final study aims to examine the relative efficiency of sponsorships in The Netherlands. With the application of Data Envelopment Analysis to sponsorship projects we evaluate and benchmark different sponsorships in terms of the budget-to-effect ratio. Moreover, we identify several sponsorship characteristics that influence sponsorship (in)efficiency. Specifically, we formulate the next research questions for chapter 5:
10. What is the level of efficiency in the Dutch sponsoring market?11. Which sponsorship characteristics affect sponsorship efficiency?

15
IntroductIon
Table 1.1 provides an overview of the upcoming chapters in this thesis. In summary, we add to previous research by providing a conceptual framework of sponsorship effects (chapter 2) and with several empirical investigations of specific sponsorship outcomes. In the empirical chapters we add a dynamic, longitudinal perspective (chapter 3), a cross-national dimension (chapter 4) and a benchmarking study (chapter 5) to the existing body of sponsorship research. Moreover, we work with representative samples and real instead of fictional sponsorship projects, whereas previous research often applied artificial settings to investigate sponsorship effects (Wakefield et al., 2007). The relationship between the different empirical chapters is displayed graphically in Figure 1.1.From a managerial perspective, this thesis helps sponsorship managers 1) by identifying critical success factors of sponsorship, 2) with recommendations on sponsorship duration, 3) with insights on international effects and 4) by suggesting a benchmarking method for sponsorship evaluation.
figure1.1The Relation between the Empirical Studies
���������
������������������
������������ ��������� �������� �
�������� ������������
�������� ��������
��������������������������
������������������
�������� ����������������
��� ������
��� ������
��� ������
��� ������

16
CHAPTER 1
Table1.1
Des
crip
tion
of D
iffer
ent T
hesi
s Ch
apte
rs
Rese
arch
aim
Dep
ende
nt v
aria
ble
Inde
pend
ent v
aria
bles
Mai
n sc
ienti
fic c
ontr
ibuti
on
Met
hodo
logy
Chap
ter
2Ch
apte
r 3
Chap
ter
4Ch
apter5
Lite
ratu
re s
urve
y of
sp
onso
rshi
p eff
ects
Up-
to-d
ate
theo
retic
al
over
view
of s
pons
orsh
ip
outc
omes
and
its
ante
cede
nts
Lite
ratu
re s
urve
y
Cogn
itive
con
sum
er p
roce
ssin
g of
spo
nsor
ship
Spon
sors
hip
awar
enes
s (r
ecal
l/re
cogn
ition
)
Spon
sors
hip
dura
tion,
in
volv
emen
t, s
porti
ve s
ucce
ss,
perc
eive
d fit
, bra
nd u
sage
, de
mog
raph
ics,
leve
rage
The
effec
t of s
pons
orsh
ip
dura
tion,
diff
eren
t inv
olve
men
t le
vels
and
spo
rtive
suc
cess
on
spon
sors
hip
awar
enes
s.
Logi
t mod
el
Affe
ctive
and
con
ative
co
nsum
er p
roce
ssin
g of
sp
onso
rshi
p
Spon
sor
equi
ty (a
ffecti
ve
and
cona
tive
resp
onse
to
spon
sors
hip)
Coun
try,
bra
nd u
sage
, pe
rcei
ved
fit, p
erso
nal l
ikin
g,
perc
eive
d st
atus
of t
he o
bjec
t,
dem
ogra
phic
s
Inve
stiga
tion
of c
onsu
mer
re
spon
se to
spo
nsor
ship
in a
gl
obal
con
text
Mul
tiple
regr
essi
on
Benc
hmar
king
spo
nsor
ship
pe
rfor
man
ce
Step
1:
spon
sors
hip
proc
essi
ng
(out
put)
Step
2: s
pons
orsh
ip e
ffici
ency
Step
1:
spon
sors
hip
budg
et
(inpu
t)St
ep 2
: clu
tter
, spo
nsor
ship
du
ratio
n, s
port
s po
pula
rity
, co
ntro
l var
iabl
es
Inve
stiga
ting
effec
t-to
-bud
get
ratio
and
iden
tifica
tion
of
spon
sors
hip
effici
ency
dri
vers
Step
1: D
ata
Enve
lopm
ent
Ana
lysi
sSt
ep 2
: Tob
it m
odel

17
Chapter 2
Literature Review1
1 This chapter is based on Walraven, M., Koning, R.H., and Van Bottenburg, M. (2012), The effects of sports sponsorship: a review and research agenda, The Marketing Review, 12(1), 17-38.

18
CHAPTER 2
2.1 Introduction
In the last decades sponsorship evolved from a merely philanthropic activity to a popular marketing vehicle (Cornwell, 2008). In line with the dramatic increase in sponsorship investments, interest in demonstrating the returns of sponsorship has been growing both in business practice and in academics. Additionally, there is an increased concern for making marketing expenditures more accountable (Verhoef & Leeflang, 2009), which makes it crucial for managers to be able to justify their marketing investments, including sponsorships. Therefore, exploration of the determinants of sponsorship outcomes is important, but a generally accepted theoretical framework for this is not readily available. In this chapter, we provide an overview of sponsorship effects research2, in a way that contributes further to our understanding of sponsorship outcomes. Based on this, we develop an integrated framework of sponsorship outcomes. The focus of this chapter is on research of sponsorship effects including all different target groups of sponsorship. In this respect the review is different from existing review articles on sponsorship, which focused on all kinds of sponsorship research (i.e. Cornwell & Maignan, 1998; Walliser, 2003), or solely on customer-based brand equity effects of sponsorship (Gwinner, 1997; Poon & Prendergast, 2006). Furthermore, we discuss the outcomes of sponsorship and the different factors influencing these outcomes, rather than the different consumer processing mechanisms, which already have been comprehensively described by Cornwell et al. (2005). Moreover, several years have passed since most previous review papers (e.g. Cornwell et al., 2005; Walliser, 2003) have been published, while the number of publications on sponsorship grew, so we add recent insights.The remainder of this chapter is structured as follows. First we present our conceptual framework. Then we discuss the different components of our framework; the factors determining sponsorship processing, sponsorship processing itself and resulting sponsorship outcomes.
2 The aim of this literature review is to provide a conceptual framework of sports sponsorship effects. Still the previous research discussed is not restricted to sports sponsorship only and involves some studies in other contexts (for the general definition of sponsorship we refer to paragraph 1.2 of this thesis). Yet, the majority of existing sponsorship research considers sports properties so most of the research discussed in this chapter concerns sports sponsorships.

19
Literature review
2.2 Conceptual Framework
Accountability of marketing activities is a crucial issue in literature and in business practice (Rust, Lemon, & Zeithaml, 2004; Verhoef & Leeflang, 2009). Therefore, it is valuable to develop an understanding of the outcomes of sponsorship and factors influencing these outcomes. Figure 2.1 displays our integrated model framework of sponsorship effects, which is inspired on the product placement effects framework of Balasubramanian, Karrh and Patwardhan (2006). Our scheme is different from the previously developed theoretical model of “consumer-focused sponsorship-linked marketing communications”, by Cornwell et al. (2005, p. 22) in the sense that sponsorship outcomes are defined broader than consumer outcomes and because we focus on the variables influencing these outcomes rather than the underlying processing mechanisms. The model consists of four components; sponsorship market conditions, sponsorship management factors, processing of the sponsorship and sponsorship outcomes. Sponsorship may involve different target audiences and objectives and, thus, create value for the sponsor in different ways. Therefore, we grouped sponsorship outcomes accordingly in our framework. From previous work of Cornwell (1995) and Meenaghan (2005), we derived four kinds of sponsorship outcomes. The first outcomes involve the creation of customer-based brand equity, strengthening relations with employees and building on relations with other stakeholders (customers and important decision makers such as politicians, suppliers, media etc.). For publicly listed firms these sponsorship outcomes are indirectly related to the end objective of shareholder value. For example, when a sponsorship has a positive influence on a sponsor’s brand equity, this may positively impact market share of the brand, leading to improved financial performance and ultimately firm value. Yet, shareholder value can also be a direct outcome of sponsorship because the announcement of a corporate sponsorship may instantly evoke a reaction from investors, as will be discussed in section 2.7.4.In the remainder of this chapter, we discuss the elements from our framework and review relevant previous literature. The aim of the next discussion of previous sponsorship effects research is not to be comprehensive, i.e. list all publications, but rather to discuss typical studies in the field and draw general conclusions. For variable relationships that have been infrequently investigated in a sponsorship context, we draw on research in allied fields such as advertising and relationship marketing literature.

20
CHAPTER 2
figu
re2.1In
tegr
ated
Fra
mew
ork
of S
pons
orsh
ip E
ffect
s
Spon
sor ou
tcom
es
Custom
er-‐based brand equity:
• Brand aw
areness (cogni&o
n)
• Brand image (cogni&o
n)
• Brand aH
tude/preference (affe
ct)
• Brand aK
achm
ent (affect)
• (In
tent to
) purchase (con
a&on
)
Staff
rela&o
ns:
• Co
mpany pride (affe
ct)
• Co
rporate iden&fi
ca&o
n (affe
ct)
• Loyalty (con
a&on
) • AHtude and job applica&on
inten&
on (p
oten&al employees)
(affe
ct/con
a&on
)
Rela&o
ns with
other stakeho
lders:
• Trust/ com
mitm
ent (affect)
• Gra&tude/good
will (affe
ct)
• Reciprocal behavior (con
a&on
) • Loyalty (con
a&on
)
Shareholder value
Spon
sorship market
cond
i2on
s • Presence and im
age of
co-‐spo
nsors
• Ambush ac&vity
• Performance of the
spon
sored ob
ject
Spon
sorship
man
agem
ent factors
• Expo
sure
• Leverage & Integra&on
• Dura&on
Individu
al differen
ces
• Involvem
ent
• Judgment o
f fit
• AHtude to
wards
spon
sorship
• Perceived sincerity of
the spon
sor
• Familiarity with
spon
soring brand
• Dem
ographics
Spon
sorship processing
• Uncon
scious, m
ere
expo
sure (implicit mem
ory)
• Spon
sorship aw
areness
(cogni&o
n)
• AHtude to
wards th
e spon
sorship (affe
ct)

21
Literature review
2.3 Sponsorship Market Conditions
As Fahy, Farrelly and Quester (2004) argue, the creation of a competitive advantage in the sponsorship market is a necessary step for the success of a sponsorship. The conditions in the sponsorship market are given when a sponsorship manager makes the decision to engage in a particular sponsorship. As these factors may affect sponsorship outcomes significantly, it is crucial for sponsorship managers to investigate sponsorship market factors before entering an agreement. An important issue is the presence of other sponsors, which may result in clutter, making it more difficult for the target audience to note the sponsor and memorize the sponsorship linkage (Cornwell, Relyea, Irwin, & Maignan, 2000). In chapter 5 of this thesis we further investigate the effect of clutter on sponsorship efficiency. Moreover, image transfer may take place between sponsors of the same object, as has been demonstrated by Carrillat et al. (2010). This transfer may turn out favorably or unfavorably. Thus, sponsor managers should consider the associations with co-sponsors before entering an agreement where other sponsors are already involved.Ambush activity is an important risk for a sponsor. Ambushers are nonofficial sponsors trying to reap the benefits of an event by creating a perceived association between their organization and the sponsored object (e.g. Pham & Johar, 2001). These efforts might undermine sponsorship value significantly as consumers are often confused when trying to recall or recognize official sponsors (Séguin et al., 2005). Lastly, the (expected) sportive performance of the sponsored object can be an important factor influencing sponsorship outcomes. In this respect Pope et al. (2009) found that positive information regarding team performance positively affects consumers’ perception of sponsoring brand quality, whereas negative performance information influences brand quality perceptions in a negative way. With regard to shareholder value, several studies indicate that the expected sportive performance of the sponsored object is an important determinant of shareholders’ reactions to a sponsorship announcement (e.g. Clark, Cornwell, & Pruitt, 2009). In chapter 3 of this thesis we include a nation’s sportive performance as a predictor of sponsorship awareness.
2.4 Sponsorship Management Factors
Next to the given conditions in the sponsorship market, several sponsorship success factors can be controlled by sponsorship managers when entering and managing a sponsorship agreement. Sponsored objects in themselves are diverse, and, therefore, may involve different degrees and kinds of risk (O’Reilly & Foster, 2008). Sponsors should take this in consideration when entering an agreement and anticipate on potential crisis situations. Specifically, sponsoring individuals involves a high degree of risk (Walliser, 2003). Furthermore, certain sports categories involve inherent risks, such as mountaineering

22
CHAPTER 2
and mortality risk, cycling and doping and soccer and hooliganism, which should be taken into account by sponsors (O’Reilly & Foster, 2008). After selecting a property, the sponsorship contract should be designed and negotiated. Contracts vary with regard to the offered level of exclusivity, time horizon (long-term versus one shot), the level and type of sponsorship exposure (i.e. billboards, clothing, name-mentioning), the possibility for hospitality arrangements and the amount of financial investments. Sponsorship managers need to consider these factors in the light of their sponsorship objectives. Then, after the agreement has been signed, sponsorship managers should decide how to exploit the linkage. More specifically, sponsorship leverage and the integration with other marketing communication instruments, should be designed. In all, we identified three important determinants of sponsorship outcomes, for which sponsorship managers are directly responsible. These include the level of exposure, the degree of leverage and integration with marketing policy and the duration of the sponsorship.
2.4.1 ExposureThe level of exposure to the sponsor-sponsee linkage is an important factor influencing sponsorship awareness (Johar, Pham, & Wakefield, 2006; Wakefield et al., 2007). The more an individual is exposed to the sponsorship link, the more likely the link will be encoded in memory (Johar et al., 2006). Furthermore, in line with the mere-exposure hypothesis, repeated exposure to the sponsorship message evokes favorable affective responses (Herrmann, Walliser, & Kacha, 2011; Olson & Tjømøe, 2009). Not only the quantity of sponsorship exposure matters, also the quality of sponsorship exposure affects sponsorship processing. In this regard, Breuer and Rumpf (2012) find that some placements of sponsorship signage evoke more attention than others, particularly signage close to the sports action stands out favourably. The authors also report that on-screen size and duration of sponsorship signage are important factors in drawing the audience attention (Breuer & Rumpf, 2012).
2.4.2 SponsorshipLeverageandIntegrationA main argument for an Integrated Marketing Communication strategy is that a message is more likely to be recalled when it is received from a variety of media (Stammerjohan, Wood, Chang, & Thorson, 2005). For sponsorship, this implies that it is more effective when integrated and combined with other marketing(communication) activities. Sponsorship may serve as a focal element in the overall IMC strategy, but may also serve as an supportive instrument in an existing strategy. A sponsor should reserve substantial additional resources for leverage to be able to fully profit from signing a sponsorship agreement (Fahy et al., 2004). Sponsors who invest in proper leveraging (additional promotion and communication on top of exposures that

23
Literature review
are part of the sponsorship agreement) their sponsorship exert additional exposure and thereby higher levels of sponsorship awareness (Quester & Thompson, 2001). With regard to higher-level processing of sponsorship, Weeks, Cornwell and Drennan (2008) report that sponsorships with online leverage evoke more favorable responses than sponsorship that are not activated.Next to creating exposure for the sponsorship linkage, it is important that sponsorship communications are focused. In this respect, Speed and Thompson (2000) find a positive influence of perceived ubiquity of the sponsor (that is the perception of consumers of the degree of focus in sponsorship activity) on consumer’s affective and conative reactions to the sponsorship. It seems that sponsors who are involved in many different sponsorships tend to evoke less favorable responses because they are perceived as less committed than sponsors with a clear focus.
2.4.3 SponsorshipDurationGenerally sponsorship managers tend to believe that long term sponsorships create more favourable target group responses than short term sponsorships (Cornwell, Roy, & Steinard II, 2001) because consumers are more likely to remember the sponsorship and because they perceived the sponsor as more committed. Pope et al. (2009) report that sponsorship duration enhances the perceptions of product brand quality in the long run, depending on the performance of the sponsored entity. Moreover, Pitts and Slattery (2004) find that sponsorship duration positively influences cognitive processing of the sponsorship. The influence of sponsorship duration on sponsorship awareness is further explored in chapter 3 of this thesis.
2.5 Individual Difference Factors
The extent to which favorable target group responses are achieved, depends also on several individual characteristics and perceptions of the target group. These factors include individual involvement, attitude towards sponsorship, perceived sincerity of the sponsor, familiarity with the sponsoring brand, perceived fit and demographic characteristics. A sponsorship manager should invest in properly researching these factors.
2.5.1 InvolvementShank and Beasley (1998, p. 436) describe the concept of sports involvement as “the perceived interest in and personal importance of sports to an individual”. Not only sport category involvement is an important predictor of responses to sponsorship, the attitude toward the particular sponsored object within the sports category also affects sponsorship processing (Olson, 2010). These concepts are different in that high involvement with the sports category does not automatically mean high involvement with the sponsored

24
CHAPTER 2
object. For example, someone may be a fan of soccer but can be more involved with a specific soccer team or player than with another.In a sponsorship context, an interesting aspect of involvement is the relation with exposure to and attention for the sponsorship. Shank and Beasley (1998) report that an individual’s level of sports involvement is related to the number of hours viewing sports on television, reading about sports, attending sports events and practicing sports. This implies that consumers, who are involved in a sponsored sport, are more likely to be confronted to the sponsorship than uninvolved consumers, so they are more likely to recall the sponsor-sponsee link. Moreover, high involvement leads to stronger cognitive processing of sponsorships since highly involved consumers are more willing to engage in active processing of information regarding the sport and, thus, more likely to pay attention to sponsorships (Wakefield et al., 2007). Furthermore, highly involved consumers develop more favourable attitudes towards the sponsorship and the sponsor than less involved consumers (e.g. Gwinner & Bennett, 2008). The effect of individual involvement on consumer response to sponsorship is further explored in chapter 3 and 4 of this thesis.
2.5.2 PerceivedSponsorshipfitWhen a sponsor and a sponsored object are perceived as a fitting combination by the target audience, the sponsorship is expected to evoke more favourable responses. Consumers tend to evoke perceived relatedness as an heuristic to recall the sponsor-sponsee linkage, when it cannot be retrieved directly from memory (Pham & Johar, 2001; Wakefield & Bennett, 2010), so when the sponsor and sponsored object are perceived as fitting together, the probability of sponsorship awareness is higher. Furthermore, several scholars find that perceived fit is an important factor determining affective and conative responses to sponsorship (e.g. Gwinner & Eaton, 1999; Simmons & Becker-Olsen, 2006). Moreover, fit between the sponsor and sponsee favourably influences shareholders’ reactions to sponsorship (Clark et al., 2009). The effect of perceived fit on consumer’s response to sponsorship is incorporated in chapter 3 and 4 of this thesis.
2.5.3 AttitudetowardSponsorshipIn advertising research, it has been found that consumers’ general scepticism towards the practice of advertising negatively influences the attitude towards an ad (Balasubramanian et al., 2006). Likewise, individual attitude towards the practice of sponsorship can affect one’s reactions to the sponsorship. In this respect, Zhang et al. (2005) find that individual attitude to commercialization in sports impacts the intention to purchase the sponsor’s products. Furthermore, Meenaghan and Shipley (1999) propose that in highly commercialized sponsorship contexts, sponsorship can be perceived as similar to advertising and, therefore, creates less favourable affective responses among the sceptical target audience.

25
Literature review
2.5.4 PerceivedSincerityoftheSponsorSeveral researchers report that individual beliefs about the sponsor’s motives for engaging in sponsorship positively influence one’s attitude towards the sponsorship and resulting affective and conative responses (d’Astous & Bitz, 1995; Olson, 2010). In particular, it has been suggested that sponsors who are perceived to be sincere in their sponsorship activity and committed to the sponsored object, evoke more favourable responses (Speed & Thompson, 2000).
2.5.5 familiaritywiththeSponsoringBrandFamiliarity with the sponsoring brand is an important determinant of consumers’ cognitive processing of sponsorship. Consumers are better able to identify sponsoring brands that are familiar to them (Breuer & Rumpf, 2012; Pestana Barros & Silvestre, 2006) and prominent brands are more likely to be recalled as a sponsor than non-prominent brands (Pham & Johar, 2001). Furthermore, several studies point out the importance of pre-sponsorship attitude towards the sponsor in affective processing of the sponsorship. Specifically, consumers with favorable associations and/or experiences with the sponsoring organization are more likely to develop a favorable attitude towards the sponsorship and, as a result, to evoke favorable responses to the sponsor (Chanavat & Martinent, 2009). Then, Carrillat et al. (2005) suggest that for familiar brands associations are more structured in memory and therefore relatively stable. Thus, the effect of sponsorship on consumers’ attitudes and purchase intentions is stronger for a low as opposed to a high familiarity brand. Likewise, the findings of Dean (2002) indicate that the degree of image transfer depends on the strength of associations with the sponsoring brand, in that pre-existing mild or neutral opinions about the sponsor are more likely to change than strong opinions. Thus, it may be more difficult for an unknown brand than for a well-known brand to make consumers aware of their sponsorships. However, for unknown brands image transfer may be more likely, because their brand image is less structured and more likely to change (or develop) as a result of sponsorship. For sponsors with a strong favorable brand image, sponsorship may serve as a confirmation of existing favorable consumer opinions. Sponsorship may be considered a less suitable instrument when the goal is to change strongly negative brand perceptions, as these opinions are less likely to change.
2.5.6 DemographicCharacteristicsSeveral demographic characteristics are found to affect cognitive processing of sponsorship. Specifically, gender and education level have been found to significantly affect sponsorship awareness, in that males typically show a higher ability to recall sponsors (Kinney, McDaniel, & DeGaris, 2008; Stipp & Schiavone, 1996) and higher educated persons demonstrate higher levels of correct sponsor identification than

26
CHAPTER 2
people with a low education level (Dekhil, 2010; Kinney et al., 2008). Moreover, age has a negative effect on sponsorship awareness, so younger people are more likely to reproduce the sponsor-sponsee link than older persons (Kinney et al., 2008).
2.6 Sponsorship Processing
Our conceptual framework posits that sponsorship market, sponsorship management and individual variables determine the degree to which a sponsorship is processed. In this regard, the framework involves a processing continuum with on the one side unconscious processing of the sponsorship (sponsorship implicit memory effects) and on the other high-level processing of the sponsorship. This is similar to processing of product placements, as described by Balasubramanian et al. (2006).Previous research focused mainly on conscious and explicit processing of sponsorship information, so implicit memory effects are not often investigated. Yet some authors found that it is possible that sponsorship also works below the conscious level (Harvey, Gray, & Despain, 2006). More specifically, affect formation and product choice might occur in the absence of conscious processing of the sponsorship, so solely due to exposure to the brand name, as demonstrated by Olson and Thjømøe (2003) and Herrmann et al. (2011). With regard to cognitive processing of sponsorship, sponsorship awareness can be regarded as important in assessing sponsorship effectiveness (Johar et al., 2006). The intuition is that the target group needs to be at least aware of the sponsorship before their attitudinal and behavioral intentions toward the sponsor will possibly be enhanced. This premise has led several scholars to investigate which factors influence sponsorship awareness, Table 2.1 provides an overview of this research. In chapter 3 of this thesis, we elaborate further on sponsorship awareness. Previous findings on variables influencing sponsorship cognitive processing are replicated and we extend previous research by identifying specific time patterns of sponsorship awareness building and through the investigation of the effects of sportive performance and different involvement levels on sponsorship awareness.With regard to higher-level sponsorship effects, we propose that individual attitude towards the sponsorship determines affective and conative responses towards the sponsor. Table 2.2 summarizes previous research on affective and conative sponsorship outcomes. From the studies listed, Simmons and Becker-Olsen (2006) and Olson (2010) investigated sponsorship affective and conative outcomes with attitude towards the sponsorship as a mediator, the other studies investigated direct relations. Chapter 4 of this thesis further investigates the favorable change in consumer’s affective and conative responses towards the sponsor resulting from sponsorship. In particular, we investigate this sponsor equity in an international context, examining differences between countries.

27
Literature review
Table2.1Cognitive Processing of Sponsorship
Variableinfluencingsponsorshipawareness Studies:author(s),year
Presence of other sponsors (clutter) (-)
Cornwell, Relyea, Irwin, and Maignan (2000); Breuer and Rumpf (2012)
Ambush activity (-) Quester (1997); Séguin, Lyberger, O’Reilly and McCarthy (2005)
Exposure (+) Grohs, Wagner and Vsetecka (2004); Johar, Pham, and Wakefield (2006); Wakefield, Becker-Olsen, and Cornwell (2007); Breuer and Rumpf (2012)
Leverage (+) and Integration (+) Quester and Thompson (2001); Wakefield, Becker-Olsen, and Cornwell (2007) Stammerjohan, Wood, Chang, and Thorson (2005): advertising context
Duration (+) Pitts and Slattery (2004); Simmons and Becker-Olsen (2006)
Involvement (+) Grohs, Wagner and Vsetecka (2004); Ko, Kim, Claussen, and Kim (2008); Kim and Kim (2009)
Fit (+) Pham and Johar (2001); Koo, Quarterman, and Flynn (2006); Wakefield and Bennett (2010)
Familiarity with the sponsoring brand (+)
Johar and Pham (1999); Pham and Johar (2001): brand prominencePestana Barros and Silvestre (2006): consumer’s knowledge of the sponsor
Gender (male > female) Kinney, McDaniel, and DeGaris (2008); Stipp and Schiavone (1996)
Education level (+) Kinney, McDaniel, and DeGaris (2008); Dekhil (2010)
Age (-) Kinney, McDaniel and DeGaris (2008)

28
CHAPTER 2
Table2.2Affective and Conative Processing of Sponsorship
Variablesinfluencingsponsorshipaffectiveandconativeprocessing Studies:author(s),year
Leverage (+) Weeks, Cornwell, and Drennan (2008)
Perceived ubiquity of the sponsor, degree of focus in sponsorship activity (+)
Speed and Thompson (2000)
Perceived sincerity of the sponsor (+) Speed and Thompson (2000); Dees, Bennett, and Villegas (2008); Olson (2010)
Involvement (+) Gwinner and Bennett (2008); Ko, Kim, Claussen, and Kim (2008); Olson (2010): involvement with sports categorySpeed and Thompson (2000); Levin, Beasley, and Gilson (2008); Olson (2010): involvement with sponsored object
Fit (+) Speed and Thompson (2000); Simmons and Becker-Olsen (2006); Gwinner and Bennett (2008); Dees, Bennett, and Ferreira (2010)
Attitude toward sponsorship (+) Roy and Graeff (2003); Zhang, Won, and Pastore (2005): attitude towards commercialization in sports
Pre-sponsorship attitude towards the sponsor (+)
Speed and Thompson (2000); Chanavat and Martinent (2009); Olson (2010)

29
Literature review
2.7 Sponsorship Outcomes
2.7.1 Customer-basedBrandEquityThe creation of brand equity is the main objective for most sponsorships (Crompton, 2004). Customer-based brand equity is defined as “the differential effect of brand knowledge on customer response to the marketing of a brand” (Keller, 1993, p. 8). Cornwell et al. (2005) distinguish in this respect between three levels of sponsorship brand equity outcomes: cognitive (awareness, image), affective (liking, preference) and behavioral responses (purchase intent, purchase commitment and behavior).
Cognitive outcomes of sponsorshipWith regard to cognitive processing of sponsorship, several authors find a positive effect of sponsorship on brand awareness (Bennett, 1999; Nicholls, Roslow, & Dublish, 1999). Brand awareness effects are naturally more likely to occur when sponsorship awareness is high, so exposure and other factors influencing sponsorship awareness are important to consider for managers aiming to build brand awareness.Brand image is defined as “perceptions about a brand as reflected by the brand associations held in memory” (Keller, 1993, p. 3). As with celebrity endorsement, when a sponsor and a sponsored object are linked in consumers’ memory, either consciously or unconsciously, the associations with the sponsee are expected to be transferred to the sponsor (Gwinner & Eaton, 1999), either in the form of specific brand associations (cognitive outcome) and/or in a favorable overall evaluation, thus a positive change in attitude towards the sponsor (attitudinal outcome). Despite the importance of image enhancement as a sponsorship objective, academic findings are mixed (Walliser, 2003). Explanations for this include the large amount of moderating factors and the variety in research and analysis methods of previous studies. In all, scholars seem to agree on the potential enhancement of brand image as a result of sponsorship but there are several factors present that may enhance and/or hinder the image transfer process, which have been discussed in the previous paragraphs.
Affective and conative outcomes of sponsorshipAttitude toward the sponsor involves a general evaluation from the consumers’ part: “a consumer’s overall evaluation of an organization sponsoring the event” (Keller, 1993, p. 4). Naturally, this evaluation is based on an individual’s specific associations with the brand, so related to brand image. Several variables are identified as important factors in consumers’ higher level processing of sponsorship, see Table 2.2. Sponsorship enables sponsoring firms to demonstrate their target groups that they share their interests and, therefore, stimulate identification with the brand and brand loyalty (Cornwell & Maignan, 1998). In this regard, Chanavat and Martinent (2009) report that sponsorship can contribute to consumer’s attachment to the sponsor’s brand.

30
CHAPTER 2
Additionally, Levin, Beasley and Gamble (2004) show that NASCAR fans exhibit greater levels of attitudinal brand loyalty towards sponsoring brands than non-fans. Factors influencing this process are similar to the factors determining sponsorship effects on brand attitude.With regard to conative outcomes of sponsorship, the relation between sponsorship and consumer purchase intentions has been investigated frequently. Purchase intentions may be viewed as the link between attitude and behavior (Dees, Bennett, & Villegas, 2008). Various scholars report a significant relation between consumer’s attitude towards a sponsor and their intentions to purchase the sponsor’s product (Gwinner & Bennett, 2008; Speed & Thompson, 2000), so factors influencing attitude towards the sponsor also affect consumers’ purchase intent. Furthermore, the studies by Pope and Voges (2000) and Pestana Barros and Silvestre (2006) support a direct relation between sponsorship awareness and purchase intentions. In summary, sponsorship can affect consumers’ affective (brand attitude, preference, attachment and loyalty) and conative (purchase intentions) response to the sponsor’s brand when consumers become aware of the sponsorship and hold a favorable attitude towards the sponsorship (higher level processing). Factors positively influencing this process have been listed in Table 2.2. The relation between sponsorship and actual conative outcomes, meaning purchase behavior and/or sales levels, has not yet been investigated often.
2.7.2 StrengtheningRelationswithEmployeesInternal marketing and internal branding are considered important for an organization’s success (Grönroos, 1981; Mitchell, 2002). The premise is that committed and satisfied employees are more motivated to achieve corporate objectives than less committed employees (Grönroos, 1981). Furthermore, employees have an important role in creating value for a customer, especially in service organizations (Bansal, Mendelson, & Sharma, 2001) and they have a significant influence on how the brand is perceived by different stakeholders (Punjaisri & Wilson, 2011). Internal branding is aimed at “ensuring that the brand promise is transformed by employees into reality” (Punjaisri & Wilson, 2011, p. 1523). Internal branding affects employees’ brand identification, commitment and loyalty, and this relationship is moderated by several individual variables (age, education and length of service) and the level of job satisfaction (Punjaisri & Wilson, 2011). Likewise, sponsorships, when used as an internal branding vehicle, have the potential to contribute to employees’ identification and commitment with the corporate brand, their level of company pride and ultimately firm loyalty (Gardner & Shuman, 1988; Rosenberg & Woods, 1995). As Farrelly and Greyser (2012) describe, sponsorship is in practice frequently used as an instrument for stimulating corporate identification and engagement to business goals among employees. Hickman Lawrence and Ward (2005) researched the relation between
31
Literature review
sports property affinity and employee perceptions and behaviors among a large sample of employees of a NASCAR sponsor, and find a positive relation.Additionally, sponsorships may assist in staff recruitment by positively influencing the level of corporate awareness and favorable associations among potential employees (Meenaghan, 1983), provided that potential employees are exposed to and aware of the sponsorship. We would expect several moderating variables (i.e. age, education, length of contract and job satisfaction) found by Punjaisri and Wilson (2011), as well as the factors influencing consumers’ attitude towards the sponsor (such as perceived fit, attitude towards sponsorship and involvement), to influence employees perception of and reaction to the sponsorship. However, the antecedents of internal sponsorship outcomes have hardly been investigated up to this point.
2.7.3 BuildingRelationshipswithCustomersandotherStakeholdersThe belief that building and sustaining relationships with customers is in the end more valuable than short-term acquisition, is accepted widely (Rust, Zeithaml, & Lemon, 2000). Building on this premise, relationship marketing with customers (and also building relations with other stakeholders), in particular through hospitality arrangements in a business-to-business context, has become an important sponsorship application (Clark, Lachowetz, Irwin, & Schimmel, 2003). Palmatier, Burke Jarvis, Bechkoff and Kardes (2009) demonstrate that investments in relationship marketing enhance both customer trust and commitment, which in turn stimulate purchase intentions and market performance of the firm. They authors also find that the relationship is mediated by feelings of gratitude with customers and their reciprocal behaviors. Gratitude is expected to be equally important in a sponsorship context, often incorporated in the term goodwill (Meenaghan, 2001). The value of sponsorship in relationship marketing can take several forms. First, as in the study of Palmatier et al. (2009), stakeholders invited for sponsorship related hospitality programs might develop feelings of gratitude towards the sponsor, as a result of the invitation, and consequently engage in reciprocal behaviors. Secondly, fans of the sponsored property may value the sponsor’s support in itself and generate feelings of gratitude towards the sponsor (Meenaghan, 2001). We expect that a positive attitude towards the sponsorship is an important mediating condition, so factors that have been found influencing consumer’s attitude towards the sponsorship, are also important determinants of stakeholders’ reaction to the sponsorship.
2.7.4 ShareholderValueSeveral researchers address the issue of measuring sponsorship returns by investigating the direct effect of sponsorship announcements on stock prices (e.g. Clark et al., 2009; Reiser, Breuer, & Wicker, 2012). The underlying assumption is that stock prices immediately

32
CHAPTER 2
reflect investors’ reactions to newly available information in the marketplace. If investors view sponsorships as fruitful investments, stock prices should rise when a company announces to invest in sponsorship. Applying the event study analysis technique, several authors conclude that sponsorship announcement are positively received by investors (e.g. Miyazaki & Morgan, 2001; Pruitt, Cornwell, & Clark, 2004) whereas other scholars report contrasting results (e.g. Farrell & Frame, 1997). Thus, it seems that the impact of sponsorships on shareholder wealth differs for sponsoring firms and projects. Previous studies point to several factors that determine the change in stock returns as a result of sponsorship announcement. Regarding sports sponsorships some authors report that the expected performance (i.e. winning) of the sponsored entity (team or individual), is positively related to the stock price increase as a result of the sponsorship announcement (Clark, Cornwell, & Pruitt, 2002; Pruitt et al., 2004). Furthermore, the level of perceived fit between the sponsor and the sponsored property, as well as the length of the signed sponsorship agreement seem to be important factors determining investors’ reactions (Clark et al., 2009; Cornwell, Pruitt, & Clark, 2005). Moreover, Clark et al. (2002) conclude that sponsorship programs of high technology firms receive more favorable investor reactions than programs of traditional firms. They hypothesize that this effect occurs because it is difficult for investors to assess the (financial) conditions within high technology firms, meaning riskier business, so that sponsorship serves as a mean to decrease the investment insecurity. This finding has been replicated by Cornwell et al. (2005) and Clark et al. (2009). To summarize the previous discussion, we posit that sponsorship announcements can positively influence shareholders’ wealth but the effects differ depending on sponsor and sponsor program specific factors, which include fit, expected performance of the sponsored entity (in the case of competition sports), the degree of risk in the sponsor’s branch and the duration of the agreement.
2.8 Relation with the Empirical Chapters
In this research chapter, we provided an overview of previous research on sponsorship effects to identify possible outcomes of sponsorship and the factors influencing these outcomes. In the next chapters we will focus on sponsorship with customer-based brand equity objectives, as this is the largest portion of all sponsorships. Building on the theoretical framework, we present two empirical studies regarding consumer (cognitive, affective and conative) responses to Heineken’s sponsorship of UEFA Champions League (UCL), and one empirical study involving a benchmark of efficiency in the Dutch sponsorship market, where consumers’ responses to sponsorship are included as sponsorship output variables.

33
Chapter 3
Dynamic Effects of Sponsoring: How Sponsorship Awareness Develops over
Time3
3 This chapter is based on Walraven, M., Bijmolt, T. H. A. and Koning, R.H. (2013). Dynamic effects of sponsoring: the development of sponsorship awareness over time, Journal of Advertising, forthcoming.

34
CHAPTER 3
3.1 Introduction
In the past few decades, sponsorships have evolved away from short-term, philanthropic activities into long-term strategic partnerships (Fahy et al., 2004). In this sense, a sponsorship is a long-term investment, demanding time and effort from the sponsor to achieve consumer awareness of the sponsorship link, and to convince the target audience of its sincerity and goodwill (Amis, Slack, & Berrett, 1999; Crimmins & Horn, 1996). Cornwell et al. (2001) find that sponsorship managers tend to agree that longer sponsorship duration strengthens brand equity effects. Fahy et al. (2004) also highlight that sponsorships tend to involve long-term contracts (i.e., three–five years on average). Yet difficult economic conditions bring sponsorship investments under increased scrutiny, such that “companies that are signing new or re-signing deals are showing reluctance to sign long-term contracts” (SportBusiness Group 2009, p. 5). Considering this setting, we propose adding a dynamic, long-term perspective to extant sponsorship research by investigating awareness of a multiple-year sponsorship project. Pope et al. (2009) suggest that sponsorship studies should adapt to the long-term nature of sponsorship’s impact by tracking the effects over an extended period of time. In this vein, we address the issue of how sponsorship awareness develops over time. Does it increase, or does awareness taper off at some point? Such questions are particularly relevant because sponsorship awareness offers a critical measure of sponsorship effectiveness (Wakefield et al., 2007). Most research relies on pre- and post-sponsorship event surveys to measure changes in sponsorship recall and/or recognition. Although useful on a single-event basis, such a protocol is less applicable to multiple-year sponsorship. Therefore, our study results may help sponsorship managers determine an optimal duration for their sponsorship contracts.Furthermore, as noted elsewhere (Olson, 2010; Wakefield & Bennett, 2010), most sponsorship studies rely on experimental investigations and feature unrepresentative samples. Our field-based study offers an important extension to extant research. Specifically, we conduct an empirical study of a real-life sponsorship of a major sport event, the Union of European Football Associations (UEFA) Champions League, with data across five European countries, such that we can examine the generalizability of our findings and identify country-specific patterns. The international character of the research also helps us assess the effect of specific sportive success, within a country, on sponsorship awareness.In the next section, we review existing literature to derive our study hypotheses. We then present our study methodology, which leads into our results and findings. Finally, we discuss the implications of these findings and some possible directions for further research.

35
Dynamic EffEcts of sponsoring: How sponsorsHip awarEnEss DEvElops ovEr timE
3.2 Background
3.2.1 SponsorshipAwarenessAs Cornwell et al. (2005) suggest, different mechanisms can describe consumer processing of sponsorship, depending on the type of sponsorship, its desired outcomes, and the target group characteristics. Some research implies a mere exposure effect (e.g. Bennett, 1999; Herrmann et al., 2011; Olson & Tjømøe, 2009), defined as a positive, affective response to the sponsor in the absence of any conscious awareness of the sponsorship. However, a more common assumption involves an associative memory model, with at least some cognitive processing (Cornwell et al., 2005); this pathway is also the basis we use for this study. From this perspective, sponsorship awareness is crucial for any assessment of sponsorship effectiveness, because it represents a necessary step prior to higher-level processing (Johar et al., 2006; Wakefield & Bennett, 2010). Favorable high-level processing of sponsorship involves sponsee–sponsor image transfer (Gwinner & Eaton, 1999), the creation of a more positive attitude toward the sponsor (Speed & Thompson, 2000), and higher intentions to purchase a sponsor’s products (Ko, Kim, Claussen, & Kim, 2008).
3.2.2 factorsInfluencingSponsorshipAwarenessExtant research indicates that sponsorship awareness is not guaranteed, because the public is often confused in identifying official sponsors (Johar et al., 2006). Therefore, scholars have investigated the role of several drivers of sponsorship awareness. The important factors can be categorized into three classes: (1) heuristics evoked by consumers in the recall process, (2) the characteristics of the sponsorship agreement, and (3) individual consumer characteristics.First, consumers tend to evoke sponsor brand prominence and perceived relatedness as heuristics to recall or recognize the sponsor–sponsee linkage, when the link cannot be retrieved directly from memory (Pham & Johar, 2001; Wakefield & Bennett, 2010). The accuracy of sponsor identification thus is predicted to be higher when the sponsor is a prominent brand (versus a less prominent brand) and when consumers view the sponsor and the event as fitting together (versus a pairing with lower perceived relatedness), all else equal. Second, sponsorship characteristics influence the level of sponsorship awareness. These include the level of exposure to the sponsor–sponsee linkage and the degree of sponsorship leverage or activation (Johar et al., 2006; Wakefield et al., 2007). The more a person is exposed to the sponsorship linkage, the more likely the link will be stored in memory and can be remembered instantly (Meenaghan, 2005). Accordingly, sponsors who invest in leveraging their sponsorship (additional marketing effort surrounding the sponsorship, beyond the exposure provided for in the sponsorship agreement) should

36
CHAPTER 3
achieve higher levels of sponsorship awareness (Crimmins & Horn, 1996; Wakefield et al., 2007). Third, individual consumer characteristics affect sponsorship awareness. In particular, the level of involvement with regard to the sponsored object is an important predictor of sponsorship awareness (e.g. Wakefield et al., 2007), as is the level of prior experience with the sponsor. Consumers may be better able to identify sponsoring brands that are familiar to them (Cornwell et al., 2005). Therefore, we expect consumption of the sponsoring brand and product category to affect sponsorship awareness positively. Furthermore, various individual demographic characteristics may influence sponsorship awareness, because these factors can affect people’s ability to memorize and reproduce the sponsor–sponsee link. Gender and education level significantly affect sponsorship awareness, in that men typically exhibit a higher ability to identify sponsors and more educated persons demonstrate higher levels of correct sponsor identification than people with low education levels (Kinney et al., 2008). Age also should have a negative effect on sponsorship awareness, such that a younger person is better able to remember the sponsor–sponsee link than an older person (Kinney et al., 2008; Walliser, 2003). In summary, previous research has identified several important drivers of sponsorship awareness, which we include as control variables for this study. Furthermore, we include possible predictors of sponsorship awareness that previously have been investigated less frequent; the effects of sponsorship duration (i.e., what happens to the level of sponsorship awareness over time?) and the influence of sportive success. As another contribution, we include individual involvement at both the generic sport level and the domain-specific level. The potential relevance of these variables in the context of sponsorship awareness and the corresponding research hypotheses are outlined below.
3.2.3 TheEffectofSponsorshipDurationTypically, sponsorship effect studies have been conducted in the context of a single event sponsorship, so the effects of time have not been widely investigated (Pope et al., 2009). A notable exception is the study of Quester and Farrelly (1998), who consider pre- and post-event sponsor recall for the Adelaide Formula One Grand Prix for four consecutive years. They find no significant difference in recall levels for sponsors who had been repeatedly involved in the event and incidental sponsors. Furthermore, for repeated sponsors, recall levels did not necessarily improve (and in some cases even declined) over the measurement period. The authors attribute these surprising findings to the specific characteristics of the event (e.g., low level of event involvement among respondents). McAlister, Kelly, Humphreys and Cornwell (2012) apply a longitudinal design to investigate the effects of replacement of a long-term sponsor on sponsor awareness; they find that long-term sponsors continue to be associated with an event, even when the contract has ended, which supports the value of holding long-term sponsorships. Pitts and Slattery (2004) measure sponsorship recognition among season ticket holders of a university

37
Dynamic EffEcts of sponsoring: How sponsorsHip awarEnEss DEvElops ovEr timE
football team both early in the season and in a post-season stage; they report an overall increase of awareness during the season. Becker-Olsen and Simmons (2002) similarly report that if fit is created, recall of the sponsored cause improves over a one-year period. However, here the question remains: What would happen if the sponsorship is continued for years later? Cornwell et al. (2001) posit that sponsorship duration is an important factor to consider, because repeated exposures to the sponsorship linkage may work in a similar manner to repetition of an advertising message. As described by Braun-LaTour & LaTour (2004, p. 50), ad memory is a dynamic process, because of its interaction with other brand information stored in memory. The authors also acknowledge that consumer brand knowledge is built over time, in that repetition leads to a stronger association. Therefore, we hypothesize that sponsorship awareness increases over time.
H1: There is a positive relation between sponsorship duration and sponsorship awareness.
Parker (1991) argues that sponsorship recall for a certain event typically involves build-up (before the event), peak (just before and during the event), and tail-off (after the event) stages. However, this reasoning applies to just one cycle of an event, without taking continued sponsorship of the event into account. It seems reasonable to expect a build-up phase for sponsorship recall in a multiple-year sponsorship, until a maximum level of recall has been reached. In contrast with the pattern for single-event sponsorships, we do not expect a decline in recall if the sponsorship project continues for several years. As McAlister et al. (2012) demonstrate, long-term sponsors maintain residual sponsorship awareness, even when the sponsorship agreement has ended. Therefore, we expect that after the saturation point (i.e., a certain maximum level of sponsorship awareness is reached), the level of sponsorship identification should remain stable, provided that exposure levels persist. Therefore,
H2: The level of sponsorship awareness reaches a saturation point after which it does not increase any further but remains stable over time, if sponsorship exposure continues.
3.2.4 TheEffectofIndividualInvolvementIndividual involvement is an important determinant of advertising and commercial message impact. As noted by Leigh and Menon (1987) some consumers devote little cognitive attention to commercial messages, whereas others put significant effort in trying to comprehend the message, due to for example differences in interests and present distracting conditions. As such, individual differences in involvement affect recall and recognition levels (Leigh & Menon, 1987).

38
CHAPTER 3
Relevant to this research Shank and Beasley (1998, p. 436), who describe the concept of sports involvement as “the perceived interest in and personal importance of sports to an individual,” find that an individual’s level of sports involvement relates positively to the number of hours he or she spends viewing sports on television, reading about sports, attending events, and participating. This makes it more likely that someone is confronted with messages of sponsors active in that sport. Likewise, individual exposure to corporate sponsors is a function of the number of matches attended or watched (Wakefield et al., 2007). Therefore; the more one is involved with a particular sport and sponsored object, the more likely one is exposed to sponsor messages and, thus, the higher the probability of sponsorship awareness.Involvement not only leads to a higher probability of sponsorship exposure but also to a higher probability of sponsorship processing. As Pham (1992) posits, involvement with a sponsored event may have an intensity property, which implies that involvement with a sponsored event leads to higher overall attention devoted to the event, including the attention for embedded sponsorship stimuli. Moorman, Willemsen, Neijens and Smit (2012) find that involvement with a particular soccer match leads to increased attention and recall of the commercials surrounding the match. Likewise, Wakefield et al. (2007) argue that involved consumers are more willing to engage in active information processing and thus are more likely to pay attention to sponsorship exposure (i.e., to process and learn the sponsorship linkage). In sports sponsorship, involvement may thus exist at different levels, including individual involvement at the generic level of the sports category (i.e., soccer) or the domain-specific level of the sponsored object (i.e., the particular sponsored team). These concepts differ; high involvement with the sports category does not automatically mean high involvement with the sponsored object. For example, someone may be a fan of soccer but exhibit greater involvement with one specific soccer team or player. In this research we are investigating awareness of UEFA Champions League sponsorship, so generic involvement refers to individual involvement with soccer, whereas doman-specific involvement pertains to individual involvement with the competition, that is; one’s interest in the league and the tendency of following matches. Based on the arguments above, we hypothesize that both involvement with the sports category and involvement with the sponsored object are positively associated with sponsorship awareness. Because most previous studies include one or the other—sports category or domain-specific involvement—as a predictor of sponsorship awareness, we know little about their relative importance. Therefore, we include both variables in this research. We expect that involvement with the sponsored object is more strongly related to sponsorship awareness than involvement with the sports category because it is a more specific determinant. In the context of this study, we hypothesize that individual exposure to and attention for messages of UEFA Champions League sponsors (and, therefore, sponsorship awareness) is higher for an individual particularly interested in the league

39
Dynamic EffEcts of sponsoring: How sponsorsHip awarEnEss DEvElops ovEr timE
than for someone who is a soccer fan but not particularly following UEFA Champions League. Therefore,
H3a: Individual involvement at the generic level (soccer) has a positive effect on individual sponsorship awareness.
H3b: Individual involvement at the domain-specific level (UEFA Champions League) has positive effects on individual sponsorship awareness.
H3c: Involvement at the domain-specific level is a stronger predictor of sponsorship awareness than involvement at the generic level.
3.2.5 TheEffectofSportiveSuccessHypothetically, the sportive success of the sponsored property may affect sponsorship effectiveness. In a few studies of shareholder reactions to sponsorship announcements, the expected performance of the sponsored entity relates positively to the stock price increase that results from the sponsorship announcement (i.e. Pruitt et al., 2004). Thus far though, sportive success has barely been taken into account in studies that consider consumer reactions to sponsorships. Yet Wakefield and Bennett (2010) indicate that teams with stronger competitive performance evoke a more intense affective response and attract prominent sponsors, which stimulates correct sponsor identification. Furthermore, we expect higher involvement for properties that performing well. This could imply higher personal interest in the event, which stimulates central route processing (Wakefield et al., 2007). In contrast, it can be argued that high levels of involvement and arousal with a game may lead to attention selectivity; in this situation attention is narrowed to the game itself, which limits processing of sponsorship stimuli (Pham, 1992). In this respect, Bennett (1999) argues that besides exposure to commercials of sponsors surrounding match broadcasts (e.g., prior to a match, halftime), spectators are exposed to embedded sponsorship messages at moments when their attention to the match is low (i.e., less excitement). Moreover, several researchers have shown that strong emotional reactions among viewers of the Super Bowl can inhibit processing of embedded ads (Lord & Burnkrant, 1993; Newell, Henderson, & Wu, 2001; Pavelchack, Antil, & Munch, 1988). For example, Pavelchack et al. (1988) find that viewers from participating, winning cities are less likely to recall ads than viewers from losing or non-participating cities. Thus, when a team is more successful, spectators involved with that team likely are more excited during the match, leaving less cognitive capacity to process sponsorship messages apart from the action on the field. With these contrasting arguments, we suggest that the effect of sportive success may be specific to the sponsored property. A sponsor of a team or individual athlete may be more likely to be recalled if that team (or athlete) is performing well, because fans focus their attention during broadcasts on the players and thus might be able to identify

40
CHAPTER 3
a sponsor whose logo appears on a shirt. Team fans also are more motivated to process information about the team, including its sponsorships. In contrast, a sponsor of a league or event may not benefit from sportive success to the same extent because of the limited cognitive processing of non-central messages. During match broadcasts of successful teams viewers are possibly more focused on the game and players rather than on embedded signs and messages of league sponsors. Furthermore, the focus of attention of fans of successful teams will be on the team itself because their self-identity is drawn from the team, whereas fans of less performing teams may focus more on being part of the league. Our study focuses on a league sponsor (sponsoring the UEFA Champions League). In this context sportive success refers to the aggregate results of a nation’s participating club teams in a particular season. On the one hand if club teams from a certain country are doing well, these teams move forward in the competition and play more matches, which implies a higher probability of exposure for sponsor messages in that country. Moreover, perceived personal relevance of the league as a whole may be higher when teams from their country are successful. Alternatively, individuals may be more excited during matches when teams from their own country are performing well in the competition and this might lead to distraction from league sponsor messages. In all, we hypothesize that the success of a nation’s club teams has a positive effect, because of the higher individual exposure and attention to matches, which may offset possible distraction effects. Therefore,
H4: The success of a nation’s club teams has a positive effect on the probability that an individual consumer correctly recalls and recognizes the league sponsor.
3.3 Research Design
The long-term cross-sectional study considered sponsorship effectiveness for Heineken International, one of the main sponsors of UEFA Champions League, a highly prestigious European soccer competition. The annual tournament, in which European top football clubs compete, consists of several stages. In its present format, the tournament begins in mid-July, with three knockout qualifying rounds and a playoff round. The ten surviving teams join 22 directly qualified teams in the group stage (eight groups, each with four teams). Eight group winners and eight runners-up enter the final knockout phase, which ends with the final match in May. The final in 2009 drew an average audience of 109 million viewers, which made it the most watched annual sport event worldwide (BBCsport, 2010).Exposures to the sponsorship include, for example, television announcements (“breakbumpers”), listings of official sponsors names before and after matches and before and after breaks, logo placements in pre- and post-match interviews, and billboards

41
Dynamic EffEcts of sponsoring: How sponsorsHip awarEnEss DEvElops ovEr timE
placed in stadiums. For Heineken, a restriction on alcohol advertising in France (Loi Evin) prohibits brand name exposure on billboards, so billboards promote the message “Enjoy Responsibly” in Heineken style. Any existing sponsorship communication (e.g., sponsorship by club, stadium sponsors) in the stadiums is removed during matches to avoid confusion about UEFA Champions League sponsors. Furthermore, each sponsor has the right to exploit the association and thus may create additional exposure through leverage. The UEFA has restricted the number of official sponsors to eight, and each sponsor is exclusive to its respective industry.A market research agency gathers data every six months, in December (halfway the UEFA Champions League season) and May (just after the final match). Data collection took place from December 2005 until December 2009 in five European countries with a large population of soccer fans, which represent important target markets for Heineken (France, Italy, The Netherlands, Spain, and United Kingdom). Just before the 2005–2006 UEFA Champions League season, the sponsorship moved from the company’s Amstel brand to its global flagship brand Heineken, though both are part of the same corporation. The sponsorship contract and exposure did not change again during the observation period.The research population consisted of people aged 18 years and older. An online panel provided representative samples, which consisted of 400–650 respondents per country every half year. Respondents participating in a particular wave were excluded for the next two years. Therefore, we treat these data as multiple, independent cross-sections. In total the data set consists of 25,288 respondents. The different groups of respondents in each country are demographically similar, with an average age between 39 and 45 years; female respondents constitute between 49% and 51% of each country’s sample.
3.4 Measurement
The variables relevant for this research were constructed using several questions from a larger questionnaire that consisted of several parts. Respondents began by answering several background questions, as well as indicating the extent to which they were interested in soccer and the UEFA Champions League. Then they were asked to name the sponsors of the UEFA Champions League spontaneously (recall); subsequently they could select official sponsors from a list (recognition). Finally, several questions pertained to individual attitudes toward the sponsorship, sponsoring brands, and several sponsorship exposures.
3.4.1 DependentVariablesSponsorship awareness can be measured in several ways and with several cues (Cornwell & Humphreys, 2013). Explicit awareness of a sponsor in relation to a sponsored object may be measured with spontaneous recall and recognition (i.e., selection from a list of potential sponsors) (Wakefield et al. 2007; Walliser, 2003), where recall may be considered

42
CHAPTER 3
a stronger measure because it evokes more direct retrieval and recognition is influenced more by (constructed) guessing. In this study, respondents mentioned spontaneously any brands they knew as a sponsor of UEFA Champions League, so the first dependent variable, sponsorship recall, could be constructed as a categorical, dichotomous variable, equal to 1 when a respondent mentioned Heineken as a sponsor of the UEFA Champions League and 0 otherwise. For the second dependent variable, sponsorship recognition, respondents selected official sponsors from a randomized list with 35 names of brands including both official sponsors and foils; organizations operating in the same markets as the official sponsors, and several other major, international brands. This variable also provided a dichotomous, categorical variable, equal to 1 when Heineken was selected correctly by a respondent and 0 otherwise. As we show in Table 3.1, almost 10% of the respondents were able to recall the sponsor correctly, and 20% correctly selected Heineken from a list of potential sponsors.
3.4.2 IndependentVariablesBecause we aim to address the long-term, dynamic effects of sponsoring, time provides an independent variable of particular interest. To measure time, we introduced dummy variables, indicating at which point the measurements took place. Because the sponsorship involves an international tournament, broadcasted in each country for the whole sample period, we cannot distinguish between calendar time and sponsorship duration. We have nine measurement moments, leading to eight dummies (the first measurement period, in December 2005, is the reference category). We followed a similar procedure for the country variable; for each country except The Netherlands, which served as the reference country, we created a dummy variable.To measure sportive success, we used the official UEFA season league coefficient, which reflects the aggregate win–loss results of each nation’s club teams in the UEFA Champions League and UEFA Europa League games over the previous season. Each club earns two points for each win and one point for a draw. The number of points awarded each season is divided by the number of teams that participated from that nation in the season. Thus, the effect varies between countries and over time; were the data restricted to one country, we could not distinguish the effect of sportive success from time.Finally, we included involvement with the event (UEFA Champions League), involvement with the sports category (soccer), and perceived fit at the individual level, measured on a Likert scale. To control for the effect of sponsorship activation, we obtained the leverage budgets per country and per year from Heineken and standardized them for each country. The effect of variation in the leverage budgets over time therefore is included in the effect of the leverage variable, whereas the effect of the variation in the leverage budgets between countries is taken up by the country dummies. In addition, we included usage of the product category (beer drinker) and purchase of the Heineken brand as categorical, dichotomous control variables. We also controlled for respondents’ education level (low,

43
Dynamic EffEcts of sponsoring: How sponsorsHip awarEnEss DEvElops ovEr timE
medium, high), gender (male, female), and age. The descriptive statistics of the variables, as well as details on the construction and Cronbach’s alpha scores (where applicable), are available in Table 3.1.
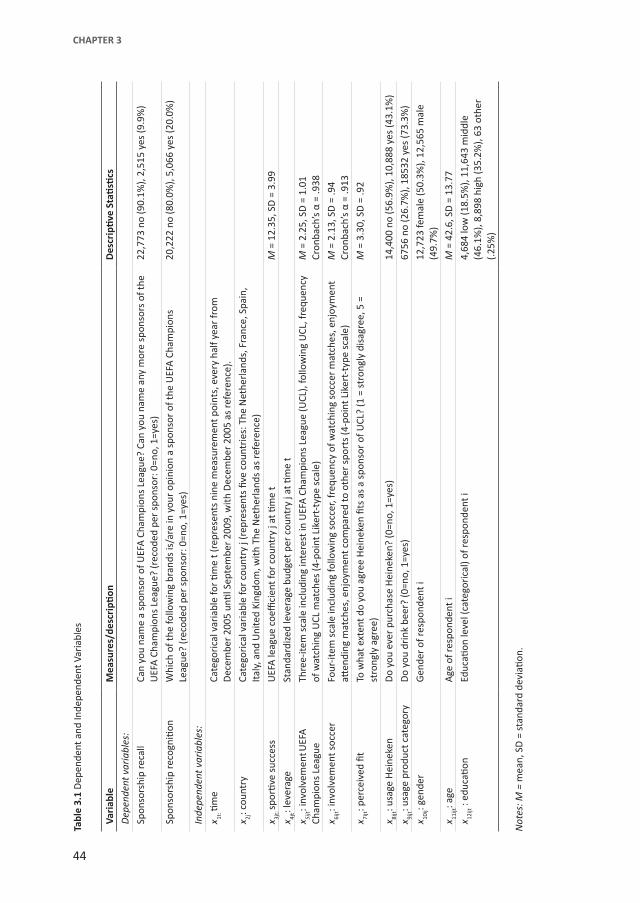
44
CHAPTER 3
Table3.1
Dep
ende
nt a
nd In
depe
nden
t Var
iabl
es
Vari
able
Mea
sures/de
scripti
onDescriptiveStatistics
Dep
ende
nt v
aria
bles
:
Spon
sors
hip
reca
llCa
n yo
u na
me
a sp
onso
r of
UEF
A C
ham
pion
s Le
ague
? Ca
n yo
u na
me
any
mor
e sp
onso
rs o
f the
U
EFA
Cha
mpi
ons
Leag
ue?
(rec
oded
per
spo
nsor
: 0=n
o, 1
=yes
)22
,773
no
(90.
1%),
2,51
5 ye
s (9
.9%
)
Spon
sors
hip
reco
gniti
onW
hich
of t
he fo
llow
ing
bran
ds is
/are
in y
our
opin
ion
a sp
onso
r of
the
UEF
A C
ham
pion
s Le
ague
? (r
ecod
ed p
er s
pons
or: 0
=no,
1=y
es)
20,2
22 n
o (8
0.0%
), 5,
066
yes
(20.
0%)
Inde
pend
ent v
aria
bles
:
x 1t: tim
eCa
tego
rica
l var
iabl
e fo
r tim
e t (
repr
esen
ts n
ine
mea
sure
men
t poi
nts,
eve
ry h
alf y
ear
from
D
ecem
ber
2005
unti
l Sep
tem
ber
2009
, with
Dec
embe
r 20
05 a
s re
fere
nce)
.
x 2j: c
ount
ryCa
tego
rica
l var
iabl
e fo
r co
untr
y j (
repr
esen
ts fi
ve c
ount
ries
: The
Net
herl
ands
, Fra
nce,
Spa
in,
Ital
y, a
nd U
nite
d Ki
ngdo
m, w
ith T
he N
ethe
rlan
ds a
s re
fere
nce)
x 3jt:
spor
tive
succ
ess
UEF
A le
ague
coe
ffici
ent f
or c
ount
ry j
at ti
me
tM
= 1
2.35
, SD
= 3
.99
x 4jt: l
ever
age
Stan
dard
ized
leve
rage
bud
get p
er c
ount
ry j
at ti
me
t
x 5ijt: i
nvol
vem
ent U
EFA
Ch
ampi
ons
Leag
ueTh
ree-
item
sca
le in
clud
ing
inte
rest
in U
EFA
Cha
mpi
ons
Leag
ue (U
CL),
follo
win
g U
CL, f
requ
ency
of
wat
chin
g U
CL m
atch
es (4
-poi
nt L
iker
t-ty
pe s
cale
)M
= 2
.25,
SD
= 1
.01
Cron
bach
’s α
= .9
38
x 6ijt: i
nvol
vem
ent s
occe
rFo
ur-it
em s
cale
incl
udin
g fo
llow
ing
socc
er, f
requ
ency
of w
atch
ing
socc
er m
atch
es, e
njoy
men
t att
endi
ng m
atch
es, e
njoy
men
t com
pare
d to
oth
er s
port
s (4
-poi
nt L
iker
t-ty
pe s
cale
)M
= 2
.13,
SD
= .9
4Cr
onba
ch’s
α =
.913
x 7ijt: p
erce
ived
fit
To w
hat e
xten
t do
you
agre
e H
eine
ken
fits
as a
spo
nsor
of U
CL?
(1 =
str
ongl
y di
sagr
ee, 5
=
stro
ngly
agr
ee)
M =
3.3
0, S
D =
.92
x 8ijt: u
sage
Hei
neke
nD
o yo
u ev
er p
urch
ase
Hei
neke
n? (0
=no,
1=y
es)
14,4
00 n
o (5
6.9%
), 10
,888
yes
(43.
1%)
x 9ijt: u
sage
pro
duct
cat
egor
yD
o yo
u dr
ink
beer
? (0
=no,
1=y
es)
6756
no
(26.
7%),
1853
2 ye
s (7
3.3%
)
x 10ij: g
ende
rG
ende
r of
resp
onde
nt i
12,7
23 fe
mal
e (5
0.3%
), 12
,565
mal
e (4
9.7%
)
x 11ijt
: age
Age
of r
espo
nden
t iM
= 4
2.6,
SD
= 1
3.77
x 12ijt
: ed
ucati
onEd
ucati
on le
vel (
cate
gori
cal)
of re
spon
dent
i4,
684
low
(18.
5%),
11,6
43 m
iddl
e (4
6.1%
), 8,
898
high
(35.
2%),
63 o
ther
(.2
5%)
Not
es: M
= m
ean,
SD
= s
tand
ard
devi
ation
.
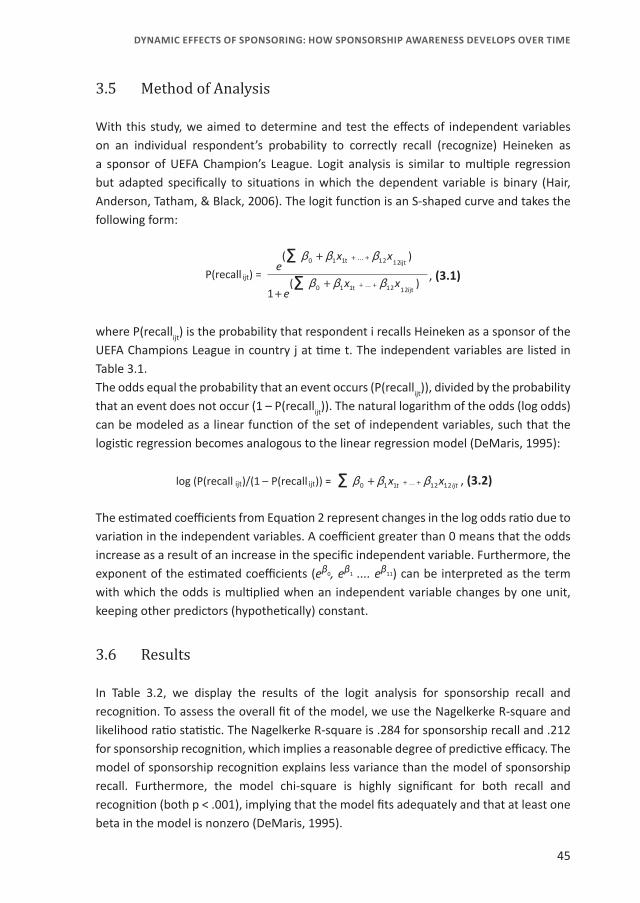
45
Dynamic EffEcts of sponsoring: How sponsorsHip awarEnEss DEvElops ovEr timE
3.5 Method of Analysis
With this study, we aimed to determine and test the effects of independent variables on an individual respondent’s probability to correctly recall (recognize) Heineken as a sponsor of UEFA Champion’s League. Logit analysis is similar to multiple regression but adapted specifically to situations in which the dependent variable is binary (Hair, Anderson, Tatham, & Black, 2006). The logit function is an S-shaped curve and takes the following form:
- 51 -
3.5 Method of Analysis
With this study, we aimed to determine and test the effects of independent variables on an
individual respondent’s probability to correctly recall (recognize) Heineken as a sponsor of
UEFA Champion’s League. Logit analysis is similar to multiple regression but adapted
specifically to situations in which the dependent variable is binary (Hair, Anderson, Tatham,
& Black, 2006). The logit function is an S-shaped curve and takes the following form:
P(recall ijt) = )(
1
)(
1212...110
1212...110
ijtt
ijtt
x xe
xxe
ΣΣ
++
++
++
+
βββ
βββ
, (3.1)
where P(recallijt) is the probability that respondent i recalls Heineken as a sponsor of the
UEFA Champions League in country j at time t. The independent variables are listed in Table
3.1.
The odds equal the probability that an event occurs (P(recallijt)), divided by the probability
that an event does not occur (1 – P(recallijt)). The natural logarithm of the odds (log odds) can
be modeled as a linear function of the set of independent variables, such that the logistic
regression becomes analogous to the linear regression model (DeMaris, 1995):
log (P(recall ijt)/(1 – P(recall ijt)) = Σ +++ ijtt xx 1212...110 βββ , (3.2)
The estimated coefficients from Equation 2 represent changes in the log odds ratio due to
variation in the independent variables. A coefficient greater than 0 means that the odds
increase as a result of an increase in the specific independent variable. Furthermore, the
exponent of the estimated coefficients ( 1110 ...., ��� eee ) can be interpreted as the term with
which the odds is multiplied when an independent variable changes by one unit, keeping
other predictors (hypothetically) constant.
, (3.1)
where P(recallijt) is the probability that respondent i recalls Heineken as a sponsor of the UEFA Champions League in country j at time t. The independent variables are listed in Table 3.1.The odds equal the probability that an event occurs (P(recallijt)), divided by the probability that an event does not occur (1 – P(recallijt)). The natural logarithm of the odds (log odds) can be modeled as a linear function of the set of independent variables, such that the logistic regression becomes analogous to the linear regression model (DeMaris, 1995):
- 51 -
3.5 Method of Analysis
With this study, we aimed to determine and test the effects of independent variables on an
individual respondent’s probability to correctly recall (recognize) Heineken as a sponsor of
UEFA Champion’s League. Logit analysis is similar to multiple regression but adapted
specifically to situations in which the dependent variable is binary (Hair, Anderson, Tatham,
& Black, 2006). The logit function is an S-shaped curve and takes the following form:
P(recall ijt) = )(
1
)(
1212...110
1212...110
ijtt
ijtt
x xe
xxe
ΣΣ
++
++
++
+
βββ
βββ
, (3.1)
where P(recallijt) is the probability that respondent i recalls Heineken as a sponsor of the
UEFA Champions League in country j at time t. The independent variables are listed in Table
3.1.
The odds equal the probability that an event occurs (P(recallijt)), divided by the probability
that an event does not occur (1 – P(recallijt)). The natural logarithm of the odds (log odds) can
be modeled as a linear function of the set of independent variables, such that the logistic
regression becomes analogous to the linear regression model (DeMaris, 1995):
log (P(recall ijt)/(1 – P(recall ijt)) = Σ +++ ijtt xx 1212...110 βββ , (3.2)
The estimated coefficients from Equation 2 represent changes in the log odds ratio due to
variation in the independent variables. A coefficient greater than 0 means that the odds
increase as a result of an increase in the specific independent variable. Furthermore, the
exponent of the estimated coefficients ( 1110 ...., ��� eee ) can be interpreted as the term with
which the odds is multiplied when an independent variable changes by one unit, keeping
other predictors (hypothetically) constant.
, (3.2)
The estimated coefficients from Equation 2 represent changes in the log odds ratio due to variation in the independent variables. A coefficient greater than 0 means that the odds increase as a result of an increase in the specific independent variable. Furthermore, the exponent of the estimated coefficients (eβ0, eβ1 .... eβ11) can be interpreted as the term with which the odds is multiplied when an independent variable changes by one unit, keeping other predictors (hypothetically) constant.
3.6 Results
In Table 3.2, we display the results of the logit analysis for sponsorship recall and recognition. To assess the overall fit of the model, we use the Nagelkerke R-square and likelihood ratio statistic. The Nagelkerke R-square is .284 for sponsorship recall and .212 for sponsorship recognition, which implies a reasonable degree of predictive efficacy. The model of sponsorship recognition explains less variance than the model of sponsorship recall. Furthermore, the model chi-square is highly significant for both recall and recognition (both p < .001), implying that the model fits adequately and that at least one beta in the model is nonzero (DeMaris, 1995).

46
CHAPTER 3
To check for multicollinearity we computed the Variance Inflation Factor (VIF) for each explanatory variable. All VIFs are below the commonly used threshold of 10 (Hair et al., 2006). Hence, the model estimation does not suffer from multicollinearity problems. To test the significance of the individual coefficients (betas) of the predictors included in the logit model, we conducted Wald chi-square tests. As Table 3.2 reveals, in the model for sponsorship recall, all included independent variables exerted a significant influence on the probability that a respondent could recall Heineken as a sponsor, except for the use of the product category. In the model for sponsorship recognition, the most striking difference with the recall results was that involvement with the sports category (soccer) and education level were not significant predictors of sponsorship recognition.
3.6.1 RecallandRecognitionoverTimeAn examination of the logit results in Table 3.2, reveals that several measurement moments differ from the first measurement point (December 2005) in the log odds of sponsorship recall. Specifically, except for the second measurement point in the first season (May 2006), recall levels differ significantly from the recall level at the first measurement. A closer inspection of the proportional effects, exp(β), reveals that the odds of correct sponsor recall are almost three times as large at the end of the second season of sponsorship (May 2007) as at the beginning of the first season. Furthermore, at the last measurement point (December 2009), the odds of correct sponsorship recall are almost four times greater than in the first measurement period. Thus the probability of correct sponsorship recall increases with time, consistent with H1. Figure 3.1 displays the development of the probability of correct sponsor recall graphically.
The results for sponsorship recognition are similar (Table 3.2). In this model, the effects of time on the probability of correct sponsor recognition are significantly positive. The changes in the odds are somewhat smaller than was the case for recall, which is not surprising, because recall represents a stronger measure. The odds of correct sponsor recognition are almost twice (1.715) as large at the end of the second season of sponsorship (May 2007) as in the beginning of the first season. To test H2, we estimated the model with a constant time effect from May 2007 (when the largest increase in recall has occurred) onward. The results for sponsorship recall, displayed in Table 3.2, reveal a chi-square value of 3663.151, such that the difference between model chi-squares is (3684.582– 3663.151 =) 21.431 with 5 degrees of freedom. This result is significant (p < .05), indicating that the model with varying time effects fits significantly better than the model with a constant effect, contrasting H2. The results for sponsorship recognition in Table 3.2 also reveal a significant difference between the model chi-squares; 33.627 with 5 degrees of freedom (p < .05), indicating that the model with varying time effects fits better than a model with a constant time effect from May 2007. During the period represented by the data set (four years), the absolute probability

47
Dynamic EffEcts of sponsoring: How sponsorsHip awarEnEss DEvElops ovEr timE
Tabl
e 3.
2 Re
sults
of L
ogit
Ana
lyse
s Ex
plai
ning
Spo
nsor
ship
Rec
all a
nd R
ecog
nitio
n
Dyn
amicTim
eEff
ects
Cons
tant
from
May
200
7
Dep
ende
ntVariable:
Reca
llRe
cogn
ition
Reca
llRe
cogn
ition
Explan
atoryVa
riab
leβ̂
exp(
β̂)
SEβ̂
exp(
β̂)
SEβ̂
exp(
β̂)
SEβ̂
exp(
β̂)
SE
Inte
rcep
t-5
.325
.232
-3.4
18.1
57-5
.596
.211
-3.6
73.1
43
Tim
e (r
efer
ence
: Dec
embe
r 200
5): M
ay 2
006
- .1
181.
125
.127
- .0
251.
025
.077
- .1
261.
135
.127
- .0
311.
032
.077
Dec
embe
r 20
06 1
.063
***
2.89
5.1
14-
.466
***
1.59
3.0
74-1
.057
***
2.87
7.1
13-
.460
***
1.58
5.0
74
May
200
7-1
.096
***
2.99
4.1
18-
.539
***
1.71
5.0
78-1
.149
***
3.15
6.1
03-
.585
***
1.79
5.0
64
Dec
embe
r 20
07-
.908
***
2.47
9.1
28-
.341
***
1.40
6.0
85
May
200
8-1
.142
***
3.13
3.1
18-
.532
***
1.70
2.0
78
Dec
embe
r 20
08-
.998
***
2.71
3.1
28-
.531
***
1.70
1.0
84
May
200
9-1
.206
***
3.34
1.1
31-
.668
***
1.94
9.0
88
Dec
embe
r 20
09-1
.378
***
3.96
5.1
30-
.801
***
2.22
7.0
88
Coun
try
(ref
eren
ce: T
he N
ethe
rland
s): F
ranc
e-1
.735
***
.17
6.1
04-1
.103
***
.33
2.0
71-1
.822
***
.16
2.0
97-1
.187
***
.30
5.0
66
Spai
n -
.272
.76
2.1
77-
.083
1.08
7.1
24 -
.552
***
.57
6.1
33 -
.173
* .
841
.097
Uni
ted
King
dom
-.6
71**
* .
511
.191
-.3
47**
.70
7.1
31 -
.973
***
.37
8.1
47 -
.618
***
.53
9.1
04
Ital
y -
.632
***
.53
1.1
20 -
.241
** .
786
.088
-.7
96**
* .
451
.099
-.3
98**
* .
671
.075
Gen
der (
refe
renc
e: fe
mal
e)-
.219
***
1.24
5.0
53-
.082
*1.
086
.038
- .2
14**
*1.
239
.053
- .0
78*
1.08
1.0
38
Age
-.0
21**
* .
980
.002
-.0
12**
* .
989
.001
-.0
20**
* .
980
.002
-.0
11**
* .
989
.001
Educ
ation
(ref
eren
ce: L
ow):
Mid
dle
- .2
12**
1.23
7.0
72-
.020
1.02
0.0
50-
.205
***
1.22
7.0
72-
.009
1.01
0.0
50
Hig
h-
.282
***
1.32
6.0
74 -
.027
.97
4.0
52-
.272
***
1.31
3.0
73 -
.044
.95
7.0
51
Usa
ge p
rodu
ct c
ateg
ory
-.0
77 .
926
.074
-.0
40 .
960
.051
-.0
76 .
927
.074
-.0
39 .
961
.051
Usa
ge H
eine
ken
- .3
90**
*1.
477
.057
- .3
30**
*1.
391
.042
- .3
86**
*1.
471
.057
- .3
31**
*1.
388
.041
Invo
lvem
ent C
ham
pion
s Le
ague
- .9
05**
*2.
473
.051
- .6
47**
*1.
909
.037
- .9
04**
*2.
470
.051
- .6
47**
*1.
909
.037
Invo
lvem
ent s
occe
r-
.157
**1.
170
.052
- .0
621.
064
.038
- .1
58**
1.17
1.0
51-
.062
1.06
4.0
38
Perc
eive
d fit
- .2
83**
*1.
327
.026
- .3
05**
*1.
357
.020
- .2
86**
*1.
332
.026
- .3
08**
*1.
361
.020
Spor
tive
succ
ess
Leve
rage
-.0
57**
- .0
15*
.94
51.
015
.019
.006
-.0
49**
*-
.014
** .
952
1.01
4.0
13.0
04 -
.025
*-
.013
* .
975
1.01
3.0
13.0
05 -
.020
*-
.012
** .
981
1.01
2.0
10.0
04
Mod
el c
hi-s
quar
e36
84.5
82**
*36
56.2
04**
*36
63.1
51**
*36
22.5
77**
*
Deg
rees
of f
reed
om24
2419
19
Nag
elke
rke
R2 .2
84 .2
13 .2
83 .2
11
Not
es: R
efer
ence
cat
egor
y in
par
enth
eses
, SE
= st
anda
rd e
rror
. *p
< .0
5, *
*p <
.01,
***
p <
.001
.

48
CHAPTER 3
of correct sponsorship recall continued to grow, which also questions the existence of a saturation point. Basically, when looking at Figure 3.1, we may note three stages; the first phase until May 2007 where the highest increase in sponsorship awareness leads up to a basic level, subsequently a ‘consolidation’ (or: saturation) stage where awareness levels remain more or less stable, and a new, smaller increase in 2009 towards the end of the measurement period.
3.6.2 EffectsofInvolvementConsistent with H3a and H3b, individual involvement with the event (UEFA Champions League) and with the sports category (soccer) exert significant positive effects on the individual probability of correct sponsor recall. However, for sponsorship recognition, involvement with the sports category does not have a significant effect. These findings offer partial support for H3a but full support for H3b. We further predicted that involvement with the sponsored property (UEFA Champions League) would be a stronger predictor of the probability of correct sponsor identification than involvement with the sports category (soccer) (H3c). To make the coefficients of the two involvement variables comparable, we calculated the factor with which the
Figure 3.1 Predicted Probability of Sponsorship Recall and Recognition over Time
- 54 -
3.6.1 Recall and Recognition over Time
An examination of the logit results in Table 3.2, reveals that several measurement moments
differ from the first measurement point (December 2005) in the log odds of sponsorship
recall. Specifically, except for the second measurement point in the first season (May 2006),
recall levels differ significantly from the recall level at the first measurement. A closer
inspection of the proportional effects, exp(), reveals that the odds of correct sponsor recall
are almost three times as large at the end of the second season of sponsorship (May 2007) as
at the beginning of the first season. Furthermore, at the last measurement point (December
2009), the odds of correct sponsorship recall are almost four times greater than in the first
measurement period. Thus the probability of correct sponsorship recall increases with time,
consistent with H1. Figure 3.1 displays the development of the probability of correct sponsor
recall graphically.
Figure 3.1 Predicted Probability of Sponsorship Recall and Recognition over Time
Notes: This figure is based on the probabilities of correct sponsorship recall (recognition) predicted by the logit model for an individual consumer in the United Kingdom, exposed to average UK sponsorship leverage with the following characteristics: male, 42.6 years old (average age), middle education level, beer drinker, not Heineken user, average level of involvement with the sport and sponsored object, and average level of perceived fit.
Notes: This figure is based on the probabilities of correct sponsorship recall (recognition) predicted by the logit model for an individual consumer in the United Kingdom, exposed to average UK sponsorship leverage with the following characteristics: male, 42.6 years old (average age), middle education level, beer drinker, not Heineken user, average level of involvement with the sport and sponsored object, and average level of perceived fit.
49
Dynamic EffEcts of sponsoring: How sponsorsHip awarEnEss DEvElops ovEr timE
odds are multiplied for one standard deviation change, or eβ̂*SD(x). In the model of sponsorship recall, for involvement with UEFA Champions League, the odds of correct recall (recognition) are multiplied by a factor of 2.494 (1.922) for a single standard deviation increase; for involvement with soccer, the factor was smaller, at 1.159 (1.060). To explicitly test whether the effect of involvement with Champions League is larger than the effect of soccer involvement, we computed 95% confidence intervals for eβ̂*SD(x). The confidence interval for Champions League involvement ranges from 2.255 to 2.759, and for soccer involvement from 1.053 to 1.276. In the model for recognition, the confidence interval for involvement with Champions League ranges from 1.786 to 2.068 and for involvement with the soccer from .988 to 1.137. As the confidence intervals for the different involvement levels do not overlap, we provide statistical support for H3c.
3.6.3 EffectofSportiveSuccessIn contrast to H4, a nation’s clubs’ successes in the Champions League appear to have a negative impact on sponsor recall (β̂ = -.057) and recognition (β̂ = -.049). As suggested previously, this negative influence could be explained by a higher level of excitement during the matches in a season when national club teams are performing well. This excitement may distract spectators from league sponsor messages, leading to a lower probability of awareness of league sponsors.
3.6.4 Country-SpecificEffectsThe results of the logit analysis show significant differences between countries in the probability of sponsor recall and recognition (see Table 3.2). The probability of correct sponsor recall is by far the lowest in France, midrange for Italy and United Kingdom, and highest in Spain and The Netherlands. Compared with an individual from The Netherlands or Spain, a respondent from France, the United Kingdom, or Italy is significantly less likely to correctly identify Heineken as a sponsor of Champions League. In particular, the odds of correct sponsorship recall would be multiplied by factors of .176, .511, and .531 for France, the United Kingdom, and Italy, in comparison with The Netherlands. The results in Table 3.2 reveal similar (but smaller) differences between countries in recognition probability: Compared with The Netherlands, the odds of correct sponsorship recognition would be multiplied by factors of .332, .707, and .786 in France, the United Kingdom, and Italy, respectively.
3.6.5 EffectsofControlVariablesThe results of the logit analysis are largely consistent with previous findings about the factors that influence sponsorship recall and recognition. First, brand use has a positive effect on the probability of sponsorship recall and recognition. The odds of recall are 1.477 times higher when a consumer uses versus does not use Heineken. On the contrary, no significant effects emerge for use of the overall product category. Second, perceived

50
CHAPTER 3
fit exerts a positive influence on sponsorship recall and recognition; the higher the level of perceived fit, the more likely someone is to recall or recognize the sponsor correctly. Third, the effect of leverage on sponsorship recall and recognition is positive, as expected. The leverage variable is standardized for each country, so the effect of the different levels of leverage per country is accounted for by the country dummies. Several individual demographic characteristics also significantly affect sponsorship recall and recognition, though the influence is not particularly strong. Consistent with prior expectations, age has a small negative impact on both recall and recognition. Education level has a significantly positive impact on sponsorship recall (odds of correct sponsor recall are 1.326 times higher for someone with a higher compared with lower education level), but the effect is not significant for sponsor recognition. Men are more likely to recall and recognize Heineken correctly as a sponsor than are women.
3.7 Discussion
Our main purpose with this current study has been to examine the dynamic effects of sponsorship over an extended period of time on sponsorship awareness levels. Previous arguments suggest that sponsorship should be treated as a long-term investment for firms to recognize and reap the benefits (Amis et al., 1999; Roy, 2005). Furthermore, managers expect favorable effects of sponsorship duration on brand equity (Cornwell et al., 2001). Yet, because longitudinal studies are scarce in prior research, the effects of sponsorship duration are unclear (Parker, 1991; Pope et al., 2009). We address this issue by researching sponsorship awareness in a long-term (four consecutive years, measurements every six months), international sponsorship context with worldwide exposure: the UEFA Champions League. The results offer several valuable insights.Consistent with Pitts and Slattery (2004) and Simmons and Becker-Olsen (2006), we find a positive impact of sponsorship duration on sponsor recall and recognition levels. However, our findings contrast with the results of Quester and Farrelly (1998), who uncover no effect on sponsorship awareness of a sponsor’s repeated involvement in an event. The difference might arise because their study was conducted among spectators of a single event (i.e., one-time exposure), whereas the UEFA Champion League is a competition that lasts for an entire soccer season (repeated exposures). Because we analyzed sponsorship awareness from the start of the sponsorship up to a point four years later, with measurement points every half year, we can detect specific timing effects that have not previously been uncovered. Notably, the largest increase in sponsorship identification accuracy occurred in the second season of the sponsorship, whereas the growth rate begins to tail off slightly in subsequent years. This finding is of interest because it provides an empirically based argument for signing multiple-year sponsorship contracts, as has been advocated by multiple authors (e.g. Amis et al., 1999; Roy, 2005). The results imply that a sponsorship project needs to last a minimum of two

51
Dynamic EffEcts of sponsoring: How sponsorsHip awarEnEss DEvElops ovEr timE
years to profit from the most notable increase in recall levels, depending on the amount of sponsorship exposure. The conversion of sponsorship awareness into affective and behavioral responses toward the sponsor does not occur automatically or instantly. Our research suggests that it takes approximately two years to achieve a level of sponsorship awareness reaches a basic build-up point that approaches the maximum potential. After that point, sponsorship awareness tends to consolidate, although periodic increases may be observed. After the basic build-up point, higher awareness levels might be achieved by leveraging the sponsorship and creating higher quality exposures in different media. Alternatively, as growth in sponsorship awareness tapers off, sponsorship managers might shift the focus of their leverage activities and invest in further interactions with the group of sponsorship-aware consumers to stimulate the desired attitudinal and behavioral responses to the sponsorship. Previous sponsorship awareness studies of league sponsorships reveal vast variation in awareness levels between sponsors. For example, Portlock and Rose (2009) identify unaided recall levels, among U.K. consumers exposed to the FIFA 2006 World Cup, that range from 43.3% to 64.9%; Pitts and Slattery (2004) find post-test recognition rates among season ticket holders of a university football team ranging from .17% to 89.7%. The aggregate average recall (10%) and recognition (20%) rates for Heineken as a sponsor of UEFA Champions League thus may seem rather low at first, but they incorporate unexposed respondents. We also computed the rates separately for fans who indicated that they watched the UEFA Champions League often; average recall (recognition) rates among this group ranged from 10% (22%) in France to 37% (54%) in The Netherlands. Thus across countries, involved fans display higher awareness than uninvolved fans, which suggests the importance of involvement by the target group in sponsorship processing. The results also emphasize substantial differences among countries. With regard to the impact of involvement on sponsorship processing, we included both domain-specific (with UEFA Champions League) and generic (with soccer) involvement as predictive variables. In line with our hypotheses, both involvement types enhance sponsorship recall, whereas domain-specific involvement is a stronger predictor. Thus it is important for companies that decide to get involved in sponsorship to investigate the level of involvement of their target group, not only at the sports category level but particularly with regard to the specific sponsored property. Generally, the degree of personal interest is greater for sponsored teams or individuals than for leagues or events; sponsors of leagues or events might not achieve the same level of sponsorship awareness as team or athlete sponsors.Significant differences arise between countries in terms of consumers’ ability to identify sponsors. Compared with someone from The Netherlands and Spain, a citizen of France, the United Kingdom, and Italy is significantly less likely to identify Heineken as a sponsor of UEFA Champions League. There are several possible explanations. First, differences

52
CHAPTER 3
in recall and recognition levels may reflect country-of-origin and brand prominence effects; the relatively high level of sponsorship awareness in The Netherlands probably represents a home country prominence effect for the brand. Second, the restriction of sponsorships by alcoholic brands in France (and the resulting lower brand logo exposure of Heineken) may explain the low sponsorship awareness levels there. Third, differences in sponsorship recall and recognition may be attributed to differences in the leverage levels for each country; leverage is highest in Spain and lowest in France. Alternative explanations might involve other country-specific factors, such as the varying degree of industry competition, cross-cultural differences, and the composition of the marketing communication environment in each country. Advertising or sponsorship clutter and general attitudes toward advertising might be higher or lower in one country than in another, making it more difficult to convey the sponsorship message. The results imply that varying levels of exposure and leverage between countries offers an effective strategy for international sponsors, because it takes more effort in one country than in another to achieve sponsorship awareness. Another finding that has not been reported in prior research pertains to the small, negative effect of sportive success on the probability of correct sponsor recall. As we have argued, this finding might indicate distraction, away from league sponsor messages, when country teams are performing well, or else the misidentification of team sponsors as league sponsors. In turn, it might be difficult for a league sponsor to achieve sponsorship awareness in regions where clubs are highly successful. Particularly, viewers may become confused about league sponsors if the main sponsor(s) of successful club teams operate in the same industry as the league sponsor. Therefore, we recommend investigating these conditions when deciding to enter a sponsorship agreement on the league or competition level. Moreover, league sponsors might want to activate their sponsorships through other channels than standard television and in-stadium exposures, such as through point-of-purchase sales promotions, to strengthen the link with the sponsored object. Finally, this study offers some methodological advancements over previous sponsorship research. As noted previously (Olson, 2010; Wakefield & Bennett, 2010), most studies have relied on experimental bases or used student samples; relatively few studies investigate the effects of multiple independent variables simultaneously. Our findings support prior work on sponsorship awareness and confirm the importance of several predictors in a field setting, using an international consumer sample. In particular, perceived fit emerges as an important predictor. In sponsorship selection decisions, the degree of perceived fit between the sponsor and sponsee (or the opportunity to create such fit) must be examined carefully. Furthermore, in line with our expectations, consumers’ brand use plays an important role in predicting their ability to identify a sponsor. When a sponsor aims to reach non–brand users with its sponsorship, it needs to invest more in the creation of sponsorship awareness than it would for a sponsorship directed at existing users of the brand.

53
Dynamic EffEcts of sponsoring: How sponsorsHip awarEnEss DEvElops ovEr timE
3.8 Limitations and Directions for Further Research
From the limitations of this article, we identify several directions for research. First, we offer a long-term dimension and international character to previous research on sponsorship awareness, yet our study remains limited in scope in the sense that it incorporates awareness data about a single sponsor and single sponsorship project. As Olson (2010) argues, studying sponsorship effects in other settings (e.g., cultural versus arts, prominent versus non-prominent sponsors) might enhance the external validity of the findings. Therefore, it would be valuable to replicate this research in other contexts to assess whether the findings, especially regarding the effects of sponsorship duration, generalize across sponsors and sponsorships. Second, we investigated sponsorship recall and recognition over a four-year period, and levels were still slightly increasing in the last year. Therefore, we recommend research with an even more extended time period. This duration would provide a stronger test of H2, that is, whether sponsorship awareness increases any further after reaching a saturation point.Third, research might assess the synergies associated with combining various communication channels during the execution of a longitudinal campaign. Sponsorship-linked marketing campaigns tend to combine sponsorship with, for example, televised advertising or online banner ads (Cornwell et al., 2005). It would be relevant to assess and compare the effectiveness of various combinations of communication channels.Although sponsorship awareness may be considered a first step for success, it cannot guarantee favorable attitudinal or behavioral consumer responses (Cornwell & Humphreys, 2013; Pope & Voges, 1999). Moreover, also when a sponsorship link is not explicitly recalled, consumers’ attitudes and behavior may be impacted through implicit memory effects of sponsorship (Herrmann et al. 2011). Further research thus might investigate the development of various evaluative consumer responses to sponsorship, such as image transfers from the sponsee to the sponsor, attitude toward the sponsor, and intent to purchase the sponsor’s products over time. Finally, we identified the growth pattern of sponsorship awareness over four years, which provides insights into the build-up phase of sponsorship awareness. However, as exposure has been continuous over the measurement period, we cannot actually differentiate between overtime build-up and on-the-spot exposure effects. Therefore, a related and relevant issue pertains to the decay effects; what happens if a sponsor discontinues a sponsorship agreement? We would welcome research on this topic that reveals how long a previous sponsor remains associated with a property, as well as the attitudinal consumer responses to the termination of a sponsorship contract. In this respect McAlister et al. (2012) report that former long-term sponsors continue to be associated with sponsored events, which may imply a dilution of sponsorship value for a replacement sponsor. With regard to higher-level sponsorship responses, Levin et al.

54
CHAPTER 3
(2008) find, in their study of NASCAR spectators, that race fans are more likely to buy from a current NASCAR sponsor but less likely to buy from a previous sponsor, which may signal the potential negative effect of discontinuing a sponsorship.

55
Chapter 4
International Spinoff Effects of League Sponsorship4
4 This chapter is based on Walraven, M., Bijmolt, T. H. A. and Koning, R.H. (2013). International spinoff effects of league sponsorship: a cross-national study of sponsor equity and its antecedents in participating and non-participating countries, working paper, University of Groningen.

56
CHAPTER 4
4.1 Introduction
Major sport events are increasingly broadcasted all over the world. For example the London 2012 Olympic Games were set to reach a potential global audience of 4.8 billion viewers (London2012.com, 2012). As a result of this high media exposure in multiple countries, sponsorships increasingly have an international character and the investments required to become an official sponsor of a global event are enormous (O’Reilly et al., 2008). For many global brands, sports sponsorship plays a crucial role in their global marketing strategy (Santomier, 2008). By sponsoring a sport property (an individual athlete, team, league, or event) with worldwide exposure, sponsors expect to reach a multinational audience and to strengthen brand equity in multiple countries at a time (Nufer & Bühler, 2010). Despite the increasingly global scope of sponsorship, research of sponsorship effects involving multiple countries is scarce up to this point (Dalakas & Kropp, 2002). The majority of sponsorship research has been carried out in western countries, particularly in the United States (Walliser, 2003). Moreover, most studies concentrate on the domestic region of the sponsored property (i.e. the country or state where an event is hosted or where a team comes from). Thus, the empirical findings may have limited generalizability concerning international spinoff effects. The question for firms investing in international sponsorship then remains whether consumers’ responses to sponsorship are formed the same way in different countries (Séguin et al., 2005). Increasing brand equity of the sponsor is a primary sponsorship objective (Olson, 2010). Therefore the aim of this chapter is investigating the change in brand equity due to sponsorship, i.e. sponsor equity, internationally. In particular, this study provides new insights on: 1) sponsor equity in nine different countries participating and not participating in an international sports league, and 2) the role of several antecedents of sponsor equity (brand usage, involvement with the event, and perceived fit between the sponsor and the sponsored property) in an international sponsorship. The study is conducted in the context of the UEFA Champions League, a prestigious European soccer competition for club teams. The results should help sponsor managers decide on the level of standardization of their sponsorship-linked marketing communications by revealing to which extent consumers’ responses to sponsorship differ between countries. We start this paper with a brief outline of relevant prior research, which forms the basis for our research model and hypotheses. Then, the methodology for this study is described. Finally, the results are discussed and recommendations for further research are presented.

57
InternatIonal SpInoff effectS of league SponSorShIp
4.2 International Sponsorship Effects
Many internationally operating firms choose to build on global brand equity, rather than keeping a portfolio with multiple local brands (Torres, Bijmolt, Tribó, & Verhoef, 2012). For many of these global brands, sports sponsorship programmes have become pivotal instruments in a global marketing strategy (Santomier, 2008; Séguin et al., 2005). Sponsorship offers the opportunity of linking a global brand (or a brand aspiring to become global) to an internationally highly regarded sports property. In this manner sponsors hope to transfer positive affect from the sponsored property to their own brand (Simmons & Becker-Olsen, 2006). Moreover international sponsorships may contribute to consumers’ perceptions of brand globalness (O’Reilly et al., 2008) and the more a brand is perceived as global, the higher consumers’ perceptions of brand quality and prestige, which positively influences purchase intentions and willingness to pay premium prices (Steenkamp, Batra, & Alden, 2003).Thus, sponsorship of a global property is expected to strengthen brand equity in multiple countries due to international broadcasting of sports properties and the resulting transfer of affect. For this reason, numerous studies have investigated sponsor equity; the favourable attitudinal change towards the sponsoring brand resulting from the association with a popular sports property (Olson, 2010). However, to date this kind of sponsorship effects research has been mainly conducted in the home region of the sponsored property; among spectators and visitors of matches in stadiums, among respondents from the region where a team comes from and among local samples (Walliser, 2003). Therefore it remains unclear whether and how the effects can be generalized to other countries. As a result, several scholars recommend extending sponsorship research with cross-national studies (Olson, 2010; Séguin et al., 2005). Although international sponsorship studies are scarce, there are some notable comparative investigations relevant to this research. Séguin et al. (2005) found significant variation between different countries (France, USA and Canada) in consumer purchase intentions as a result of sponsorship. For example, their results suggest that Canadians were more likely to support a sponsor by buying products than French consumers. Additionally, Dalakas and Kropp (2002) reported that North American consumers exhibit a significantly more positive attitude toward buying from sponsors than consumers from Greece and Korea. In a similar vein, several researchers (Gould, Gupta, & Grabner-Kräuter, 2000; McKechnie & Zhou, 2003) reported significant cross-national differences in attitudes towards product placement, which can be considered a marketing instrument related to sponsorship. In sum, multiple researches (i.e. Olson, 2010; Simmons & Becker-Olsen, 2006) suggest that sponsorship can strengthen brand equity of the sponsor, thereby creating sponsor equity, but these studies are not concerned with international sponsorships. Because of the large amount of international exposure and the high global level of consumer

58
CHAPTER 4
interest in certain sports and sports events, sponsors invest considerably in sponsorships and expect brand equity effects to spinoff internationally. Therefore, we posit that consumers’ attitudes and behavioural intentions can be affected in multiple countries at a time through sponsorship of an international property and the resulting international exposure for the sponsor. This translates into hypothesis 1:
H1: Sponsor equity is created in all countries where the sponsorship link is exposed.
Although we expect consumers to be affected by global sponsorship in multiple countries at a time, the previously discussed comparative studies suggest that cross-national differences in sponsorship effectiveness may persist. A possible explanation for these country differences in consumer response to sponsorship involves the link between a country and the sponsored property. Following social identity theory, consumers tend to respond more positive to sponsorship when they identify themselves strongly with the sponsored object (Cornwell et al., 2005). In this respect there is a difference between team (or individual athlete) sponsors and league (or event) sponsors. For team (individual athlete) sponsors, it can be expected that affective responses to sponsorship are more positive in the region where the team (athlete) comes from due to a higher degree of fan identification. For an event or league sponsor, responses to the sponsor may be different in countries following differing degrees of participation in the particular event or league. When their nation is participating in the league, consumers may identify themselves more with the league, perceived the league more as personally relevant, evaluate the league more positive and as a result tend to respond more favourably to sponsors of the league.Alternatively, it can be argued that for countries participating in the league cognitive processing of league sponsors may be lower compared to non-participating countries. The underlying premise is that excitement and arousal during matches may inhibit cognitive processing of sponsor messages (Pham, 1992). In this regard, several researchers have shown that strong emotional reactions among viewers of the Super Bowl have a negative effect on the attention and recall of embedded ads (Lord & Burnkrant, 1993; Newell et al., 2001; Pavelchack et al., 1988). For example, Pavelchack et al. (1988) find that viewers from participating cities are less likely to recall ads than viewers from non-participating cities. In this respect, country participation may lead to lower attention and recall of league sponsors, which might lower the potential of building on brand equity.For this study we investigate the effectiveness of sponsoring a European sports league broadcasted globally; the UEFA Champions League. We hypothesize that when club teams from their country are participating in the league, consumers evoke a stronger affective response to sponsors of the league than when there are no clubs from their country participating, despite the potentially lower cognitive processing in these countries. This translates in hypothesis two:

59
InternatIonal SpInoff effectS of league SponSorShIp
H2: Country participation in the sponsored league has a positive effect on sponsor equity.
4.3 Individual Drivers of Sponsor Equity
Apart from cross-national differences in the degree of sponsor equity, individual target group differences influence sponsor equity across countries. In this regard Speed & Thompson (2000) draw on classical conditioning theory to develop and test a conceptual framework of consumers’ response to sponsorship. Their model posits that consumers’ response to sponsorship is affected by their attitude towards the sponsor, attitude towards the sponsored property and the perception of congruence between the two. We also include these antecedents as predictors of sponsor equity in our research model.Additionally, we expect the effects of individual target group variables on sponsor equity to be moderated by country participation. In particular, we posit that social identification with the league and it’s sponsors is more apparent when a nation’s club teams are participating in the sponsored event, so that the response to sponsorship relies less on individual opinions and interests. Thus, we expect the effect of the individual antecedents on sponsor equity to be stronger in countries not participating in the sponsored league than in participating countries. Previous research has not investigated the antecedents of sponsor equity in a comparative way, but multiple single-context studies have been conducted in different countries. In the development of our hypotheses, we draw on the richness of our dataset (which will be discussed in section 4.4). We have information from several countries, some of which are not participating in the league. We will discuss previous research and our corresponding hypotheses below.
4.3.1 BrandUsageThere is ample evidence that consumers, who already view the sponsoring organization positively, are more likely to develop favourable dispositions towards the sponsorship. The importance of attitude towards the sponsor in sponsorship effectiveness has been demonstrated in several countries, for example with a French student sample (Chanavat & Martinent, 2009), among Norwegian and Danish consumers (Olson, 2010) and Australian undergraduate students (Speed & Thompson, 2000). For this research we include brand usage to control for previous associations with the sponsor. We expect that users of a sponsoring brand will respond more favourably to the sponsorship than non-users of the brand because they already hold favourable dispositions towards the sponsoring brand.

60
CHAPTER 4
Furthermore, we expect this effect to be stronger in non-participating countries than in participating countries. This translates into Hypotheses 3a and 3b:
H3a: Brand usage positively affects sponsor equity regardless of country.H3b: The effect of brand usage on sponsor equity is stronger in non-participating
countries than in participating countries.
4.3.2 InvolvementwiththeSponsoredPropertySeveral studies across multiple Western countries, such as Canada, Australia, Norway and Denmark find that involvement with the sponsored object is positively related to consumers’ affective and conative responses to sponsorship (e.g. d’Astous & Bitz, 1995; Olson, 2010; Speed & Thompson, 2000). Furthermore, Dalakas and Kropp (2002) found that the influence of team identification on consumers’ attitude toward buying from sponsors was consistently positive across Greece, Korea and United States. We follow Speed and Thompson (2000) by including two different constructs for involvement with the sponsored object, namely personal liking and perceived status of the sponsored object to differentiate between the direct and indirect benefits that individuals perceive to receive from an event. In this respect, personal liking pertains to the extent that individuals find the event intrinsically attractive and interesting (d’Astous & Bitz, 1995), whereas perceived status involves the level of prestige individuals assign to the event (Speed & Thompson, 2000). Therefore:
H4a: Personal liking of an event positively affects sponsor equity regardless of country.H4b: The effect of personal liking of the event on sponsor equity is stronger in non-
participating countries than in participating countries.H5a: Perceived status of an event positively affects sponsor equity regardless of
country.H5b: The effect of perceived status of the event on sponsor equity is stronger in non-
participating countries than in participating countries.
4.3.3 PerceivedfitPerceived fit or congruence represents the extent to which consumers perceive the sponsor and the sponsored property as fitting together. When the sponsor and sponsored object are perceived as congruent, the probability of sponsorship awareness is higher because consumers tend to evoke perceived relatedness as an heuristic to recall sponsors (Pham & Johar, 2001; Wakefield & Bennett, 2010). Furthermore, several studies show that consumers tend to develop more favourable attitudes towards a sponsorship when the sponsor and the sponsored property are perceived to be a good match (Olson, 2010). The importance of perceived fit for consumer’ affective response to sponsorship has been demonstrated among respondents in several sponsorship contexts, such as among

61
InternatIonal SpInoff effectS of league SponSorShIp
American NASCAR event visitors (Dees et al., 2010), Norwegian and Danish consumers (Olson, 2010) and undergraduate students from Australia (Speed & Thompson, 2000) and USA (Simmons & Becker-Olsen, 2006). Hypotheses 6a and 6b are formulated as follows:
H6a: Perceived fit between the sponsor and the sponsored event positively affects sponsor equity regardless of country.
H6b: The effect of perceived fit on sponsor equity is stronger in non-participating countries than in participating countries.
4.4 Method
4.4.1 DataCollectionThe data sponsor of this study is Heineken International, one of the official sponsors of UEFA Champions League (UCL). This is an annual event, in which the very best European soccer clubs compete. In 1992 the European Cup was transformed into UEFA Champions League and a new brand identity was developed, intended to “reinforce the competition’s global position in the sport market place” (Chadwick & Holt, 2008, p. 148). This new brand identity has been designed around the history, prestige and high level soccer of the competition (Chadwick & Holt, 2008). In 2009, the final of the competition drew an audience of 109 million viewers in total, which made it the most-watched annual sport event worldwide of that year (BBCsport, 2010). UCL has restricted the number of sponsors to eight, and each sponsor is exclusive for the respective industry. Exposure of the sponsorship consists of television announcements (“break bumpers”), naming the official sponsors of the event before and after matches and before and after the breaks, as well as billboards placed in the stadiums. Furthermore, each sponsor has the exclusive right to exploit the association (for example, use the UCL logo) which creates the opportunity of creating additional exposure through sponsorship leverage. Data have been gathered through an online survey by a market research agency every half year in December (halfway the UCL season) and May (just after the final match). The measurement period for this research was from December 2006 until May 2008 and respondents come from nine different countries. These countries include European participants with at least one team in the qualification phase of UCL (France, Italy, Spain, United Kingdom, The Netherlands, Greece and Poland) and two countries without any club team participating (Thailand and Argentina). These countries have been selected because they are important target markets for Heineken and because these nations inhabit a large population of soccer fans. The Netherlands is the home country for the sponsoring brand Heineken. Samples are drawn from the respective target populations, so the respondents are all users of the product category of the sponsor (beer drinkers). Furthermore, only

62
CHAPTER 4
respondents who indicated they knew the sponsoring brand (Heineken) and the event (UEFA Champions League) at least by name, were selected to answer questions related to the sponsorship, because high-level sponsorship effects are unlikely to occur if audience members do not know the sponsor or the sponsored object (Johar et al., 2006). Descriptive statistics of the sample per country can be found in Table 4.1. Because the demographic characteristics differ between countries we control for these variables in our regression model.
Table4.1 Demographics per Country
Country N AverageAgeinYears % malesThe Netherlands 974 42.19 73.7%France 997 40.95 69.0%Spain 1499 37.99 59.5%United Kingdom 945 40.13 64.9%Italy 1456 40.10 59.1%Poland 1029 36.97 62.2%Greece 1335 32.23 59.1%Thailand 1279 28.72 44.6%Argentina 840 36.32 60.8%
4.4.2 MeasurementsAn overview of the construct measurements can be found in Table 4.2. The variables relevant for this research were constructed based on several questions from a larger questionnaire. This questionnaire consisted of several parts. First, respondents answered several background questions and indicated their level of interest in soccer (as well their interest in other sports) and UCL (as well as in other soccer events). Then, they were asked to name sponsors of Champions League spontaneously (recall) and to select the official sponsors from a list (recognition). In proceedings of the survey, questions were posed regarding the individual attitude towards the sponsorship of UCL, the sponsoring brands and several sponsorship related exposures and advertisements of Heineken. Our dependent variable, sponsor equity, is constructed based on eight statements representing favourable attitudinal and behavioural change towards Heineken as a result of the sponsorship. The respondents were asked to indicate the extent to which they believe the sponsorship has contributed to their involvement with the Heineken brand, their preference for the brand and their consideration and recommendation of Heineken. These measures are similar to sponsor equity as operationalized by Speed and Thompson (2000) and Olson (2010). As independent variables in the regression model at the individual level we included personal liking of the event, perceived status of the event and perceived fit, which

63
InternatIonal SpInoff effectS of league SponSorShIp
Table4.2
Dep
ende
nt a
nd In
depe
nden
t Var
iabl
es
Vari
able
Mea
sures/Description
DescriptiveStatistics
Dep
ende
nt v
aria
ble:
Spon
sor
Equi
tySe
ven-
item
sca
le s
tate
men
ts re
gard
ing
bran
d ap
prec
iatio
n, b
rand
pre
fere
nce
and
bran
d re
com
men
datio
n du
e to
sp
onso
rshi
p (5
-poi
nt s
cale
, 1=s
tron
gly
disa
gree
, 5=s
tron
gly
agre
e). F
or e
xam
ple
“Bec
ause
Hei
neke
n sp
onso
rs th
e U
CL, I
app
reci
ate
the
bran
d m
ore
than
I us
ed to
do.
”, “B
ecau
se H
eine
ken
spon
sors
UCL
, I p
refe
r th
e br
and
to o
ther
be
er b
rand
s.” “
Beca
use
Hei
neke
n sp
onso
rs U
CL, I
wou
ld re
com
men
d th
em to
frie
nds
and
fam
ily.”
M =
2.6
0, S
D =
1.0
6Cr
onba
ch’s
α =
.97
Inde
pend
ent v
aria
bles
:
Bran
d us
age
Do
you
ever
pur
chas
e H
eine
ken?
(0=n
o, 1
=yes
)72
64 y
es (7
0.2%
), 30
90 n
o (2
9.8%
)
Pers
onal
liki
ng o
f the
ev
ent
Thre
e-ite
m s
cale
incl
udin
g in
tere
st in
UCL
, fol
low
ing
UCL
, fre
quen
cy o
f wat
chin
g U
CL m
atch
es (4
-poi
nt L
iker
t-ty
pe
scal
e)M
= 2
.76,
SD
= .8
1Cr
onba
ch’s
α =
.89
Perc
eive
d st
atus
of t
he
even
tTh
ree
item
sca
le in
clud
ing
stat
emen
ts b
est f
ootb
all i
n U
CL, t
op p
laye
rs in
volv
ed in
UCL
, mos
t pre
stigi
ous
socc
er
com
petiti
on (5
-poi
nt s
cale
, 1=s
tron
gly
disa
gree
, 5=s
tron
gly
agre
e).
M =
3.6
4, S
D =
.22
Cron
bach
’s α
= .7
6
Perc
eive
d fit
To w
hat e
xten
t do
you
agre
e H
eine
ken
fits
as a
spo
nsor
of U
CL?
(1 =
str
ongl
y di
sagr
ee, 5
= s
tron
gly
agre
e)M
= 3
.76,
SD
= 1
.06
Tim
eCa
tego
rica
l var
iabl
e fo
r tim
e: re
pres
ents
four
mea
sure
men
t poi
nts,
eve
ry h
alf y
ear
from
Dec
embe
r 20
06 u
ntil
May
200
8.
Coun
try
Parti
cipa
tion
Cate
gori
cal v
aria
ble
for
coun
try
parti
cipa
tion
in U
CL
Coun
try
Cate
gori
cal v
aria
ble
for
coun
try:
repr
esen
ts n
ine
coun
trie
s: T
he N
ethe
rlan
ds, F
ranc
e, S
pain
, Ita
ly, U
nite
d Ki
ngdo
m,
Pola
nd, G
reec
e, T
haila
nd a
nd A
rgen
tina
Gen
der
Gen
der
of re
spon
dent
4073
fem
ale
(39.
3%),
6281
mal
e (6
0.7%
)
Age
Age
of r
espo
nden
tM
= 4
2.6,
SD
= 1
3.77
Educ
ation
Educ
ation
leve
l of r
espo
nden
t14
32 lo
w (1
3.8%
), 35
03
mid
dle
(33.
8%),
5419
hig
h (5
2.4%
)
Not
es: M
= m
ean,
SD
= s
tand
ard
devi
ation
.

64
CHAPTER 4
have been measured on a Likert scale. Usage of the Heineken brand is a categorical, dichotomous variable. Moreover, we control for the effects of time, by including dummy variables indicating at which point the measurements took place, and for individual demographic differences in the sample, by including age, gender and education level.
4.5 Results
4.5.1 SponsorEquityinDifferentCountriesThe main interest of this paper is investigating sponsorship effectiveness in different countries. In H1 we hypothesized that sponsor equity is created in countries where an event is broadcasted, regardless of the country’s participation in the event. In Table 4.3, we calculated the mean scores (on a five-point scale) for sponsor equity per country. Furthermore, Table 4.3 displays the top-box proportion of respondents who stated they believe that the sponsorship has contributed favourably to their response towards the sponsoring brand (a mean score higher than three on the sponsor equity statements). This top-box proportion is calculated separately for all respondents and for those who stated they watch UCL matches often or very often (regular watchers). In all surveyed countries a proportion of the respondents agrees that their attitudes and intentions towards the sponsor are enhanced due to the sponsorship. This implies that sponsor equity has been created in every country, consistent with H1. Moreover, there are important differences between countries. In particular, sponsor equity of Heineken appears to be very high in Thailand both in the total sample (70.5% agree that the sponsorship caused favourable attitudinal and behavioural change) and among regular watchers (86.8% agree), and, to a lesser extent in Argentina (57.1% among regular watchers of UCL agree); the non-participating countries. In The Netherlands and France sponsor equity is relatively low (respectively 9.9% and 17.6% agree among regular watchers).

65
InternatIonal SpInoff effectS of league SponSorShIp
Table4.3Sponsor Equity in Different Countries
TopBoxI TopBoxII
Country Mean Sponsor Equity
SD Sponsor Equity
% Sponsor EquityTotal Sample
BinomialProportion95%ConfidenceInterval
% Sponsor EquityRegularWatchers UCL
BinomialProportion95%ConfidenceInterval
The Netherlands 1.98 .82 6.67% 5.19%- 8.43% 9.87% 7.29%-12.98%
France 2.22 1.00 13.84% 11.76%-16.14% 17.60% 14.36%-21.33%
Spain 2.63 .88 20.95% 18.91%-23.10% 28.77% 25.46%-32.26%
United Kingdom 2.41 .94 17.57% 15.19%-20.15% 21.76% 18.30%-25.54%
Italy 2.35 1.04 18.96% 16.97%-21.07% 25.23% 21.94%-28.74%
Poland 2.71 1.04 33.92% 31.02%-36.90% 44.39% 39.62%-49.24%
Greece 2.55 1.05 29.51% 27.08%-32.04% 35.61% 32.03%-39.32%
Thailand 3.60 .77 70.52% 67.94%-73.01% 86.76% 83.49%-89.59%
Argentina 2.81 1.11 39.17% 35.85%-42.56% 57.14% 50.38%-63.71%
Notes: First and second column: mean scores (on a five-point scale) and standard deviation for sponsor equity per country.Third and fourth column: top-box proportion of respondents with a mean score higher than three on the sponsor equity statements (agree that the sponsorship has contributed favourably to sponsor brand equity) and binomial confidence interval for top-box I.Fifth and sixth column: top-box proportion of regular UCL watching respondents with a mean score higher than three on the sponsor equity statements (agree that the sponsorship has contributed favourably to sponsor brand equity) and binomial confidence interval for top-box II.
4.5.2 DriversofSponsorEquityTo investigate the different drivers of sponsor equity we conducted regression analysis. The results can be found in Table 4.4. Our findings reveal that country participation as expected has a significant effect on sponsor equity. However, in contrast to H2, we find that sponsor equity is higher in non-participating countries than in participating countries (β̂ =.724, p < .001).

66
CHAPTER 4
Table 4.4 Regression Results Model I
ModelwithMainEffects ModelwithInteractionEffects
Variable β̂ SE β̂ SE
Intercept -.354*** .060 2.467*** .036
Brand usage (reference: users) -.038 .020 .015 .022
Personal liking of the event -.069*** .014 .051*** .015
Perceived status of the event -.231*** .013 .215*** .015
Perceived fit -.285*** .009 .265*** .010
Non Participating Country (reference: participating countries): -.724*** .024 .681*** .029
Time (reference: December 2006): May 2007 -.008 .025 -.011 .025
December 2007 -.015 .025 .014 .025
May 2008 -.054* .025 .050* .025
Gender (reference: female) -.140*** .020 -.135*** .020
Age -.001 .001 .001 .001
Education (reference: high):low -.084** .027 .088** .027
middle -.037 .021 -.035 .021
Personal liking*Non Participating Country .101** .036
Status*Non Participating Country .078* .035
Fit*Non Participating Country .113*** .026
Brand usage*Non Participating Country .106* .053
Adjusted R2
F .270320.908***
.275246.933***
Notes: reference category in parentheses, *p < .05, **p < .01, ***p < .001.
Perceived status, personal liking of the event and perceived fit all have a significant, positive influence (p < .001) on sponsor equity. These findings thus provide support for Hypothesis 4a, 5a and 6a. However, we did not find a significant effect of brand usage on sponsor equity so Hypothesis 3a is not supported.As for the control variables, time seems to have a positive effect where sponsor equity is lower at the first measurement point than at the last measurement (p < .05). Furthermore, sponsor equity is lower among males than among females and respondents with a low educational level show higher sponsor equity than those with a high education level. Lastly, the effect of age on sponsor equity is not significant.
4.5.3 InteractionEffectsHypotheses 3b, 4b, 5b and 6b were formulated to allow for moderating effects of country participation on the relation between individual characteristics and sponsor equity. We hypothesized that the effect of brand usage, personal liking, perceived status and perceived fit is higher in non-participating countries than in participating countries.

67
InternatIonal SpInoff effectS of league SponSorShIp
To explicitly test these hypotheses, we estimated our research model with interaction effects between country participation and the antecedents of sponsor equity. Consistent with H3b, we find that the effect of brand usage (β̂ = .106, p < .05) is stronger in non-participating countries than in participating countries. Likewise, personal liking (β̂
= .101, p < .01) and perceived status (β̂ = .078, p < .05) are stronger predictors of sponsor equity in non-participating countries as opposed to participating countries, which is in line with H4b and H5b. In a similar vein perceived fit (β̂ = .113, p < .001) has a stronger influence on sponsor equity in non-participating countries, so we may accept H6b.
4.5.4 RegressionwithCountry-SpecificEffectsTo further investigate the cross-national differences in sponsor equity, we estimated a model with separate country dummy variables instead of the country participation variable. The results can be found in Table 4.5. In this model differences in sponsor equity between countries are picked up by the country dummy variables. The results with regard to testing of our hypotheses do not change but the findings provide additional insights regarding country specific effects. Particularly, compared to the reference country Argentina, sponsor equity is significantly lower in all countries (varying from β̂ = -.684 in The Netherlands to β̂ = -.168 in Poland), except in Thailand where sponsor equity is significantly higher with β̂ = .727.In addition, because sponsor equity is particularly high in Thailand and Argentina, we conducted a regression analysis including interaction effects between these countries individually and perceived fit, perceived status of the event and personal liking of the event. We found several significant interaction effects. Particularly, both in Thailand (β̂ = .116) and Argentina (β̂ = .091) perceived fit is a stronger predictor of sponsor equity than in the participating countries. Furthermore, perceived status is a stronger predictor in Thailand (β̂ = .104) than in the participating countries. The interaction effects with personal liking of the event are not significant.

68
CHAPTER 4
Table4.5Regression Results Model II
ModelwithMainEffects ModelwithInteractionEffects
Variable β̂ SE β̂ SE
Intercept -.636 .064 2.647 .049
Brand usage (reference: users) -.007 .020 .005 .020
Personal liking of the event -.061*** .014 .055*** .015
Perceived status of the event -.211*** .013 .198*** .015
Perceived fit -.283*** .009 .265*** .010
Country (reference: Argentina): The Netherlands -.684*** .042 -.700*** .046
France -.370*** .043 -.389*** .047
Spain -.076* .039 -.088* .043
United Kingdom -.267*** .044 -.279*** .047
Italy -.490*** .041 -.496*** .045
Poland -.168*** .041 -.167*** .046
Greece -.374*** .039 -.373*** .044
Thailand -.727*** .040 .661*** .048
Time (reference: December 2006): May 2007 -.001 .024 -.001 .024
December 2007 -.023 .024 .022 .024
May 2008 -.059* .025 .056* .025
Gender (reference: female) -.099*** .019 -.096*** .019
Age -.003*** .001 .003*** .001
Education (reference: high): low -.201*** .027 .200*** .027
middle -.075*** .023 .074*** .023
Personal liking*Thailand -.008 .048
Personal liking*Argentina .068 .051
Status*Thailand .104* .053
Status*Argentina .030 .041
Fit*Thailand .116** .037
Fit*Argentina .091** .032
Adjusted R2
F.314
250.248***.316
192.531***
Notes: reference category in parentheses. SE=standard error. *p < .05, **p < .01, ***p < .001. Personal liking*Thailand = interaction between personal liking of the event and a dummy variable for country Thailand. Personal liking*Argentina=interaction between personal liking of the event and a dummy variable for country Argentina. Status*Thailand= interaction between perceived status of the event and a dummy variable for country Thailand. Status*Argentina= interaction between perceived status of the event and a dummy variable for country Argentina. Fit*Thailand= interaction between perceived fit and a dummy variable for country Thailand. Fit*Argentina= interaction between perceived fit and a dummy variable for country Argentina

69
InternatIonal SpInoff effectS of league SponSorShIp
4.6 Discussion
Because major sport events are increasingly broadcasted globally, the international character of related sponsorships cannot be neglected. Sponsorship managers are investing considerably to reach their target markets in multiple countries with a single sponsorship. To date, however, research of consumer responses to sponsorship conducted on an international basis, has been scarce. Therefore, the question remains whether sponsorship is effective in reaching consumer target markets in multiple countries at the same time and, more specifically, in countries not participating in a sponsored event. Thus the main purpose of this study is to investigate consumer’s responses to sponsorship in different countries. The context of the study is Heineken’s sponsorship of UEFA Champions League, the prestigious European soccer competition for club teams.Our findings suggest that sponsorship can create sponsor equity in multiple countries, and that effects are not restricted to the countries participating in an event. This finding thus provides a solid argument for investing in international sponsorship to reach international target markets and it implies that sponsorship can reach the target group in countries where an event is broadcasted, regardless of the nation’s level of participation in the event. In fact, we even find a negative effect of country participation on sponsor equity. As we argued, this result may be attributed to a higher degree of distraction, so a lower degree of attention and cognitive processing of league sponsor messages in participating countries versus nonparticipating countries. Future research could explore this finding further, for example for other sponsorship projects.With regard to the other antecedents of sponsor equity, we find that across countries perceived fit, personal liking of the event and perceived status of the event were found to be important predictors of sponsor equity, which is in line with our hypotheses based on findings in prior research. Thus, it is recommendable to take these factors into account in any target market when selecting, managing and leveraging a sponsorship agreement. For sponsor managers this implies selecting sponsored objects which the target group likes and/or properties with a relatively high level of perceived status among the target group. In addition, sponsor managers should devote attention to the issue of perceived fit when selecting a property. When there is no natural fit between the sponsor and the event, it is worthwhile to consider the possible creation of fit. Through investments in leverage activities directed at explaining the link between a sponsor and sponsored property, fit can be established when the connection is not obvious at first sight. Furthermore, we found the effect of brand usage, personal liking of the event, perceived status and perceived fit to be stronger in countries without a club team participating in UCL. Thus, particularly in countries without a direct affiliation to the sponsored event, sponsors should invest in proper research of interests, attitudes and opinions of the target group. Furthermore, especially in these countries it is important to develop

70
CHAPTER 4
leverage activity directed at creating a strong perception of the link between sponsor and sponsored object. Our results also point out significant differences in sponsor equity between indivual countries. This might imply that sponsorship is more effective in one country than in another due to inherent country differences. Therefore, we recommend sponsor managers and/or international marketers to investigate differences between countries before entering a sponsorship agreement to be able to profit more from the agreement and to be able to optimally design sponsorship leverage activities. There are several possible explanations for cross-national differences, which provide interesting opportunities for further exploration. First, different perceptions of the brand in question may persist between countries. Particularly, the relatively low degree of sponsor equity in The Netherlands might be explained by the fact that this is the home country of the sponsoring brand. In The Netherlands Heineken is a mainstream, well-known brand, so a strong image of the brand was already developed before the sponsorship, implying that the net change in brand equity resulting from the sponsorship was possibly smaller here than in other countries. As Carrillat, Lafferty and Harris (2005) postulate, for familiar brands the effect of sponsorship on consumers’ attitudes and purchase intentions is lower than for non-familiar brands because strong brand associations are less likely to change due to sponsorship than neutral or mild associations. An alternative explanation involves the conditions in the sponsorship market, where the sponsorship market in Europe may be considered more mature than in Thailand and Argentina. More specifically, sponsorship efficacy might decrease with the maturity of the sponsorship market, because of the resulting higher level of clutter. Clutter may cause consumers to be less likely to notice sponsors, which lowers the probability of higher-level processing (Cornwell et al., 2000). Another important condition involves the differences in sponsorship and advertising regulation between countries. Specifically relevant to this research are country differences in regulations for alcohol brands in advertising their product, as Heineken produces an alcoholic product. For example, in France a restriction on alcohol advertising in France (Loi Evin) prohibits brand name exposure on billboards in stadiums, which might alter sponsor equity in a negative way.Then, different perceptions of (European) soccer and UEFA Champions League may persist across countries. Particularly, European soccer and UEFA Champions league are generally associated with high status, top performance and starplayers in South America and Asia (Chadwick & Holt, 2008), which could be related to favourable consumer outcomes of sponsorship in these continents. Lastly, cultural differences may cause differences in consumer reaction to sponsorship. With regard to the culture scales developed by Hofstede (2001), the countries included in this study differ substantially, which might alter general response to sponsorship. For example, following our results, it seems that in the countries scoring relatively high

71
InternatIonal SpInoff effectS of league SponSorShIp
on individualism (The Netherlands and United Kingdom), the change in brand equity resulting from sponsorship is lower than in more collectivistic nations (such as Thailand, Greece and Argentina). Group identification and involvement among sports fans could be stronger in collectivistic countries, which might explain more positive responses to the sponsorship and higher sponsor equity.
4.7 Limitations and Directions for Future Research
There are several limitations to this study, which provide interesting opportunities for further research. First, although this study is one of the first international comparative studies of sponsorship effects, it is limited in the sense that a single sponsor and a single sponsorship property are investigated. Therefore, one should be careful in generalizing the results. We would welcome further investigations of consumer responses to sponsorship across multiple countries and in other sponsorship contexts particularly addressing the effect of country differences discussed earlier. Secondly, we did not include individual general attitude towards the practice of sponsorship as a predicting variable, although this might influence one’s response to particular sponsorships (e.g. Roy & Graeff, 2003), as was also discussed in Chapter 2 of this thesis. We recommend to investigate general attitude towards sponsorship and the effects on consumer responses to specific sponsorships in different countries. As the acceptability scale in product placement (Gould et al., 2000), a cross-culturally validated scale for attitude towards sponsorship could be developed. This would also be helpful to international sponsorship managers to investigate the appropriateness of sponsorship in certain target markets.Third, it would be interesting to further investigate country-of-origin effects in the context of sponsorship. Previously, it has been found that consumers react differently to products and brands with different countries of origin, where certain countries are valued more positively than others (Pappu, Quester, & Cooksey, 2006). For sponsorship, country of origin can be important in two ways; both the country of origin of the sponsoring brand, as well as the country of origin of the sponsored object might (positively or negatively) influence consumers’ response to sponsorship. Lastly, the sponsor equity variable included in this research was based on consumers’ self-reported change in brand attachment and behavioural intent due to the sponsorship. Although considered valuable for isolating the effect of the sponsorship stimulus, it has been suggested previously that self-reported measures do not always predict behaviour, for example increased purchase intentions do not automatically translate into increased sales (Chandon, Morwitz, & Reinartz, 2005). Moreover, it has been argued that people may experiences difficulties in reflecting on higher-order cognitive processes (Nisbett & Wilson, 1977). Therefore, future research could focus on the relation between sponsorship exposure and changes in sponsoring brand evaluation, as well as on investigating

72
CHAPTER 4
changes in actual consumer behaviour for example by using consumer scanner data or observational techniques.

73
Chapter 5
Benchmarking Sponsorship Performance: the Level of Efficiency in the Dutch Sports
Sponsoring Market5
5 This chapter is based on Walraven, M., Koning, R.H., Bijmolt, T.H.A., and Los, B.L. (2013), Benchmarking sponsorship performance: efficiency analysis of the Dutch sports sponsoring market, working paper, University of Groningen.

74
CHAPTER 5
5.1 Introduction
Over the last few decades the international sponsorship market has been growing rapidly, where the lion’s share of financial resources is devoted to sponsorship of sports properties. In particular, PricewaterhouseCoopers (PwC) projects a worldwide increase in spending on sports sponsorship to $45.3 billion in 2015 (PricewaterhouseCoopers, 2011).Generally, there is a growing consensus that marketing expenditures should be made more accountable (e.g. Rust, Ambler, Carpenter, Kumar, & Srivastava, 2004). Likewise, the efficiency of sports sponsorship is questioned in the light of the significant investments required to become an official sponsor of major events, federations or teams. However, despite the high investments in sports sponsorship and the resulting growing pressure on managers to demonstrate the returns, many companies do not evaluate their sponsorships properly (Crompton, 2004). In this paper we present a method for evaluating sponsorship performance.Sponsorship effect measurement is in practice often based on exposure reports, which only provide insight in the ‘opportunity to see’ a sponsorship linkage, whereas the particular consumer impact of sponsorship remains unknown (Cornwell et al., 2005; Olson, 2010). Some sponsors pursue a step further by incorporating sponsorship information in their brand tracking procedures, thus evaluating consumer processing of sponsorship. However, in this way only a single output variable is analysed, whereas sponsorship can have multiple outputs. Furthermore, information about the input resources used (sponsoring budgets) and about other sponsorships is generally not incorporated, so benchmarking sponsorships’ relative performance is currently a bridge too far in business practice. In previous academic research, the issue of sponsorship outcomes has been addressed by examining differences in output variables (awareness, attitude, purchase intent and share prices) over time, between groups and for different sponsors (e.g. Miyazaki & Morgan, 2001; Nufer & Bühler, 2010; Quester & Farrelly, 1998). In addition, scholars investigated the effect of one or more antecedents (for example perceived fit and involvement of the target audience) on one or more output variables (e.g. Olson, 2010; Speed & Thompson, 2000). Thus, previous research suggests several factors that contribute to higher sponsorship outcomes, but the relative performance of different sponsorships taking into account different sponsorship budgets has not yet been investigated. Therefore, the contribution of the present study is 1) to examine relative efficiency of sports sponsorships and relating sponsorship (in)efficiency to project characteristics, and, 2) to present and illustrate Data Envelopment Analysis (DEA) as a method for benchmarking sponsorship efficiency. We apply DEA on a sample of the largest Dutch sponsorships to evaluate the relative performance in terms of effect-to-budget ratio. Thereby, this chapter offers sponsorship managers an alternative method for evaluating and benchmarking their sponsorships. Additionally, we investigate which sponsorship

75
Benchmarking SponSorShip performance: the LeveL of efficiency in the Dutch SportS SponSoring market
characteristics (such as the type of product being promoted and the age of the project) affect sponsorship efficiency by using the DEA scores of the different sponsorships as a dependent variable in a Tobit regression model.
5.2 Previous Research
Table 5.1 summarizes previous research relevant to this study. As the present study is concerned with the efficiency of sponsorships, we discuss earlier work on sponsorship effects and efficiency studies in the related fields of marketing and sports.
Table5.1:Previous research approaches to investigate sponsorship effectiveness and efficiency
Research Stream Appliedmethod Selectedreferences&effectstudied
Consumer processing of sponsorship
Different techniques: multivariate & experimental analyses
• Wakefield & Bennett (2010); Wakefield, Becker-Olsen & Cornwell (2007): sponsorship awareness
• Pope, Voges & Brown (2009): sponsee–sponsor image transfer
• Speed & Thompson(2000); Olson (2010): attitude toward the sponsorship and the sponsor
Capital market effects of sponsorship
Event Study Analysis • Miyazaki & Morgan (2001); Reiser, Breuer & Wicker (2012): shareholders’ reaction to sponsorship
Benchmarking efficiency of marketing instruments
Data Envelopment Analysis
• Büschken, 2007; Färe, Grosskopf, Seldon, & Tremblay, 2004; Lohtia, Donthu, & Yaveroglu, 2007; Luo & Donthu, 2001: efficiency of advertising campaigns
• Donthu, Hershberger & Osmonbekov, 2005; Donthu & Yoo, 1998: retailer efficiency
Benchmarking performance of sports properties
Data Envelopment Analysis
• Haas (2003); Pestana Barros & Leach (2006): efficiency of soccer clubs
Previous studies of sponsorship effects have focused mainly on consumer processing of sponsorship or on capital market effects of sponsorship announcements. Various articles have been published about consumer responses to sponsorship, investigating for example sponsorship awareness (e.g. Wakefield & Bennett, 2010), sponsee–sponsor image transfer (e.g. Pope et al., 2009) or attitude toward the sponsorship (Olson, 2010). These studies provide valuable insights into the various determinants of sponsorship processing and how consumer reactions to sponsorship differ across sponsors and over time. However, the required resources for sponsorships have not yet been taken into account, so an explicit comparison of the efficiency (i.e. the actual effect in relation to the

76
CHAPTER 5
maximum attainable effect given the underlying investment) of different sponsorships has not been possible. Moreover, many times a single output variable (such as awareness) is investigated, whereas sponsors can have multiple objectives and thus would like to take more than one effect into account. Another stream of research takes an event study approach to analyze how shareholders value corporate announcements of sponsorship investments (e.g. Miyazaki & Morgan, 2001; Reiser et al., 2012). This approach enables an objective financial estimate of sponsorship return which can be directly compared to sponsorship investment. However, with this method one gains insight in the relative impact of sponsorship on shareholders, whereas the impact of sponsorship on the primary communication target group, consumers, is not incorporated. Furthermore, since not all sponsors are publicly listed, the method is not suitable to compare performance of all sponsorships.This study is concerned with the relative efficiency of sponsorship projects. In this regard, we propose Data Envelopment Analysis (DEA) as a method of investigation, as DEA allows benchmarking the performance of different sponsorships. We believe this is an important extension of previous research, because the relation between consumer impact of sponsorship and underlying sponsorship budgets is considered. Moreover, it is possible to incorporate multiple consumer outcomes of sponsorship without having to subjectively assign fixed output weights, which enables measuring the impact of sponsorship along multiple dimensions (for example sponsorship familiarity and attitude towards the sponsorship).Previously, DEA has been used both in marketing and in sports research to investigate relative performance of properties. To the best of our knowledge though, DEA has not yet been applied in sponsorship research. Examples of the application of DEA in marketing include estimating and evaluating the relative efficiency of advertising campaigns (e.g. Büschken, 2007; Färe, Grosskopf, Seldon, & Tremblay, 2004; Lohtia, Donthu, & Yaveroglu, 2007; Luo & Donthu, 2001) and benchmarking retailer efficiency (e.g. Donthu, Hershberger, & Osmonbekov, 2005; Donthu & Yoo, 1998). Büschken (2007), for instance, investigated advertising efficiency for 35 brands in the German car market and in this way identified efficient brands and overall advertising market efficiency. In sports literature DEA has been applied to investigate relative performance with samples of athletes or clubs. For example, Haas (2003) measures efficiency of Major League Soccer clubs with points awarded, number of spectators and revenues as output variables. Likewise, Pestana Barros and Leach (2006) evaluate the performance of English Premier League soccer clubs through applying DEA. From these studies we learn that the purpose of DEA fits very well in a sports context where benchmarking performance is crucial.

77
Benchmarking SponSorShip performance: the LeveL of efficiency in the Dutch SportS SponSoring market
5.3 Determinants of Sponsorship Efficiency
While this study is concerned with the estimation of efficiency of sponsorships, it is also important to investigate what determines differences in sponsorship efficiency. Previous research reveals several sponsorship characteristics that affect consumer processing of sponsorship. We hypothesize that these factors also have a significant influence on sponsorship efficiency because our DEA output variables constitute sponsorship familiarity and attitude towards the sponsorship measures. The specific hypotheses are discussed below.
5.3.1 SponsorshipClutterIt is generally assumed that sponsorship exposure positively influences sponsorship cognitive and affective processing (Olson & Thjømøe, 2003; Wakefield et al., 2007). Popular sponsorship properties normally have multiple sponsors at different sponsorship levels. This has consequences for the exclusivity in sponsorship exposure. In this respect, Wakefield et al. (2007) find that high-level sponsorships, which generally offer a higher degree of exclusivity and more prominent exposure, achieve higher sponsorship awareness levels than lower-level sponsorships. Furthermore, Cornwell et al. (2000) report that environmental clutter, measured by the total number of promotional communications at an event, negatively impacts sponsor recall and recognition. Likewise, Breuer and Rumpf (2012) find that higher clutter in sponsorship signage exposure leads to lower attention. In an advertising context, Danaher, Bonfrer & Dhar (2008) find that advertising effectiveness is negatively affected by the number of advertisements by competing brands.Therefore, we hypothesize that sponsorship clutter is negatively related to sponsorship efficiency, because the level of exclusivity is lower, making it more difficult for consumers to identify a sponsor.
H1: Sponsorship efficiency is negatively related to sponsorship clutter.
5.3.2 SponsorshipDurationCornwell, Roy and Steinard II (2001) find that sponsorship managers generally believe that the longer the duration of a sponsorship agreement, the higher the contribution to brand equity objectives. In chapter 3 and 4 of this thesis we found a positive effect of sponsorship duration on consumer cognitive and affective processing of sponsorship. Several other authors find a positive impact of sponsorship duration on sponsorship awareness (McAlister et al., 2012; Pitts & Slattery, 2004). Therefore, we expect a positive relationship between sponsorship duration and sponsorship efficiency.
H2: Sponsorship efficiency is positively related to sponsorship duration.

78
CHAPTER 5
5.3.3 SportsPopularityInvolvement of the target group with the sports category is considered an important factor in sponsorship processing, as can be concluded from chapter 3 of this thesis. Ko et al. (2008) also reports that sports involvement is an important determinant of sponsorship awareness. Furthermore, Gwinner and Bennett (2008) find that sport identification is positively related to the level of sponsor-event fit. Likewise, Olson (2010) finds that involvement with the sports category is positively related to attitude towards the sponsorship. In this study, we include general sports popularity as a proxy for sports involvement as this is a sponsorship variable not directly controllable for a sponsorship manager, but it can be investigated before entering a sponsorship agreement. Because of the positive effects of sports involvement on sponsorship outcomes, we would expect a positive effect of sports popularity:
H3: Sponsorship efficiency is positively related to sports popularity.
5.4 Research Design
5.4.1 MethodfirstStage:DataEnvelopmentAnalysisTwo approaches to measure efficiency coexist: Data Envelopment Analysis (DEA) and Stochastic Frontier Analysis (SFA). DEA is a non-parametric method involving linear programming to construct a frontier of efficient “Decision Making Units (DMUs)” whose performance is not dominated by any other DMU, while SFA methods are parametric and use econometric methods to estimate the frontier. In the present research, we use DEA because it does not require the functional form of the relation between inputs and outputs to be specified beforehand and because it can deal with multiple outputs (Coelli et al., 2005).DEA was introduced in the study by Charnes, Cooper and Rhodes (1978) and from this contribution onwards, the method was applied in numerous academic studies, especially in management and operations research (for a bibliography see Seiford, 1997; Tavares, 2002). The first DEA model (Charnes, et al., 1978) assumed constant returns to scale. Later on various authors (i.e. Banker, Charnes, & Cooper, 1984) suggested an extension by allowing scale effects to play a role. In this variable returns to scale approach a convexity constraint is added to the model specification, which yields efficient DMUs for various scales of operation. In the context of this paper, it implies that the efficiency of sponsoring a famous soccer team (which is expensive) will not be benchmarked against sponsoring a young individual in a minor sport, but only to other projects with lots of money involved, even if the average “bang for the buck” would be higher for the best-performing inexpensive project than for the best-performing expensive project. After having obtained an estimated frontier, efficiency scores for all cases in the sample can be obtained. The efficiency score can be either input-oriented (by how much should

79
Benchmarking SponSorShip performance: the LeveL of efficiency in the Dutch SportS SponSoring market
inputs of the DMU be reduced to be efficient?) or output based (by which factor could outputs of the DMU increase to be efficient?).A technical though accessible introduction into the mathematics underlying the basic DEA models was provided by Coelli et al. (2005). Here, we focus on the intuition behind the method. Suppose an output-oriented example with one input and two outputs (q1 and q2). For any given input level one could draw an efficiency curve, connecting the efficient cases at that particular input level, such as depicted in figure 5.1 (Coelli et al., 2005). The efficient cases (those units that are on the efficiency frontier) are the DMUs with the highest combination of outputs for a particular level of input in comparison to the inputs and outputs of other comparable DMUs in the sample. In this example A, B and C are efficient. The efficiency frontier then envelopes the inefficient DMUs and the distance to the frontier marks the degree of inefficiency. The inefficient DMUs are benchmarked against the nearest cases on the frontier. Such efficient DMUs with similar output proportions are called the “peers”. In the example, inefficient DMU P is benchmarked against B and C (its peers), which produce the two outputs in roughly the same proportions as P. For this unit to be efficient, outputs should be increased to reach point P* on the frontier. The ratio between the distance from the origin to P and the distance from the origin to P* is the efficiency score for P. An efficient DMU like A does not play a role in determining the efficiency of P, because it is producing a completely different mix of the two outputs.
figure5.1Exampleofoutput-orientedDEA
- 96 -
comparable DMUs in the sample. In this example A, B and C are efficient. The efficiency
frontier then envelopes the inefficient DMUs and the distance to the frontier marks the degree
of inefficiency. The inefficient DMUs are benchmarked against the nearest cases on the
frontier. Such efficient DMUs with similar output proportions are called the “peers”. In the
example, inefficient DMU P is benchmarked against B and C (its peers), which produce the
two outputs in roughly the same proportions as P. For this unit to be efficient, outputs should
be increased to reach point P* on the frontier. The ratio between the distance from the origin
to P and the distance from the origin to P* is the efficiency score for P. An efficient DMU
like A does not play a role in determining the efficiency of P, because it is producing a
completely different mix of the two outputs.
Figure 5.1 Example of Output-oriented DEA
The application of DEA comprises of several steps. A crucial first step is the selection of the
input and output variables. It has been suggested that in order to apply DEA, input and output
variables should be positively correlated (Luo & Donthu, 2001), as DEA is a deterministic
method and variance in output data not captured by the input data will be attributed to
‘inefficiency’ (Büschken, 2007). Furthermore, the total number of variables included is an
important issue since a dimensionality problem may arise when the number of included
variables is large compared to the sample size (Coelli et al., 2005). This dimensionality
The application of DEA comprises of several steps. A crucial first step is the selection of the input and output variables. It has been suggested that in order to apply DEA, input

80
CHAPTER 5
and output variables should be positively correlated (Luo & Donthu, 2001), as DEA is a deterministic method and variance in output data not captured by the input data will be attributed to ‘inefficiency’ (Büschken, 2007). Furthermore, the total number of variables included is an important issue since a dimensionality problem may arise when the number of included variables is large compared to the sample size (Coelli et al., 2005). This dimensionality problem may cause a large number of firms to be efficient. The input and output variables used this study are discussed in section 5.4.2 and 5.4.3.When data for the selected input and output variables have been collected, efficiency scores for each DMU can be calculated by running DEA. Before doing this, one has to choose for an input or output orientation, and decide whether the constant returns to scale model or the variable returns to scale model is more appropriate. Input- and output-oriented models produce the same set of efficient cases, only the efficiency scores of the inefficient cases may differ (Coelli et al., 2005). The choice between the two options regarding orientation depends on whether it is more plausible to assume that decision-makers have discretionary control over the input or that they have control over the output levels. In the former case, inputs should be minimized to attain the output level and an input-orientation makes most sense. For the purpose of this research, we choose the input orientation, because we assume that sponsorship objectives are set before a sponsored property is selected and before budgets are allocated. When it is expected that an increase in inputs does not result in a proportional change in outputs, a model which allows for variable returns to scale is more appropriate than a model assuming constant returns to scale. As we do not expect that an increase (decrease) in sponsorship budget results in a proportionate increase (decrease) in the outputs, we estimate a variable returns to scale DEA model, to control for different economies of scale in sponsorship projects. When efficiency scores have been calculated, inspection of the individual case results (including an analysis of peers) allows one to calculate by how much inputs (outputs) could be reduced (increased) in order to become efficient. Furthermore, it is recommendable to check the robustness of the efficiency scores by estimating alternative DEA models comprising different combinations of input and output variables. This provides further insight in the conditions under which different DMUs are (in)efficient. As a final step, DEA scores can be used as a dependent variable in a regression function to identify the different factors that influence (in)efficiency. These regressions contain so-called “environmental” variables. These are assumed to be beyond the short-run control of the decision-maker, but could at least partly explain differences in efficiency scores across DMUs.
5.4.2 InputVariablesforDEALuo and Donthu (2001) suggest several ways of defining inputs for measuring advertising efficiency, including dollars spent on advertising campaign development, the length of the campaign and media budgets. We stay close to their choice of input variables.

81
Benchmarking SponSorShip performance: the LeveL of efficiency in the Dutch SportS SponSoring market
Because we want to analyse efficiency on the sponsorship level rather than on the brand/sponsor level, we selected estimated yearly spendings per sponsorship as input variable for the DEA analysis. These input data come from the Sponsor50, a market research report including data on the 50 Dutch firms with the largest total sponsorship budgets. The report is published every year in March after the respective calendar year; we used the 2011 data. The information included in the report includes a listing per sponsor of sponsored properties with estimated spending, total estimated sponsorship budget (exclusive of leverage budgets) and total gross media investments. In total we collected data on 72 sponsorships involving sponsors from different industries. The selected sponsorships include sports properties and have an estimated budget of at least €100,000. We excluded endorsement deals and sponsorships in which the corporate brand is not communicated. Some sponsors are involved with different sponsored properties and some properties have more than one sponsor, so there exists some overlap at both sides, although every sponsorship (the combination of sponsor and sponsored property) is unique.
5.4.3 outputVariablesforDEAAs the purpose of this study is determining the effectiveness of different sponsorships, we chose to select output data on the sponsorship level (relating spending per sponsorship project to project-specific sponsorship outcomes), rather than including output data on the firm or brand level (relating spending on sponsorships to firm- or brand-specific outcomes). As explained above, several of the selected sponsoring firms are involved in multiple sponsorship projects, so we want to isolate the efficiency of individual projects, which is difficult with brand or firm level data. Moreover, we expect sponsorship-specific output data to be more strongly correlated to sponsorship budgets than output data on the firm level, which is desirable given the deterministic nature of DEA. Output data on the firm or brand level such as market share or brand-perception figures are influenced by many other variables than sponsorship, so the relation between inputs and outputs might be diluted. Additionally, we believe sponsorship-specific data are better comparable than output data on the firm level for sponsoring firms operating in different industries. Brand equity objectives, such as awareness, image and brand preference, are generally among the most often mentioned reasons for companies to engage in sponsorship (Crompton, 2004; Olson, 2010). To achieve these objectives, consumer processing of sponsorship is considered a crucial condition (Cornwell et al., 2005), see also chapter 2 of this thesis for a discussion. Therefore, we selected several sponsorship-specific output variables, measuring the extent of consumer processing of sponsorship at a cognitive (sponsorship familiarity) and attitudinal level (attitude towards the sponsorship and perceived sponsorship fit). Sponsorship familiarity is selected because it is considered a necessary step for higher-level processing of the sponsorship (Johar et al., 2006; Wakefield and Bennett 2010). Furthermore, attitude towards the sponsorship (Olson,

82
CHAPTER 5
2010; Simmons & Becker-Olsen, 2006) and the level of fit (Gwinner & Bennett, 2008; Speed & Thompson, 2000) have been shown to determine consumer affective and conative responses towards the sponsor. To collect output data, we designed a short, online, one time survey for a representative online panel of Dutch consumers older than 16 years. Members of the panel participate regularly in different surveys and the management of the panel attempts to keep respondents as long as possible and to motivate them to answer questions seriously. In total, 1906 of the 2746 panel members filled in the questionnaire; a response rate of 69.4%. Each panel member answered the same questions for a maximum of eight sponsors. As a result, the output scores per sponsorship are based on a minimum of 172 and a maximum of 200 respondents. Output data were collected in May 2012 so before the large sports events that year. Moreover, the doping scandal in professional cycling (the confession of Lance Armstrong) was not yet revealed when output data were collected, which implies that the outcomes could not have been influenced by this event. Our output data are similar to the output variables selected by for example Lohtia et al. (2007), who included ad-related measures, such as attitude towards the ad and ad recall, to evaluate the efficiency of banner advertisements. The output variables in this study are measured per sponsorship as follows:
• Sponsorship Familiarity: “Did you know (brand X) is sponsor of (sponsored property X)?”: percentage of
respondents answering yes.• Attitude towards the sponsorship: “I appreciate the sponsorship by (Brand X) of (sponsored property X)”: Five point
Likert-type scale with anchors completely disagree-completely agree, recoded as percentage of respondents answering agree or completely agree.
• Perceived fit: “(Brand X) fits as a sponsor of (sponsored property X)”: Five point Likert-type scale with anchors completely disagree-completely agree,
recoded as percentage of respondents answering agree or completely agree.
Table 5.2 displays descriptive statistics and correlations between the input variable and the different output variables. As discussed, an important requirement of DEA is that inputs and outputs are positively and significantly correlated (Luo & Donthu, 2001). As can be seen the different output variables fulfil this criterion. Furthermore, because we restricted the number of variables to a single input variable and three output variables, the before-mentioned dimensionality problem is limited compared to other studies focusing on efficiency of marketing projects.

83
Benchmarking SponSorShip performance: the LeveL of efficiency in the Dutch SportS SponSoring market
Tabl
e 5.
2 D
escr
iptiv
es a
nd C
orre
latio
ns b
etw
een
Inpu
t and
Out
put V
aria
bles
Vari
able
Mea
nSD
Min.
25Percenti
le50
Percenti
le75
Percenti
leMax.
Correlati
on
wit
h in
put
Inpu
t var
iabl
e:Sp
onso
rshi
p bu
dget
a20
88.8
925
95.7
110
060
014
0024
2515
000
--
Out
put v
aria
ble:
Spon
sors
hip
Fam
iliar
ity23
.59%
18.6
9%3.
05%
9.48
%19
.00%
31.8
6%88
.37%
.505
**
Attitu
de to
war
ds th
e sp
onso
rshi
p33
.68%
7.98
%16
.75%
27.6
6%32
.68%
39.3
6%70
.47%
.393
**
Perc
eive
d fit
22.4
2%11
.36%
5.53
%15
.10%
20.9
2%28
.35%
58.5
5%.3
85**
N72
Not
es:
a Var
iabl
e in
thou
sand
s of
Eur
os*p
< .0
5, *
*p <
.01,
***
p <
.001
.
84
CHAPTER 5
5.4.4 MethodSecondStage:TobitModelAfter the DEA results have been analysed, we want to use the obtained efficiency scores as a dependent variable in regression analysis to investigate which sponsorship characteristics influence relative efficiency. Because the DEA efficiency scores are censored with an upper bound of 1 and a lower bound of 0, a traditional ordinary least squares approach is not appropriate. Therefore, we use the two-limit Tobit type (Heckman, 1979) to estimate our model. Luo and Homburg (2007) also apply this model in their investigation of DEA-estimated advertising and promotion efficiency. Our model specification is formulated as follows:
- 103 -
5.4.4 Method Second Stage: Tobit Model
After the DEA results have been analysed, we want to use the obtained efficiency scores as a
dependent variable in regression analysis to investigate which sponsorship characteristics
influence relative efficiency. Because the DEA efficiency scores are censored with an upper
bound of 1 and a lower bound of 0, a traditional ordinary least squares approach is not
appropriate. Therefore, we use the two-limit Tobit type (Heckman, 1979) to estimate our
model. Luo and Homburg (2007) also apply this model in their investigation of DEA-
estimated advertising and promotion efficiency. Our model specification is formulated as
follows:
iiiiiii xxxxxy εββββββ ++++++= 55443322110* (5.1)
= 0 if *iy ≤ 0
yi = *iy if 0 < *
iy < 1
= 1 if *iy ≥ 1.
where yi represents the observed efficiency of sponsorship i and *iy is the latent sponsorship
efficiency. The five variables that we include to explain effectiveness are x1i, the level of
clutter of sponsorship i, x2i, the duration of sponsorship i, x3i, the popularity of the sports
category of sponsorship i, x4i the sponsored property type, and x5i, the industry of sponsor i. ε i
is a normally distributed disturbance term.
We measure sponsorship clutter as the total number of sponsors involved with the property at
the same sponsoring level as the sponsor under consideration. Sponsorship duration is
measured by the number of past sponsorship contract years. Because sponsorship duration
may be determined simultaneously by efficiency (as one could expect efficient projects to be
continued more often than inefficient projects), we conduct a test for possible endogeneity of
(5.1)
where yi represents the observed efficiency of sponsorship i and y*i is the latent sponsorship efficiency. The five variables that we include to explain effectiveness are x1i,
the level of clutter of sponsorship i, x2i, the duration of sponsorship i, x3i, the popularity of the sports category of sponsorship i, x4i the sponsored property type, and x5i, the industry of sponsor i. εi is a normally distributed disturbance term. We measure sponsorship clutter as the total number of sponsors involved with the property at the same sponsoring level as the sponsor under consideration. Sponsorship duration is measured by the number of past sponsorship contract years. Because sponsorship duration may be determined simultaneously by efficiency (as one could expect efficient projects to be continued more often than inefficient projects), we conduct a test for possible endogeneity of sponsorship duration. Sports popularity is measured by a sports popularity index composed by Dutch research agency Duodecim based on the number of internet queries per sport category.Besides testing the formulated hypotheses, we want to investigate if sponsorship efficiency differs for different categories of sponsorship properties and sponsor industries. Therefore, we include dummy variables for the sponsorship property categories ‘league/event’ and ‘sports federation’, where team sponsorship serves as the reference category. Furthermore, we include four dummy variables for the important sponsor industry categories ‘beer brands’, ‘financial service providers’, ‘sports brands’ and ‘B2B services’, where the sponsors in other industries serve as a reference category.

85
Benchmarking SponSorShip performance: the LeveL of efficiency in the Dutch SportS SponSoring market
5.5 Results
5.5.1 EfficiencyAnalysisFigure 5.2 displays the distribution of the DEA scores. The efficiency scores of the total sample range from .016 to 1.0 with an average score of .29. As can be seen in the graph more than half of the sponsorships in the sample have low efficiency scores; close to 0. We found a total of nine of the 72 sponsorships to be efficient. This number of efficient DMUs is similar to the efficiency results of Luo and Donthu (2001), who found nine of 63 firms to be efficient. This similarity in results is plausible, because their research set-up is similar to ours with a sample including companies from different industries, a model consisting of five input/output variables in total (as opposed to four in our model) and a similar input variable definition, namely advertising budgets.
figure5.2DistributionoftheDEAScores
- 105 -
Figure 5.2 Distribution of the DEA Scores
Table 5.3 describes the properties of the nine efficient sponsorships. These projects involve
only six different sponsors, because three sponsors are efficient with two sponsorship
properties. These sponsors are the Amstel beer brand (sponsoring the cycling event Amstel
Gold Race and soccer team Ajax), insurance company Univé (sponsoring the Bam-Univé
marathon skating team and the Univé Gym Gala, a gymnastics event) and financial service
provider Rabobank (sponsoring two cycling properties: the professional Rabobank cycling
team and the Dutch cycling federation).
The efficient projects differ greatly from each other, as can be seen in Table 5.3. By far, the
Rabobank cycling team has the largest estimated budget with €15 million and the highest
score on familiarity, where perceived fit and attitude towards the sponsorship are also
relatively high. The other Rabobank sponsorship in cycling (with a moderate budget of
€600,000) might profit from this in terms of higher than average outputs, but we consider the
sponsorship projects independently. Philips with soccer team PSV Eindhoven has a large
budget (though it is only half the size of the budget for Rabobank cycling team) and achieves
the highest score on perceived fit and attitude towards the sponsorship. The sponsorship of the
010
2030
4050
Per
cent
age
0 .2 .4 .6 .8 1DEA score
Table 5.3 describes the properties of the nine efficient sponsorships. These projects involve only six different sponsors, because three sponsors are efficient with two sponsorship properties. These sponsors are the Amstel beer brand (sponsoring the cycling event Amstel Gold Race and soccer team Ajax), insurance company Univé (sponsoring the Bam-Univé marathon skating team and the Univé Gym Gala, a gymnastics event) and financial service provider Rabobank (sponsoring two cycling properties: the professional Rabobank cycling team and the Dutch cycling federation). The efficient projects differ greatly from each other, as can be seen in Table 5.3. By far, the Rabobank cycling team has the largest estimated budget with €15 million and the highest score on familiarity, where perceived fit and attitude towards the sponsorship are also relatively high. The other Rabobank sponsorship in cycling (with a moderate budget of

86
CHAPTER 5
€600,000) might profit from this in terms of higher than average outputs, but we consider the sponsorship projects independently. Philips with soccer team PSV Eindhoven has a large budget (though it is only half the size of the budget for Rabobank cycling team) and achieves the highest score on perceived fit and attitude towards the sponsorship. The sponsorship of the Amstel Gold Race cycling event has an average budget (€2 million) and relatively high scores on all output variables. In comparison, the Grolsch-FC Twente partnership yields slightly lower output scores, but still well above average, with a lower than average budget. In a similar vein, Amstel with the sponsoring of Ajax soccer team achieves above average results on perceived fit and attitude towards the sponsorship with a moderate budget.Essent achieves above average scores with a relatively low budget (€200,000), whereas the two projects of Univé (the marathon skating team and the gymnastics event) have the lowest budgets in the sample (both €100,000) average scores on attitude towards the sponsorship and lower than average scores on familiarity and perceived fit.To illustrate how DEA results can help individual sponsorship managers in improving the efficiency of a sponsorship, we conducted peer analyses for the two inefficient sponsorships with the highest efficiency score: financial service provider Aegon with the Dutch rowing federation (efficiency score .821) and beer brand Jupiler as the sponsor of the first division in Dutch soccer (.714). Aegon has an estimated sponsorship budget of €150,000 and output scores of 4.7% (familiarity), 19.1% (fit) and 37.1% (attitude). This sponsorship is compared to the efficient peers Univé with the speedskating team (estimated budget €100,000) and Essent with the Thialf ice stadium (estimated budget €200,000). If it had been efficient, the Aegon sponsorship would have attained the actual output levels with a sponsorship budget of about €123,000, instead of the actual €150,000). Jupiler (with a DEA score of .714) on the other hand has two different peers, namely Rabobank with the Dutch cycling federation and Amstel with the cycling race event. If it had been best-practice, the same effects on consumers would have been attained with a budget of about €928,000 instead of the actual €1,300,000.
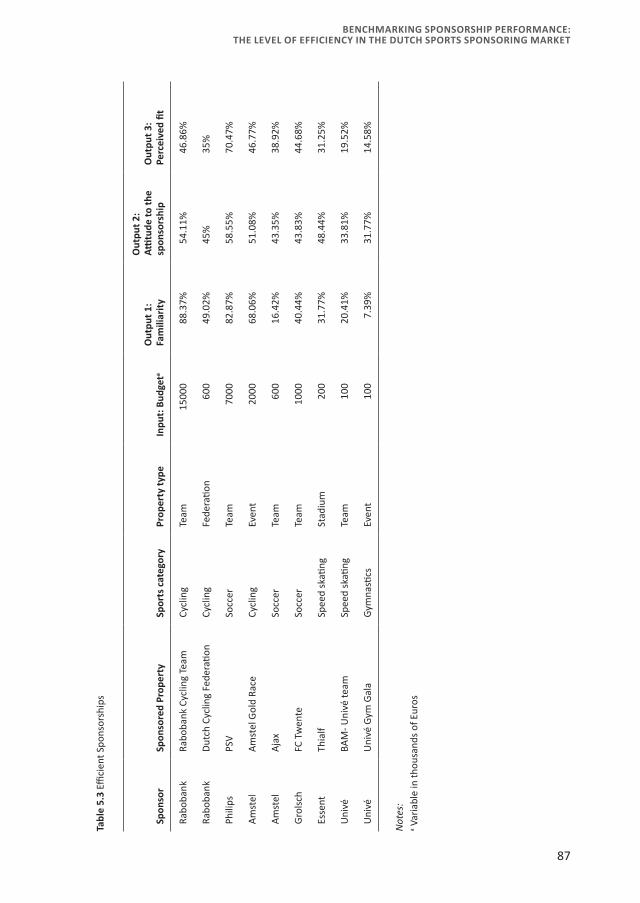
87
Benchmarking SponSorShip performance: the LeveL of efficiency in the Dutch SportS SponSoring market
Table5.3
Effici
ent S
pons
orsh
ips
Spon
sor
Spon
sore
d Pr
oper
tySp
ortscategory
Prop
erty
type
Inpu
t:Bud
geta
outpu
t1:
familiarity
outpu
t2:
Attitude
toth
esp
onso
rshi
poutpu
t3:
Perceivedfit
Rabo
bank
Rabo
bank
Cyc
ling
Team
Cycl
ing
Team
1500
088
.37%
54.1
1%46
.86%
Rabo
bank
Dut
ch C
yclin
g Fe
dera
tion
Cycl
ing
Fede
ratio
n60
049
.02%
45%
35%
Phili
psPS
VSo
ccer
Team
7000
82.8
7%58
.55%
70.4
7%
Am
stel
Am
stel
Gol
d Ra
ceCy
clin
gEv
ent
2000
68.0
6%51
.08%
46.7
7%
Am
stel
Aja
xSo
ccer
Team
600
16.4
2%43
.35%
38.9
2%
Gro
lsch
FC T
wen
teSo
ccer
Team
1000
40.4
4%43
.83%
44.6
8%
Esse
ntTh
ialf
Spee
d sk
ating
Stad
ium
200
31.7
7%48
.44%
31.2
5%
Uni
véBA
M- U
nivé
team
Spee
d sk
ating
Team
100
20.4
1%33
.81%
19.5
2%
Uni
véU
nivé
Gym
Gal
aG
ymna
stics
Even
t10
0 7
.39%
31.7
7%14
.58%
Not
es:
a Var
iabl
e in
thou
sand
s of
Eur
os

88
CHAPTER 5
Furthermore, as an example, we conducted the same analysis for a relatively inefficient project: the Nike sponsorship of the Dutch soccer federation (DEA score: .073). This sponsorship has an estimated budget of €7.5 million and output scores of 22.12% (familiarity), 37.69% (perceived fit), and 42.21% (attitude towards the sponsorship). These output scores follow a similar pattern as the output scores of Essent with the Thialf Ice stadium, Amstel with Ajax soccer team and Grolsch with FC Twente soccer team and therefore these three efficient sponsorships are assigned as peers (with the highest importance for Amstel of .680, compared to .229 for Essent and .091 for Grolsch). The peer projects have lower budgets though, which causes the low efficiency score for Nike soccer federation sponsorship. If this sponsorship had been efficient, the targets would have been attained with a budget of about € 544,928. These kind of results should warrant further investigation by the sponsor and they should be interpreted carefully, because it does not automatically mean that the sponsorship is invaluable or not worth the investment made. Rather a score like this may be treated this as a signal and starting point for evaluation of the objectives of the sponsorship, the characteristics of peer projects and input and output measurements. In paragraph 5.5.3 we will investigate which sponsorship characteristics may influence sponsorship (in)efficiency and in section 5.6 we will elaborate further on the interpretation of DEA results.
5.5.2 AlternativeDEAmodelsTo assess the robustness of our results regarding the efficient set of sponsorships and to gain further insights into the causes of efficiency, we estimated three alternative DEA models, each with a different combination of two of the three output variables. The correlations with the original DEA model are high; .934 for DEA2, .896 for DEA3 and .998 for DEA4, which supports the robustness of our results. Table 5.4 provides an overview of the efficiency scores and rankings of the 20 best performing sponsorships for the three different models. In DEA model 2 we used only attitude towards the sponsorship and sponsorship awareness as output variables. Thus, we excluded perceived fit from the model. Compared to the first DEA, we found seven sponsorships remaining efficient. Two sponsorships became inefficient compared to the first DEA model; both soccer sponsorships with a beer brand as sponsor (Amstel sponsoring Ajax and Grolsch sponsoring FC Twente). This strongly suggests that the level of perceived fit between these beer brands and the soccer clubs was high, which causes high sponsorship efficiency when fit is included as an output variable.Next, we estimated DEA model 3 with perceived fit and attitude towards the sponsor as output variables, so excluding sponsorship familiarity. In this case, we also found seven efficient sponsorships. Compared to the baseline DEA model, two sponsorships of the same sponsor in cycling (Rabobank sponsoring the professional cycling team and sponsoring the Dutch cycling federation) fall from the efficiency frontier. Furthermore,
89
Benchmarking SponSorShip performance: the LeveL of efficiency in the Dutch SportS SponSoring market
several sponsors which have naming rights of the sponsored property (such as TVM speed skating team, Jupiler soccer league, the ABN AMRO Tennis Tournament and the Eneco Tour, a professional cycling event) have notably lower efficiency scores when sponsorship awareness is excluded. These sponsorships thus derive their efficiency particularly from a relatively high level of sponsorship familiarity. The results from DEA model 4 with sponsorship familiarity and perceived fit as output variables are similar to the results with the three output variables. Thus the elimination of attitude towards the sponsor does not affect the efficiency scores to a large extent.
5.5.3 TobitresultsTable 5.5 displays the estimations results of the Tobit model, where we explain efficiency from five covariates (as expressed in equation (1)). To check for multicollinearity we computed the Variance Inflation Factor (VIF) for each explanatory variable. All VIFs are below the commonly used threshold of 10 (Hair et al. 2006). Hence, the model estimation does not suffer from multicollinearity problems.In H1 we predict that sponsorship clutter has a negative effect on sponsorship efficiency. As can be seen in Table 5.5 sponsorship efficiency is significantly negatively related to sponsorship clutter (β̂ = -.037, p < .01), so we find empirical support for H1. H2 involves the hypothesis that sponsorship duration has a positive impact on sponsorship efficiency and this contention is supported (β̂ = .008, p < .05). H3 reflects our expectation of a positive effect of sports popularity on sponsorship efficiency. In Table 5.5 the effect of sports popularity on sponsorship efficiency is not significant, so H3 is not supported. With regard to the control variables, we do not find a significant effect of sponsored property type on sponsorship efficiency, but there are differences between sponsor industries. In particular, we find that beer brands (β̂ = .344, p < .01) and to a smaller extent financial service providers (β̂ = .177, p < .1) have a higher degree of sponsorship efficiency than sponsors operating in other industries. We explicitly tested for the exogeneity of the independent variable of sponsorship duration, because of the concern that sponsorship duration may be a function of sponsorship efficiency. To address this concern we used the exogeneity test for Tobit models by Smith and Blundell (1986). Under the null hypothesis, the model is appropriately specified with all explanatory variables as exogenous. To test this hypothesis, we used measures for size of the sponsor and whether or not the sponsor is non-Dutch as instruments. The residuals of the auxiliary regression of duration on the instruments were not significant (p = .412), so we conclude that endogeneity of sponsorship duration is not a problem.

90
CHAPTER 5
Table5.4
DEA
Sco
res
and
Rank
ings
of t
he H
ighe
st-S
cori
ng S
pons
orsh
ips
Spon
sor
Prop
erty
Scor
e DEA
1Ra
nking
DEA
1Sc
ore
DEA
2Ra
nking
DEA
2Sc
ore
DEA
3Ra
nking
DEA
3Sc
ore
DEA
4Ra
nking
DEA
4
1A
mst
elA
mst
el G
old
Race
(cyc
ling
even
t)1
11
11
11
1
2Ph
ilips
PSV
(soc
cer
team
)1
11
11
11
1
3U
nivé
Bam
-Uni
vé m
arat
hon
ice
spee
d sk
ating
team
11
11
11
11
4Es
sent
Th
ialf
(ice
hall)
11
11
11
11
5U
nive
Uni
vé G
ym G
ala
(gym
nasti
cs e
vent
)1
11
11
11
1
6Ra
boba
nkRo
yal D
utch
Cyc
ling
Fede
ratio
n1
11
1.6
599
11
7Ra
boba
nkRa
boba
nk C
yclin
g Te
am1
11
1.2
6814
11
8G
rols
chFC
Tw
ente
(soc
cer
team
)1
1.4
0115
11
11
9A
mst
elA
jax
(soc
cer
team
)1
1.2
7518
11
11
10A
egon
Roya
l Dut
ch R
owin
g Fe
dera
tion
.821
10.8
218
.821
8.6
6711
11Ju
pile
rJu
pile
r Le
ague
(firs
t div
isio
n so
ccer
).7
1411
.714
9.1
3934
.714
10
12A
BN A
MRO
ABN
AM
RO W
orld
Ten
nis
Tour
nam
ent
.576
12.5
7610
.066
60.5
7612
13U
nive
NO
S St
udio
Spo
rt (s
port
s TV
pro
gram
me)
.571
13.5
7111
.521
11.5
7113
14D
elta
Llo
ydH
isw
a (s
ailin
g ev
ent)
.529
14.5
0012
.529
10.5
2914
15Ba
vari
aBa
vari
a Ci
ty R
acin
g (c
ar ra
cing
eve
nt)
.482
15.4
8213
.259
15.4
8215
16Ra
boba
nkIn
door
Bra
bant
(hor
seri
ding
eve
nt)
.446
16.2
6219
.446
12.4
4616
17A
BN A
MRO
Aja
x (s
occe
r te
am)
.441
17.4
4114
.186
25.4
4117
18TV
MTV
M s
peed
ska
ting
team
.398
18.3
9816
.047
66.3
9818
19En
eco
Enec
o To
ur (c
yclin
g ev
ent)
.383
19.3
8317
.080
47.3
8319
20D
elta
Llo
ydD
elta
Llo
yd R
egatt
a (s
ailin
g ev
ent)
.338
20.2
5021
.338
13.3
3820
Not
es:
DEA
1: O
utpu
t var
iabl
es: s
pons
orsh
ip fa
mili
arity
, atti
tude
tow
ards
the
spon
sors
hip
and
perc
eive
d fit
DEA
2: O
utpu
t var
iabl
es: s
pons
orsh
ip fa
mili
arity
, atti
tude
tow
ards
the
spon
sors
hip
DEA
3: O
utpu
t var
iabl
es: a
ttitu
de to
war
ds th
e sp
onso
rshi
p an
d pe
rcei
ved
fitD
EA 4
: Out
put v
aria
bles
: spo
nsor
ship
fam
iliar
ity a
nd p
erce
ived
fit

91
Benchmarking SponSorShip performance: the LeveL of efficiency in the Dutch SportS SponSoring market
Table 5.5 Tobit Results Sponsorship Efficiency
SponsorshipEfficiency
Independent variable β̂ SE
Sponsorship clutter -.037*** .011
Sponsorship duration .008* .003
Sports popularity -.002 .001
Property type (reference: team):Event/league
Federation-.016-.060
.099
.093
Sponsor industry (reference: other industries):Financial service
Beer brandSports brandB2B services
.177 .344** .002 .009
.089
.105
.129
.111
Notes: *p < .05, **p < .01, ***p < .001.
5.6 Discussion
In this study we show how Data Envelopment Analysis can be applied to investigate the relative efficiency of sponsorships. This is an important extension of previous research on sponsorship effects, because consumer impact of sponsorship is assessed in relation to the underlying sponsorship budget. This enables benchmarking of sponsorship projects on the basis of the effect-to-budget ratio rather than examining consumer processing or capital markets effects in isolation.In our application of DEA, sponsorships are benchmarked against efficient projects operating with similar situations and scales, so sponsorship heterogeneity is accounted for. Furthermore, DEA works well with multiple inputs and outputs, without having to assign subjective weight specifications. This is suitable for sponsorship because sponsors may have multiple objectives and some sponsors will focus on different objectives than others. The application of DEA in this study reveals that 12.5% of the investigated sponsorships are efficient. An inspection of the efficient projects leads to the conclusion that efficiency can be achieved at any sponsorship budget level. Among the efficient projects are sponsorships that achieve high output levels with high budgets, but also sponsorships that manage to attain more modest output levels with small budgets. Sponsorship managers of inefficient projects may use DEA results (in particular characteristics of their efficient peers) to investigate how efficiency can be achieved. We show with an input-oriented model how an analysis of peers allows one to calculate by

92
CHAPTER 5
how much sponsorship budgets could be decreased if the projects would be conducted efficiently. For sponsorship managers results from a DEA analysis could be viewed as the starting point for evaluation of their sponsorship projects. In particular, a relatively low DEA score has a signaling function, which deserves further investigation. A next step would be an in-depth case study analysis of the value of the sponsorship project, involving a number of questions. For example, are the measured input and output variables truly reflecting the objectives of the particular sponsorship? What are the characteristics of the efficient peer sponsorships and how are these projects managed? Are the pre-defined sponsorship objectives achieved, are the allocated budgets based on realistic sponsorship objectives and is achieving the pre-defined objectives worth the cost? A second objective of this research is to examine which general sponsorship characteristics impact sponsorship efficiency (measured by the DEA scores obtained). The results of our Tobit analysis reveal that sponsorship clutter has a negative effect on sponsorship efficiency, while sponsorship duration has a positive effect. These results are in line with previous research finding a negative effect of sponsorship clutter (Cornwell et al., 2000) and a positive effect of sponsorship duration on consumer processing of sponsorship (McAlister et al., 2012). For sponsorship managers, this implies that contract duration and the number of other sponsors present are important selection criteria and should be taken into account during contract negotiations. Likewise, we recommend managers of sports properties to consider these factors in designing sponsorship packages. For example, although it may seem attractive for a sports property to have as many sponsors as possible, one could question whether sponsorship relations will be successful from a sponsor’s perspective.We do not find a significant effect of sports popularity and property type on sponsorship efficiency. This would imply that sponsorship efficiency is not directly influenced by the choice for a certain sports category or property type. With regard to the relation between sports popularity and sponsorship efficiency, positive exposure and attention effects may be offset by the higher budgets required; as sponsors realize the potential benefit of a popular sports category in terms of media exposure and involvement of the target group, agreements become more expensive and possibly less efficient. Some industry effects are found; in particular sponsorship by beer brands seems relatively efficient compared to other sponsor industries. An explanation for the finding might be that alcohol brands have a long tradition of being involved in sponsorship (Meenaghan, 1983) and that these brands have established a strong reputation as sports sponsors, making it perhaps more likely for the public to identify these brands as sponsors and to judge these kind of partnerships as matching.

93
Benchmarking SponSorShip performance: the LeveL of efficiency in the Dutch SportS SponSoring market
5.7 Limitations and Directions for Further Research
This study is subject to several limitations, which create interesting opportunities for future investigations. First, this study is, to the best of our knowledge, the first DEA application to sponsorship. For this research we used data on a sample of Dutch sponsorships for one year, so the findings cannot directly be generalized to other sponsorship markets or time periods. Therefore, we would encourage replication of this study with samples from other countries (or cross-national samples), and with longitudinal data. Furthermore, it is important to acknowledge that the data used in this study come from different external sources and publications (for example data on sponsorship budgets and sports popularity). Therefore the quality of the underlying data collection processes could not be fully evaluated. A replication of this study with other data sources would yield insights on the robustness of the results.Second, as explained in paragraph we deliberately chose to use sponsorship consumer processing variables as outputs in our DEA model, which can be considered means-to-end variables, rather than true firm outcomes. Future research could aim at applying DEA with brand-specific outcomes, such as increases in brand awareness, provided that a positive correlation with sponsorship budgets is observed. Furthermore, although most sponsorships are directed at contributing to customer based brand equity (Crompton, 2004), accounting for other objectives would be appropriate. As such, different outputs of sponsorships as for example merchandise sales figures, customer data (reflecting relationship marketing objectives) or employee data (as sponsorships can be directed at an internal audience) could be incorporated as outputs. Thirdly, we did not account for sponsorship leverage. Sponsorship leverage involves communicating the sponsorship agreement and developing activities to profit from it. It has been recognized that a sponsor should spend substantial additional resources for leverage to be able to fully profit from signing a sponsorship agreement (Fahy et al., 2004). Accordingly, it has been found that sponsors who invest in proper leverage of their sponsorship achieve more favorable consumer processing (Wakefield et al., 2007; Weeks et al., 2008). We would welcome DEA applications using both sponsorship contract budgets and leverage budgets as input variables.Lastly, synergies between different sponsorships would be another interesting topic for further research. Our sample includes some projects of the same sponsor, which are most probably not entirely independent. Efficient sponsorships could have profited from other projects of the same sponsor, which should be taken into account when interpreting the results. For example, the Essent ice hall stadium sponsorship is found to be efficient with a relatively low budget, but this could be due to the other Essent sponsorships in the sports category speed skating, which have far higher budgets. Future studies could incorporate synergies in sponsorship projects and/or ‘perceived ubiquity’ in sponsorship policy (as

94
CHAPTER 5
the degree of focus is termed by Speed and Thompson, (2000) as an explanatory variable of sponsorship efficiency.

95
Chapter 6
Conclusions

96
CHAPTER 6
6.1 Overview
Despite the recent troubled economic circumstances and the increasing investments required to become an official sponsor of a major sports property, the popularity of sponsorship as a marketing communications instrument continues to grow (PricewaterhouseCoopers, 2011). Yet, in line with the growing concern for making marketing expenditures more accountable (e.g. Rust, Ambler et al., 2004) sports sponsorship investments are under increased scrutiny and there is a growing pressure on managers to measure the effectiveness. Notwithstanding the increased attention both in business and in academics, the issue of sponsorship effects is subject to substantive debate (Wakefield et al., 2007). As such several researchers call for a more thorough understanding of sponsorship effects and how the instrument can be applied more effectively (Breuer & Rumpf, 2012; Cornwell, 2008). Therefore, this thesis aims to investigate the effectiveness and efficiency of sports sponsorship and to reveal different factors influencing sports sponsorship’s success. Table 6.1 summarizes the key findings of the different studies in this thesis. We will further discuss these findings and the implications in the next paragraphs.

97
ConClusions
Table6.1
Key
findi
ngs
per
Stud
y
Chap
ter
2
Chap
ter
3
Chap
ter
4
Chap
ter
5
Rese
arch
aim
Keyfin
ding
sMan
agerialinsights
Lite
ratu
re s
urve
y of
spo
nsor
ship
effe
cts
Cogn
itive
con
sum
er p
roce
ssin
g of
spo
nsor
ship
Spon
sor
equi
ty (a
favo
urab
le c
hang
e in
co
nsum
er’s
affe
ctive
and
con
ative
resp
onse
to
the
spon
sor
resu
lting
from
spo
nsor
ship
)
Benc
hmar
king
spo
nsor
ship
per
form
ance
Spon
sors
hip
can
crea
te v
alue
for
the
spon
sori
ng
firm
thro
ugh
bran
d eq
uity
bui
ldin
g, in
tern
al
mar
ketin
g, re
latio
nshi
p m
arke
ting
and
shar
ehol
der
valu
e.
Spon
sors
hip
dura
tion
enha
nces
spo
nsor
ship
aw
aren
ess.
Spor
tive
succ
ess
has
a sm
all n
egati
ve e
ffect
on
spon
sors
hip
awar
enes
s.
Spon
sor
equi
ty is
cre
ated
in m
ultip
le c
ount
ries
at
a tim
e.Sp
onso
r eq
uity
is h
ighe
r in
non
parti
cipa
ting
coun
trie
s.
Spon
sors
hip
clutt
er n
egati
vely
affe
cts
spon
sors
hip
effici
ency
.Sp
onso
rshi
p du
ratio
n po
sitiv
ely
affec
ts
spon
sors
hip
effici
ency
.
Spon
sors
hip
valu
e de
pend
s on
form
ulat
ed
obje
ctive
s.Be
tter
und
erst
andi
ng o
f the
fact
ors
that
influ
ence
sp
onso
rshi
p ou
tcom
es.
Empi
rica
l arg
umen
t for
long
-ter
m s
pons
orsh
ip
rela
tions
.Be
tter
und
erst
andi
ng o
f the
fact
ors
that
influ
ence
sp
onso
rshi
p aw
aren
ess.
Spon
sors
hip
can
be a
sui
tabl
e in
stru
men
t for
a
glob
al b
rand
ing
stra
tegy
.Be
tter
und
erst
andi
ng o
f the
fact
ors
influ
enci
ng
spon
sor
equi
ty.
Dat
a En
velo
pmen
t Ana
lysi
s as
a p
ossi
ble
benc
hmar
king
inst
rum
ent.
Bett
er u
nder
stan
ding
of t
he fa
ctor
s in
fluen
cing
sp
onso
rshi
p effi
cien
cy.

98
CHAPTER 6
6.2 Conclusions
6.2.1 InitialGeneralizationsonSponsorshipEffectsThe first chapter of this thesis presents an integrated framework of sponsorship outcomes based on a review of previous studies on sponsorship effects. In particular we addressed two research questions:
1. How does sponsorship create value for the sponsor?2. What factors influence sponsorship outcomes?
With regard to the first research question, four different channels through which sponsorship creates value for a sponsoring firm have been identified: building customer-based brand equity, internal marketing, building relationships with stakeholders, and increasing shareholder’s wealth. In all, sponsorship outcomes depend on the objectives the sponsor intends to achieve. Generally, high media exposure and accompanying customer-based brand equity objectives, such as awareness, image and brand preference, are the most important reasons for companies to engage in large sponsorship deals (Crompton, 2004; Olson, 2010). As a result, most studies on sponsorship effects concentrate on these effects. Generalizing from previous research, we conclude that sponsorship can affect brand awareness and brand image under favorable conditions. Furthermore, sponsorship may induce favorable high-level processing of the sponsoring brand when consumers are (implicitly or explicitly) aware of the sponsor-sponsee relationship and when they evaluate the project positively. In this respect, sponsorship outcomes for the sponsoring organization pertain to brand attitude, brand preference, brand attachment, brand loyalty and intent to purchase.Sponsorships can also be used as an internal branding vehicle. In this manner, sponsorship may contribute to employees’ identification and commitment with the corporate brand, company pride and ultimately firm loyalty (Gardner & Shuman, 1988; Rosenberg & Woods, 1995). Additionally, sponsorships may assist in staff recruitment by positively influencing the level of corporate awareness and favorable associations among potential employees (Meenaghan, 1983), provided that potential employees are exposed to and aware of the sponsorship. The value of sponsorship in relationship marketing relies in the concept of gratitude and resulting reciprocal behavior. Particularly, stakeholders invited for sponsorship related hospitality programs might develop goodwill and grateful feelings towards the sponsor for the invitation, and may adjust their behavior accordingly. This could result in increased cross-selling and loyalty among existing clients and to commitment and favorable long-term relations with distributors, media and suppliers.

99
ConClusions
In an attempt to quantify the financial returns of sponsorship for a sponsoring firm, a specific stream of research takes an event study approach to analyze how shareholders value corporate announcements of sponsorship investments (e.g. Miyazaki & Morgan, 2001; Reiser et al., 2012). From these studies, we conclude that sponsorship announcements may contribute positively to shareholders wealth under favorable investment and sponsorship circumstances.Concerning research question 2, several factors pertain to the outcomes of sponsorship. As discussed above, the desired sponsorship outcomes differ for different sponsors depending on the formulated sponsorship objectives and the selected target group. For a sponsorship to be effective, a necessary first step involves sponsorship processing by the target group, where unconscious, low-level and high-level processing all may result in specific sponsorship outcomes.Whether sponsorship is indeed effective in stimulating target group processing and reaching formulated objectives, first depends on management of the sponsorship. That is the quality and execution of the sponsorship program, which should be designed following sponsorship objectives and target group. Factors under the control of sponsorship managers include the level of exposure, leverage, the integration with other marketing activities and sponsorship contract duration. Moreover, the conditions in the sponsorship market and individual characteristics of the target group affect sponsorship processing and sponsorship outcomes significantly. Sponsorship market conditions involve the presence and image of co-sponsors, ambush activity and the sportive performance of the sponsored object. As important target group characteristics, we identified individual involvement, perceived fit between the sponsor and sponsee, attitude towards the practice of sponsorship, perceived sincerity of the sponsor and familiarity with the sponsoring brand.
6.2.2 DynamicEffectsofSponsoringIn chapter 3 of this thesis, we investigated cognitive consumer processing of sponsorship. The main contribution of this study pertains to the investigation of how sponsorship awareness develops over time. In this regard we respond to the call for sponsorship studies to adapt to the long-term nature of sponsorship effects (Pope et al., 2009). Furthermore, we investigate the influence of sportive success, and, as another contribution, we include individual involvement at both the generic sport level and the domain-specific level to investigate the relative strength of these predicting variables. The following research questions were central to this chapter:
3. How does sponsorship awareness develop over time?4. Does sportive success influence sponsorship awareness?5. How do different involvement types influence sponsorship awareness? 6. What other factors influence sponsorship awareness?

100
CHAPTER 6
To investigate the different factors influencing sponsorship awareness, we used a logit model to predict individual correct sponsor identification (recall and recognition) for Heineken, one of the main sponsors of UEFA Champions league. To estimate the model we used market research data of more than 25,000 consumers from five countries, over the period 2005–2009. With regard to the research question 3, we found that sponsorship awareness increased over the measurement period. Thus, our results indicate a positive impact of sponsorship duration on sponsor recall and recognition levels, which is in line with prior research conducted over a one year or one season period (Pitts & Slattery, 2004; Simmons & Becker-Olsen, 2006). Moreover, the largest increase in sponsorship identification accuracy occurred in the second season of the sponsorship. From this point the growth rate in sponsorship awareness tails off, although the absolute probability of recall and recognition keeps on increasing.In response to the fourth research question, we included the official UEFA season league coefficient, which reflects the win–loss results of each nation’s club teams in the UEFA Champions League and UEFA Europa League games, as a predicting variable in our logit model. Our results suggest a small, negative effect of sportive success on the probability of correct sponsor recall and recognition. An explanation for this finding pertains to limited cognitive capacity. When teams from their country are performing well, audience attention might be focused primarily on the match itself leaving less mental space for processing messages from league sponsors (which are apart from the action on the field). To answer research question 5, we investigate simultaneously the effect of involvement with the event (UEFA Champions League) and involvement with the sports category (soccer) on sponsorship recall and recognition. In line with our hypotheses and previous research, both types of involvement enhance sponsorship recall. Moreover, we found that domain-specific involvement (involvement with UCL) is a stronger predictor than generic category involvement (involvement with soccer), which might be explained by the differing strength of the relation to sponsorship exposure. Lastly, we included several variables, previously found to affect sponsorship awareness, as predicting control variables in our model to be able to answer research question 6. The results were in line with our formulated hypotheses. In particular, we found that brand use and perceived fit have a positive influence on sponsorship recall and recognition. With regard to country effects, we found significant differences in terms of consumers’ ability to identify sponsors. Compared with someone from The Netherlands and Spain, a citizen of France, the United Kingdom, and Italy is significantly less likely to identify Heineken correctly as a sponsor of UEFA Champions League. Several country-specific factors can be identified as possible explanations for these findings. These include country-of-origin and brand prominence effects, legal restrictions, differences in leverage per country, the degree of industry competition, cross-cultural differences, and the composition of the marketing communication environment in each country. The

101
ConClusions
second empirical study in this thesis (chapter 4) elaborates further on country effects in sponsorship processing; the main findings are discussed in the following paragraph.
6.2.3 GlobalSponsorshipEffectsThe study presented in chapter 4 aimed to explore sponsorship effectiveness in different countries, addressing the concern that research on sponsorship effects in multiple countries is scarce, which limits generalizability of the results (Dalakas & Kropp, 2002; Séguin et al., 2005). In particular we formulated three research questions:
7. Does league sponsorship create sponsor equity in multiple countries following international exposure?
8. Does this sponsor equity differ between participating and non-participating countries?
9. Are the antecedents of sponsor equity different in participating and non-participating countries?
As in the previous empirical study, data for this research were provided by Heineken, one of the main sponsors of UEFA Champions League. Data on sponsor equity (consumers’ affective and conative responses to the sponsor resulting from the sponsorship) were collected in nine different countries. These countries have differing degrees of participation in the UCL competition, enabling us to investigate whether sponsorship may be effective with and without country teams’ participation in a globally broadcasted event. Respondents come from European participants of UCL (France, Italy, Spain, United Kingdom, The Netherlands, Greece and Poland) and two countries without any club team participating (Thailand and Argentina).With regard to research question 7, our findings suggest that sponsor equity can be created in multiple countries through international broadcasting irrespective of country participation in UCL. Yet we find important differences in the degree of sponsor equity between countries, implying that sponsorship may be more effective in one country than in another. In particular, we find that sponsor equity is higher in nonparticipating countries compared to participating countries. A possible explanation for this result pertains to potential distraction of sponsor messages of league sponsors in participating countries resulting from higher excitement withdrawn from matches in these countries. Other possible explanations for differences in sponsor equity between countries involve country differences in perceptions of the sponsor and sponsored object, the degree of leverage by the sponsor, sponsor market conditions (clutter) and cultural values.To investigate the different drivers of sponsor equity, as proposed in the second research question, we conducted a regression analysis. In line with previous research (i.e. Speed & Thompson, 2000), we find that perceived status of the event, personal liking of the event and perceived fit have a significant influence on sponsor equity across countries.

102
CHAPTER 6
Consistent with the results of the first empirical study, we find that time has a positive effect on sponsor equity, implying that sponsor equity is built up over time. Furthermore, sponsor equity is lower among males than among females and respondents with lower educational levels show higher sponsor equity than those with a high education level. To answer research question 9, we investigated the moderating effect of country participation on the relation between individual antecedents (brand usage, personal liking of the event, perceived status of the event and perceived fit) and sponsor equity. As expected we found the effect of each of these individual characteristics on sponsor equity to be stronger in nonparticipating countries than countries with a club team participating in UCL.
6.2.4 BenchmarkingSponsorshipEfficiencyIn chapter 5 of this thesis we show how Data Envelopment Analysis (DEA) can be applied to investigate the relative efficiency of sponsorships. The research questions were defined as follows:
10. What is the level of efficiency in the Dutch sponsoring market?11. Which sponsorship characteristics affect sponsorship efficiency?
To answer these questions, we applied DEA on a sample of Dutch sponsorships to evaluate the relative performance in terms of effect-to-budget ratio. In total we collected data on 72 sponsorships involving sponsors from different industries. We selected estimated yearly expenditure per sponsorship as input variable for the DEA analysis. In addition, we include three output variables; sponsorship familiarity, attitude towards the sponsorship and perceived fit. After performing DEA, a second step involved investigating which sponsorship characteristics affect sponsorship efficiency. For this purpose, we used the DEA scores as a dependent variable in a Tobit regression model. As independent variables we included sponsorship clutter, sponsorship duration and sports popularity.In response to research question 10, our results revealed that 12.5% of the investigated sponsorships are efficient; nine of the 72 sponsorships. This number is comparable to the efficiency results of Luo and Donthu (2001), who found nine of 63 firms to be efficient. The efficient sponsorships involve expensive properties outperforming other projects on output, as well as sponsorships with small budgets performing relatively well (compared to projects with similar outputs but higher budgets). Moreover, there is a high degree of variety in efficiency scores; about one third of the projects in the sample has an efficiency score below 10%. With regard to research question 11, our Tobit analysis suggested that sponsorship clutter negatively affects sponsorship efficiency, while sponsorship duration has a positive effect. These results are in line with previous studies finding a negative effect of sponsorship clutter (Breuer & Rumpf, 2012; Cornwell et al., 2000) and a positive effect of sponsorship

103
ConClusions
duration on consumer processing of sponsorship (McAlister et al., 2012). We did not find a significant effect of sports popularity on sponsorship efficiency. As an explanation, positive exposure and attention effects of popular sports may be offset by the higher budgets required; as sponsors realize the potential benefit of a popular sports category in terms of media exposure and involvement of the target group, agreements become more expensive and possibly less efficient.
6.3 Managerial Implications for Sponsors
As investments in sponsorship are significant, questions arise on the effectiveness of the instrument. From a managerial perspective, this thesis helps sponsorship managers with directions on how sponsorship can be applied more effectively. Recall that effectiveness of an sponsorship is defined as the degree in which predefined objectives are reached. In the literature review of chapter 2, we identified several factors that are crucial in obtaining specific sponsorship outcomes. Furthermore, in our empirical studies we confirmed previous findings and obtained new insights on the factors influencing consumer responses to sponsorship and sponsorship efficiency.An important contention is that sponsorship outcomes depend on the objectives the sponsor intends to achieve. Thus, to enable measurement of the effectiveness and returns of sponsorship, managers should define their objectives properly, i.e.; formulate the goals in a SMART (Specific, Measurable, Attainable, Realistic and Timescaled) way. This involves a detailed specification of the sponsorship target group. For most sponsoring organizations the target group involves current and potential customers, but it may also include employees, distributors, suppliers and other stakeholders of the firm. Target group processing of sponsorship information then is crucial in the achievement of sponsorship outcomes. Processing pertains to target group implicit memory of the sponsorship (due to mere exposure), awareness of the sponsorship and/or (positive) evaluation of the sponsorship. The higher the degree of processing, the higher the probability that favorable sponsorship outcomes are achieved. Therefore, we recommend sponsorship managers to closely monitor target group exposure to, awareness of and attitude towards the sponsorship over the term of the agreement to enable provisional adjustments in sponsorship policy and implementation.Whether target group processing is indeed achieved depends on the quality and execution of the sponsorship program. The task of a sponsor manager is to optimally design a sponsorship program, such that exposure quantity and quality are maximized, relevant leverage activities are developed and the sponsorship is integrated in the total firm marketing communication strategy. Another factor under sponsor managers control is the duration of a sponsorship agreement. In particular, the results in chapter 3, 4 and 5 suggest a positive effect of sponsorship duration on sponsorship awareness, sponsor equity and sponsorship efficiency. Thus, this

104
CHAPTER 6
thesis provides sponsorship managers with an empirical argument for signing long-term sponsorship agreements and building long-term relations. Moreover, we found that the highest increase in sponsorship awareness occurs in the second year of sponsorship, then the growth rate tends to consolidate somewhat. This would imply that projects need to last a minimum of two years for awareness levels to reach a point near the maximum possible level.Sponsorship managers do not have direct control over the conditions in the sponsorship market and the characteristics of the target group although these may favorably or unfavorably influence sponsorship outcomes. Therefore, when a sponsor manager is selecting a sponsor property and deciding to enter a sponsorship agreement these factors deserve proper investigation. With regard to the conditions in the sponsorship market, managers should particularly pay attention to the level of clutter; the number and type of other sponsors of the sponsee. If there are many other sponsors, it might become more difficult to create high awareness of the sponsorship among the target group. In this situation one could either choose to select another (less cluttered) property or to invest extra in leverage activities to make sure the sponsorship connection is set in consumers’ minds. Moreover, a transfer of associations from one sponsor to another may occur due to their connection in a sponsorship. Thus, the image of co-sponsors should be considered when deciding to enter an agreement with a property. Regarding target group characteristics, in particular individual involvement and perceived fit stand out as important influencers of consumer processing of sponsorship. These factors should be taken into account in any target market when selecting, managing and leveraging a sponsorship agreement. For sponsor managers this implies selecting sponsored objects that are highly relevant to the defined target group, meaning a high perceived status and/or high degree of personal interest (Speed & Thompson, 2000). This does not automatically mean that it is favorable to select objects in highly popular sports since these properties may be relatively expensive and the sponsorship environment highly cluttered, making them possibly less efficient investments. A sports category with a smaller but highly committed fan base may be equally attractive for a sponsor. With regard to the selection of a property type, generally an individual athlete or a team evokes a stronger emotional appeal and higher-quality exposure (brand name carriers close to field action) than a league, stadium, event or the like, whereas the degree of risk of sponsoring these properties is also higher, so a sponsor faces a potential trade-off. Moreover, we recommend selecting a sports category and property in line with the products and positioning of the sponsoring firm to achieve high perceived fit. If there is no natural fit between the sponsor and the sponsee, it is worth investing in the creation of perceived fit through leverage activity.This thesis also has implications for international sponsorship. We concluded in chapter 4 that sponsorship may evoke favorable affective and conative consumer responses in multiple countries at a time due to international broadcasting. This makes it a suitable

105
ConClusions
instrument for in a global branding strategy. However, our findings in chapter 3 and 4 also indicate significant differences between countries in consumers’ processing of sponsorship. Therefore, some degree of local adaptation in global sponsorship campaigns is inevitable. We recommend international sponsor managers to investigate sponsorship conditions in the different target countries to enable optimal allocation of leverage budgets and proper design of leverage activities. Important international circumstances that should be taken into account are possible legal restrictions to sponsors, the degree of clutter (presence of other sponsors) in the sponsorship market, the attitude of the target group towards the practice of sponsorship and their perceptions of the sponsoring brand and sponsored object. As an example, sponsorship clutter might be higher in one country than in another, making it more difficult to convey the sponsorship message. Accordingly, varying in exposure and leverage between countries may be an effective strategy for sponsor managers.
6.4 Implications for the Sponsee
An effective sponsorship is favorable for both the sponsor and the sponsee. For a sponsor, demonstrating sponsorship effectiveness is important to create internal support for the program and to take informed decisions on continuation of an agreement. Likewise, it is important for a sponsored property to gain insights in the results of the offered sponsorships to stimulate commitment among current sponsors, to (re)formulate sponsorship strategy and to (re)design attractive sponsorship packages. Therefore, even though this thesis focuses on the sponsor, it also has implications for the sponsee. The different studies in this thesis help managers of sponsored properties with directions on how to make their sponsorships more effective. First, for a sponsee, long-term sponsorship relations are generally favored over short-term contracts because of the stability of expected income. Thus, the results of this thesis provide managers of sponsored properties with an empirical argument to convince sponsors of the added value of long-term agreements, as consumers responses to sponsorship are built up over time. Another implication for the sponsee stems from the negative effect of clutter on sponsorship efficiency. This implies that the sponsee faces a potential trade-off and should balance between attracting additional sponsorship resources and building on the relationship with current sponsors. Contracting as many sponsors as possible may not be an optimal strategy from a relationship standpoint; the value for one sponsor may decrease with the number of other sponsors present. Furthermore, one should consider the image of sponsors, as image transfer may take place not only from sponsee to sponsor but also from sponsor to sponsee (Henseler, Wilson & De Vreede, 2009) and from one sponsor to another (Carrillat et al., 2010). Thus we recommend a sponsee to be aware

106
CHAPTER 6
of these effects when designing their sponsorship strategy and to discuss the potential entrance of additional sponsors with the current partners. Sponsorship exposure is a critical selection factor for sponsors; if their target group will not be exposed to the sponsorship, no further processing will occur. Likewise, the level of involvement of the target group with the sponsored property is crucial because of the influence on cognitive and affective consumer processing. Therefore, managers of sponsored properties should strive to increase media attention and to expand their fanbase. Alternatively, if creating exposure and involvement is difficult (for example when a sports category does not receive much media attention and is infrequently practiced), the sponsee should be creative in offering value to sponsors and/or adjust prices of their packages accordingly. Moreover, in this situation it could be more rewarding to approach sponsors with relationship marketing or internal objectives rather than those organisations focusing purely on brand equity.In all, the sponsee and the sponsor share a common interest in making an agreement succesful. Therefore, both parties should invest in exposure of the sponsorship and in leverage activity. For the sponsored property this implies offering multiple carriers of sponsor’s brand name, to explain the linkage between the sponsor and sponsee to create fit and to respond flexibly to the sponsor’s requests accompanying their leverage strategy. In addition, both parties have a shared responsibility in effect measurement. Therefore, we recommend managers of sponsored properties to discuss and define the sponsorship objectives together with the sponsor and to participate in evaluation.
6.5 Limitations and Suggestions for Future Research
The studies presented in this thesis are subject to several research limitations, and, as such, this thesis may be regarded as a starting point for future research on sponsorship effects. A first common limitation of the studies in chapter 3 and 4 is that we analyze effects in just one sponsorship program, namely Heineken’s sponsorship of UEFA Champions League. Thus, the findings may only be generalizable to similar sponsorships, so we recommend further research of the longitudinal and international effects of sponsorship in other contexts; for different sponsoring brands, different sports categories and property types. Likewise, the study in chapter 5 analyzes sponsorship efficiency in the Dutch sponsorship market in one time period, so investigating sponsorship efficiency internationally and longitudinally would be worthwhile. The empirical studies presented in this research, as well as other previous studies on sponsorship effects, mostly rely on consumer survey data. Although these figures provide insights in attitudes and behavioral intent, the relationship with business performance is not always obvious (Chandon et al., 2005). Research of the relationship between sponsorship and observed sales levels has been scarce up to this point. As
107
ConClusions
lately organizations become more and more data-driven and customer relationship management systems develop further, it should become possible to investigate the relation between sponsorship expenditures and sales levels longitudinally, as has been frequently done for advertising (i.e. Gijsenberg, 2013; Mela, Gupta, & Lehmann, 1997; Zhou, Zhou, & Ouyang, 2003). As an example, Gijsenberg (2013) investigates short- and long-term advertising elasticities before, during and after major sports events, using four years of weekly sales data.Our empirical studies did not address the synergies associated with combining various communication channels during the execution of a longitudinal campaign, nor the possible synergy between different sponsorship projects of one sponsor. As sponsorship-linked marketing campaigns tend to combine sponsorship with, for example, television advertising or online banner ads (Cornwell et al., 2005), it would be relevant to assess and compare the effectiveness of various combinations of communication channels over a longer timer period and internationally. Furthermore, a common strategy for sponsors is to choose one or more sports categories and to contract several different properties within these sports. Future research could address the possible synergy effects of this kind of sponsorship policy. From our literature review in chapter 2, we may conclude that previously published quantitative studies on sponsorship effects can be categorized in two main streams, namely research of sponsorship’s brand equity effects and studies that investigate sponsorship’s effects on shareholder value. Although most sponsorships involve brand equity objectives, (Crompton, 2004), sponsorship may be also directed at building relations with customers, employees and other stakeholders, and firms increasingly recognize these sponsorship functions (Farrelly & Greyser, 2012). Because these functions of sponsorship have been less frequently investigated empirically, we believe this area may warrant future research attention. Particularly, we recommend scholars to address the antecedents of internal and relationship marketing outcomes of sponsorship.Another opportunity for further investigation involves the question of what happens to a sponsor’s brand if a sponsorship agreement is ended. In this respect, Levin et al. (2008) found that fans are more likely to buy from a current sponsor, but less likely to buy from a previous sponsor, implying a negative effect of discontinuing a sponsorship. McAlister et al. (2012) report that former long-term sponsors continue to be associated with sponsored events, which may imply a dilution of sponsorship value for a replacement sponsor. Particularly, it would be interesting to investigate the effect on share price of the sponsor when a sponsorship agreement is ended and to differentiate between share price effects of new projects versus replacement sponsorships. Lastly, future research in sports sponsorship could address investors’ reactions to sponsorships of different objects with differing degrees of risk involved, such as single athlete sponsorship versus team and/or league sponsorship. O’Reilly and Foster (2008) identify in this regard seven dimensions of sponsee risk including risks on incidents on the

108
CHAPTER 6
field and off the field. With regard to shareholders, we would expect high-risk sponsorships to receive less favorable investor responses than low-risk sponsorships. Furthermore, we recommend more research on target group reactions to sponsors when major incidents, such as doping scandals and death of an athlete, occur; does the image of the sponsor suffer from these kind of negative events and, if so, under which circumstances? In all, it can be concluded that as sponsorship has become a popular and often pivotal instrument in the marketing (communications) mix, academic research on sponsorship effects is evolving. The research area is gaining a stronger empirical foundation, which contributes to increased professionalism in sponsorship business practice. This thesis contributes to this development by providing insights in sports sponsorship effectiveness and efficiency and by revealing different sponsorship success factors.

109
References
Amis, J., Slack, T., & Berrett, T. (1999). Sport sponsorship as distinctive competence. European Journal of Marketing, 33(3/4), 250-272.
Balasubramanian, S. K., Karrh, J. A., & Patwardhan, H. (2006). Audience response to product placements. Journal of Advertising, 35(3), 115-141.
Banker, R. D., Charnes, A., & Cooper, W. W. (1984). Some models for estimating technical and scale efficiencies in Data Envelopment Analysis. Management Science, 30(9), 1078-1092.
Bansal, H. S., Mendelson, M. B., & Sharma, B. (2001). The impact of internal marketing activities on external marketing outcomes. Journal of Quality Management, 6, 61-76.
BBCsport. (2010). Champions League final tops Super Bowl for TV market. Retrieved May 8 2012 from http://news.bbc.co.uk/go/pr/fr/-/sport2/hi/football/europe/8490351.stm
Becker-Olsen, K., & Simmons, C. J. (2002). When do social sponsorships enhance or dilute equity? Fit, message source, and the persistence of effects. Advances in Consumer Research, 29(1), 287-289.
Bennett, R. (1999). Sports sponsorship, spectator recall and false consensus. European Journal of Marketing, 33(3/4), 291-313.
Braun-LaTour, K. A., & LaTour, M. S. (2004). Assessing the long-term impact of a consistent advertising campaign on consumer memory. Journal of Advertising, 33(2), 49-61.
Breuer, C., & Rumpf, C. (2012). The viewer’s reception and processing of sponsorship information in sport telecasts. Journal of Sport Management, 26(6), 521-531.
Büschken, J. (2007). Determinants of brand advertising efficiency. Evidence from the German car market. Journal of Advertising, 36(3), 51-73.
Carrillat, F. A., Harris, E. G., & Lafferty, B. A. (2010). Fortuitous brand image transfer. Journal of Advertising, 39(2), 109-123.
Carrillat, F. A., Lafferty, B. A., & Harris, E. G. (2005). Investigating sponsorship effectiveness: do less familiar brands have an advantage over more familiar brands in single and multiple sponsorship arrangements? Brand Management, 13(1), 50-64.
Chadwick, S., & Holt, M. (2008). Releasing latent brand equity: the case of UEFA’s Champions League. The Marketing Review, 8(2), 147-162.
Chanavat, N., & Martinent, G. (2009). Sponsor and sponsees interactions: Effects on consumers’ perceptions of brand image, brand attachment, and purchasing intention. Journal of Sport Management, 23(5), 644-670.
Chandon, P., Morwitz, V. G., & Reinartz, W. J. (2005). Do intentions really predict behavior? Self-generated validity effects in survey research. Journal of Marketing, 69(2), 1-14.
Charnes, A., Cooper, W. W., & Rhodes, E. (1978). Measuring the efficiency of Decision Making Units. European Journal of Operational Research, 27, 668-697.
Clark, J. M., Cornwell, T. B., & Pruitt, S. W. (2002). Corporate stadium sponsorships, signaling theory, agency conflicts and shareholder wealth. Journal of Advertising Research, 42(6), 16-32.
Clark, J. M., Cornwell, T. B., & Pruitt, S. W. (2009). The impact of title event sponsorships announcements on shareholder wealth. Marketing Letters, 20(2), 169-182.
Clark, J. M., Lachowetz, T., Irwin, R. I., & Schimmel, K. (2003). Business-to-business relationships and sport: Using sponsorship as a critical sales event. International Journal of Sports Marketing & Sponsorship, 5(2), 129-144.
Coelli, T. J., Rao, D. S. P., O’Donnell, C. j., & Battese, G. E. (2005). An Introduction to Efficiency and Productivity Analysis (2 ed.): Springer Science+Business Media, Inc.
Cornwell, T. B. (1995). Sponsorship-linked marketing development. Sport Marketing Quarterly, 4(4), 13-24.Cornwell, T. B. (2008). State of the art and science in sponsorship-linked marketing. Journal of Advertising,
37(3), 41-55.Cornwell, T.B., & Humphreys, M.S. (2013). Memory for sponsorship relationships: a critical juncture in thinking.
Psychology & Marketing 30(5), 394-407.

110
RefeRences
Cornwell, T. B., & Maignan, I. (1998). An international review of sponsorship research. Journal of Advertising, 27(1), 1-21.
Cornwell, T. B., Pruitt, S. W., & Clark, J. M. (2005). The relationship between major-league sports’ official sponsorship announcements and the stock prices of sponsoring firms. Journal of the Academy of Marketing Science, 33(4), 401-412.
Cornwell, T. B., Relyea, G. E., Irwin, R. I., & Maignan, I. (2000). Understanding long-term effects of sports sponsorship: role of experience, involvement, enthousiasm and clutter. International Journal of Sports Marketing & Sponsorship, 2(2), 127-143.
Cornwell, T. B., Roy, D. P., & Steinard II, E. A. (2001). Exploring managers’ perceptions of the impact of sponsorship on brand equity. Journal of Advertising, 30(2), 41-51.
Cornwell, T. B., Weeks, C. S., & Roy, D. (2005). Sponsorship-linked marketing: opening the black box. Journal of Advertising, 34(2), 21-42.
Crimmins, J. M., & Horn, M. (1996). Sponsorship: from management ego trip to marketing success. Journal of Advertising Research, 36(4), 11-21.
Crompton, J. L. (2004). Conceptualization and alternate operationalizations of the measurement of sponsorship effectiveness in sport. Leisure Studies, 23(3), 267-281.
D’Astous, A., & Bitz, P. (1995). Consumer evaluations of sponsorship programmes. European Journal of Marketing, 29(12), 6-22.
Dalakas, V., & Kropp, F. (2002). Attitudes of youth toward purchasing from sponsors: a cross-cultural perspective. Journal of Euromarketing, 12(1), 19-39.
Danaher, P.J., Bonfrer, A., & Dhar, S. (2008). The effect of competitive advertising interference on sales for packaged goods. Journal of Marketing Research, 45(2), 211-225.
Dean, D. H. (2002). Associating the corporation with a charitable event through sponsorship: Measuring the effects on corporate community relations. Journal of Advertising, 31(4), 77-87.
Dees, W., Bennett, G., & Ferreira, M. (2010). Personality fit in NASCAR: an evaluation of driver-sponsor congruence and its impact on sponsorship effectiveness outcomes. Sport Marketing Quarterly, 19(1), 25-35.
Dees, W., Bennett, G., & Villegas, J. (2008). Measuring the effectiveness of sponsorship of an elite intercollegiate football program. Sport Marketing Quarterly, 17(2), 79-89.
Dekhil, F. (2010). The effects of the type of audience, involvement, interest and socio-demographic variables on sponsor recall: the soccer African Nations Cup. International Journal of Sports Marketing & Sponsorship, 11(2), 158-175.
DeMaris, A. (1995). A tutorial in logistic regression. Journal of Marriage and Family, 57(4), 956-968.Donthu, N., Hershberger, E. K., & Osmonbekov, T. (2005). Benchmarking marketing productivity using Data
Envelopment Analysis. Journal of Business Research, 58, 1474-1482.Donthu, N., & Yoo, B. (1998). Retail productivity assessment: Using Data Envelopment Assessment. Journal of
Retailing, 74(1), 89-117.Fahy, J., Farrelly, F., & Quester, P. G. (2004). Competitive advantage through sponsorship. European Journal of
Marketing, 38(8), 1013-1030.Färe, R., Grosskopf, S., Seldon, B. J., & Tremblay, V. J. (2004). Advertising efficiency and the choice of media mix:
a case of beer. International Journal of Industrial Organization, 22, 503-522.Farrell, K. A., & Frame, W. S. (1997). The value of Olympic sponsorships: who is capturing the gold?. Journal of
Market Focused Management, 2(2), 171-182.Farrelly, F., & Greyser, S. (2012). Sponsorship Linked Internal Marketing (SLIM): A Strategic Platform for Employee
Engagement and Business Performance. Journal of Sport Management, 26(6), 506-520.Gardner, M. P., & Shuman, P. (1988). Sponsorships and small businesses. Journal of Small Business Management,
26(4), 44-52.Gijsenberg, M. (2013). Going for gold: Investigating the (non)sense of increased advertising around major
sports events, working paper, University of Groningen.

111
RefeRences
Gould, S. J., Gupta, P. B., & Grabner-Kräuter, S. (2000). Product placements in movies: a cross-cultural analysis of Austrian, French and American consumers’ attitudes toward this emerging international promotional medium. Journal of Advertising, 29(4), 41-58.
Grönroos, C. (1981). Internal marketing-An integral part of the marketing theory. In J. H. Donnelly & W. R. George (Eds.), Marketing of service: proceedings of the American Marketing Association (pp. 236-238). Chicago: AMA.
Gwinner, K. (1997). A model of image creation and image transfer in event sponsorship. International Marketing Review, 14(3), 145-158.
Gwinner, K., & Bennett, G. (2008). The impact of brand cohesiveness on brand fit in a sponsorship context. Journal of Sport Management, 22, 410-426.
Gwinner, K., & Eaton, J. (1999). Building brand image through event sponsorship: the role of image transfer. Journal of Advertising, 28(4), 47-57.
Haas, D. J. (2003). Technical efficiency in the major league soccer. Journal of Sports Economics, 4(3), 203-215.Hair, J. F., Jr., Anderson, R. E., Tatham, R. L., & Black, W. C. (2006). Multivariate Data Analysis (6 ed.). Upper
Saddle River, New Jersey: Prentice Hall.Harvey, B., Gray, S., & Despain, G. (2006). Measuring the effectiveness of true sponsorship. Journal of Advertising
Research, 46(4), 398-409.Harvey, L. (2004, 12 March 2013). Analytic Quality Glossary. Retrieved April 9, 2013, from http://www.
qualityresearchinternational.com/glossary/ Heckman, J. (1979). Sample selection bias as a specification error. Econometrica, 47(January), 153-161.Henseler, J., Wilson, B., & De Vreede, D. (2009). Can sponsorships be harmful for events? Investigating the
transfer of associations from sponsor to events. International Journal of Sports Marketing & Sponsorship, 10(3), 244-251.
Herrmann, J., Walliser, B., & Kacha, M. (2011). Consumer consideration of sponsor brands they do not remember. Taking a wider look at the memorisation effects of sponsorship. International Journal of Advertising, 30(2), 259-281.
Hickman, T. M., Lawrence, K. E., & Ward, J. C. (2005). A social identities perspective on the effects of corporate sport sponsorship on employees. Sport Marketing Quarterly, 14(3), 148-157.
Hofstede, G. (2001). Culture’s consequences: comparing values, behaviors, institutions, and organizations across nations (2 ed.). Thousand Oaks CA: Sage Publications.
IEG. (2013). 2013 Sponsorship outlook: spending increase is double-edged sword. Retrieved June 7, 2013, from http://www.sponsorship.com/iegsr/2013/01/07/2013-Sponsorship-Outlook--Spending-Increase-Is-Dou.aspx
Johar, G. V., Pham, M. T., & Wakefield, K. L. (2006). How event sponsors are really identified: a (baseball) field analysis. Journal of Advertising Research, 46(2), 183-198.
Keller, K. L. (1993). Conceptualizing, measuring and managing consumer-based brand equity. Journal of Marketing, 57(1), 1-22.
Kinney, L., McDaniel, S. R., & DeGaris, L. (2008). Demographic and psychographic variables predicting NASCAR sponsor brand recall. International Journal of Sports Marketing & Sponsorship, 9(3), 169-179.
Ko, Y. J., Kim, K., Claussen, C. L., & Kim, T. H. (2008). The effects of sport involvement and corporate image on intention to purchase sponsors’ products. International Journal of Sports Marketing & Sponsorship, 9(2), 79-94.
Leigh, J. H., & Menon, A. (1987). Audience involvement effects on the information processing of umbrella print advertisements. Journal of Advertising, 16(3), 3-12.
Levin, A. M., Beasley, F., & Gamble, T. (2004). Brand loyalty of NASCAR fans towards sponsors: the impact of fan identification. International Journal of Sports Marketing & Sponsorship, 6(1), 11-21.
Levin, A. M., Beasley, F., & Gilson, R. L. (2008). NASCAR fans’ responses to current and former NASCAR sponsors: the effect of perceived group norms and fan identification. International Journal of Sports Marketing & Sponsorship, 9(3), 193-204.
Lohtia, R., Donthu, N., & Yaveroglu, I. (2007). Evaluating the efficiency of internet banner advertisements. Journal of Business Research, 60, 365-370.

112
RefeRences
London2012.com. (2012). London 2012 set to reach potential 4.8 billion global audience. Retrieved 15 May 2013, 2013, from http://www.london2012.com/news/articles/london-2012-set-reach-billion-global-audience.html
Lord, K. R., & Burnkrant, R. E. (1993). Attention versus distraction: the interactive effect of program involvement and attentional devices on commercial processing. Journal of Advertising, 22(1), 47-60.
Luo, X., & Donthu, N. (2001). Benchmarking advertising efficiency. Journal of Advertising Research, 41, 7-18.Luo, X., & Homburg, C. (2007). Neglected outcomes of customer satisfaction. Journal of Marketing, 71(2), 133-
149.McAlister, A. R., Kelly, S. J., Humphreys, M. S., & Cornwell, T. B. (2012). Change in a sponsorship alliance and the
communication implications of spontaneous recovery. Journal of Advertising, 41(1), 5-16.McDonald, C. (1991). Sponsorship and the image of the sponsor. European Journal of Marketing, 25(11), 31-38.McKechnie, S. A., & Zhou, J. (2003). Product placement in movies: a comparison of Chinese and American
consumers’ attitudes. International Journal of Advertising, 22, 349-374.Meenaghan, J. A. (1983). Commercial sponsorship. European Journal of Marketing, 17(7), 5-69.Meenaghan, T. (1991). Sponsorship - Legitimising the medium. European Journal of Marketing, 25(11), 5-10.Meenaghan, T. (2001). Understanding sponsorship effects. Psychology & Marketing, 18(2), 95-122.Meenaghan, T. (2005). Evaluating sponsorship effects. In J. Amis & T. B. Cornwell (Eds.), Global Sport Sponsorship
(Vol. 1, pp. 243-264). New York: Berg.Meenaghan, T., & Shipley, D. (1999). Media effect in commercial sponsorship. European Journal of Marketing,
33(3/4), 328-347.Mela, C. F., Gupta, S., & Lehmann, D. R. (1997). The long-term impact of promotion and advertising on consumer
brand choice. Journal of Marketing Research, 34(2), 248-261.Mitchell, C. (2002). Selling the brand inside. Harvard Business Review, 80(1), 5-11.Miyazaki, A. D., & Morgan, A. G. (2001). Assessing market value of event sponsoring: corporate Olympic
sponsorships. Journal of Advertising Research, 9-15.Moorman, M., Willemsen, L. M., Neijens, P. C., & Smit, E. G. (2012). Program-involvement effects on commercial
attention and recall of successive and embedded advertising. Journal of Advertising, 41(2), 25-37.Newell, S. J., Henderson, K. V., & Wu, B. T. (2001). The effects of pleasure and arousal on recall of advertisements
during the Super Bowl. Psychology & Marketing, 18(11), 1135-1153.Nicholls, J. A. F., Roslow, S., & Dublish, S. (1999). Brand recall and brand preference at sponsored golf and tennis
tournaments. European Journal of Marketing, 33(3/4), 365-386.Nufer, G., & Bühler, A. W. (2010). How effective is the sponsorship of global sports events?A comparison of the FIFA World Cups in 2006 and 1998. International Journal of Sports Marketing & Sponsorship,
11(4), 303-319.O’Reilly, N., & Foster, G. (2008). Risk management in sports sponsorship: application to human mortality risk.
International Journal of Sports Marketing & Sponsorship, 10(1), 45-62.O’Reilly, N., Lyberger, M. R., McCarthy, L., & Séguin, B. (2008). Mega-special-event promotions and intent to
purchase: a longitudinal analysis of the Super Bowl. Journal of Sport Management, 22(4), 392-409.Olson, E. L. (2010). Does sponsorship work in the same way in different sponsorship contexts? European Journal
of Marketing, 44(1/2), 180-199.Olson, E. L., & Thjømøe, H. M. (2003). The effects of peripheral exposure to information on brand preference.
European Journal of Marketing, 37(1/2), 243-255.Olson, E. L., & Tjømøe, H. M. (2009). Sponsorship effect metric: assessing the financial value of sponsoring by
comparisons to television advertising. Journal of the Academy of Marketing Science, 37(4), 504-515.Palmatier, R. W., Burke Jarvis, C., Bechkoff, J. R., & Kardes, F. R. (2009). The role of customer gratitude in
relationship marketing. Journal of Marketing, 73(3), 1-18.Pappu, R., Quester, P. G., & Cooksey, R. W. (2006). Consumer-based brand equity and country-of-origin
relationships. Some empirical evidence. European Journal of Marketing, 40(5/6), 696-717.Parker, K. (1991). Sponsorship: the research contribution. European Journal of Marketing, 25(11), 22-30.

113
RefeRences
Pavelchack, M. A., Antil, J. A., & Munch, J. M. (1988). The Super Bowl: An investigation into the relationship among program context, emotional experience, and ad recall. Journal of Consumer Research, 15(December), 360-367.
Pestana Barros, C., & Leach, S. (2006). Performance evaluation of the English Premier Football League with data envelopment analysis. Applied Economics, 38, 1449-1458.
Pestana Barros, C., & Silvestre, A. L. (2006). An evaluation of the sponsorship of Euro 2004. International Journal of Sports Marketing & Sponsorship, 7(3), 192-212.
Pham, M.T. (1992). Effects of involvement, arousal and pleasure on the recognition of sponsorship stimuli. Advances in Consumer Research, 19(1), 85-93.
Pham, M. T., & Johar, G. V. (2001). Market prominence biases in sponsor identification: processes and consequentiality. Psychology & Marketing, 18(2), 123-143.
Pitts, B. G., & Slattery, J. (2004). An examination of the effects of time on sponsorship awareness levels. Sport Marketing Quarterly, 13, 43-54.
Poon, D. T. Y., & Prendergast, G. (2006). A new framework for evaluating sponsorship opportunities. International Journal of Advertising, 25(4), 471-488.
Pope, N. K., Voges, K. E., & Brown, M. (2009). Winning ways. Journal of Advertising, 38(2), 5-20.Pope, N. K. L., & Voges, K. E. (1999). Sponsorship and image: a replication and extension. Journal of Marketing
Communications, 5(1), 17-28.Pope, N. K. L., & Voges, K. E. (2000). The impact of sport sponsorship activities, corporate image, and prior use
on consumer purchase intention. Sport Marketing Quarterly, 9(2), 96-102.Portlock, A., & Rose, S. (2009). Effects of ambush marketing: UK consumer brand recall and attitudes to official
sponsors and non-sponsors associated with the FIFA World Cup 2006. International Journal of Sports Marketing & Sponsorship, 10(4), 271-286.
PricewaterhouseCoopers. (2011). Changing the game. Outlook for the global sports market to 2015.Pruitt, S. W., Cornwell, T. B., & Clark, J. (2004). The NASCAR phenomenon: auto racing sponsorships and
shareholder wealth. Journal of Advertising Research, 44(3), 281-296.Punjaisri, K., & Wilson, A. (2011). Internal branding process: key mechanisms, outcomes and moderating
factors. European Journal of Marketing, 45(9/10), 1521-1537.Quester, P. G., & Farrelly, F. (1998). Brand association and memory decay effects of sponsorship: the case of
the Australian Formula One Grand Prix. Journal of Product and Brand Management, 7(6), 539-556.Quester, P. G., & Thompson, P. (2001). Advertising and promotion leverage on arts sponsorship effectiveness.
International Journal of Advertising, 41(1), 33-47.Reiser, M., Breuer, C., & Wicker, P. (2012). The sponsorship effect: Do sport sponsorship announcements impact
the firm value of sponsoring firms? International Journal of Sport Finance, 7(3), 232-248.Rosenberg, M. R., & Woods, K. P. (1995). Event sponsorship can bring kudos and recognition. Brand Marketing,
17(5), 13-19.Roy, D. P. (2005). Global Sport Sponsorship towards a strategic understanding. In J. Amis & T. B. Cornwell (Eds.),
Global sport sponsorship (Vol. 1, pp. 147-162). New York: Berg.Roy, D. P., & Graeff, T. R. (2003). Influences on consumer response to Winter Olympics sponsorship. International
Journal of Sports Marketing & Sponsorship, 4(4), 355-373.Rust, R. T., Ambler, T., Carpenter, G. S., Kumar, V., & Srivastava, R. K. (2004). Measuring marketing productivity:
current knowledge and future directions. Journal of Marketing, 68(3), 76-89.Rust, R. T., Lemon, K. N., & Zeithaml, V. A. (2004). Return on marketing: using customer equity to focus marketing
strategy. Journal of Marketing, 68, 109-127.Rust, R. T., Zeithaml, V. A., & Lemon, K. N. (2000). Driving customer equity - How customer lifetime value is
reshaping corporate strategy. New York: The Free Press.Santomier, J. (2008). New media, branding and global sports sponsorship. International Journal of Sports
Marketing & Sponsorship, 10(1).Séguin, B., Lyberger, M. R., O’Reilly, N., & McCarthy, L. (2005). Internationalising ambush marketing: a
comparative study. International Journal of Sports Marketing & Sponsorship, 6(4), 216-230.

114
RefeRences
Seiford, L. M. (1997). A bibliography for Data Envelopment Analysis (1978-1996). Annals of Operations Research, 73, 393-438.
Shank, M. D., & Beasley, F. M. (1998). Fan or fanatic: Refining a measure of sports involvement. Journal of Sport Behavior, 21(4), 435-444.
Simmons, C. J., & Becker-Olsen, K. L. (2006). Achieving marketing objectives through social sponsorships. Journal of Marketing, 70, 154-169.
Smith, R. J., & Blundell, R. W. (1986). An exogeneity test for a simultaneous equation Tobit model with an application to labor supply. Econometrica, 54(3), 679-685.
Speed, R., & Thompson, P. (2000). Determinants of sports sponsorship response. Journal of the Academy of Marketing Science, 28(2), 226-238.
SportBusiness Group (2009). SportBusiness in Numbers 2009-10. London.Stammerjohan, C., Wood, C. M., Chang, Y., & Thorson, E. (2005). An ampirical investigation of the interaction
between publicity, advertising, and previous brand attitudes and knowledge. Journal of Advertising, 34(4), 55-67.
Steenkamp, J.-B. E. M., Batra, R., & Alden, D. L. (2003). How perceived brand globalness creates brand balue. Journal of International Business Studies, 34(1), 53-56.
Stipp, H., & Schiavone, N. P. (1996). Modeling the impact of Olympic sponsorship on corporate image. Journal of Advertising Research, 36(4), 22-28.
Tavares, G. (2002). A Bibliography of Data Envelopment Analysis (1978-2001). New Jersey: RUTCOR, Rutgers Center for Operations Research.
Torres, A., Bijmolt, T. H. A., Tribó, J. A., & Verhoef, P. C. (2012). Generating global brand equity through corporate social responsibility to key stakeholders. International Journal of Research in Marketing, 2012(1), 13-24.
Verhoef, P. C., & Leeflang, P. S. H. (2009). Understanding the marketing department’s influence within the firm. Journal of Marketing, 73(2), 14-37.
Wakefield, K. L., Becker-Olsen, K., & Cornwell, T. B. (2007). I spy a sponsor. Journal of Advertising, 36(4), 61-74.Wakefield, K. L., & Bennett, G. (2010). Affective intensity and sponsor identification. Journal of Advertising,
39(3), 99-111.Walliser, B. (2003). An international review of sponsorship research: extension and update. International
Journal of Advertising, 22(1), 5-40.Weeks, C. S., Cornwell, T. B., & Drennan, J. C. (2008). Leveraging sponsorships on the internet: activation,
congruence, and articulation. Psychology & Marketing, 25(7), 637-654.Zhang, Z., Won, D., & Pastore, D. L. (2005). The effects of attitudes toward commercialization on college
students’ purchase intentions of sponsors’ products. Sport Marketing Quarterly, 14(3), 177-187.Zhou, N., Zhou, D., & Ouyang, M. (2003). Long-term effects of television advertising on sales of consumer
durables and nondurables. Journal of Advertising, 32(2), 45-54.

115
Samenvatting (Summary in Dutch)
Sportsponsoring is in enkele decennia uitgegroeid van een kleinschalige filantropische activiteit tot een onderdeel van het marketingbeleid dat bedrijfsmatig wordt aangepakt en waarin steeds grotere bedragen omgaan. Naar schatting wordt er momenteel wereldwijd 45 miljard US dollar uitgegeven aan sportsponsoring. In de huidige internationale sponsormarkt zijn miljoenendeals tussen bedrijven en bijvoorbeeld organisatoren van grote sportevenementen (zoals de Olympische Spelen), populaire teams (bijvoorbeeld Real Madrid en Manchester United) en individuele sporters (Usain Bolt) heel gebruikelijk. Gegeven de aanzienlijke investeringen die nodig zijn om een officiële sponsor te worden en in het licht van de huidige economische situatie wordt het voor sponsormanagers steeds belangrijker om de effectiviteit van hun projecten aan te tonen. Parallel aan deze ontwikkeling valt er de laatste jaren een sterke toename te constateren in het aantal wetenschappelijke studies naar sportsponsoring. Hoewel deze onderzoeken hebben bijgedragen aan de ontwikkeling van het vakgebied, blijft de effectiviteit van sportsponsoring ter discussie staan. Daarom pleiten diverse wetenschappers voor nader onderzoek van de diverse effecten van sponsoring (e.g. Breuer & Rumpf, 2012; Cornwell, 2008). Dit proefschrift levert een bijdrage aan het vakgebied met verschillende studies naar de effectiviteit en efficiëntie van sportsponsoring. Hierbij worden diverse succesfactoren blootgelegd. In hoofdstuk 2 van de dissertatie wordt gestart met een literatuurstudie van voorgaand wetenschappelijk onderzoek naar de effecten van sponsoring. Dit leidt tot een conceptueel model waarin een overzicht wordt gegeven van de verschillende mogelijke uitkomsten van sportsponsoring en de factoren die een rol spelen in het bereiken van deze uitkomsten. Vervolgens worden in de empirische hoofdstukken diverse onderdelen uit het conceptueel model nader uitgewerkt en onderzocht. In hoofdstuk 3 staan de cognitieve effecten van sportsponsoring centraal, met nadrukkelijke aandacht voor de ontwikkeling van de bekendheid van een sponsorship in de tijd. In dit hoofdstuk onderzoeken we met behulp van een logit model de verschillende factoren die sponsorbekendheid beïnvloeden bij de doelgroep. De gegevens die we gebruiken zijn afkomstig uit consumentenonderzoeken met betrekking tot de sponsorovereenkomst tussen Heineken en UEFA Champions League. In hoofdstuk 4 maken we van dezelfde data gebruik om de sponsor equity (een positieve verandering in de houding en koopintentie ten aanzien van de sponsor Heineken) te onderzoeken in negen verschillende landen over de hele wereld. Tot slot analyseren we in hoofdstuk 5 de relatieve efficiëntie van Nederlandse sponsorships. Hiervoor gebruiken we Data Envelopment Analysis (DEA) als analysemethode. Dit levert inzichten op in de relatieve efficiëntie op projectniveau en tevens identificeren we in dit hoofdstuk diverse factoren die van invloed zijn op de efficiëntie van sponsorprojecten.

116
SAMENVATTING (SUMMARY IN DUTCH)
BelangrijksteResultatenIn hoofdstuk 2 beschrijven we de uitkomsten van een literatuurstudie naar de mogelijke uitkomsten van sponsoring (vanuit het perspectief van de sponsor) en de verschillende factoren die hierin een rol spelen. We identificeren vier mogelijke manieren waarop sponsoring waarde kan creëren voor de sponsor, namelijk: via versterking van de merkwaarde, via interne marketing, via relatiemarketing en door een direct effect van de aankondiging van een sponsorovereenkomst op de aandelenkoers. In ons conceptueel model (hoofdstuk 2) is verwerking van het sponsorship (bewust dan wel onbewust) door de doelgroep een belangrijke voorwaarde voor een positieve sponsoruitkomst. Er zijn diverse factoren aan te wijzen die dit beïnvloeden. Ten eerste is de invulling van de sponsorovereenkomst en de bijbehorende activering van belang. Verschillende aspecten verdienen hierbij de aandacht: de mate en kwaliteit van de zichtbaarheid (exposure), de duur van de sponsorovereenkomst, de integratie met andere marketing(communicatie-)activiteiten en de hoeveelheid en invulling van de activering van het sponsorship. Daarnaast spelen de condities in de sponsormarkt en de individuele kenmerken van de doelgroep een belangrijke rol. In de eerste categorie vallen het aantal en type aanwezige andere sponsoren, de sportieve prestaties van het sponsorobject en ambush activiteiten (niet-officiële sponsors die zich zonder overeenkomst proberen te associëren met een sponsorobject). Voor wat betreft de kenmerken van de doelgroep dient er rekening gehouden te worden met de betrokkenheid bij de sport en het sponsorobject, de gepercipieerde passendheid tussen sponsor en sponsorobject (ook wel fit genoemd), de houding ten aanzien van sponsoring in het algemeen en de kennis en houding ten aanzien van de sponsor voorafgaand aan het sponsorship.
Hoofdstuk 3 van dit proefschrift geeft inzicht in de cognitieve verwerking van sponsoring door consumenten, in de context van sponsoring van de UEFA Champions League door Heineken. We hebben de bekendheid van het sponsorship (zowel spontaan als geholpen gemeten) over een tijdperiode van vier jaar met halfjaarlijkse meetpunten onderzocht en vonden een positief tijdseffect. De grootste toename in sponsorbekendheid werd waargenomen in het tweede seizoen van het sponsorship. Een andere belangrijke uitkomst van deze studie is het kleine, negatieve effect van sportief succes op sponsorbekendheid. Een mogelijke verklaring voor dit resultaat is dat de aandacht van het publiek wellicht meer gericht is op de actie en de spelers in het veld (en hierdoor minder op de communicatiedragers van league sponsors) wanneer clubs uit eigen land goed presteren. In het derde hoofdstuk hebben we tevens de betrokkenheid van de doelgroep op verschillende niveaus onderzocht: individuele betrokkenheid bij de sport en met betrekking tot het sponsorobject. De uitkomsten wijzen erop dat betrokkenheid bij het sponsorobject een sterkere invloed heeft op de bekendheid van het sponsorship dan betrokkenheid bij de sport.

117
SAMENVATTING (SUMMARY IN DUTCH)
De uitkomsten wijzen daarnaast op aanzienlijke verschillen tussen landen in het niveau van bekendheid van het sponsorship. Mogelijke oorzaken hiervan zijn verschillen in wetgeving, merkbekendheid, concurrentieniveau en de condities in de sponsormarkt. In hoofdstuk 4 van dit proefschrift wordt eveneens aandacht besteed aan verschil in sponsoruitkomsten tussen landen. Tot slot is een aantal controlevariabelen, welke gebaseerd zijn op eerder onderzoek, opgenomen in het model. Hieronder vallen de gepercipieerde fit, gebruik van het merk, activering en demografische variabelen (leeftijd, geslacht en opleidingsniveau). De effecten hiervan zijn conform eerdere bevindingen. In hoofdstuk 4 hebben we onderzocht in hoeverre internationale sponsoring in meerdere landen een positief effect op consumenten sorteert. We hebben in negen verschillende landen onderzocht in hoeverre de sponsoring van UEFA Champions League een positieve verandering in de houding en koopintentie ten aanzien van de sponsor Heineken teweeg brengt. Twee van deze landen hebben geen deelnemende clubteams in UEFA Champions League; op deze manier hebben we het effect van participatie onderzocht. In alle onderzochte landen is een positief sponsoreffect gevonden. Dit wijst erop dat een sponsorproject in meerdere landen tegelijkertijd waarde kan creëren. Ook in landen die niet deelnemen aan het evenement, maar waar het wel wordt uitgezonden, vinden we een positief effect. Deelname van clubteams uit een land is dus geen absolute voorwaarde voor succes van het sponsorship in dat land.Wel vinden we aanzienlijke verschillen tussen landen in de grootte van het sponsoreffect, wat erop kan wijzen dat sponsoring in het ene land effectiever is dan in het andere. Mogelijke verklaringen hiervoor zijn verschillen in de perceptie van het sponsorobject en de sponsor, verschillende activeringsniveaus, culturele verschillen en de lokale condities in de sponsormarkt. De resultaten uit deze studie bevestigen tevens resultaten uit eerder onderzoek met betrekking tot de variabelen die van invloed zijn op sponsor equity. De betrokkenheid van de doelgroep bij het sponsorobject en de gepercipieerde passendheid hebben wederom een belangrijke invloed op de uitkomst van het sponsorship. Verder vinden we ook in deze studie een positief tijdseffect.
In hoofdstuk 5 staat de relatieve efficiëntie van sponsorprojecten centraal. Met efficiëntie wordt bedoeld dat met zo min mogelijk middelen een maximaal resultaat wordt geboekt. Een project wordt in deze studie als relatief efficiënt geclassificeerd als geen enkel ander sponsorship binnen de steekproef een betere effect-budget ratio weet te bereiken. Om dit te onderzoeken hebben we input (geschat jaarlijks budget) en output gegevens (bekendheid van het sponsorship, houding ten aanzien van het sponsorship en gepercipieerde passendheid) verzameld over 72 Nederlandse sponsorships. Met behulp van de methode Data Envelopment Analysis (DEA) is de relatieve efficiëntie per project

118
SAMENVATTING (SUMMARY IN DUTCH)
berekend en dit heeft geresulteerd in een efficiëntie score per sponsorship. In totaal zijn negen van de 72 sponsorprojecten als efficiënt geclassificeerd: dit is vergelijkbaar met eerdere DEA toepassingen in marketing gerelateerde studies. De scores op zich geven geen waardeoordeel over de verschillende projecten, maar kunnen aanleiding zijn voor nader onderzoek.Om te onderzoeken welke variabelen van invloed zijn op de efficiëntie van een sponsorship hebben we vervolgens de efficiëntie scores in een Tobit model als afhankelijke variabele opgenomen. De resultaten wijzen uit dat het aantal andere sponsoren betrokken bij het sponsorobject een negatief effect heeft op de relatieve efficiëntie en dat de duur van de sponsorovereenkomst een positief effect sorteert. De populariteit van een sport heeft geen significant effect op efficiëntie, wat zou kunnen inhouden dat een potentieel positief effect van hoge media-aandacht bij populaire sporten zich vertaalt in een hogere benodigde investering, zodat de efficiëntie van dit type projecten niet per definitie hoger is dan bij het sponsoren van minder populaire sportobjecten.
ImplicatiesvoorSponsorsDit bevindingen van dit proefschrift leveren diverse inzichten op die relevant zijn voor sponsor managers. Specifiek kunnen een aantal factoren worden benoemd die van belang zijn voor een effectieve(re) inzet van sponsoring. Een belangrijk uitgangspunt afkomstig uit de literatuurstudie (hoofdstuk 2) is dat de uitkomsten van sponsoring afhankelijk zijn van de vooraf geformuleerde doelstellingen. Het vooraf op de juiste manier formuleren van doelstellingen is dan ook van cruciaal belang voor het in kaart brengen van de opbrengsten van sponsoring. Het formuleren van doelstellingen omvat een uitvoerige beschrijving en analyse van de eigen doelgroep. Hoofdstuk 2 van dit proefschrift wijst tevens uit dat het voor een succesvolle uitkomst van belang is dat het sponsorship (bewust of onbewust) effect heeft op de doelgroep. De invulling van de sponsorovereenkomst en de bijbehorende activering spelen hierin een belangrijke rol. De directe verantwoordelijkheid van de sponsor manager is daarom het sponsorconcept zo in te richten dat de kwantiteit en kwaliteit van de exposure maximaal zijn, dat de activering relevant wordt ingezet en dat het sponsorship wordt geïntegreerd in de overige marketingcommunicatie. Het valt tevens aan te bevelen de zichtbaarheid, bekendheid en perceptie van het sponsorship te meten onder de doelgroep gedurende de looptijd van de sponsorovereenkomst zodat tussentijds nog kan worden bijgestuurd. Een belangrijk inzicht uit dit proefschrift heeft betrekking op de duur van de sponsorovereenkomst. De bevindingen in hoofdstuk 3, 4 en 5 wijzen op een positief tijdseffect op sponsorbekendheid, sponsor equity en efficiëntie. Dit pleit voor lange-termijn sponsorovereenkomsten, als het sponsorship tot doel heeft bij te dragen aan de merkwaarde van de sponsor. Sponsor managers kunnen geen directe invloed uitoefenen op de omstandigheden in de sponsormarkt en evenmin op de kenmerken van de doelgroep, terwijl deze factoren wel

119
SAMENVATTING (SUMMARY IN DUTCH)
de uitkomst van het sponsorship sterk kunnen beïnvloeden. Daarom is het van belang deze aspecten te onderzoeken alvorens een sponsorovereenkomst wordt aangegaan. In de sponsormarkt zijn vooral het aantal en type andere sponsors van het sponsorobject van belang, zo blijkt uit hoofdstuk 2 en 5. Als er veel andere sponsors bij een sportobject betrokken zijn, kan het een lastigere opgave worden om bekendheid van het sponsorship te creëren. In dit geval valt het te overwegen een ander sponsorobject kiezen (waar minder andere partijen bij betrokken zijn) of er rekening mee te houden en extra te investeren in activering om het sponsorship bekend te maken. Voor wat betreft kenmerken van de doelgroep komen in hoofdstuk 2, 3 en 4 vooral de betrokkenheid van de doelgroep bij het sponsorobject en de gepercipieerde fit tussen de sponsor en het sponsorobject als belangrijke succesfactoren naar voren. Ook hier kan rekening mee gehouden worden bij het selecteren van een sponsorobject. Het is belangrijk een sportobject te kiezen waarbij de doelgroep in hoge mate betrokken is. Dit betekent niet dat alleen sponsoring van populaire sporten succesvol is; een minder mediagenieke sport met een kleinere, maar betrokken doelgroep die overeenkomt met de eigen doelgroep kan evengoed positieve uitkomsten genereren. Tevens verdient het aanbeveling om een sport en sponsorobject te selecteren die passen bij het productaanbod en de positionering van de sponsor. Als er geen ‘natuurlijke’ fit aanwezig is doordat de sponsor geen sport gerelateerde organisatie is, kan activering worden ingezet om de combinatie van de sponsor met het sponsorobject uit te leggen en zo fit te creëren. De resultaten uit hoofdstuk 4 van dit proefschrift wijzen erop dat sponsoring effect kan hebben in meerdere landen tegelijkertijd. Dit betekent dat sponsoring goed kan passen binnen een internationale marketing strategie. Echter, de resultaten in hoofdstuk 3 en 4 wijzen ook op aanzienlijke verschillen in sponsoreffecten tussen landen. Daarom raden wij aan de lokale sponsormarkt(en) te onderzoeken alvorens een internationaal sponsorproject te starten. Belangrijke punten waaraan aandacht kan worden besteed zijn de nationale wetgeving op het gebied van sponsoring en de perceptie van de doelgroep ten aanzien van sponsoring, het sponsorobject en de sponsor. Aan de hand van de uitkomsten kunnen activering budgetten over verschillende landen worden verdeeld en kan de sponsorcampagne globaal of lokaal worden ingericht.
ImplicatiesvoorhetSponsorobjectEen effectieve sponsorovereenkomst is gunstig voor zowel de sponsor als het gesponsorde object. Beide partijen hebben daarom de verantwoordelijkheid te investeren in een succesvolle relatie; vandaar ook dat de term partnership steeds vaker gebruikt wordt in een sponsoring context. De bevindingen uit dit proefschrift kunnen indien bekeken vanuit het perspectief van het sponsorobject relevant zijn bij het werven van nieuwe sponsors en voor het onderhouden van de relatie met huidige sponsors.

120
SAMENVATTING (SUMMARY IN DUTCH)
Bij het benaderen van potentiele sponsors, kan een sportobject inspelen op de diverse mogelijke sponsordoelstellingen en hierop inwerkende factoren, die uit het theoretisch model van hoofdstuk 2 en de verschillende kwantitatieve studies naar voren komen. Zichtbaarheid, de betrokkenheid van de doelgroep en gepercipieerde fit vormen belangrijke succesfactoren voor sponsors. Sportobjecten kunnen zichzelf aantrekkelijker maken voor sponsors door hier actief aan bij te dragen. Dit kan bijvoorbeeld door zelf actief media-aandacht te creëren, zoveel mogelijk leden en fans te werven en een goede relatie met hen te onderhouden (denk aan fanclubs). Daarnaast is een flexibele opstelling raadzaam ten aanzien van de invulling van de sponsorpakketten en het aanbieden van activeringsmogelijkheden. Het sportobject kan tevens zelf de link met de sponsor duidelijk communiceren naar de eigen doelgroep om zo de gepercipieerde fit te verhogen. In de hoofdstukken 2, 3 en 5 komt het gunstige effect van een lange looptijd van een sponsorovereenkomst op de sponsoruitkomst sponsor duidelijk naar voren. Lange-termijn sponsorrelaties zijn gunstig voor een sponsorobject omdat dit bijdraagt aan de financiële stabiliteit. Derhalve kunnen de bevindingen als argument dienen om een potentiele sponsor te overtuigen van de relevantie van een overeenkomst met een lange looptijd. In hoofdstuk 5 van dit proefschrift is een negatief effect gevonden van het aantal sponsors betrokken bij het sponsorobject op de efficiëntie van het sponsorship. Voor een organisatie die gesponsord wordt, is het daarom belangrijk te realiseren dat het aantrekken van nieuwe sponsors de waarde van de overeenkomst voor huidige sponsors onder druk kan zetten. Wij raden daarom aan goed te overleggen met huidige sponsors over het toetreden van nieuwe partijen, zeker wanneer deze een prominente positie gaan innemen. Tot slot hebben zowel de sponsor als het sponsorobject er belang bij als de sponsorover-eenkomst een succes wordt. Daarom hebben ook beide een verantwoordelijkheid in het meten van de uitkomsten. Wij raden daarom aan om gezamenlijk vooraf de sponsordoelstellingen te formuleren voor beide partijen, tussentijds de effecten te meten en gezamenlijk de uitkomsten te evalueren. Een benchmarkonderzoek, zoals in hoofdstuk 5 van dit proefschrift, kan hierbij een zinvol instrument zijn.

121
Acknowledgements
Writing these acknowledgements was one of the most difficult parts of the entire dissertation. This statement underlines the importance I attach to this piece. Fortunately the quality of the research is not influenced by this section (although it is probably the part of the thesis that most people will read). Nevertheless, it is the only opportunity to say some words to the people who contributed significantly to this multiple year research project and to my personal development. So it was important for me to find the right words.Writing this section also marks the end of my PhD period. Although I was struggling at several times and I experienced at first hand that the last mile was truly the longest, my overall feeling is that the period as a whole was not nearly as heavy and lonely as expected beforehand. Looking back at the past years, I especially consider it a time of learning, inspiration and pleasure. For this I would like to express my gratitude to a number of people and organisations.
First of all my supervisors: Ruud Koning and Tammo Bijmolt. Ruud, thank you for the ‘social support’ and showing me around in Groningen, for always sharing you extensive knowledge and providing me with advice and feedback from all around the world, and, of course for the lovely Micaffe coffees, lunches and even dinner at your place (also thanks to Padma)! Tammo, I am so glad you got involved in the project at a certain point in time. Your capability to bring research findings back to their essence and to make an attractive paper out of them always inspired and motivated me. Every time in the train back to Tilburg from Groningen after a meeting, I felt fully reloaded with energy and optimism.
The members of the internal and external dissertation committee: Maarten Gijsenberg, Bob Fennis, Erik Dietzenbacher, Maarten van Bottenburg, Christoph Breuer and Jaap Wieringa. I would like to thank you all for the time and effort invested in reading my dissertation and for your constructive, valuable feedback. Bart Los. Thank you for bringing in your enthusiasm, DEA-expertise and your multiple great suggestions regarding chapter 5 of this thesis.
Fontys Hogescholen and in particular Fontys Economische Hogeschool Tilburg enabled this research project. I am grateful for the unique opportunity to combine scientific research with teaching at a higher education institute. 20Knots, Heineken, Rabobank, Univé and Ricoh. I would like to thank these organisations for their support of this research, for their input from sponsoring practice and for making research data available. It was rewarding and thought-provoking to discuss the scientific perspectives of this research with partners from sponsoring practice.

122
ACKNOWLEDGEMENTS
My supervisors from Fontys: Maarten van Bottenburg and Mark van den Heuvel. Maarten, thank you for all your efforts in the start-up. And, Mark, thank you for your support towards the finish line. I learned a lot from both of you. My paranymphs: Marije van ’t Verlaat and Lotte Salome. Many cups of tea (Kandinsky beers after work) and chats with you relieved working life and added lots of fun.My colleagues from FEHT and in particular the SPECO team. Because I have always felt welcome at the institute and because coffee breaks and lunches in the docentenkamer are a welcoming distraction from long computer hours. Thank you for your interest and support!
My dear friends. Because letting off steam, laughing and relaxing are just as important for completing a PhD, as are concentration and hard work.My family in-law: Riet, Mart, Hans, Nanda and Kim Bartholomeus. Thanks to you Zaltbommel feels as my second home. My family: Papa, Mama, Oma, Iris, Bart and Mel. Thank you for your love and support with everything I do. It feels good to know that I can always fall back on you.At last, dear Joep, fortunately life is about more than ‘just’ a PhD project; it is about sleeping, eating, sharing a laugh, a tear, a home with a (silly) cat, amazing holiday trips, a good-luck hug…… Thank you for lighting up my life!