spline garch as a measure of unconditional volatility and its global macroeconomic causes
DESCRIPTION
Spline Garch as a Measure of Unconditional Volatility and its Global Macroeconomic Causes. Robert Engle and Jose Gonzalo Rangel NYU and UCSD. HISTORY OF THE US EQUITY MARKET VOLATILITY: S&P500. PLOT PRICES AND RETURNS HOW MUCH DO RETURNS FLUCTUATE?. MEAN REVERSION QUOTES. - PowerPoint PPT PresentationTRANSCRIPT
Spline Garch as a Measure of Unconditional Volatility and its Global Macroeconomic Causes
Robert Engle and Jose Gonzalo RangelNYU and UCSD
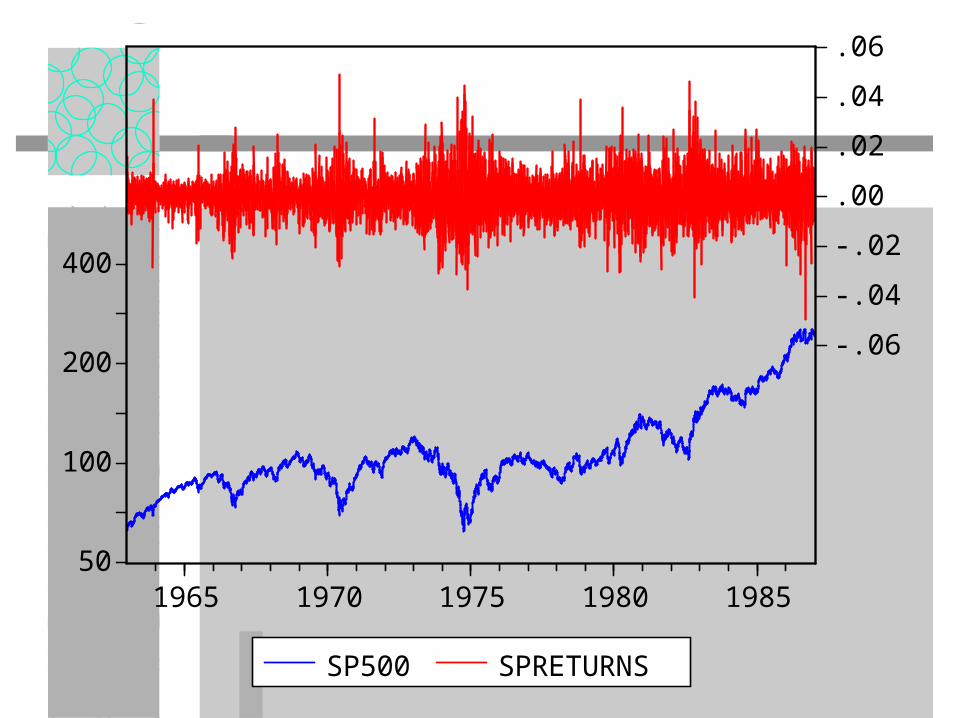
HISTORY OF THE US EQUITY MARKET VOLATILITY: S&P500
PLOT PRICES AND RETURNS
HOW MUCH DO RETURNS FLUCTUATE?

50
100
200
400
800
1600
-.3
-.2
-.1
.0
.1
65 70 75 80 85 90 95 00
SP500 SPRETURNS
50
100
200
400
-.06
-.04
-.02
.00
.02
.04
.06
1965 1970 1975 1980 1985
SP500 SPRETURNS

200
400
800
1600-.08
-.04
.00
.04
.08
1988 1990 1992 1994 1996 1998 2000
SP500 SPRETURNS

800
1000
1200
1400
1600
-.08
-.04
.00
.04
.08
1998 1999 2000 2001 2002 2003
SP500 SPRETURNS

MEAN REVERSION QUOTES
“Volatility is Mean Reverting”– no controversy
“The long run level of volatility is constant”– very controversial
“Volatility is systematically higher now than it has been in years”– Very controversial. Cannot be answered by
simple GARCH
DEFINITIONS
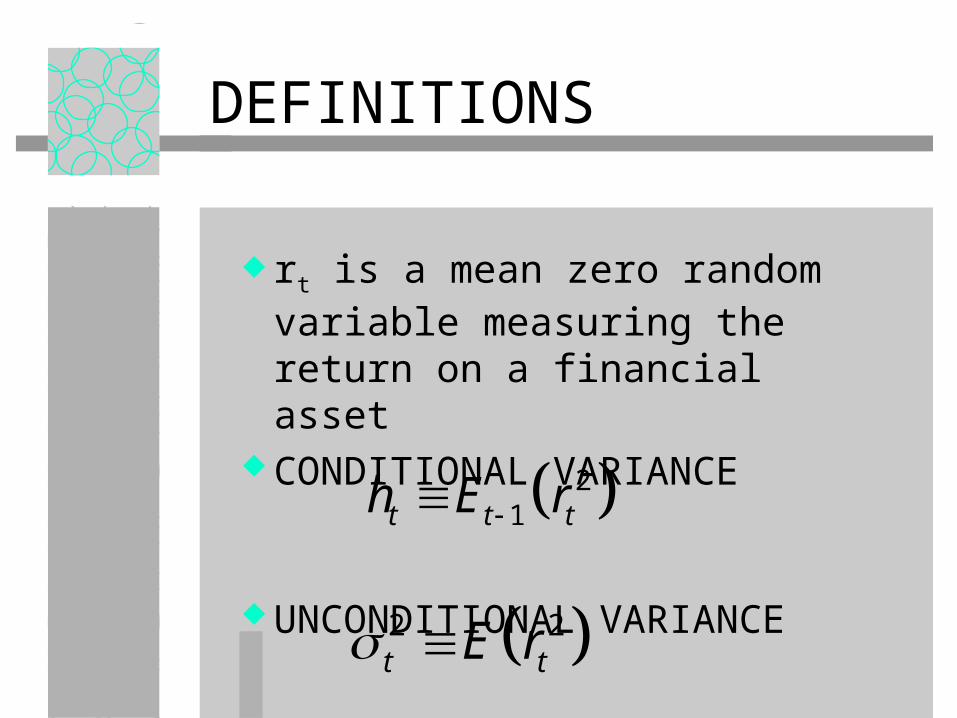
rt is a mean zero random variable measuring the return on a financial asset
CONDITIONAL VARIANCE
UNCONDITIONAL VARIANCE
21t t th E r
2 2t tE r
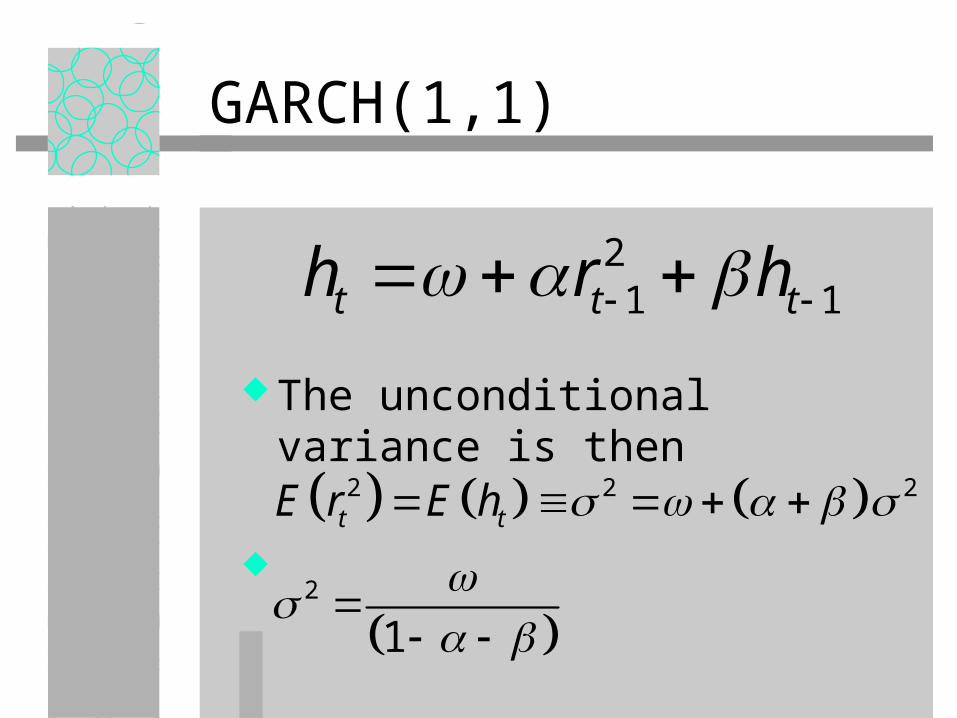
GARCH(1,1)
The unconditional variance is then
21 1t t th r h
2 2 2
2
1
t tE r E h
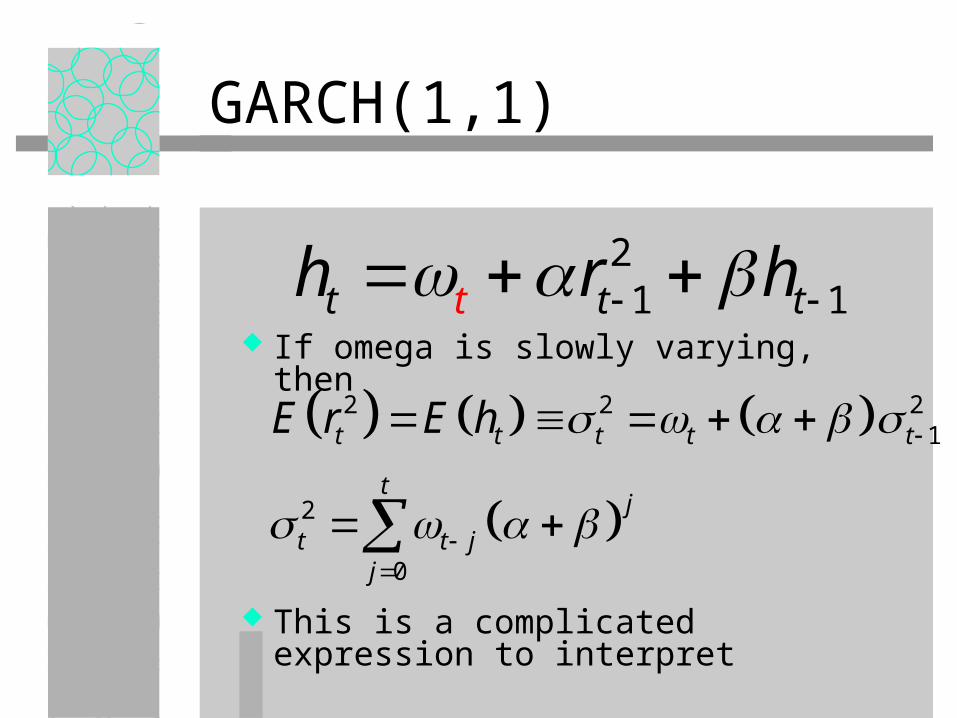
GARCH(1,1)
If omega is slowly varying, then
This is a complicated expression to interpret
21 1t t tth r h
2 2 21
2
0
t t t t t
tj
t t jj
E r E h

SPLINE GARCH
Instead, use a multiplicative form
Tau is a function of time and exogenous variables
1, where | (0,1)t t t t t tr g N
21
11
(1 ) tt t
t
rg g
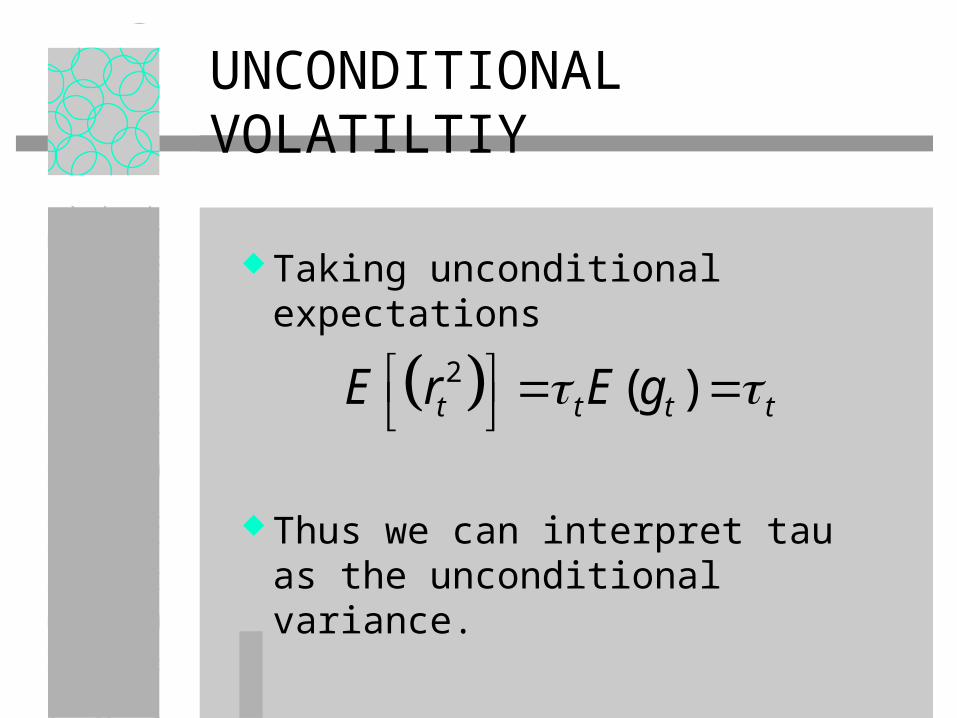
UNCONDITIONAL VOLATILTIY
Taking unconditional expectations
Thus we can interpret tau as the unconditional variance.
2 ( )t t t tE r E g
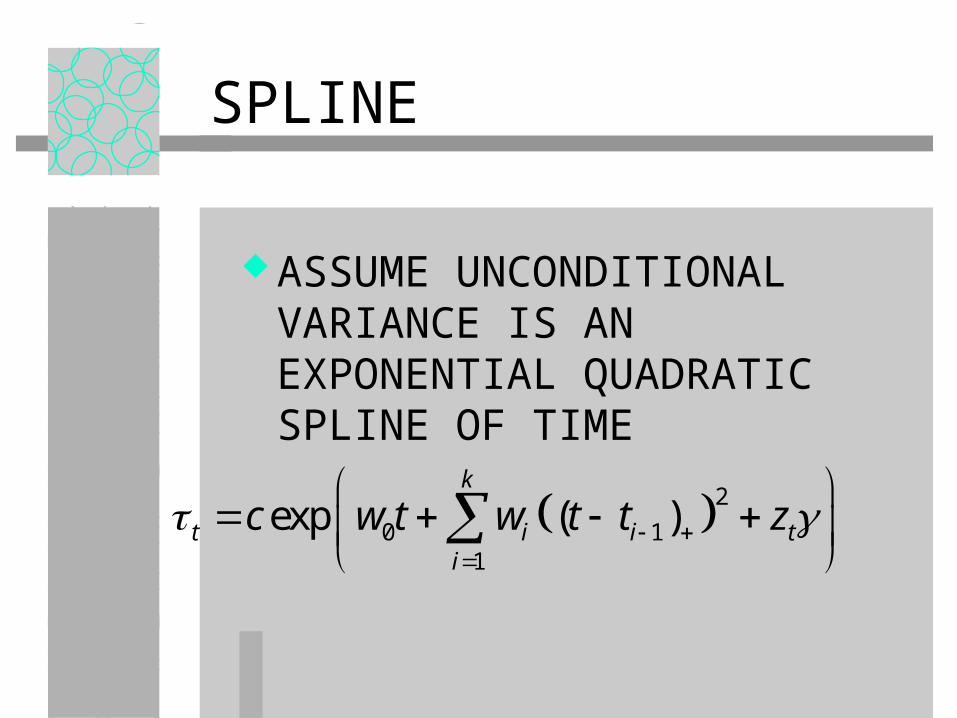
SPLINE
ASSUME UNCONDITIONAL VARIANCE IS AN EXPONENTIAL QUADRATIC SPLINE OF TIME
2
0 11
exp ( )k
t i i ti
c w t w t t z

THIS IS EASY TO COMPUTE
For K knots equally spaced, construct new regressors
22 20 1 2
1
log max ,0K
t k kk
t t t t
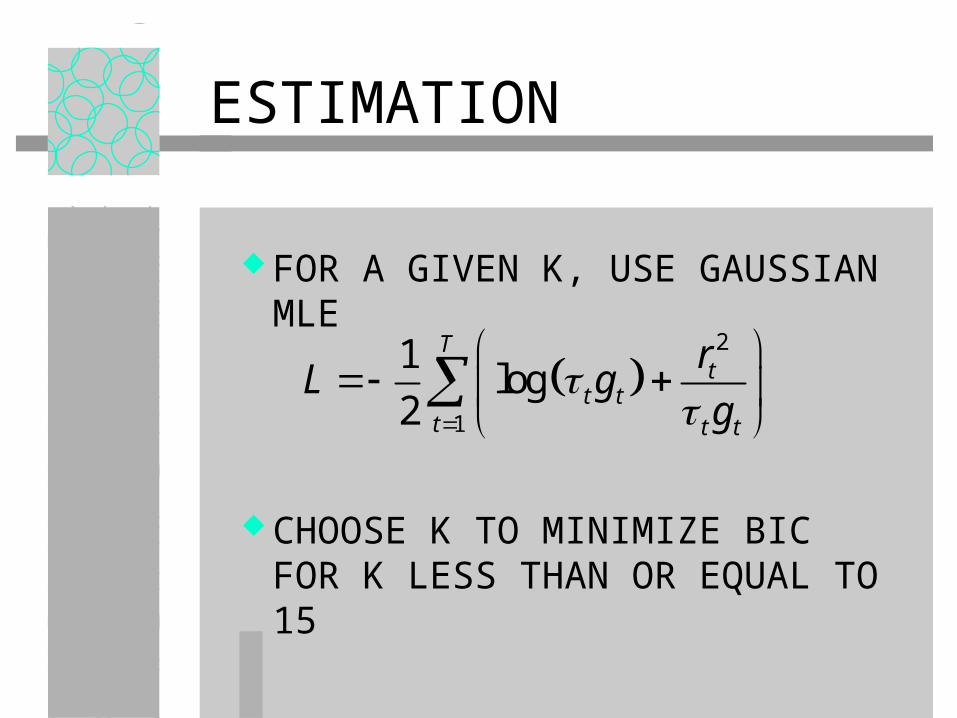
ESTIMATION
FOR A GIVEN K, USE GAUSSIAN MLE
CHOOSE K TO MINIMIZE BIC FOR K LESS THAN OR EQUAL TO 15
2
1
1log
2
Tt
t tt t t
rL g
g
EXAMPLES FOR US SP500
DAILY DATA FROM 1963 THROUGH 2004
ESTIMATE WITH 1 TO 15 KNOTS OPTIMAL NUMBER IS 7
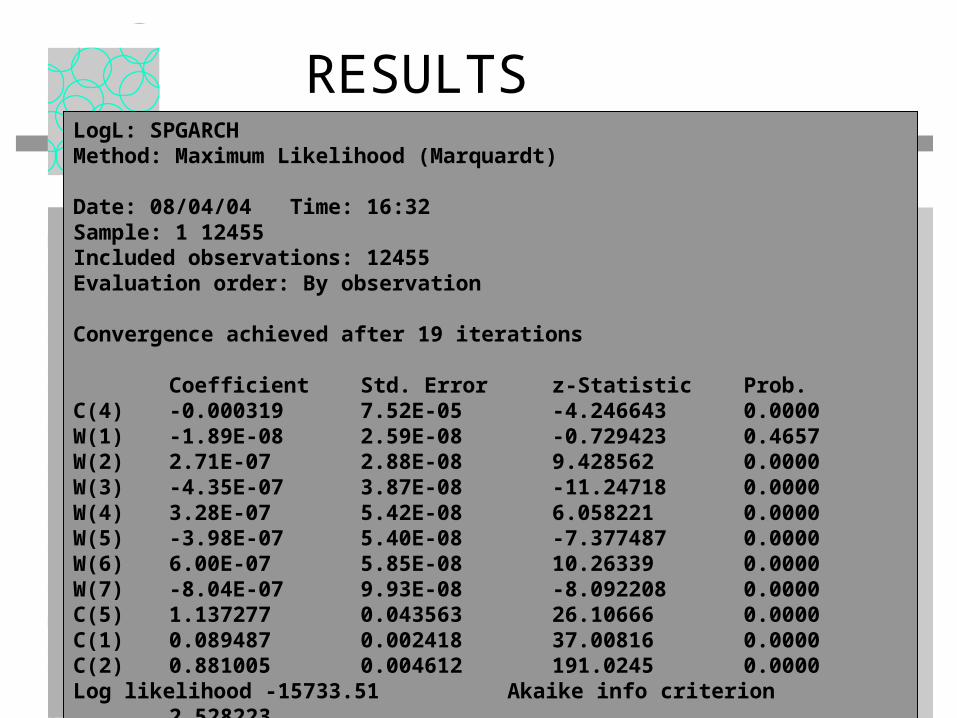
RESULTSLogL: SPGARCHMethod: Maximum Likelihood (Marquardt)
Date: 08/04/04 Time: 16:32Sample: 1 12455Included observations: 12455Evaluation order: By observationConvergence achieved after 19 iterations
Coefficient Std. Errorz-Statistic Prob. C(4) -0.000319 7.52E-05 -4.246643 0.0000W(1) -1.89E-08 2.59E-08 -0.729423 0.4657W(2) 2.71E-07 2.88E-08 9.428562 0.0000W(3) -4.35E-07 3.87E-08 -11.24718 0.0000W(4) 3.28E-07 5.42E-08 6.058221 0.0000W(5) -3.98E-07 5.40E-08 -7.377487 0.0000W(6) 6.00E-07 5.85E-08 10.26339 0.0000W(7) -8.04E-07 9.93E-08 -8.092208 0.0000C(5) 1.137277 0.043563 26.10666 0.0000C(1) 0.089487 0.002418 37.00816 0.0000C(2) 0.881005 0.004612 191.0245 0.0000Log likelihood -15733.51 Akaike info criterion 2.528223Avg. log likelihood -1.263228 Schwarz criterion 2.534785Number of Coefs. 11 Hannan-Quinn criter. 2.530420
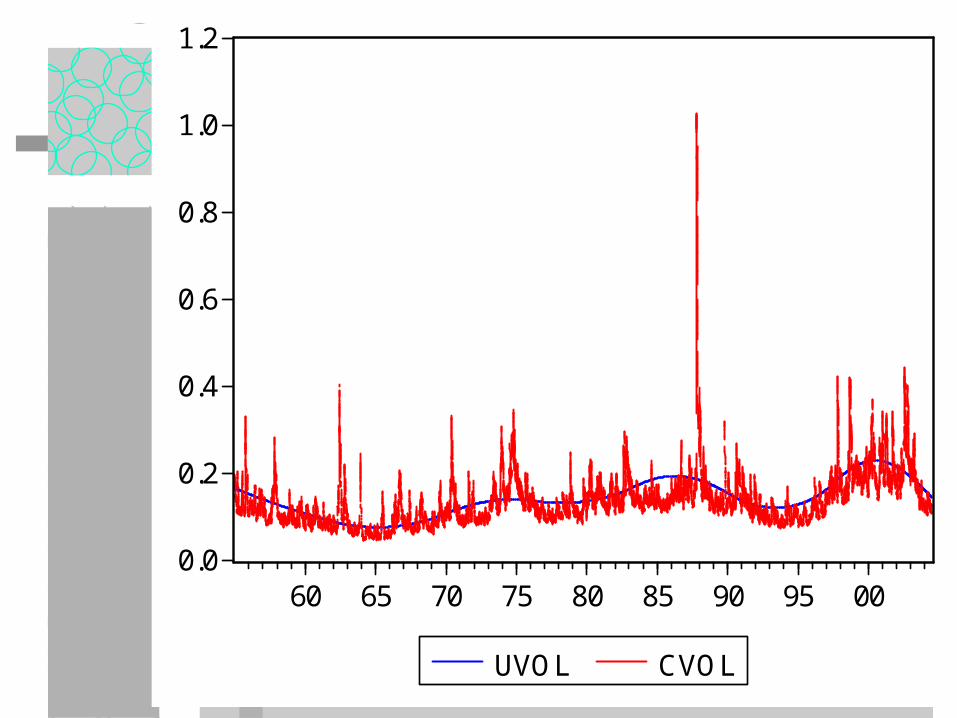
0.0
0.2
0.4
0.6
0.8
1.0
1.2
60 65 70 75 80 85 90 95 00
UVOL CVOL
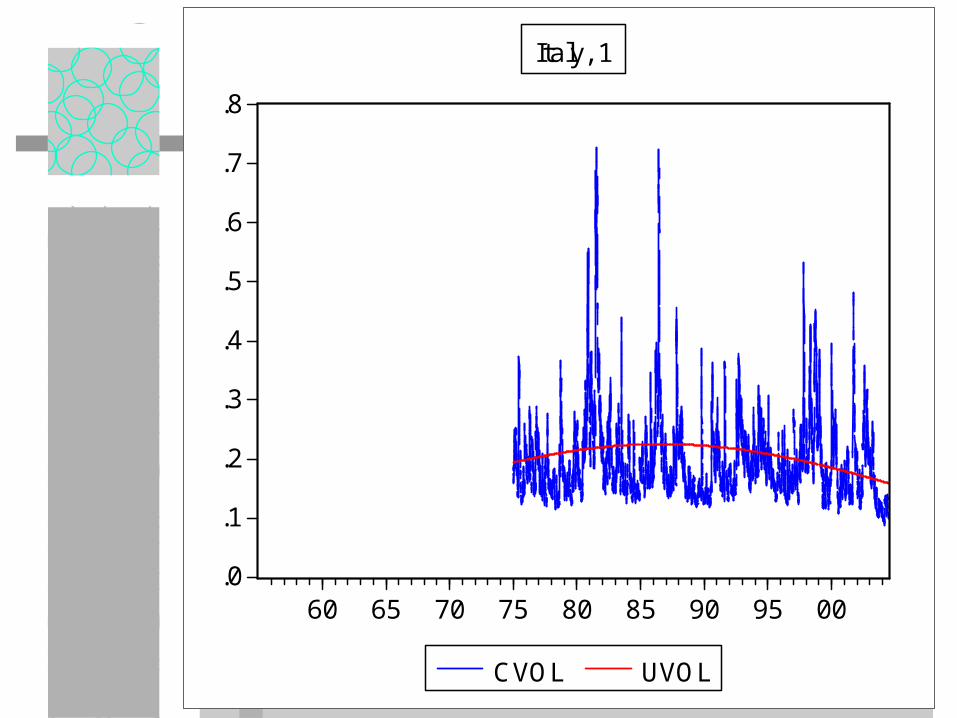
.0
.1
.2
.3
.4
.5
.6
.7
.8
60 65 70 75 80 85 90 95 00
CVOL UVOL
Italy, 1
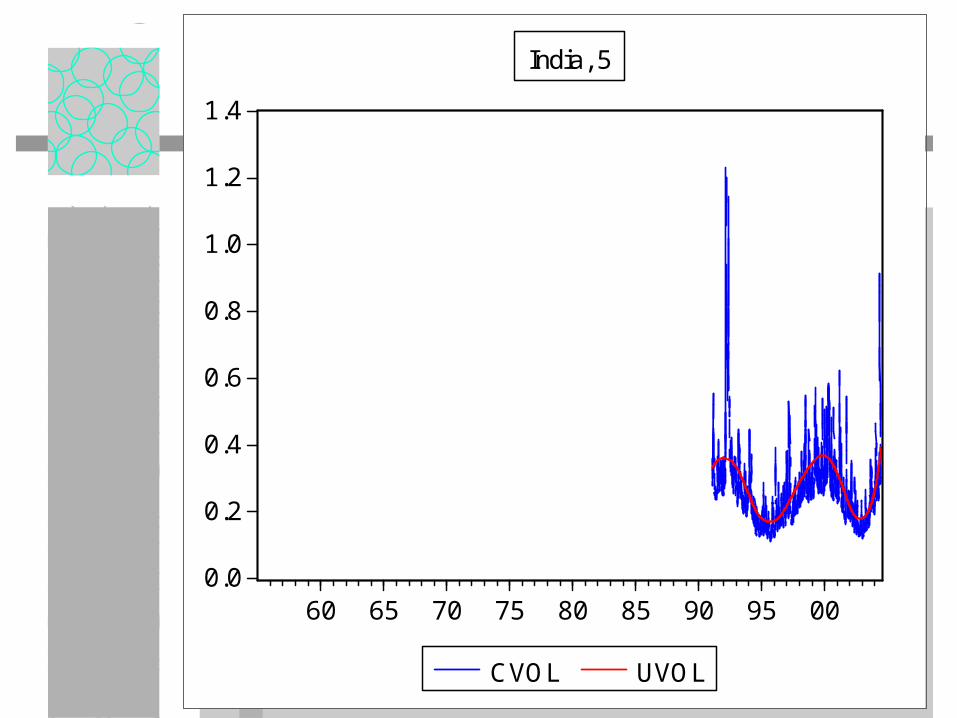
0.0
0.2
0.4
0.6
0.8
1.0
1.2
1.4
60 65 70 75 80 85 90 95 00
CVOL UVOL
India, 5

0.0
0.2
0.4
0.6
0.8
1.0
1.2
60 65 70 75 80 85 90 95 00
CVOL UVOL
Japan, 4

0.0
0.5
1.0
1.5
2.0
2.5
3.0
60 65 70 75 80 85 90 95 00
CVOL UVOL
Brazil, 6
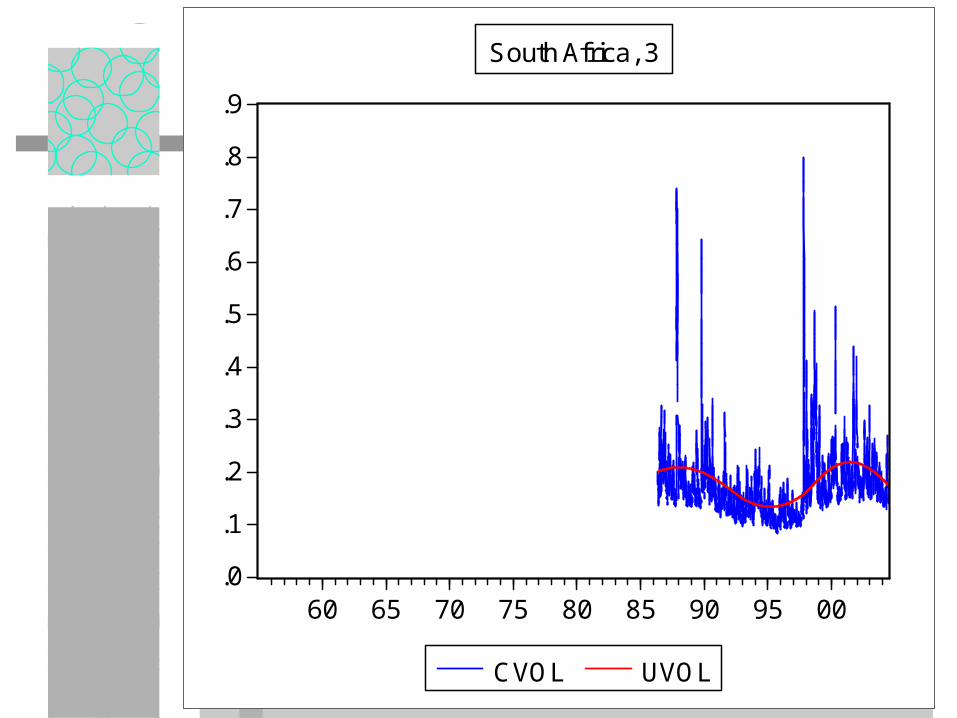
.0
.1
.2
.3
.4
.5
.6
.7
.8
.9
60 65 70 75 80 85 90 95 00
CVOL UVOL
South Africa, 3
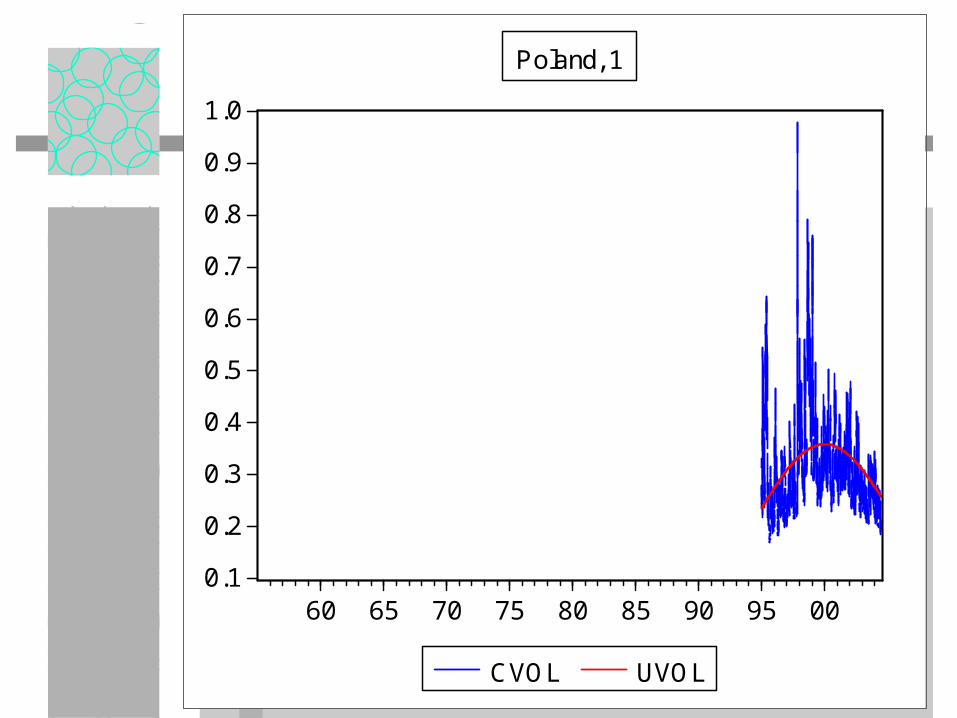
0.1
0.2
0.3
0.4
0.5
0.6
0.7
0.8
0.9
1.0
60 65 70 75 80 85 90 95 00
CVOL UVOL
Poland, 1

PATTERNS OF VOLATILITY
ASSET CLASSES– EQUITIES– EQUITY INDICES– CURRENCIES– FUTURES– INTEREST RATES– BONDS
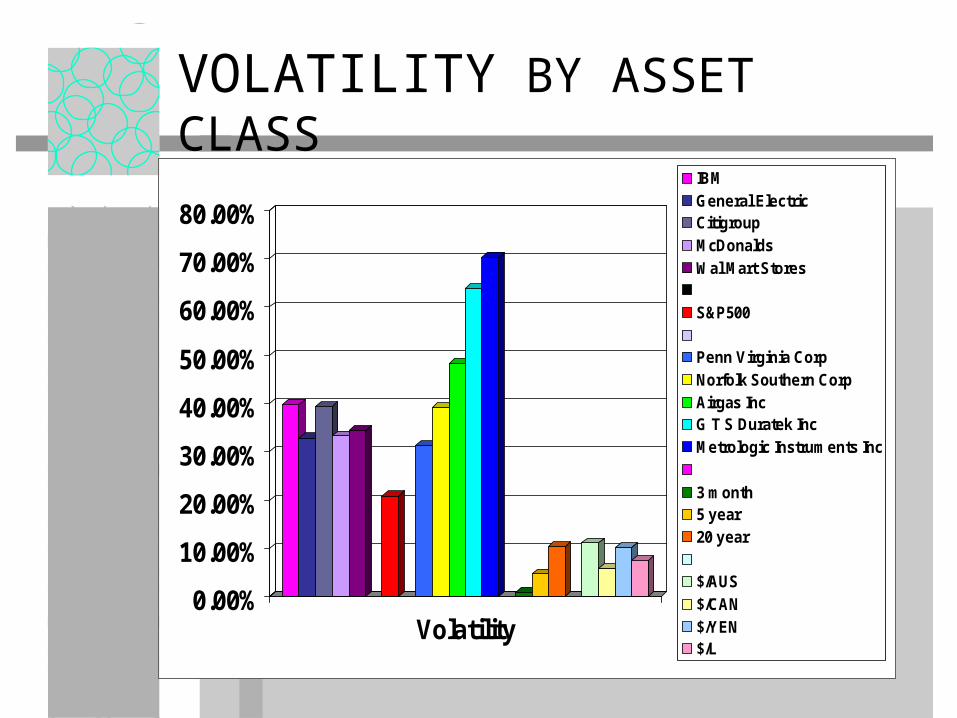
VOLATILITY BY ASSET CLASS
0.00%
10.00%
20.00%
30.00%
40.00%
50.00%
60.00%
70.00%
80.00%
Volatility
IBMGeneral ElectricCitigroupMcDonaldsWal Mart Stores
S&P500
Penn Virginia CorpNorfolk Southern CorpAirgas IncG T S Duratek IncMetrologic Instruments Inc
3 month5 year20 year
$/AUS$/CAN$/YEN$/L
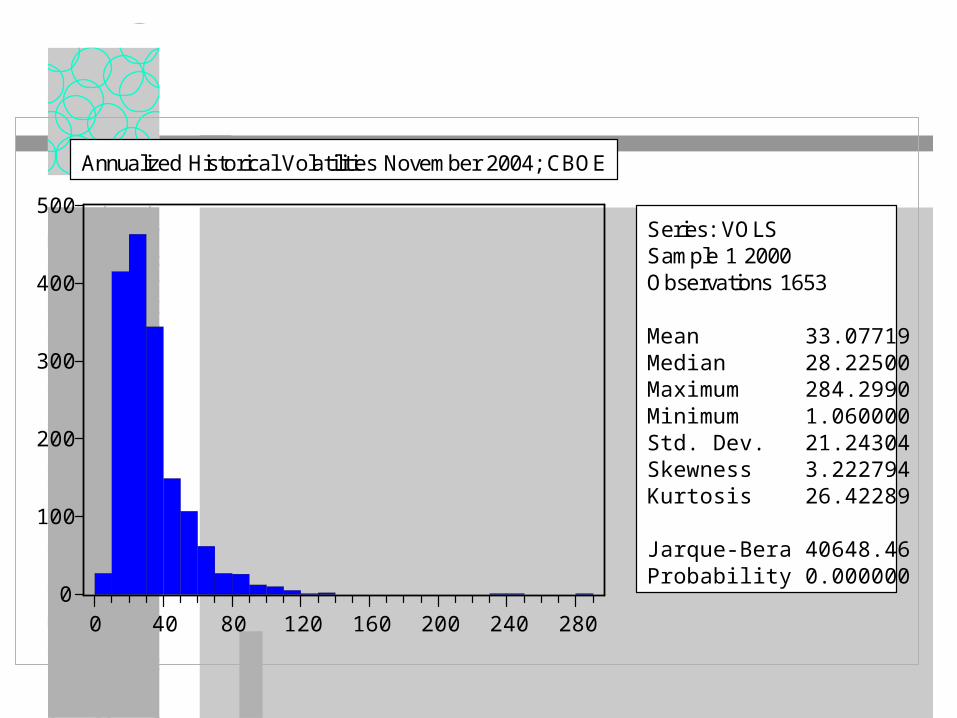
0
100
200
300
400
500
0 40 80 120 160 200 240 280
Series: VOLSSample 1 2000Observations 1653
Mean 33.07719Median 28.22500Maximum 284.2990Minimum 1.060000Std. Dev. 21.24304Skewness 3.222794Kurtosis 26.42289
Jarque-Bera 40648.46Probability 0.000000
Annualized Historical Volatilities November 2004; CBOE

PATTERNS OF EQUITY VOLATILITY
COUNTRIES– DEVELOPED MARKETS– EUROPE– TRANSITION ECONOMIES– LATIN AMERICA– ASIA– EMERGING MARKETS
Calculate Median Annualized Unconditional Volatility 1997-2003 using daily data

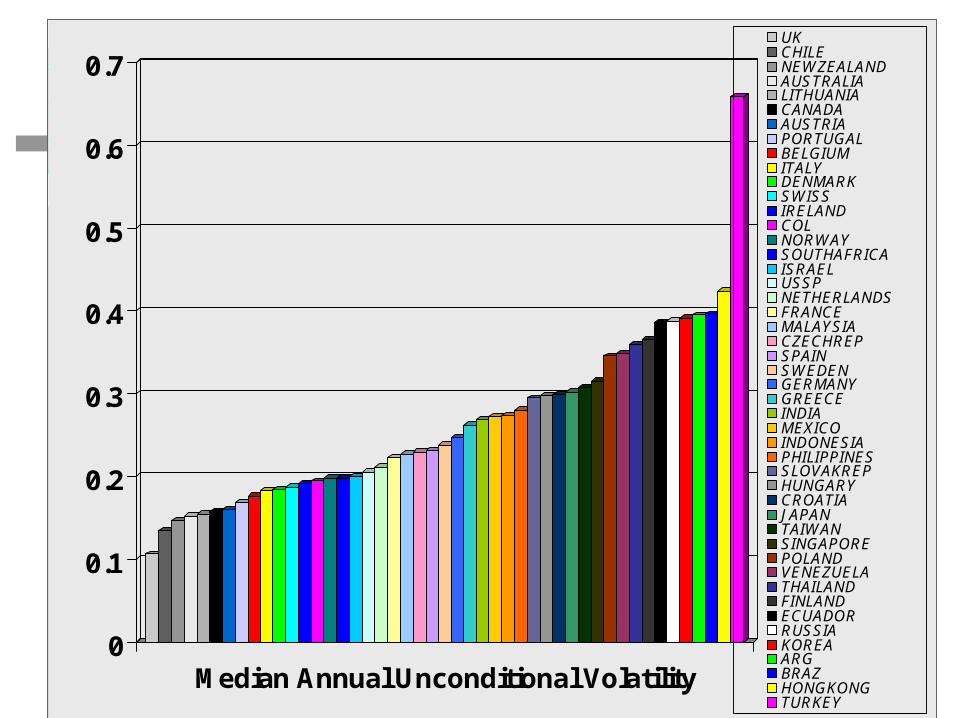
0
0.1
0.2
0.3
0.4
0.5
0.6
0.7
Median Annual Unconditional Volatility
UKCHILENEWZEALANDAUSTRALIALITHUANIACANADAAUSTRIAPORTUGALBELGIUMITALYDENMARKSWISSIRELANDCOLNORWAYSOUTHAFRICAISRAELUSSPNETHERLANDSFRANCEMALAYSIACZECHREPSPAINSWEDENGERMANYGREECEINDIAMEXICOINDONESIAPHILIPPINESSLOVAKREPHUNGARYCROATIAJAPANTAIWANSINGAPOREPOLANDVENEZUELATHAILANDFINLANDECUADORRUSSIAKOREAARGBRAZHONGKONGTURKEY

0
0.1
0.2
0.3
0.4
0.5
0.6
0.7
Median Annual Unconditional EmergingMarket Volatility
UKCHILENEWZEALANDAUSTRALIALITHUANIACANADAAUSTRIAPORTUGALBELGIUMITALYDENMARKSWISSIRELANDCOLNORWAYSOUTHAFRICAISRAELUSSPNETHERLANDSFRANCEMALAYSIACZECHREPSPAINSWEDENGERMANYGREECEINDIAMEXICOINDONESIAPHILIPPINESSLOVAKREPHUNGARYCROATIAJAPANTAIWANSINGAPOREPOLANDVENEZUELATHAILANDFINLANDECUADORRUSSIAKOREAARGBRAZHONGKONGTURKEY
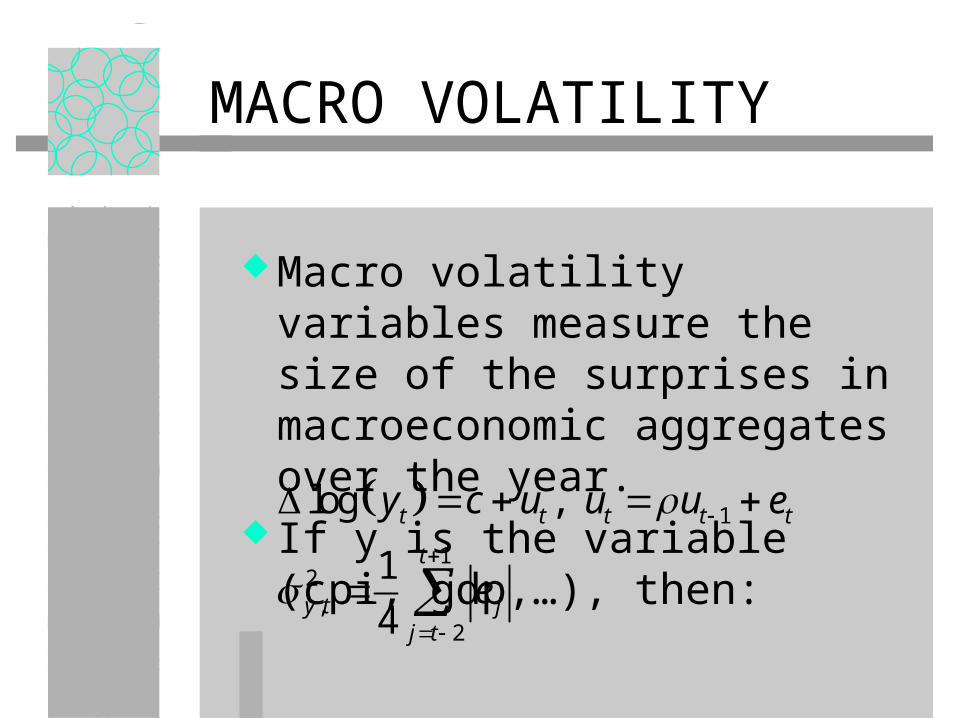
MACRO VOLATILITY
Macro volatility variables measure the size of the surprises in macroeconomic aggregates over the year.
If y is the variable (cpi, gdp,…), then:
1
12
,2
log ,
1
4
t t t t t
t
y t jj t
y c u u u e
e

0
0.01
0.02
0.03
0.04
0.05
0.06
Median Annual Volatility of GDP
UKCHILENEWZEALANDAUSTRALIALITHUANIACANADAAUSTRIAPORTUGALBELGIUMITALYDENMARKSWISSIRELANDCOLNORWAYSOUTHAFRICAISRAELUSSPNETHERLANDSFRANCEMALAYSIACZECHREPSPAINSWEDENGERMANYGREECEINDIAMEXICOINDONESIAPHILIPPINESSLOVAKREPHUNGARYCROATIAJAPANTAIWANSINGAPOREPOLANDVENEZUELATHAILANDFINLANDECUADORRUSSIAKOREAARGBRAZHONGKONGTURKEY

0
0.05
0.1
0.15
0.2
0.25
Median Annual Volatility of CPI
UKCHILENEWZEALANDAUSTRALIALITHUANIACANADAAUSTRIAPORTUGALBELGIUMITALYDENMARKSWISSIRELANDCOLNORWAYSOUTHAFRICAISRAELUSSPNETHERLANDSFRANCEMALAYSIACZECHREPSPAINSWEDENGERMANYGREECEINDIAMEXICOINDONESIAPHILIPPINESSLOVAKREPHUNGARYCROATIAJAPANTAIWANSINGAPOREPOLANDVENEZUELATHAILANDFINLANDECUADORRUSSIAKOREAARGBRAZHONGKONGTURKEY

0
0.05
0.1
0.15
0.2
0.25
0 0.2 0.4 0.6
VOLATILITY
MA
CR
O V
OL
GDP VOL
CPI VOL

EXPLANATORY VARIABLES
Name Descriptionemerging Indicator of Market Development (1=Emerging, 0=Developed)Transition Indicator of Transition Economies (Central European and Baltic Countries)log(mc) log Market Capitalization ($US)
log(gdp_dll) Log Nominal GDP in Current $USnlc Number of Listed Companies in the Exchange
grgdp GDP Growth Rategcpi Inflation Growth Rate
vol_irate Volatility of Short Term Interest Rate*
vol_forex Volatility of Exchange Rates*vol_grgdp Volatility of GDP*vol_gcpi Volatility of Inflation*
*Volatilities are obtained from the residuals of AR(1) models
Explanatory Variables
Table (2)
ESTIMATION
Volatility is regressed against explanatory variables with observations for countries and years.
Within a country residuals are auto-correlated due to spline smoothing. Hence use SUR.
Volatility responds to global news so there is a time dummy for each year.
Unbalanced panel
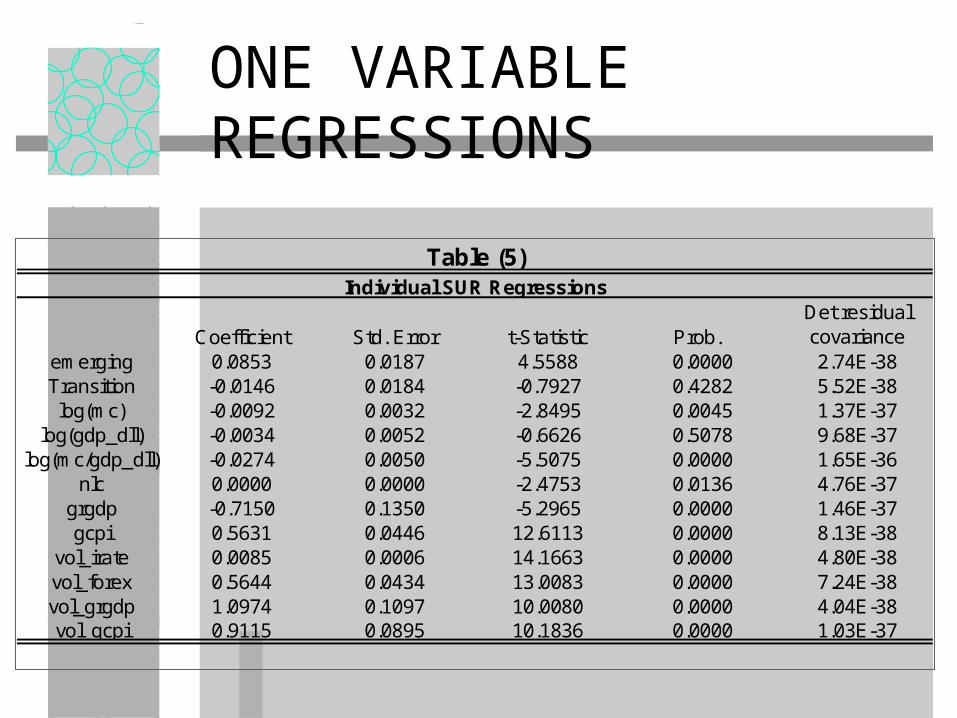
ONE VARIABLE REGRESSIONS
Coefficient Std. Error t-Statistic Prob. Det residual covariance
emerging 0.0853 0.0187 4.5588 0.0000 2.74E-38Transition -0.0146 0.0184 -0.7927 0.4282 5.52E-38log(mc) -0.0092 0.0032 -2.8495 0.0045 1.37E-37
log(gdp_dll) -0.0034 0.0052 -0.6626 0.5078 9.68E-37log(mc/gdp_dll) -0.0274 0.0050 -5.5075 0.0000 1.65E-36
nlc 0.0000 0.0000 -2.4753 0.0136 4.76E-37grgdp -0.7150 0.1350 -5.2965 0.0000 1.46E-37gcpi 0.5631 0.0446 12.6113 0.0000 8.13E-38
vol_irate 0.0085 0.0006 14.1663 0.0000 4.80E-38vol_forex 0.5644 0.0434 13.0083 0.0000 7.24E-38vol_grgdp 1.0974 0.1097 10.0080 0.0000 4.04E-38vol_gcpi 0.9115 0.0895 10.1836 0.0000 1.03E-37
Individual SUR Regressions
Table (5)

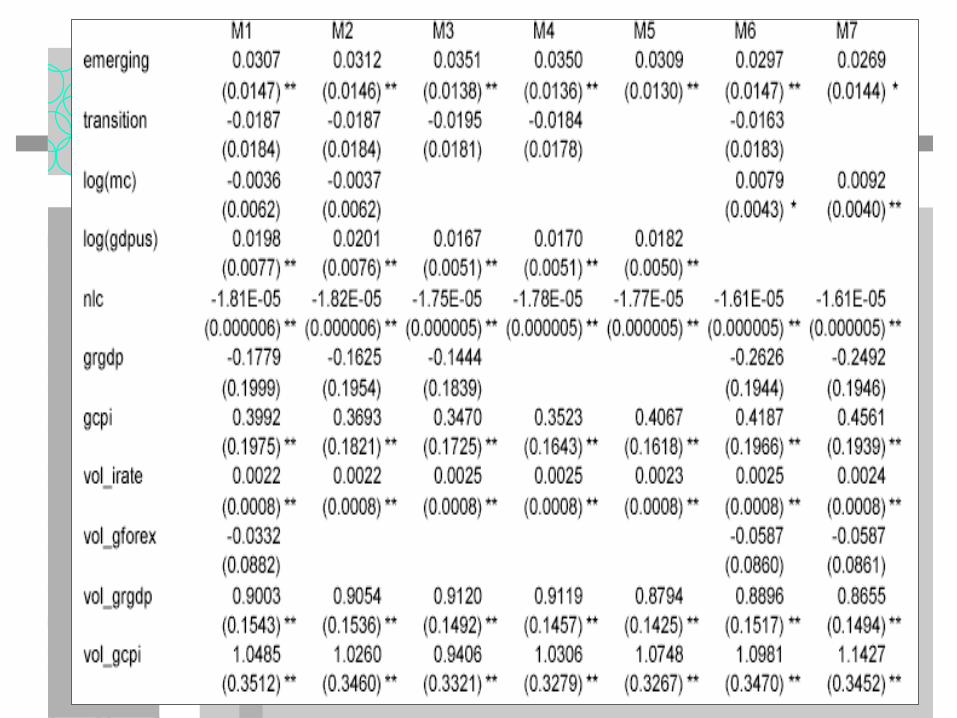
MULTIPLE REGRESSIONS
M1 M2 M3 M4 M5 M6 M7emerging 0.0307 0.0312 0.0351 0.0350 0.0309 0.0297 0.0269
(0.0147) ** (0.0146) (0.0138) (0.0136) (0.0130) (0.0147) ** (0.0144) *transition -0.0187 -0.0187 -0.0195 -0.0184 -0.0163
(0.0184) (0.0184) (0.0181) (0.0178) (0.0183)log(mc) -0.0036 -0.0037 0.0079 0.0092
(0.0062) (0.0062) (0.0043) * (0.0040)log(gdpus) 0.0198 0.0201 0.0167 0.0170 0.0182
(0.0077) ** (0.0076) (0.0051) (0.0051) (0.0050)nlc -1.81E-05 -1.82E-05 -1.75E-05 -1.78E-05 -1.77E-05 -1.61E-05 -1.61E-05
(0.000006) ** (0.000006) (0.000005) (0.000005) (0.000005) (0.000005) ** (0.000005)grgdp -0.1779 -0.1625 -0.1444 -0.2626 -0.2492
(0.1999) (0.1954) (0.1839) (0.1944) (0.1946)gcpi 0.3992 0.3693 0.3470 0.3523 0.4067 0.4187 0.4561
(0.1975) ** (0.1821) (0.1725) (0.1643) (0.1618) (0.1966) ** (0.1939)vol_irate 0.0022 0.0022 0.0025 0.0025 0.0023 0.0025 0.0024
(0.0008) ** (0.0008) (0.0008) (0.0008) (0.0008) (0.0008) ** (0.0008)vol_gforex -0.0332 -0.0587 -0.0587
(0.0882) (0.0860) (0.0861)vol_grgdp 0.9003 0.9054 0.9120 0.9119 0.8794 0.8896 0.8655
(0.1543) ** (0.1536) (0.1492) (0.1457) (0.1425) (0.1517) ** (0.1494)vol_gcpi 1.0485 1.0260 0.9406 1.0306 1.0748 1.0981 1.1427
(0.3512) ** (0.3460) (0.3321) (0.3279) (0.3267) (0.3470) ** (0.3452)d1990 0.1358 0.1349 0.1109 0.1079 0.1018 0.1148 0.1002
(0.0522) (0.0522) (0.0323) (0.0315) (0.0314) (0.0510) ** (0.0487)d1991 0.1442 0.1429 0.1202 0.1178 0.1112 0.1217 0.1066
(0.0523) (0.0522) (0.0317) (0.0311) (0.0308) (0.0512) ** (0.0487)d1992 0.1278 0.1262 0.1041 0.1014 0.0944 0.1074 0.0921
(0.0517) (0.0516) (0.0316) (0.0310) (0.0306) (0.0508) ** (0.0481) *d1993 0.1357 0.1344 0.1112 0.1082 0.1012 0.1107 0.0949
(0.0544) (0.0543) (0.0331) (0.0323) (0.0319) (0.0530) ** (0.0502) *d1994 0.1159 0.1146 0.0922 0.0889 0.0816 0.0922 0.0761
(0.0544) (0.0543) (0.0329) (0.0322) (0.0317) (0.0530) * (0.0501)d1995 0.1113 0.1101 0.0868 0.0836 0.0759 0.0877 0.0709
(0.0537) (0.0537) (0.0319) (0.0313) (0.0306) (0.0527) * (0.0495)d1996 0.1040 0.1029 0.0791 0.0754 0.0673 0.0805 0.0632
(0.0539) * (0.0539) * (0.0316) (0.0310) (0.0303) (0.0530) (0.0496)d1997 0.1218 0.1200 0.0954 0.0917 0.0842 0.0974 0.0806
(0.0543) (0.0541) (0.0314) (0.0308) (0.0303) (0.0532) * (0.0501) *d1998 0.1663 0.1645 0.1396 0.1375 0.1300 0.1385 0.1216
(0.0552) (0.0550) (0.0319) (0.0317) (0.0311) (0.0539) ** (0.0507)d1999 0.1832 0.1814 0.1549 0.1513 0.1435 0.1524 0.1346
(0.0565) (0.0563) (0.0319) (0.0314) (0.0307) (0.0550) ** (0.0516)d2000 0.1751 0.1734 0.1477 0.1442 0.1361 0.1467 0.1287
(0.0547) (0.0545) (0.0310) (0.0304) (0.0297) (0.0535) ** (0.0498)d2001 0.1578 0.1561 0.1309 0.1283 0.1207 0.1302 0.1126
(0.0539) (0.0538) (0.0307) (0.0303) (0.0297) (0.0529) ** (0.0494)d2002 0.1449 0.1429 0.1176 0.1148 0.1072 0.1197 0.1025
(0.0533) (0.0530) (0.0307) (0.0303) (0.0297) (0.0523) ** (0.0489)d2003 0.1185 0.1164 0.0905 0.0871 0.0797 0.0928 0.0753
(0.0553) (0.0550) (0.0314) (0.0308) (0.0303) (0.0541) * (0.0508)
2.29E-38 2.36E-38 2.01E-38 1.94E-38 2.06E-38 1.70E-38 1.82E-38
Standard errors reported in parentheses* Denotes significance at 10%**Denotes significance at 5%
0
0.05
0.1
0.15
0.2
1990 1994 1998 2002
Time Effects

ANNUAL REALIZED VOLATILITY
CONCLUSIONS AND IMPLICATIONS
Unconditional volatility changes in systematic ways.
Macro volatility is an important determinant of financial volatility
Potential justification for inflation targeting monetary policy as well as stabilization.
Big swings in global financial volatility are associated with US volatility.