spilman thomas & battle,pllc -...
TRANSCRIPT

SPILMAN THOMAS & BATTLE,PLLCATTORNEYS AT LAW
August 18, 2014
Gina McCarthyAdministratorU.S. Environmental Protection Agency1200 Pennsylvania Ave., NWWashington, D.C. 20460
James D. Elliott(717) 791-2012
jeltiotvkspilmanlaw.eom
VIA ELECTRONIC MAIL
RE: Comments of the Independent Petroleum Association of America, IndependentOil and Gas Association of West Virginia, Inc., Kentucky Oil & Gas Association,Inc., Pennsylvania Independent Oil & Gas Association, Ohio Oil and GasAssociation, Illinois Oil and Gas Association, Indiana Oil and Gas Association andthe Virginia Oil and Gas Association -- Oil and Natural Gas Sector: Reconsiderationof Additional Provisions of New Source Performance Standards; Docket ID No.EPA-HQ-OAR-2010-0505.
Dear Administrator McCarthy:
The Independent Petroleum Association of America, Independent Oil and GasAssociation of West Virginia, Inc., Kentucky Oil & Gas Association, Inc., PennsylvaniaIndependent Oil & Gas Association, Ohio Oil and Gas Association, Illinois Oil and GasAssociation, Indiana Oil and Gas Association, and the Virginia Oil and Gas Association(collectively, the "Independent Producers") appreciate the opportunity to submit comments onthe proposed rule entitled "Oil and Natural Gas Sector: Reconsideration of Additional Provisionsof New Source Performance Standards" ("Proposed Rule") and published in the Federal Registeron July 7, 2014 (79 Fed. Reg. 41752).
The Independent Petroleum Association of America ("IPAA") is an incorporated tradeassociation that represents thousands of independent oil and natural gas producers and servicecompanies across the United States that are active in the exploration and production segment ofthe industry, which often involves the hydraulic fracturing of wells. IPAA serves as an informedvoice for the exploration and production segment of the industry, and advocates its members'views before the United States Congress, the Administration and federal agencies.
The Independent Oil and Gas Association of West Virginia, Inc. ("IOGA-WV") is astatewide nonprofit trade association that represents companies engaged in the extraction andproduction of natural gas and oil in West Virginia, and the companies that support theseextraction and production activities. IOGA-WV was formed to promote and protect a strong,
PENNSYLVANIA 1 WEST VIRGINIA NORTH CAROLINA 1 VIRGINIA
1100 Bent Creek Boulevard I Suite 101 717.795.2740 I 717.795.2743 fax
Mechanicsburg, PA 17050 www.spilmanlaw.com

Gina McCarthyAugust 18, 2014Page 2
competitive and capable independent natural gas and oil producing industry in West Virginia, aswell as the natural environment of the state.
The Kentucky Oil & Gas Association, Inc. ("KOGA") was formed in 1931 to representthe interests of Kentucky's crude oil and natural gas industry, and more particularly, theindependent crude oil and natural gas operators, as well as the businesses that support theindustry. KOGA is comprised of 220 companies which consist of over 600 memberrepresentatives that are directly related to the crude oil and natural gas industry in Kentucky.
The Pennsylvania Independent Oil & Gas Association ("PIOGA") is a non-profitcorporation that was initially formed in 1978 to represent the interests of smaller independentproducers of Pennsylvania natural gas from conventional limestone and sandstoneformations. Through the years PIOGA's membership has grown to nearly 1,000 members: oiland natural gas producers, drilling contractors, service companies, engineering companies,manufacturers, marketers, Pennsylvania Public Utility Commission-licensed Natural GasSuppliers ("NGSs"), professional firms and consultants, and royalty owners. PIOGA promotesthe interests of its members in environmentally responsible oil and natural gas operations in bothconventional geologic formations and unconventional shale formations, and the development ofcompetitive markets and additional uses for Pennsylvania-produced natural gas.
The Ohio Oil & Gas Association ("OOGA") is a trade association with over 2,600members involved in all aspects of the exploration, production, and development of crude oil andnatural gas resources within the State of Ohio. OOGA represents the people and companiesdirectly responsible for the production of crude oil, natural gas, and associated products in Ohio.
Indiana Oil and Gas Association, Inc. ("INOGA") has a rich history of involvement in theexploration and development of hydrocarbons in the State of Indiana. INOGA was formed in1942 and historically has been an all-volunteer organization principally made up ofrepresentatives of oil and gas exploration and development companies (operators), however, ithas enjoyed support and membership from pipeline, refinery, land acquisition, service, supply,legal, engineering, and geologic companies or individuals. INOGA has been an activerepresentative for the upstream oil and gas industry in Indiana and provides a common forum forthis group. INOGA represents its membership on issues of state, federal, and localregulation/legislation that has, does, and will affect the business of this industry
The Illinois Oil & Gas Association ("TOGA") was organized in 1944 to provide anagency through which oil and gas producers, land owners, royalty owners, and others who maybe directly or indirectly affected by or interested in oil and gas development and production inIllinois, may protect, preserve and advance their common interests.
Formed in 1977 the Virginia Oil & Gas Association ("VOGA") is a non-profit tradeassociation representing the interests of companies, partnerships, individuals, or other entitieshaving an interest in the oil and gas industry and who are primarily engaged in the exploration,production, development, transportation, and distribution of natural gas and oil in Virginia.

Gina McCarthyAugust 18, 2014Page 3
The above associations came together, in large part, to comment on the original rule(individually, or as a member of IPAA), published on August 16, 2012; petition the United StatesEnvironmental Protection Agency ("USEPA") for reconsideration on October 15, 2012; and filea legal challenge in the United States Court of Appeals for the District Circuit to the August 16,2012 final rule because there are aspects of the final rule and Proposed Rule thatdisproportionally impact conventional wells and energized wells — particularly as it relates toreduced emission completions ("RECs"). The history and activities of the above associations arerelevant because of the depth of knowledge and unique position that many of their members havewithin the industry. The Independent Producers appreciate that the USEPA has recognized theproposed definition of a "low pressure well" proffered by the Independent Producers, but we areconcerned that the USEPA continues to misunderstand our concerns and has not justified itsdefinition of a low pressure well.
USEPA's preamble discussion of the low pressure well definition misses the point. Itstates in relevant part:
[T]he three parameters discussed above and used in the EPA definition are known byoperators in advance of flowback and that the relatively simple calculation called for inthe EPA definition could be performed with a basic hand-held calculator and should notpose difficulty or hardship for the smaller operators.
79 Fed. Reg. 41758. The "hardship" is not the calculation. The hardship is being required toperform RECs on marginally cost-effective wells that industry has historically recognized as lowpressure wells. While the ultimate calculation may be completed on a "basic hand-heldcalculator," it does not mean that the derivation of the formula or the results of the calculationaccurately depicts what constitutes a low pressure well.
Additionally, the preamble takes issue with the Independent Producers petition forreconsideration because it "did not include any details on which of EPA's assumptions isquestionable . . .." Id. While we provide details in these comments, USEPA's statement requiresthat we emphasize that the burden to justify the rule is on USEPA, not the IndependentProducers or any other commenters. One of the key assumptions to the USEPA's definition is itsreliance on the Turner equation to calculate the minimum gas velocity needed to lift a droplet.1This equation is used to predict the velocity needed to lift to the surface the proppant used tohydraulically fracture the well. The Turner equation is from a 1969 article in the Oil and GasJournal.2 The equation is based on a droplet reversal model. Independent Producers are notaware of the oil and gas industry using the Turner equation for any practical applications (unlikeIndependent Producers' proposed definition which relies on industry accepted calculations).
I Oil and Natural Gas Sector: Standards of Performance for Crude Oil and Natural Gas Production, Transmission,and Distribution, Background Supplemental Technical Support Document for the Final New Source PerformanceStandards, pp. 34-37 (April 2012).2 Turner, R. G., et. al., Analysis and Prediction of Minimum Flow Rate for the Continuous Removal of Liquids fromGas Wells, Journal of Petroleum Technology, Nov. 1969, Equation 4, at 1476.

Gina McCarthyAugust 18, 2014Page 4
Independent Producers site a recent engineering doctoral dissertation at the TulsaUniversity that compared several methods of calculating liquid loading in a well, which it isrelevant as it pertains to the equations used by USEPA to develop a definition of a low pressurewell. The dissertation was delivered by Dr. Shu Luo, a graduate student at Tulsa University, in2013. His advisor was Dr. Mohan Kelkar, head of the Petroleum Engineering Department. Dr.Lho's abstract follows.
When natural gas is produced from gas wells, it is always accompanied by liquid. At thelater stages of a well's life, the gas is unable to carry liquid to the surface, resulting inliquid accumulation at the bottom of the well; this is called "Liquid Loading". Knowingwhen the liquid loading will occur is important because by using certain artificial liftmethods the well can be produced under stable conditions even after the transition. Themost popular method in the literature for determining the onset of liquid loading is theequation developed by Turner et al. This equation is a droplet model and is based on theterminal velocity of liquid droplet in single phase gas column. Many modifications havebeen proposed to this equation to improve the prediction of liquid loading. Recently,Veeken et al. have shown that in many inclined and some vertical wells, Turner'sequation under-predicts the true critical flow rate (the flow rate at which liquid loadingstarts). This may be due to angle of deviation as well as the fact that inception of liquidloading is more likely due to liquid film reversal in annular flow rather than droplet fallback.
In this dissertation, the inception of liquid loading is defined using the liquid film reversalmodel based on experimental observation. Also, a new liquid loading model which isbased on liquid film reversal is proposed. We base our model on Barnea's model andmake several improvements to that model for better prediction of liquid loading. Theimprovements include: (i) development of variable film thickness model to account forthe deviation angle of the well; (ii) development of equation to account for annular flow;and (iii) improvement of the friction factor equation at the interface between the liquidfilm and the gas core. We validated our model against all the available data from theliterature as well as additional data collected from various operators. The results showremarkable improvement over Turner's original method as well as various ad hocmodifications made to that equation. A method which determines the unloading of a gaswell after shut in will also be discussed.
In this dissertation, we also explore one possible method to eliminate liquid loading.Injection of surfactant is one of the common methods used for avoiding liquid loading ingas well. Using our definition of liquid loading, the stability of foam flow can bepredicted. We also propose a correlation for liquid holdup in foam flow and compare thepredictions with experimental data. Based on the large scale experimental data, we

Gina McCarthyAugust 18, 2014Page 5
provide a preliminary model for predicting foam flow and articulate reasons why thefoam works in preventing liquid loading.3
In relevant part, according to the recent research, the Turner equation typically under-predicts thevelocity necessary to unload the well. Since the Turner equation under-predicts velocity, theresulting USEPA low pressure well formula then also under-predicts the pressure necessary for awell to flowback without assistance. For instance, to increase velocity in the well tubing, whichhas a fixed flow area, the flow rate of gas must be increased to carry the liquid up the tubing. Toincrease the flow rate within a given pipe size, pressure must increase. Operators will sometimesinstall smaller tubing to decrease flow area, which also increases velocity. This is one exampleof where USEPA's derivation of a complex equation to define low pressure well is flawed. Amore accurate low pressure well definition should rely on the liquid film reversal model versusthe Turner equation, and result in a higher pressure threshold than currently proposed by theUSEPA. Again, the burden is on USEPA to justify its definition and not to simply question thealternative definition proposed by the Independent Producers. USEPA's reliance on an outdatedequation not recognized or utilized by the industry is inappropriate.
As to the Independent Producers' alternative definition of a low pressure well,Independent Produce proposed the following more simple definition for "low pressure well."
"A well where the field pressure is less than 0.433 times the vertical depth of the deepesttarget reservoir and the flow-back period will be less than three days in duration."
This definition was based on the weight of fresh water (8.33 lbs/gal) which is stacked on top ofitself, and is known as hydrostatic pressure. Converting the density of fresh water to a pressuregradient results in 8.33 lb/gal being equal to 0.433 psi/ft. Therefore, the pressure of fresh waterin the well bore is 0.433 psi/ft times the vertical well depth.
In reality, the fluid flowing to the surface could be fresh water, re-used hydraulicfracturing water, re-used, produced water, or a mixture. Additionally, in the beginning of theoperation, the initial fluids flowing to the surface are essentially the fracturing fluids put downhole. At the end of the operation, the fluids flowing to the surface will mainly consist ofreservoir fluids, and the water will be more of a brine water and not fresh water. Brine water hasa greater density, and more reservoir pressure will be required to lift the fluid to the surface. Theuse of a fresh water gradient of 0.433 psi/ft should be used to keep the definition conservativeand simple.
As an alternative — or in addition — to a fresh water gradient, the density of brine waterinfluenced by sand or proppant should be used to more accurately reflect the pressure of thewater column in the well bore. In fact, USEPA appears to have utilized a gradient of 0.4645psi/ft in the "Lessons Learned from Natural Gas STAR Partners; Reduced Emissions
3 Luo, Shu, Inception of liquid loading in gas wells and possible solutions, Ph.D. diss., The University of Tulsa,
2013.

Gina McCarthyAugust 18, 2014Page 6
Completions for Hydraulically Fractured Natural Gas Wells" paper developed as a part ofUSEPA's Natural Gas STAR Program.4 This is evidenced by the gradients listed in Exhibit 5 ofthe paper. A copy of this paper is provided as Attachment 1. Additionally, to perform a REC,the downhole reservoir pressure must be sufficient enough to lift the hydraulic fracturing fluid tothe surface and through the separation equipment and piping, with the resulting gas still havingenough back pressure for it to get into the natural gas gathering line. To combust flowbackemissions, the downhole reservoir pressure must be sufficient enough to lift the hydraulicfracturing fluid to the surface and through the separation equipment and piping, with theresulting gas still having enough back pressure to flow to a flare or enclosed combustion device.
To reflect these realities, Independent Producers proposes to the USEPA that no emissioncontrol be required when the following scenario exists:
"A well where the reservoir pressure is less than 0.4645 times the vertical depth of thedeepest target reservoir."
At reservoir pressures below this value, enough pressure does not exist for any gas to flow to aflare, enclosed combustion device or the process. Consequently, the Independent Producerspropose to the USEPA that combustion through a flare or enclosed combustion device berequired when the following scenario exists:
"A well where the reservoir pressure is less than 0.4645 times the vertical depth of thedeepest target reservoir plus the gathering or sales line pressure."
At reservoir pressures less than the sum of the water column pressure and the sales line pressure,the recovered gas will not naturally flow into the sales line. The Proposed Rule does not requirecompression of recovered gas into the sales line. USEPA has recognized this type of simplerapproach in estimating the level of pressure necessary for recovered gas to flow into a gatheringor sales line in their "Lessons Learned from Natural Gas STAR Partners; Reduced EmissionsCompletions for Hydraulically Fractured Natural Gas Wells" paper developed as a part ofUSEPA's Natural Gas STAR Program.5 In this paper, USEPA provides a table (Exhibit 5) withpressures necessary for various well depths. For instance, USEPA indicates that the reservoirpressure necessary to flow recovered gas into a sales line for a 10,000-foot well would be 4,645psig plus the sales line pressure.
The definition of a low pressure well is relevant to the revised stages of flowback andhelps illustrate the problem and concern of those drilling low pressure wells. The IndependentProducers generally support USEPA's proposed definitions for the stages of flowback from a
4 USEPA; Lessons Learned from Natural Gas STAR Partners; Reduced Emissions Completions for HydraulicallyFractured Natural Gas Wells; 2011. http://www.epa.gov/gasstar/documents/reduced_emissions completions.pdf5 Id.

Gina McCarthyAugust 18, 2014Page 7
well. In the USEPA proposal for the second round of reconsideration rulemaking,6 three (3) newterms are proposed:
• Initial flowback stage• Separation flowback stage• Production stage
During the initial flowback stage, USEPA has indicated that there is not enough gas to operate aseparator. Gas generated during the initial flowback stage would not be controlled under theproposal. USEPA acknowledges that during the separation flowback stage there may not beenough gas to operate a separator, with the gas either combusted or recovered depending on thewell type according to the proposal. For certain lower pressure wells (that most likely would notmeet the USEPA proposed definition of a low pressure well), the overall flowback period (allthree stages) is so short that there is an insufficient amount of gas generated during the separationflowback stage to be able to operate or utilize a separator for a meaningful time period.
The Independent Producers proposed definition of a low pressure well that focused on the"three day" flowback period attempted to recognize this point. The dynamics of most verticalwells and energized wells are such that RECs or combustion by way of a separator is notfeasible. The Independent Producers request that USEPA address this issue in their final rule toacknowledge that not every well will have the three flowback stages clearly defined, and incertain instances, the separation flowback stage is so short that RECs are not feasible or required,i.e., that a well can essentially go from the initial flowback state to the production stage. Thereis a subjective element to this evaluation, which USEPA has acknowledged, so the final ruleshould not prevent those drilling low pressure wells from continuing their operations. As notedbefore in various comments, the economic incentive to undertake RECs exists. USEPA'sproposed low pressure well definition forces controls on a segment of the industry that have noor minimal beneficial impact on the environment while imposing significant additional costs thatwill make drilling and operating such wells uneconomical. The Independent Producers requestthat the definition of a low pressure well be revised as suggested above or that USEPAacknowledge the separation flowback stage can be so short in duration that RECs are notnecessary.
In addition to the comments above, the Independent Producers support and incorporateby reference the comments file by the American Exploration and Production Council ("AXPC")7on this proposed rule.
6 Oil and Natural Gas Sector: Reconsideration of Additional Provisions of New Source Performance Standards;Proposed Rule, 79 Fed. Reg. 41752 (July 17, 2014).7 AXPC is a national trade association representing 34 of the largest United States independent natural gas and crudeoil exploration and production companies.

Gina McCarthyAugust 18, 2014Page 8
If the USEPA has any questions or concerns regarding the comments, please do nothesitate to contact me.
Sincerely,
/ 0-
rames D. Elliott
cc: Bruce MooreAmy BranningLee Fuller, IPAA Vice President of Government RelationsCharlie Burd, IOGA-WV Executive DirectorAndrew V. McNeill, KOGA Executive DirectorLou D'Amico, PIOGA Executive DirectorThomas A. Stewart, OOGA Executive Vice PresidentMatt Stone INOGA PresidentBrad Richards, IOGA Executive Vice PresidentGreg Kozera, VOGA President

ATTACHMENT 1

Lessons Learned from Natural Gas STAR Partners
Reduced Emissions Completions for Hydraulically Fractured Natural Gas Wells
Executive Summary
In recent years, the natural gas industry has developed more technologically challenging unconventional gasreserves such as tight sands, shale and coalbed methane. Completion of new wells and re-working (workover) of existing wells in these tight formations typically involve hydraulic fracturing of the reservoir to increase well productivity. Industry reports that hydraulic fracturing is beginning to be performed in some conventional gasreservoirs as well. Removing the water and excess proppant (generally sand) during completion and well clean-up may result in significant releases of natural gas and therefore methane emissions to the atmosphere. The U.S. Inventory of Greenhouse Gas Emissions and Sinks 1990 - 2009 estimates that 68 billion cubic feet (Bcf) of methane are vented or flared annually from unconventional completions and workovers.
Reduced emissions completions (RECs) – also known asreduced flaring completions or green completions – is a term used to describe an alternate practice that captures gas produced during well completions and well workoversfollowing hydraulic fracturing. Portable equipment isbrought on site to separate the gas from the solids and
liquids produced during the high-rate flowback, and produce gas that can be delivered into the sales pipeline.RECs help to reduce methane, VOC, and HAP emissionsduring well cleanup and can eliminate or significantlyreduce the need for flaring.
RECs have become a popular practice among Natural GasSTAR production partners. A total of thirteen different partners have reported performing reduced emissions completions in their operations. RECs have become a major source of methane emission reductions since 2000.Between 2000 and 2009 emissions reductions from RECs (as reported to Natural Gas STAR) have increased from200 MMcf (million cubic feet) to over 218,000 MMcf. Capturing an additional 218,000 MMcf represents additional revenue from natural gas sales of over $1.5billion from 2000 to 2009 (assuming $7/Mcf gas prices).
Technology Background
High demand and higher prices for natural gas in the U.S.have resulted in increased drilling of new wells in moreexpensive and more technologically challengingunconventional gas reservoirs, including those in low porosity (tight) formations. These same high demands and
Method for Reducing
Natural Gas Losses
Volume of Natural Gas
Savings (Mcf)
Value of Natural Gas Savings ($) Additional Savings
($)
Implemen-tation Cost
($)
Other Costs ($)
Payback (Months)
$3 per Mcf $5 per Mcf $7 per Mcf $3 per Mcf
$5 per Mcf
$7 per Mcf
Purchased REC Equipment Annual Program
270,000 per year
$175,000 per year $500,000 $121,250
per year $810,000 per year
$1,350,000 per year
$1,890,000 per year 6 4 3
Incremental REC Contracted Service
10,800 per completion
$32,400 per completion
$54,000 per completion
$75,600 per completion
$6,930 per completion $32,400 $600 per
completion Imme-diate
Imme-diate
Imme-diate
General Assumptions: a Assuming 9 days per completion, 1,200 Mcf gas savings per day per well, 11 barrels of condensate recovered per day per well, and cost of $3,600 per well per day for contracted services. b Assuming $70 per barrel of condensate. c Based on an annual REC program of 25 completions per year.
Economic and Environmental Benefits
1

Reduced Emissions Completions(Cont’d)
prices also justify extra efforts to stimulate production from existing wells in tight reservoirs where the down-hole pressure and gas production rates have declined, a process known as well workovers or well-reworking. In both cases,completions of new wells in tight formations and workovers of existing wells, one technique for improving gas production is to fracture the reservoir rock with very high pressure water containing a proppant (generally sand) that keeps the fractures “propped open” after waterpressure is reduced. Depending on the depth of the well,this process is carried out in several stages, usuallycompleting one 200- to 250-foot zone per stage.
These new and “workover” wells are completed byproducing the fluids at a high rate to lift the excess sand to the surface and clear the well bore and formation to increase gas flow. Typically, the gas/liquid separatorinstalled for normal well flow is not designed for these high liquid flow rates and three-phase (gas, liquid and sand) flow. Therefore, a common practice for this initial well completion step has been to produce the well to a pitor tanks where water, hydrocarbon liquids and sand are captured and slugs of gas vented to the atmosphere or flared. Completions can take anywhere from one day to several weeks during which time a substantial amount of gas may be released to the atmosphere or flared. Testing of production levels occurs during the well completion process, and it may be necessary to repeat the fracture process to achieve desired production levels from a particular well.
Natural gas lost during well completion and testing can beas much as 25 million cubic feet (MMcf) per well depending on well production rates, the number of zones completed,and the amount of time it takes to complete each zone. This gas is generally unprocessed and may contain volatileorganic compounds (VOCs) and hazardous air pollutants (HAPs) along with methane. Flaring gas may eliminate most methane, VOC and HAP emissions, but open flaring is not always a preferred option when the well is located near residential areas or where there is a high risk of grass or forest fires. Moreover, flaring may releaseadditional carbon dioxide and other criteria pollutants (SOx, NOx, PM and CO) to the atmosphere.
Natural Gas STAR partners have reported performingRECs that recover much of the gas that is normally ventedor flared during the completion process. This involves installing portable equipment that is specially designed and sized for the initial high rate of water, sand, and gas flowback during well completion. The objective is to capture and deliver gas to the sales line rather thanventing or flaring this gas.
Sand traps are used to remove the finer solids present inthe production stream. Plug catchers are used to removeany large solids such as drill cuttings that could damagethe other separation equipment. The piping configuration to the sand traps is critical as the abrasion from highvelocity water and sand can erode a hole in steel pipeelbows, creating a “washout” with water, sand,
Exhibit 1: Reduced Emissions Completion Equipment Layout
Adapted from BP.
2

Reduced Emissions Completions(Cont’d)
hydrocarbon liquids and gas in an uncontrolled flow to the pad. Depending on the gas gathering system, it may benecessary to dehydrate (remove water from) the producedgas before it enters the sales pipeline. The gas may be routed to the permanent glycol unit for dehydration or aportable desiccant/glycol dehydrator used for dehydrationduring the completion process.
Free water and condensate are removed from the gas in a three phase separator. Condensate (liquid hydrocarbons)collected during the completion process may be sold foradditional revenue. Temporary piping may be used to connect the well to the REC skid and gathering system ifthe permanent piping is not yet in place. Exhibit 1 shows atypical layout of temporary REC portable equipment, and
Energized FracturingBased on Natural Gas STAR partner experiences, RECscan also be performed in combination with energizedfracturing, wherein inert gas such as CO2 or nitrogen ismixed with the frac water under high pressure to aid inthe process of fracturing the formation. The process isgenerally the same with the additional consideration ofthe composition of the flowback gas. The percent of inertgases in the flowback gas is, at first, unsuitable fordelivery into the sales line. As the fraction of inertsdecreases, the gas can be recovered economically. Aportable membrane acid gas separation unit can further increase the amount of methane recovered for sales after a CO2 energized fracture.
Compression Two compressor applications during an REC have beenidentified or explored by Natural Gas STAR partners.
1) Gas Lift. In low pressure (i.e. low energy) reservoirsRECs are often carried out with the aid of compressors for gas lift. Gas lift is accomplished by withdrawing gas fromthe sales line, boosting its pressure, and routing it downthe well casing to push the frac fluids up the tubing. The increased pressure facilitates flow into the separator andthen the sales line where the lift gas becomes part of the normal flowback that can be recovered during an REC.
2) Boost to Sales Line. When the gas recovered in the REC separator is lower pressure than the sales line, somecompanies are experimenting with a compressor to boostflowback gas into the sales line. This technique isexperimental because of the difficulty operating acompressor on widely fluctuating flowback rate. Coal bedmethane well completion is an example where additionalcompression might be required.
Exhibit 2: Alternate Completion Procedures
Exhibit 2 explains some alternate, emerging, and/or experimental procedures for a well completion and REC.
The equipment used during RECs is only necessary for the time it takes to complete the well; therefore, it is essentialthat all the equipment can be readily transported from site to site to be used in a number of well completions. A truckmounted skid, as shown in Exhibit 3, is ideal for transporting the equipment between sites. In a large basinthat has a high level of drilling activity it may be economicfor a gas producer to build its own REC skid. Most producers may prefer contracting a third party service toperform completions.
When using a third party to perform RECs, it is most cost effective to integrate the scheduling of completions with the annual drilling program. Well completion time is another factor to consider for scheduling a contractor forRECs. Some well completions, such as coal bed methane, may take less than a day. On the other hand, completingwells which fracture various zones, such as shale gaswells, may take several weeks to complete. For most wells, it takes about 3 to 10 days to perform a well completionfollowing a hydraulic fracture, based on partner experiences.
Exhibit 3: Truck Mounted Reduced Emissions Completion Equipment
Source: Weatherford
Economic and Environmental Benefits
Gas recovered for sales
Condensate recovered for sales
Reduced methane emissions
3
Reduced Emissions Completions(Cont’d)
Reduced loss of a valuable hydrocarbon resource
Reduced emissions of criteria and hazardous air pollutants
Emissions from well completions can contribute to a number of environmental problems. Direct venting ofVOCs can contribute to local air pollution, HAPs aredeemed harmful to human health, and methane is a powerful greenhouse gas that contributes to climate change. Where it is safe, flaring is preferred to direct venting because methane, VOCs, and HAPs are combusted, lowering pollution levels and reducing global warming potential (GWP) of the emissions as CO2 from combustion has a lower GWP than methane. RECs allow for recovery of gas rather than venting or flaring andtherefore reduce the environmental impact of well completion and workover activities.
RECs bring economic benefits as well as environmentalbenefits. The incremental costs associated with the rental of third party equipment for performing RECs can be offset by the additional revenue from the sale of gas and condensate. As this technology is being perfected andequipment becomes commonplace, the revenues in gas and condensate sales often exceed the incremental costs.
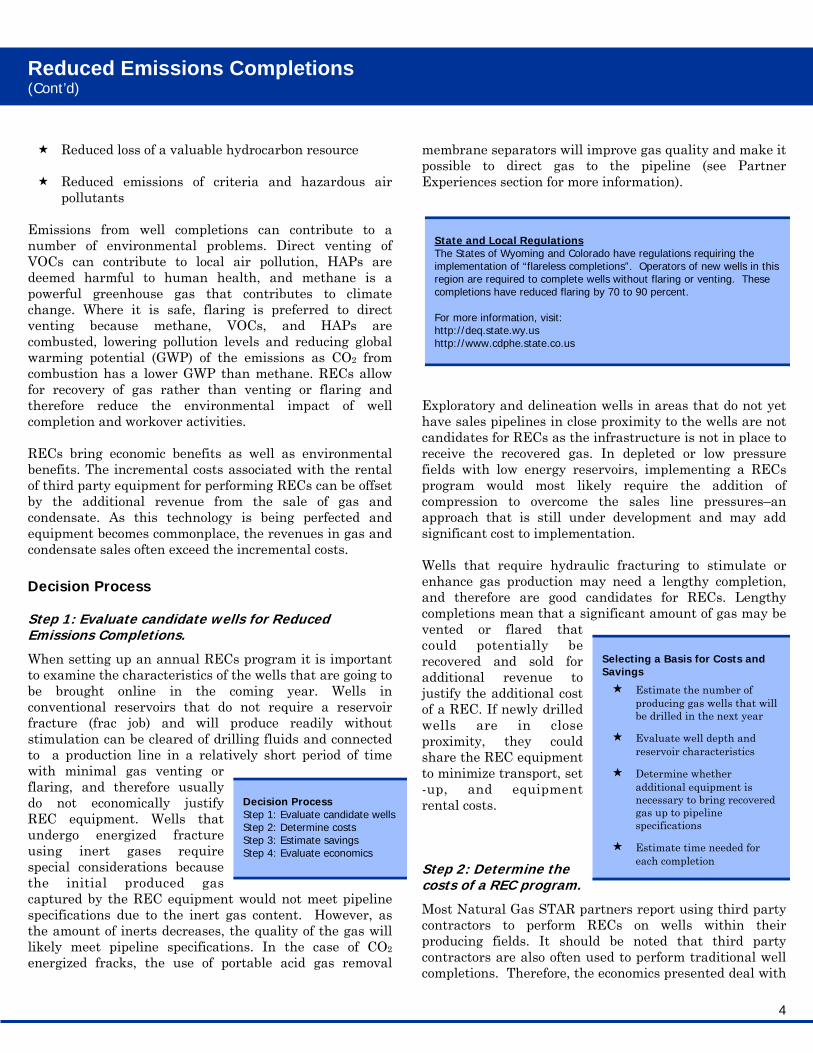
Decision Process
Step 1: Evaluate candidate wells for Reduced Emissions Completions.
When setting up an annual RECs program it is important to examine the characteristics of the wells that are going tobe brought online in the coming year. Wells in conventional reservoirs that do not require a reservoir fracture (frac job) and will produce readily without stimulation can be cleared of drilling fluids and connected to a production line in a relatively short period of timewith minimal gas venting or flaring, and therefore usually do not economically justify Decision Process
Step 1: Evaluate candidate wells REC equipment. Wells that Step 2: Determine costs
undergo energized fracture Step 3: Estimate savings using inert gases require Step 4: Evaluate economics special considerations because the initial produced gascaptured by the REC equipment would not meet pipeline specifications due to the inert gas content. However, as the amount of inerts decreases, the quality of the gas willlikely meet pipeline specifications. In the case of CO2
energized fracks, the use of portable acid gas removal
membrane separators will improve gas quality and make itpossible to direct gas to the pipeline (see Partner Experiences section for more information).
State and Local Regulations The States of Wyoming and Colorado have regulations requiring the implementation of “flareless completions”. Operators of new wells in this region are required to complete wells without flaring or venting. These completions have reduced flaring by 70 to 90 percent.
For more information, visit: http://deq.state.wy.us http://www.cdphe.state.co.us
Exploratory and delineation wells in areas that do not yethave sales pipelines in close proximity to the wells are not candidates for RECs as the infrastructure is not in place to receive the recovered gas. In depleted or low pressurefields with low energy reservoirs, implementing a RECs program would most likely require the addition of compression to overcome the sales line pressures–an approach that is still under development and may addsignificant cost to implementation.
Wells that require hydraulic fracturing to stimulate or enhance gas production may need a lengthy completion,and therefore are good candidates for RECs. Lengthycompletions mean that a significant amount of gas may bevented or flared that could potentially be
Selecting a Basis for Costs and recovered and sold for Savings additional revenue to Estimate the number ofjustify the additional cost
producing gas wells that will of a REC. If newly drilled be drilled in the next year wells are in close proximity, they could Evaluate well depth and
reservoir characteristics share the REC equipmentto minimize transport, set Determine whether
-up, and equipment additional equipment is necessary to bring recovered rental costs. gas up to pipelinespecifications
Estimate time needed for each completion
Step 2: Determine the costs of a REC program.
Most Natural Gas STAR partners report using third party contractors to perform RECs on wells within their producing fields. It should be noted that third party contractors are also often used to perform traditional wellcompletions. Therefore, the economics presented deal with
4
Reduced Emissions Completions(Cont’d)
incremental costs to carry out RECs versus traditionalcompletions.
Generally, the third party contractor will charge acommissioning fee for transporting and setting up the equipment for each well completion within the operator’s producing field. Some RECs vendors have their equipment mounted on a single trailer while others lay downindividual skids that must be connected with temporary piping at each site. The incremental cost associated withtransportation between well sites in the operator’s field and connection of the REC equipment within the normalflowback piping from the wellhead to an impoundment or tank is generally around $600/completion.
In addition to the commissioning fee, there is a daily costfor equipment rental and labor to perform each REC. Asmentioned above, when evaluating the costs of well completions, it is important to consider the incrementalcost of a REC over a traditional completion rather thanfocusing on the total cost. REC vendors and Natural GasSTAR partners have reported the incremental cost of equipment rental and labor to recover natural gas during completion ranging from $700 to $6,500/day over atraditional completion. Equipment costs associated with RECs will vary from well to well. High production rates may require larger equipment to perform the REC and willincrease costs. If permanent equipment such as a glycol dehydrator is already installed at the well site, REC costs may be reduced as this equipment can be used rather thanbringing a portable dehydrator on-site, assuming the flow-back rate does not exceed the capacity of the equipment.Some operators report installing permanent equipmentthat can be used in the RECs as part of normal well completion operations, such as oversized three-phase
separators, further reducing incremental REC costs. Wellcompletions usually take between 1 to 30 days to clean outthe well bore, complete well testing, and tie into the permanent sales line. Wells requiring multiple fractures ofa tight formation to stimulate gas flow may require additional completion time. Exhibit 4 shows the typicalcosts associated with undertaking a REC at a single well.
Exhibit 4: Typical Costs for RECs
One-time Transportation and Incremental Set-up
Costs
Incremental REC Equipment Rental and
Labor Costs
Well Clean-up Time
$600 per well $700 to $6,500 per day 3 to 10 days
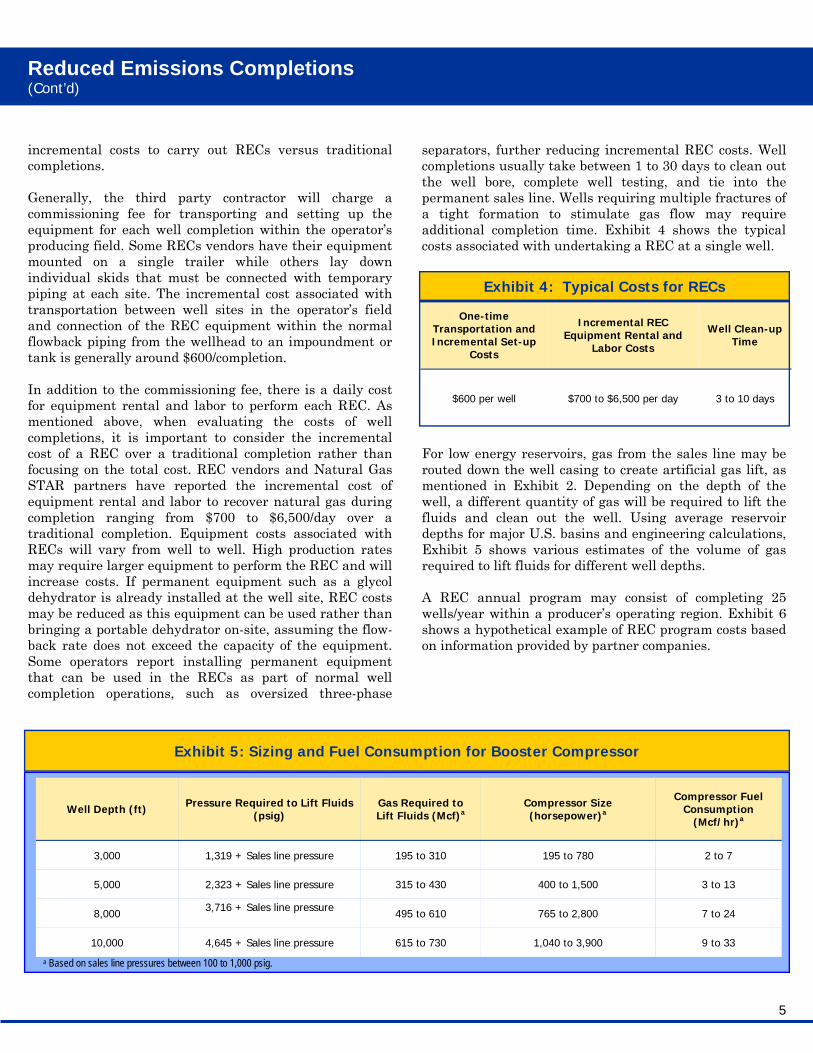
For low energy reservoirs, gas from the sales line may be routed down the well casing to create artificial gas lift, asmentioned in Exhibit 2. Depending on the depth of the well, a different quantity of gas will be required to lift thefluids and clean out the well. Using average reservoirdepths for major U.S. basins and engineering calculations, Exhibit 5 shows various estimates of the volume of gas required to lift fluids for different well depths.
A REC annual program may consist of completing 25wells/year within a producer’s operating region. Exhibit 6 shows a hypothetical example of REC program costs based on information provided by partner companies.
Exhibit 5: Sizing and Fuel Consumption for Booster Compressor
Well Depth (ft) Pressure Required to Lift Fluids (psig)
Gas Required to Lift Fluids (Mcf)a
Compressor Size (horsepower)a
3,000 1,319 + Sales line pressure 195 to 310 195 to 780
5,000 2,323 + Sales line pressure 315 to 430 400 to 1,500
8,000 3,716 + Sales line pressure 495 to 610 765 to 2,800
10,000 4,645 + Sales line pressure 615 to 730 1,040 to 3,900
a Based on sales line pressures between 100 to 1,000 psig.
Compressor Fuel Consumption
(Mcf/hr)a
2 to 7
3 to 13
7 to 24
9 to 33
5

Reduced Emissions Completions(Cont’d)
Exhibit 6: Hypothetical Example Cost Calculation of a 25 Well Annual REC Program
Given W = Number of completions per year D = Well depth in feet (ft) Ps = Sales line pressure in pounds per square inch gauge (psig) Ts = Time required for transportation and set-up (days/well) Tc = Time required for well clean-up (days/well) O = Operating time for compressor to lift fluids (hr/well) F = Compressor fuel consumption rate (Mcf/hr) G = Gas from pipeline routed to casing to lift fluids (Mcf/well), typically used on low energy reservoirs Cs = Transportation and set-up cost ($/well) Ce = Equipment and labor cost ($/day) Pg = Sales line gas price ($/Mcf)
W = 25 wells/yr D = 8000 ft Ps = 100 psig Ts = 1 day/well Tc = 9 days/well O = 24 hr/well F = 10 Mcf/hr G = 500 Mcf/well (See Exhibit 5) Cs = $600/well Ce = $2,000/day Pg = $7/Mcf
Calculate Total Transportation and Set-up Cost, CTS
CTS = W * Cs
CTS = 25 wells/yr * $600/well CTS = $15,000/yr
Calculate Total Equipment Rental and Labor Cost, CEL
CEL = W * (Ts + Tc) * Ce
CEL = 25 wells/yr * (1 day/well + 9 days/well) * $2,000/day CEL = $500,000/yr
Calculate Other Costs, CO
CO = W * [(O * F) + G] * Pg
CO = 25 wells/yr * [( 24 hr/well * 10 Mcf/hr) + 500 Mcf/well] * $7/Mcf CO = $129,500/yr
Total Annual REC Program Cost, CT
CT = CTS + CEL + CO
CT = $15,000/yr + $500,000/yr + $129,500/yr CT = $644,500/yr
6

Reduced Emissions Completions(Cont’d)
Step 3: Estimate Savings from RECs.
Gas recovered from RECs can vary widely because theamount of gas recovered depends on a number of variablessuch as reservoir pressure, production rate, amount offluids lifted, and total completion time. Exhibit 7 shows the range of recovered gas and condensate reported byNatural Gas STAR partners. Partners also have reported that not all the gas that is produced during well completions may be captured for sales. Fluids from high pressure wells are often routed directly to the frac tank in the initial stages of completion as the fluids are often beingproduced at a rate that is too high for the REC equipment. Where inert gas is used to energize the frac, the initial gasproduction may have to be flared until the gas meetspipeline specifications. Alternatively, a portable acid gasmembrane separator may be used to recover methane richgas from CO2. As the flow rate of fluids drops and gas is encountered, backflow is then switched over to the REC equipment so that the gas may be captured. Gas compressed from the sales line to lift fluids (by artificial gas lift) will also be recovered in addition to the gas produced from the reservoir. The volume of gas needed tolift fluids can be estimated based on the well depth andsales line pressure. Gas saved during RECs can be translated directly into methane emissions reductions based on the methane content of the produced gas.
In addition to gas savings, valuable condensate may alsobe recovered from the REC three-phase separator. The amount of condensate that can be recovered during a RECis dependent on the reservoir conditions and fluid
Nelson Price Indexes In order to account for inflation in equipment and operating & maintenance costs, Nelson-Farrar Quarterly Cost Indexes (available in the first issue of each quarter in the Oil and Gas Journal) are used to update costs in the Lessons Learned documents.
The “Refinery Operation Index” is used to reviseoperating costs while the “Machinery: Oilfield Itemized Refining Cost Index” is used to update equipment costs.
To use these indexes in the future, simply look up the most current Nelson-Farrar index number, divide by the February 2006 Nelson-Farrar index number, and, finally multiply by the appropriate costs in the Lessons Learned.
Exhibit 7: Ranges of Gas and Condensate Savings
Produced Gas Savings
(Mcf/day/well)
Gas-Lift Savings (Mcf/well)
Condensate Savings
(bbl/day/well)
500 to 2,000 See Exhibit 5 Zero to several hundred
compositions. Condensate may also be lost if fluids are produced directly to the frac tank before switching to the REC equipment.
Exhibit 8 shows typical values of gas and condensate savings during the REC process.
Step 4: Evaluate REC economics.
The example application of an REC program to 25 wellswithin a producing field can yield a total theoreticalrevenue of $2,152,500 based on the assumptions listed above from the sale of natural gas and condensate.Equipment rental, labor, and other costs associated with implementing this program are estimated to be $644,500 (see Exhibit 6) resulting in an annual theoretical profit of $1,508,000. To maintain a profitable REC program, it isimportant to move efficiently from well to well within a producing field so that there is little down time when paying for equipment rental and labor. Other factors thataffect the profitability of an REC program include the amount of condensate recovery and sales price, the needfor additional compressors, the amount of gas recovered,and gas sales price.
Exhibit 9 shows a five year cash flow projection for carrying out a 25 well per year REC program. In thisexample, the equipment necessary to perform RECs has been purchased by the operator rather than using a third party contractor to perform the service. The capital cost of a simple REC set-up without a portable compressor has been reported by British Petroleum (BP) to be $500,000.
Producers with high levels of localized drilling andworkover activity may benefit from constructing and operating their own REC equipment. As illustrated above,even though large capital outlay is required to construct aREC skid, a high rate of return can be achieved if the equipment is in continuous use. If the operator is unable tokeep the equipment busy on their own wells, they may
7

Reduced Emissions Completions(Cont’d)
Given W = Number of completions per year D = Well depth in feet (ft) Ps = Sales line pressure in pounds per square inch gage (psig) Sp = Produced gas savings (Mcf/day) Tc = Time recovered gas flows to sales line in days (days/well) Sc = Condensate savings (bbl/well) G = Gas used to lift fluids (Mcf/well), typically used on low energy reservoirs Pg = Sales line gas price ($/Mcf) Pl = Natural gas liquids price ($/bbl)
W = 25 wells/yr D = 8000 ft Ps = 100 psig Sp = 1,200 Mcf/day Tc = 9 days/well Sc = 100 bbl/well G = 500 Mcf/well (See Exhibit 5) Pg = $7/Mcf Pl = $70/bbl
Calculate Produced Gas Savings
SPG = W * (Sp * Tc) * Pg
SPG = 25 wells/yr * (1,200 Mcf/day * 9 days/well) * $7/Mcf SPG = $1,890,000/yr
Calculate Other Savings
SO = W * [(G * Pg) + (Sc * Pl)]
SO = 25 wells/yr * [(500 Mcf/well * $7/Mcf) + (100 bbl/well * $70/bbl)] SO = $262,500/yr
Total Savings, ST
ST = SPG + SO
ST = $1,890,000/yr + $262,500/yr ST = $2,152,500/yr
Exhibit 8: Savings of a 25 Well Annual REC Program
8

Reduced Emissions Completions(Cont’d)
contract it out to other operators to maximize usage of the important to examine the economics of undertaking a REC equipment. program as natural gas prices change. Exhibit 10 shows an
economic analysis of performing the 25 well per year RECWhen assessing REC economics, the gas price may program in Exhibit 8 at different gas prices. influence the decision making process; therefore, it is
Exhibit 9: Economics for Hypothetical 25 Well Annual REC Program with Purchased Equipment
Year 0 Year 1 Year 2 Year 3 Year 4 Year 5
Volume of Natural Gas Savings (Mcf/yr)a 270,000 270,000 270,000 270,000 270,000
Value of Natural Gas Savings ($/year)a 1,890,000 1,890,000 1,890,000 1,890,000 1,890,000
Additional Savings ($/yr)a 175,000 175,000 175,000 175,000 175,000
Set-up Costs ($/yr)b (15,000) (15,000) (15,000) (15,000) (15,000)
Equipment Costs ($)b (500,000)
Net Annual Cash Flow ($) (500,000) 1,943,750 1,943,750 1,943,750 1,943,750 1,943,750
Internal Rate of Return = 389% NPV (Net Present Value)d= $6,243,947
Payback Period = 3 months a See Exhibit 8. b See Exhibit 6. c Labor costs for purchased REC equipment estimated as 50% of Equipment Rental and Labor costs in Exhibit 3. d Net present value based on 10% discount rate over five years.
Labor Costs ($/yr)c (106,250) (106,250) (106,250) (106,250) (106,250)
Exhibit 10: Gas Price Impact on Economic Analysis of Hypothetical 25 Well Annual REC Program with Purchased Equipment
$3/Mcf $5/Mcf $7/Mcf $8/Mcf $10/Mcf
Total Savings $985,000 $1,525,000 $2,065,000 $2,335,000 $2,875,000
Payback (months) 7 5 4 3 3
IRR 172% 280% 389% 443% 551%
NPV (i = 10%) $2,522,084 $4,383,015 $6,243,947 $7,174,413 $9,035,345
Gas Price
9

Reduced Emissions Completions(Cont’d)
Partner Experience
This section highlights specific experiences reported by Natural Gas STAR partners.
BP Experience in Green River Basin Implemented RECs in the Green River Basin of Wyoming
RECs performed on 106 wells, which consisted of high and low pressure wells
Average 3,300 Mcf of natural gas sold versus vented per well
– Well pressure will vary from reservoir to reservoir
– Reductions will vary for each particular region
– Conservative net value of gas saved is $20,000 per well
Natural gas emission reductions of 350,000 Mcf in 2002
Total of 6,700 barrels of condensate recovered per year total for 106 wells
Through the end of 2005, this partner reports a total of 4.17 Bcf of gas and more than 53,000 barrels of condensaterecovered and sold rather than flared. This is a combination of activities in the Wamsutter and Jonah/Pinedale fields.
Noble Experience in Ellis County, Oklahoma Implemented RECs on 10 wells using energized fracturing.
Employed membrane separation in which the permeate was a CO2 rich stream that was vented and the residue was primarily hydrocarbons which were recovered.
Total cost of $325,000.
Total gas savings of approximately 175 MMcf.
Estimated net profits to be $340,000
For more information, see the Partner Profile Article in the Spring 2011 Natural Gas STAR Partner Update available at: http://epa.gov/gasstar/newsroom/partnerupdatespring2011.html
Partner Company A Implemented RECs in the Fort Worth Basin of Texas
RECs performed on 30 wells, with an incremental cost of $8,700 per well
Average 11,900 Mcf of natural gas sold versus vented per well
– Natural gas flow and sales occur 9 days out of 2 to 3 weeks of well completion
– Low pressure gas sent to gas plant
– Conservative net value of gas saved is $50,000 per well
Expects total emission reduction of 1.5 to 2 Bcf in 2005 for 30 wells
10

Reduced Emissions Completions(Cont’d)
Lessons Learned
Incremental costs of recovering natural gas and condensate during well completions following hydraulic fracturing result from the use of additionalequipment such as sand traps, separators, portable compressors, membrane acid gas removal units anddesiccant dehydrators that are designed for high rate flowback.
During the hydraulic fracture completion process,sands, liquids, and gases produced from the well areseparated and collected individually. Natural gas and gas liquids captured during the completion may be sold for additional revenue.
Implementing a REC program will reduce flaringwhich may be a particular advantage where open flaring is undesirable (populated areas) or unsafe (risk of fire).
Wells that do not require hydraulic fracturing are notgood candidates for reduced emissions completions. Methane emissions reductions achieved through performing RECs may be reported to the Natural GasSTAR Program unless RECs are required by law (as in the Jonah-Pinedale area in WY).
References
Alberts, Jerry. Williams Company. Personal contact.
American Petroleum Institute. Basic Petroleum Data Book, Volume XXV, Number 1. February 2005.
Bylin, Carey. U.S. EPA. Gas STAR Program Manager
Department of Energy. GASIS, Gas Information System. Release 2 – June 1999.
Fernandez, Roger. U.S. EPA. Gas STAR Program Manager
McAllister, E.W., Pipeline Rules of Thumb Handbook, 4th Edition, 1998.
Middleman, Stanley. An Introduction to Fluid Dynamics, Principles of Analysis and Design. 1998.
Perry, Robert H., Don W. Green. Perry’s Chemical Engineers Handbook, 7th Edition. 1997.
Pontiff, Mike. Newfield Exploration Company. Personal contact.
Process Associates of America. “Reciprocating Compressor Sizing.” Available on the web at: http://www.processassociates.com/process/ rotating/recip_s.htm.
Smith, Reid. BP PLC. Personal contact.
Smuin, Bobby. BRECO, Incorporated. Personal contact.
U.S. EPA. “The Natural Gas STAR Partner Update – Spring 2004.” Available on the web at: http://www.epa.gov/gasstar/pdf/ partnerupdate.pdf
Wadas, Janelle. Noble Energy Inc. 2010 Annual Implementation Workshop Presentation titled “Reducing Vented Flowback Emissions from CO2 Fractured Gas Wells Using Membrane Technology”. Available on the web at: http://epa.gov/gasstar/documents/workshops/2010-annual-conf/01wadas.pdf
Waltzer, Suzanne. U.S. EPA. Gas STAR Program Manager
11

Reduced Emissions Completions(Cont’d)
United States Environmental Protection Agency Air and Radiation (6202J) 1200 Pennsylvania Ave., NW Washington, DC 20460
2011
EPA provides the suggested methane emissions estimating methods contained in this document as a tool to develop basic methane emissions estimates only. As regulatory reporting demands a higher-level of accuracy, the methane emission estimating methods and terminology contained in this document may not conform to the Greenhouse Gas Reporting Rule, 40 CFR Part 98, Subpart W methods or those in other EPA regulations.
12