spectrum v3.0 : power bi functionalities guide
TRANSCRIPT

Spectrum v3.0 : Power BI Functionalities Guide

Power BI Desktop (Power BI) is a dynamic application developed by Microsoft. Power BI puts
visual analytics at the auditor's fingertips, enabling you to visualize and analyze data. The tool
allows auditors to quickly discover patterns and financial trends through a single unified view of
linked and interactive visualizations.
Spectrum is a tool developed on the Power BI platform by the DME Audit Analytics team, which
contains pre-configured analytics based on general ledger data and trial balance.
©2018 Deloitte & Touche (M.E.). All rights reserved.
What is Power BI?
Spectrum: Power BI Functionalities Guide
C. Drill down functionality
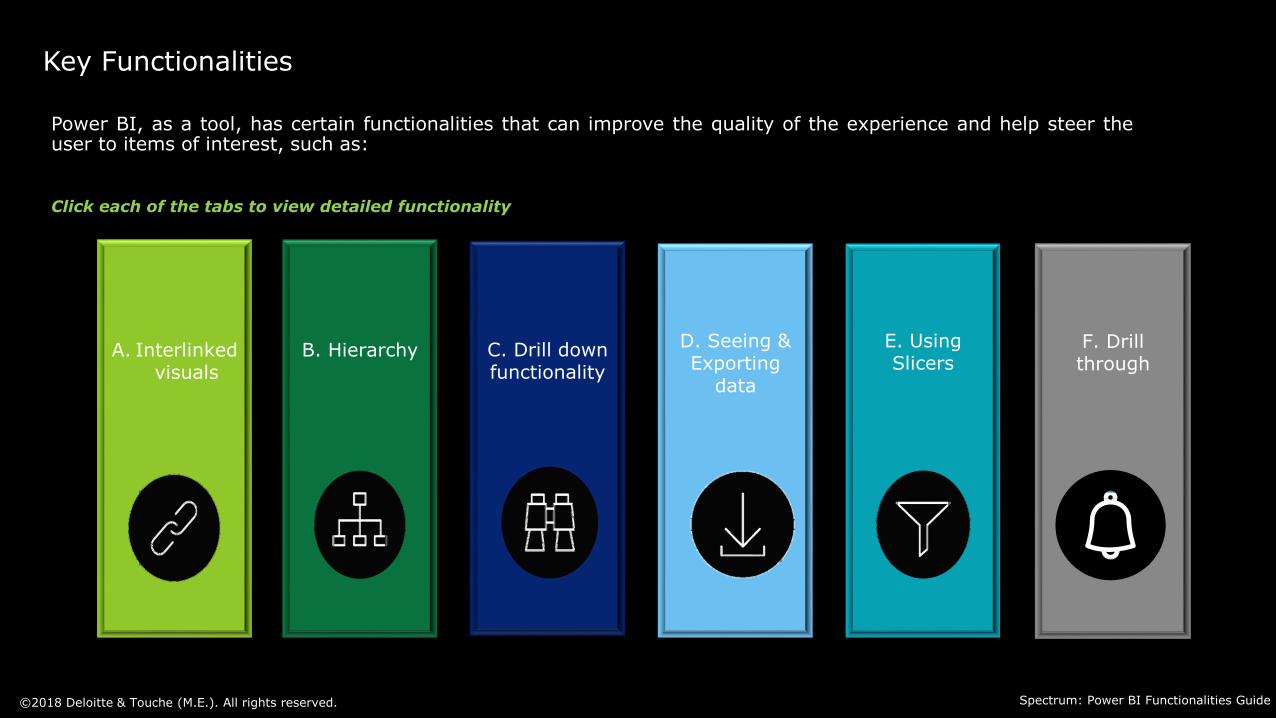
Power BI, as a tool, has certain functionalities that can improve the quality of the experience and help steer theuser to items of interest, such as:
Click each of the tabs to view detailed functionality
A. Interlinked visuals
B. HierarchyD. Seeing & Exporting
data
E. Using Slicers
©2018 Deloitte & Touche (M.E.). All rights reserved.
Key Functionalities
Spectrum: Power BI Functionalities Guide
F. Drillthrough
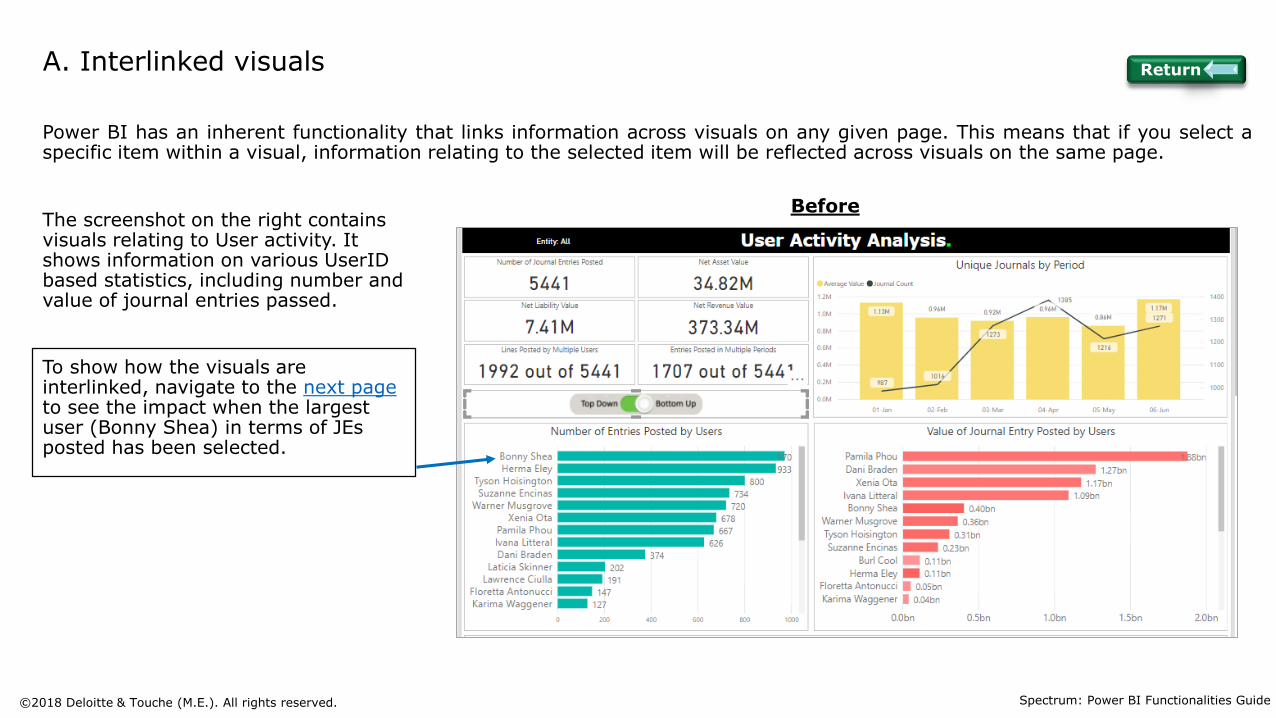
The screenshot on the right contains visuals relating to User activity. It shows information on various UserIDbased statistics, including number and value of journal entries passed.
To show how the visuals are interlinked, navigate to the next page to see the impact when the largest user (Bonny Shea) in terms of JEs posted has been selected.
Power BI has an inherent functionality that links information across visuals on any given page. This means that if you select aspecific item within a visual, information relating to the selected item will be reflected across visuals on the same page.
Before
A. Interlinked visuals
©2018 Deloitte & Touche (M.E.). All rights reserved. Spectrum: Power BI Functionalities Guide
Return

AfterUpon clicking on ‘Bonny Shea’ from the ‘Number of Entries Posted by Users’ graph, the remaining visuals on the page adjusts to reflect the selection made. For the given example, this enables the viewer to see that
a) Bonny Shea passed 195 unique journal entries in the month of January
b) The journal entries posted by Bonny Shea throughout the year amounted to 0.4 Billion.
To return back to the previous view, click once on the same user again or click once in the blank space on the tab.
A. Interlinked visuals (cont’d)
©2018 Deloitte & Touche (M.E.). All rights reserved. Spectrum: Power BI Functionalities Guide
Return

Another useful function within PowerBI is hierarchy which allows the user to switch visuals between pre-defined orders. For instance, time-based hierarchy will allow the user to view visuals on a Yearly, Quarterly, Monthly or a Daily basis, depending on the user’s preferences.
The example on the right shows how the Monthlyhierarchy can be changed to the Daily hierarchy.
To change hierarchy, the user can move:
B. Hierarchy
Click on “ “ to access next level of hierarchy
To access a hierarchy level above the current level, click on ” “ to drill up (explained in the net slide)
Spectrum: Power BI Functionalities Guide©2018 Deloitte & Touche (M.E.). All rights reserved.
Return

Users can drill down in certain visuals and target specific items that they are interested in. Drilling down can also workacross hierarchies (from year to quarter to month to day) however, this option is different from hierarchy, as it allows theuser to target a specific quarter, month or day.
Users can access this function by clicking the icon on the top right corner of the visual to activate drill down and todrill up.
C. Drill down Functionality
This image on the right shows a summary of thetotal debits and credits during the year to SellingExpenses at an Note Line level. As can be seen,0.58 Million were recorded for Selling Expenses inQuarter 2.
To drill down further, the user can click on theindicated icon, after which it will darken assuch which means drill down is switched ‘on’.
Now, on clicking Quarter 2 for Selling Expenses, theimage on the following page will be visible.
Spectrum: Power BI Functionalities Guide©2018 Deloitte & Touche (M.E.). All rights reserved.
Return

C. Drill down functionality (Cont’d)
Spectrum: Power BI Functionalities Guide©2018 Deloitte & Touche (M.E.). All rights reserved.
By drilling down, the visual now reports SellingExpenses on a monthly basis for Quarter 2. Theuser can now identify that 325K was recorded inSelling Expenses for the month of April and 5unique journal entries contributed to thisamount.
To switch off the drill down function, click once onthe “ “ icon, after which it will appear un-highlighted.
To return back to the previous view, click the“ “ icon on the top right corner of the visual.
Return

PowerBI has been developed as a visualization tool, but at the same time, it gives users the facility to see and exportunderlying data behind visuals into CSV format. The dropdown option for this is located on the right corner of the visual.
See Data
On clicking “See Data”, users can view relevant extracts from the GL dataused in design of the visual, in a tabular form
Export Data
Clicking “Export data” allows the user to export the tabular data visible onclicking “See Data” into an Excel file stored on the user’s laptop. Format forexport is .CSV, which can be accessed through MS Excel.
See Records
Selecting ‘See Records’ in the ‘Visual tools’ pane (displayed for certain visuals)will allow users to see underlying records used. These can be furtherexported, but will be subject to size limitations.
Note: The drill-through functionality should be used to view underlying journal entries inSpectrum v3.0
D. Seeing & Exporting data
Note: PowerBI does not have a functionality to allow users to export visuals in entirety onto Excel WP’s. For this purpose, the current recommended practice is to take screenshots or ‘snip’ the visuals from PowerBI onto your work papers. PowerBI also allows you to export all tabs as a PDF using the option File>Print to PDF.
Spectrum: Power BI Functionalities Guide©2018 Deloitte & Touche (M.E.). All rights reserved.
Return

Slicers are an efficient way of sorting through data, allowing users to exercise creativity and tailor the visual topresent information to their requirements. In the below image, Revenue and Cost of Sales have been selected onthe “FS Line” slicer, allowing the user to obtain a high-level view of the application of the revenue and cost flowsover the year.
Multiple line items can be selected from the slicer, with new lines created on the visual for each selection.
To clear selections from slicer, the user can click the “ “button on the top right corner of the slicer.
E. Using slicers
Spectrum: Power BI Functionalities Guide©2018 Deloitte & Touche (M.E.). All rights reserved.
Return
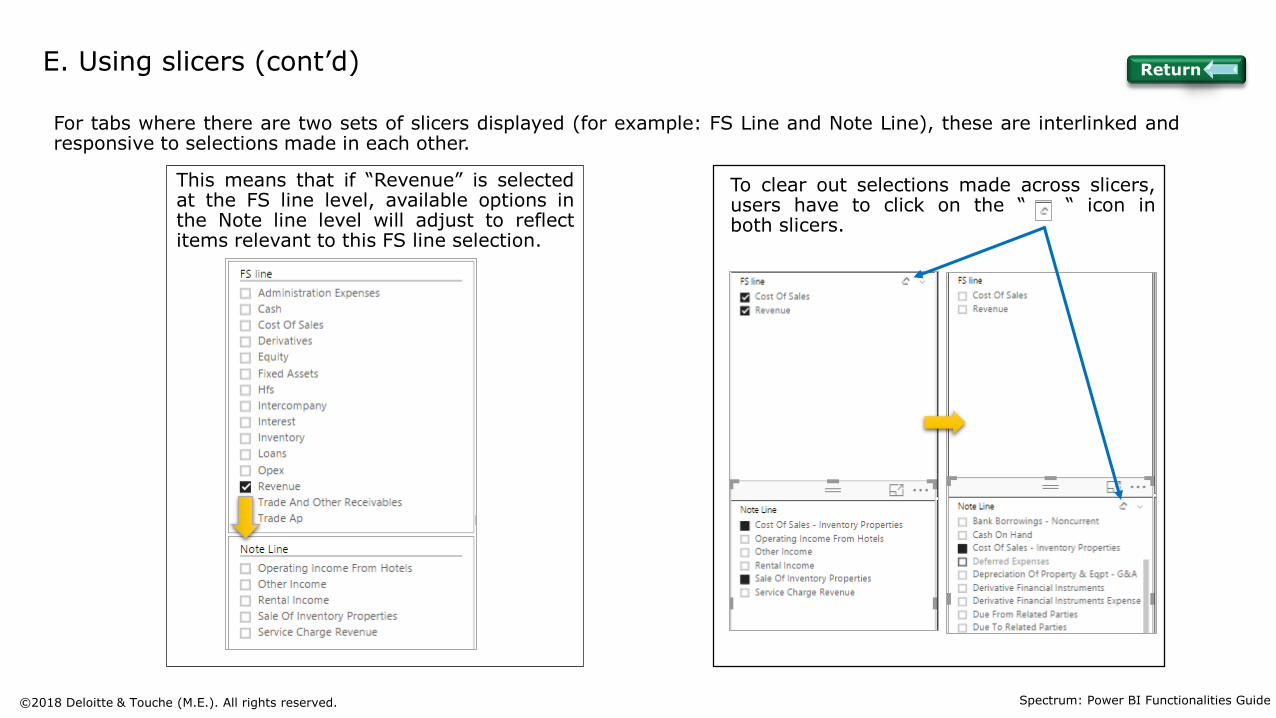
For tabs where there are two sets of slicers displayed (for example: FS Line and Note Line), these are interlinked andresponsive to selections made in each other.
This means that if “Revenue” is selectedat the FS line level, available options inthe Note line level will adjust to reflectitems relevant to this FS line selection.
To clear out selections made across slicers,users have to click on the “ “ icon inboth slicers.
E. Using slicers (cont’d)
Spectrum: Power BI Functionalities Guide©2018 Deloitte & Touche (M.E.). All rights reserved.
Return

F. Drillthrough
This function helps users view underlying data that is represented by a visual or a summary table. Tabs 8 and 9 are used as drillthrough tabs on Spectrum. Tab 8-Drillthrough helps users view primary journal lines (not whole entries) from Tabs 2,4,5 and 7 and Tab 9- JE Viewer helps users navigate through, view and export whole journal entries from tabs 7 and 8.
To drill through, right-click on a data point on the visual and left-click on Drillthrough> 8-Drillthrough or Drillthrough> 9-JE Viewer,depending on the visual the user is trying to drill through.
The drill through functionality will direct the user to the respective tab linked within Spectrum, where the user will be able to view the journal entries that is represented by the visual.
©2018 Deloitte & Touche (M.E.). All rights reserved.
Return

F. Drill through (Cont’d)
Per the illustration on the right, a drill through for the user ID Helaine Jeasonneon 5- User Activity Analysis tab directs the user to the 8- Drillthrough tab which then provides the journal entries/lines posted by that user.
In this example, the Drillthrough tab enables the user to view the journal lines posted by Helaine.
The drillthrough tab also shows the unique count of journals posted by Helaine and provides details of the impacted note lines. A day-wise view of the note line impact of the journal lines that are listed in the table can also be viewed on this tab.
©2018 Deloitte & Touche (M.E.). All rights reserved.
Return

Important Points to remember
PowerBI, being a visualization tool, has a limit on the number of rows that can be exported in CSV format (Excel), set at 30,000 rows. Data beyond 30,000 rows will not appear on export
Since Power BI is based on GL and TB data, balances and figures displayed is visuals will represent “signed” values, not absolute values. This means that revenue, income and liability figures will appear as negative balances in the tool.
Visuals in PowerBI are interlinked to each other within the same page. Filters and selections made in one tab will not spill over to the other tabs.
Spectrum: Power BI Functionalities Guide
Spectrum currently supports GL data of 1 million rows in Excel or 90 million rows of text delimited data.
©2018 Deloitte & Touche (M.E.). All rights reserved.

For basic users, it is advisable to refrain from navigating away from the “Reportview”. Changes made within the “Table” or “Relationship” view can impact theoutcome of pre-configured visuals. Table View
Relationship View
Keep the “Visualizations” and “Fields” tab minimized, as it wouldhelp ensure minimal disruption to the tool and promote a smootheruser experience.
Document using screenshots of visuals used includingthe filters/drill down options used to enable anyreviewer to understand the background and contextof the visual. While using the visual screenshots inEMS, a write up explaining the visual is also to beincluded.
Do’s & Don’t’s
Spectrum: Power BI Functionalities Guide©2018 Deloitte & Touche (M.E.). All rights reserved.

This publication has been written in general terms and therefore cannot be relied on to cover specific situations;application of the principles set out will depend upon the particular circumstances involved and we recommendthat you obtain professional advice before acting or refraining from acting on any of the contents of thispublication. Deloitte & Touche (M.E.) would be pleased to advise readers on how to apply the principles set out inthis publication to their specific circumstances. Deloitte & Touche (M.E.) accepts no duty of care or liability forany loss occasioned to any person acting or refraining from action as a result of any material in this publication.
Deloitte refers to one or more of Deloitte Touche Tohmatsu Limited, a UK private company limited by guarantee(“DTTL”), its network of member firms, and their related entities. DTTL and each of its member firms are legallyseparate and independent entities. DTTL (also referred to as “Deloitte Global”) does not provide services toclients. Please see www.deloitte.com/about for a more detailed description of DTTL and its member firms.
Deloitte provides audit, consulting, financial advisory, risk management, tax and related services to public andprivate clients spanning multiple industries. Deloitte serves four out of five Fortune Global 500® companiesthrough a globally connected network of member firms in more than 150 countries bringing world-classcapabilities, insights, and high-quality service to address clients’ most complex business challenges. To learnmore about how Deloitte’s approximately 245,000 professionals make an impact that matters, please connectwith us on Facebook, LinkedIn, or Twitter.
Deloitte & Touche (M.E.) is a member firm of Deloitte Touche Tohmatsu Limited (DTTL) and is a leadingprofessional services firm established in the Middle East region with uninterrupted presence since 1926.
Deloitte provides audit, tax, consulting, and financial advisory services through 26 offices in 15 countries withmore than 3,300 partners, directors and staff. It is a Tier 1 Tax advisor in the GCC region since 2010 (accordingto the International Tax Review World Tax Rankings). It has also received numerous awards in the last few yearswhich include best employer in the Middle East, best consulting firm, the Middle East Training & DevelopmentExcellence Award by the Institute of Chartered Accountants in England and Wales (ICAEW), as well as the bestCSR integrated organization.
©2018 Deloitte & Touche (M.E.). All rights reserved.