speciation and reactivity of chromium(iii) oligomers in
TRANSCRIPT

SPECIATION AND REACTIVITY OF CHROMIUM(III) OLIGOMERS IN
ALKALINE SYSTEMS.
BY
JUDAH ISAAC FRIESE
A dissertation submitted in partial fulfillment of the requirements for the degree of
DOCTOR OF PHILOSPHY
WASHINGTON STATE UNIVERSITY Department of Chemistry
MAY 2002

To the faculty of Washington State University: The members of the Committee appointed to examine the dissertation of
JUDAH ISAAC FRIESE find it satisfactory and recommend that it be accepted.
_________________________________ Chair
_________________________________
_________________________________
_________________________________
ii

ACKNOWLEDGEMENTS There are many people who I wish to thank for the support,
encouragement, guidance, and friendship during my graduate tenure. Dr. Sue B
Clark for her advice, guidance and patience with working with me. She gave me
the chance to travel nationally and internationally to present my graduate work
and to continue my education. I have enjoyed working in her lab, and will
remember by graduate years with fondness.
I would like to thank Ms. Susan Bentjen for her enthusiastic attitude and
helpfulness. If something did not work, if something could not be found, or if
Microsoft Word was not formatting correctly, she is the go to person. She is the
one who gets things done, and made graduate studies a lot easier.
I would also like to thank the past and present members of the Clark group
from whom I have received support: Minfang Yeh, Steve LaMont, Andrew
Maddison, Stacey Loyland-Asbury, Matt Douglas, Hiromu Kurosaki, Carrie
Gillaspie, Zhichang Zhang, Erin Finn, and Tammy Orshiro. Special thanks must
be extended to Ben Ritherdon. He and I work very well together on many
projects and was a good friend. Labwork has not been as funny without him.
I would like to thank my family for their love and support: Mom and dad,
mom and dad Swanson, Josh, Seth, Amanda, Rachel, Katie, Joel, Jacob, and
Hannah.
My wife Amanda has always been supportive, and agreed to move
halfway across the country for me to pursue graduate school at WSU. Her
support has been unwavering. Thank you.
iii

I would finally like to thank the U.S. Department of Energy’s Environmental
Management Science Program for funding this project.
iv

SPECIATION AND REACTIVITY OF CHROMIUM(III) OLIGOMERS IN
ALKALINE SYSTEMS
Abstract
By Judah Isaac Friese, Ph.D. Washington State University
May 2002
Chair: Sue B. Clark
The chemistry of trivalent chromium (Cr(III)) in alkaline systems is very
complex due to the formation of hydrolyzed species. The chemistry of Cr(III)
under such conditions is of recent interest due to the need to remove it from
highly alkaline high level radioactive waste (HLW). Treatment by simple caustic
leaching has not been successful, where as oxidative leaching by various
oxidants yields inconsistent results. Development of a chromium(III) removal
process has been hampered by the lack of understanding of its fundamental
chemistry in alkaline systems.
In this research, several separation methods have been developed to
study the speciation of Cr(III) over a range of pH. Ion exchange (IX) is a method
that separates species based on their overall net charge. Cr(III) oligomers have
increasing charge, the monomer (+3), dimer (+4), trimer (+5) and tetramer (+6)
v

and were separated in macroscopic amounts by IX. Each fraction of oligomer
eluted from the column was analyzed by UV-VIS spectroscopy.
Capillary electrophoresis (CE) is a microscale technique that separates
Cr(III) oligomers under a variety of chemical conditions. CE is also a method that
separates species based on charge density. A separation protocol based on an
indirect method of detection was developed isolate monomeric, dimeric, trimeric
tetrameric and higher oligomers. Order of elution by CE supports the triangular
configuration of the trimer.
Oxidation of Cr(III) with peroxydisulfate is one aspect of reactivity that was
studied in alkaline systems. Separate kinetic studies of the monomer, dimer,
trimer, and tetramer were performed by placing each oligomer is base and
adding the oxidant. A mechanism for oxidation is proposed. Peroxydisulfate has
several advantages and disadvantages as an oxidant for leaching from HLW. In
base, it is a powerful oxidant, but the rate of reaction slows as hydroxide
concentration is increased. It also may oxidize the actinides to more soluble
forms along with Cr(III).
vi

Table of Contents
ACKNOWLEDGEMENTS .................................................................................... iii
Abstract................................................................................................................. v
Table of Contents................................................................................................ vii
List of Tables ....................................................................................................... ix
List of Figures ....................................................................................................... x
Chapter 1: Intorduction to Chromium Chemistry...................................................1
Introduction....................................................................................................1
The Chemistry of Trivalent Chromium. ..........................................................4
Speciation Techniques ..................................................................................5
Cr(III) Speciation............................................................................................9
Cr(III) reactivity ............................................................................................11
Focus of this Thesis and Attribution.............................................................12
Chapter 2: Chromatographic Separation and Characterization of Hydrolyzed
Cr(III) Species .....................................................................................................27
Abstract .......................................................................................................27
Introduction..................................................................................................28
Experimental................................................................................................31
Ion Exchange...............................................................................................32
Data Analysis...............................................................................................36
Results and Discussion ...............................................................................37
Conclusions .................................................................................................43
Acknowledgements......................................................................................44
vii

Chapter 3: Kinetics and Mechanism of the Oxidation of Chromium(III) Oligomers
by Peroxydisulfate Under Alkaline Conditions ....................................................56
Abstract: ......................................................................................................56
Introduction..................................................................................................57
Experimental Section...................................................................................58
Results.........................................................................................................60
Discussion ...................................................................................................65
Chapter 4: The Speciation of Cationic Cr(III) Oligomers as a Function of pH and
Aging Time..........................................................................................................85
Abstract .......................................................................................................85
Introduction..................................................................................................86
Experimental................................................................................................88
Results and Discussion ...............................................................................90
Chapter 5: Conclusions.....................................................................................107
Appendix I: Estimating the Charge Density of Cr(III) Oligomers .......................114
Appendix II: Observed Rate Constants for the Oxidation of Cr(III) with
Peroxydisulfate...........................................................................................119
viii

List of Tables
Chapter 1 Tables Table 1 - Best Basis Inventory Estimates for Waste Components in Tank
241-C-104, 241-T-201 and 241-T-204 ................................................19,20
Table 2 - Variation in the Rates of Hydrolytic Processes .........................21
Table 3 - General Speciation Techniques ................................................22
Table 4 - Characteristics of the Absorption Spectra of Cr(III) Species .....23
Chapter 2 Tables Table 1 - Recovery of Cr(III) from the ion exchange columns ..................47
Table 2 - Estimated volumes and charge densities for the various Cr(III)
species .....................................................................................................48
Chapter 3 Tables Table 1 – Resolved rate constants for the oxidation of individual Cr(III)
species with peroxydisulfate.....................................................................71
Table 2 – Rate constants for the oxidation of unseparated Cr(III) species
.................................................................................................................72
Table 3 – Activation parameters for the oxidation of unseparated Cr(III)
species .....................................................................................................73
Chapter 4 Tables Table 1 – Concentrations of total cationic Cr(III) species .......................100
Table 2 – Estimates of changes in the concentrations of cationic Cr(III)
species as a function of time..................................................................101
ix

List of Figures
Chapter 1 Figures Figure 1 - Solution Structures of Cr(III) Oligomers ...................................24
Figure 2 - UV-VIS Spectra of Oligomeric Species....................................25
Figure 3 - ESR Spectra of Oligomeric Species ........................................26
Chapter 2 Figures Figure 1 - Solution Structures of Cr(III) Oligomers ...................................52
Figure 2 - Chromatograms for the elution of 51Cr-labeled Cr(III) oligomers
by ion exchange .......................................................................................53
Figure 3 - Capillary electrophoresis electropherograms using indirect
detection on the Cr(III) oligomer fractions separated by ion exchange ....54
Figure 4 - Electropherogram for a hydrolyzed solution of Cr(III)...............55
Chapter 3 Figures Figure 1 - Structures of Cr(III) species .....................................................76
Figure 2 - Typical kinetic data at low and high base.................................77
Figure 3 - The dependence of observed rate constants on peroxydisulfate
concentration at 0.10M NaOH and 35.6oC ...............................................78
Figure 4 - The dependence of observed rate constants for the slow
reaction pathway (k2obs) on peroxydisulfate concentration at 0.01M NaOH
and 35.6oC ...............................................................................................79
Figure 5 - Hydroxide dependence on resolved rate constants .................80
Figure 6 - The dependence of observed rate constants on peroxydisulfate
concentration for a mixture of Cr(III) species at 1.0M NaOH....................81
Figure 7 - The dependence of observed rate constants on peroxydisulfate
concentration for a mixture of Cr(III) species at 5.0M NaOH....................82
x

Figure 8 - Arrhenius plots for k2 and kc.....................................................83
Figure 9 - Arrhenius plots for k1 and k-1....................................................84
Chapter 4 Figures Figure 1 - Cr(III) oligomers that have been separated and
characterized..........................................................................................102
Figure 2 - Concentration of dissolved Cr(III) in solutions of varying pH..103
Figure 3 – Electropherogram for the separation of hydrolyzed Cr(III)
species ...................................................................................................104
Figure 4 - Electropherograms for the separation of cationic Cr(III) species
...............................................................................................................105
xi

Chapter 1:
Introduction
The element chromium has been known to mankind for several centuries [1].
Chromium has multiple oxidation states besides the metallic state. Chromium is
a trace element that is essential for life when present as the trivalent cation
(Cr(III)) [1], but chromium(VI) is quite toxic [2]. Chromium(VI) compounds are
present as chromate and dichromate anions, and are deeply colored yellow or
orange. Chromium(III) compounds are faint blue and green, and have a lower
solubility than Cr(VI). Stable Cr(II) compounds also exist, and are often used as
redox reagents [2].
Each oxidation state of chromium has different chemistry, much of which
remains unexplored. For example, relatively little is known about the chemistry
of chromium in systems of high pH. As described in detail below, the solubility,
speciation, and reactivity of chromium in base has received little study to date.
The chemistry of trivalent chromium under alkaline conditions is the focus of this
work, which has applications to the processing of radioactive waste and other
environmental problems.
High level radioactive waste (HLW) generated from defense related
activities has accumulated over the decades since 1946 [3]. While chromium is
not radioactive, its use in stainless steel and other metal alloys [4,5], and as a
redox reagent [3] has generated HLW containing chromium. The HLW produced
in the United States is stored in large (e.g. one million gallon) underground tanks.
1

These tanks were constructed for the purpose of waste storage, and were not
intended for disposal [6]. Although the tanks were designed to have an operating
lifespan of approximately twenty years, some have been in use for more than five
decades, and unfortunately some of the tanks have leaked HLW into the
environment. To prepare the material contained in the tanks for disposal,
chemical processing will be used to isolate and solidify the radioactive
components of the waste for disposal in a national geologic repository. The non-
radioactive components will also be prepared for solidification and local geologic
disposal. Solidification of the radioactive materials and in some cases, the non-
radioactive materials, will involve vitrification to borosilicate glass logs.
Chemical treatments were completed to reduce the liquid volume in the
waste tanks. Reducing agents were added to reduce the actinides to the
relatively insoluble 3+ and 4+ oxidation states. Because the tanks are highly
alkaline, reduced actinides precipitated along with many other components,
forming sludge at the bottom of the tanks. The reducing agents also reduced the
chromium to the trivalent oxidation state, which also precipitated in the tank
sludge, along with many other metal species including large quantities of
aluminum and iron [7]. The water was evaporated to reduce the volume of waste
in the tanks.
Chromium chemistry has implications for HLW processing for two
important reasons:
2

1. The cost related to HLW disposal is extremely high, and the removal of
the non-radioactive components (including chromium) reduces the volume
of waste sent to a national geologic repository [7].
2. During vitrification, chromium forms separate, insoluble spinel structures
that adversely affect the quality of the vitrified waste and shortens the
lifespan of the glass melter system [7].
Because most of the HLW is highly alkaline, separation methods for alkaline
systems must be designed to remove chromium from the radioactive fraction of
the waste. Development of the needed large-scale processing schemes is
hampered by lack of basic knowledge of chromium speciation and reactivity in
alkaline system.
Speciation and reactivity information for Cr(III) in alkaline HLW systems
would be extremely helpful for the development of waste processing techniques;
however, it is extremely difficult due to the chemical complexity of the HLW.
Table 1 lists some of the measured components of several Hanford tanks [8,9].
Each tank is a Byzantine system in and of itself; to complicate matters further,
each tank is distinctly different in make up from every other. Common to all the
tanks are high amounts of sodium, nitrates, and hydroxide. What is known about
the chemical components of the tanks was published in Standard Inventories of
Chemicals and Radionuclides in Hanford Site Tank Wastes [10]. A successful
separation method that is widely applicable across multiple HLW systems must
be based on an understanding of fundamental Cr(III) speciation and reactivity.
3

The Chemistry of Trivalent Chromium.
Cr(III) chemistry is far better understood in acidic solutions than alkaline.
Cr(III) in acid is Cr(H2O)63+ in the absence of chelators and Cr(VI) is present as
Cr2O7-2. Cr(III) in base is a mixture of oligomers that may be cationic, anionic, or
neutral. Cr(III) can also form an amorphous solid phase. Cr(VI) is present as the
chromate anion (CrO42-).
In acidic conditions, Cr(III) has very slow ligand exchange due to the d3
electronic configuration. Cr(III) has an octahedral geometry, and the d orbitals
split into three lower, energy bonding (t2g) and two higher energy, anti-bonding
(eg) orbitals. The three d electrons of Cr(III) occupy the t2g orbitals that will
interact with ligands. For this reason, the half-life for water exchange from the
inner sphere of Cr(H2O)63+ is about forty hours [11]. However, as pH is increased
to near neutral, the rate of ligand exchange on the Cr(III) center increases [12].
Table 2 gives the rate of exchange of ligands for various Cr(III) species. Cr(III),
like many other highly charged cations, hydrolyzes by the formation of µ-hydroxo
and/or µ-oxo bridges between metal centers. This bridging leads to the formation
of dimers, trimers, tetramers, and other higher order oligomeric forms of Cr(III)
clusters (as shown in Figure 1).
Very few researchers have studied Cr(III) in alkaline systems. Complex
mixtures of species are believed to exist, but the exact species formed and their
distributions are unknown. This lack of understanding is due to the lack of
methods to separate and uniquely identify the Cr(III) oligomers. While Cr(III)
species in acidic to near neutral systems have been separated and characterized
4

to various degrees up to the tetramer, little is reported in the literature on higher
order cationic species or anionic species.
The reactivity of Cr(III) species in alkaline systems has also received little
attention. The oligomers shown in Figure 1A-1D have different rates of ligand
exchange [12]. This difference in ligand exchange is an example of how these
oligomers have different chemical properties from each other. The oligomers in
Figure 1A-1D may have other chemical reactivities different from each other. For
example, the oxidation rates of the individual oligomers may be different and this
reactivity information is necessary to understand alkaline systems.
Speciation Techniques
Many general analytical methods have been developed to study chemical
speciation. Lists of these techniques are presented with their detection limits and
applications in Table 3 [13]. Not all these techniques are directly applicable to
the study of Cr(III) speciation. Techniques previously used in Cr(III) study are
electronic spectroscopy (UV-VIS-NIR), electron spin resonance (ESR or EPR), x-
ray absorption spectroscopy (XANES and EXAFS), and liquid chromatographic
methods.
UV-VIS is the most common technique for characterizing Cr(III) species.
Figure 2 shows the UV-VIS spectrum of separated Cr(III) monomer, dimer, and
trimer. There is a slight red shift in the maxima of light absorption (λmax) as
oligomerization increases. This shift is useful for identifying each oligomer.
Table 4 lists the λmax values and the extinction coefficients for each oligomer. A
limitation of UV-VIS is that the species should be separated for unique
5

identification. Because the shifts in position of the peak maxima are small with
increasing oligomerizaation, spectra of mixtures are difficult to deconvolute into
contributions from individual species.
Electron-paramagnetic-resonance (EPR) or electron-spin-resonance
(ESR) spectroscopy has also been used to study Cr(III) species. EPR
spectroscopy measures the absorption of microwave radiation by an unpaired
electron when it is placed in a strong magnetic field [14]. When an atom or
molecule with an unpaired electron is placed in a magnetic field, the spin of the
unpaired electron can align either in the same direction or in the opposite
direction as the field. These potential alignments can be differentiated because
each produces a different energy. Application of a magnetic field to an unpaired
electron lifts the degeneracy of the ± ½ spins of the electron. Cr(III) is EPR
active because it has unpaired electrons. The use of EPR in identifying structure
of the species has been limited due to complexity of the signals obtained for the
oligomerized species. Example spectra are shown in Figure 3.
Extended X-ray Absorption Fine Structure (EXAFS) is also a powerful
technique that can be used to examine the immediate environment around a
Cr(III) center. This method uses monochromatic x-rays, the energies of which
are scanned. The photon energy is gradually increased until it exceeds the
binding energy of the core electron of interest. When the core electron is lost,
additional energy in the form of photoelectrons is released, which is
backscattered by surrounding atoms. The net result is a series of oscillations on
the high photon energy side of the x-ray absorption edge for a given element.
6

These oscillations can be used to determine the atomic number, distance, and
coordination number of the surrounding atoms that backscatter the
photoelectrons. A major drawback of this method is that a high flux of highly
collimated x-rays are needed to generate a monochromatic beam, the energies
of which can be scanned. This generally requires the use of a synchrotron
radiation source that is only available at limited locations around the world.
Liquid chromatographic techniques can also provide indirect evidence
about speciation. The use of capillary electrophoresis (CE) to separate metal
ions is becoming increasingly more common. CE is a versatile microscale
chromatographic technique that separates species based on charge densities
[15]. Mixtures of species are injected into a fused silica capillary. A potential is
applied across the capillary. The species that have higher charge densities will
migrate at a faster rate than species with lower charge densities. The species
migrate through the column pass a detector on the column. The most common
detector type is a UV-VIS detector. The main disadvantage of using CE to
separate Cr(III) hydrolysis products is the lack of a sensitive method of detection.
Cr(III) oligomers have extinction coefficients less than 40 M-1cm-1 (e.g. Table 4).
The path length for light is capillary, which is typically 75µm. Because total
absorbance is directly proportional to path length and extinction coefficients (e.g.
Beer’s Law), Cr(III) species cannot be directly detected using UV-VIS.
To circumvent this problem, an indirect detection method is used where a
strongly absorbing compound is added to the electrolyte to provide a high
constant absorption of light. When a species passes the detector, it displaces
7

the absorbing compound and gives decrease in signal. By using this indirect
detection method, Cr(III) monomer has been separated from other metal cations
using CE [16]. Cr(III) hydrolysis products have also been detected directly by
using capillary electrophoresis inductively coupled plasma mass spectrometry
(CE-ICP-MS) [33]. While both of these CE methods yield good separations, no
structural information about the eluting species was provided.
Ion exchange (IX) chromatography is another liquid chromatographic
technique that is useful in separating Cr(III) hydrolysis products. Ion exchange
involves a stationary phase that has charged ionic functional groups bound to it.
When charged species are passed through the stationary phase, they will
displace, or exchange with the ions that are currently paired with the solid phase
functional groups. The eluents used in IX are salts of increasing concentration or
increasing ionic charge. Lower charged species will migrate faster in the column
because they interact with the functional groups less strongly than higher
charged species. The Cr(III) oligomers in Figure 1A-1D all have different ionic
charges, and thus should be separable using a cation exchange column. One
limitation of IX is that highly charged species will strongly sorb to the stationary
phase, and cannot be removed from the column. For this reason, cation
exchange chromatography cannot be used to separate the larger, more highly
charged Cr(III) oligomers.
Each liquid chromatographic method has advantages and disadvantages.
Ion exchange can separate macro-scale amounts of species that can be used in
further chemical analysis and characterization, but cannot separate highly
8

charged species. CE avoids this drawback by using a different mode of
separation and a fused capillary that does not strongly sorb higher charged
species. Characterization of Cr(III) species detected by CE is difficult and
problematic. By using the two chromatographic together, further understanding
of Cr(III) speciation over the entire pH range can be studied.
Cr(III) Speciation
Most prior work regarding Cr(III) speciation has been in acidic to near
neutral systems. Initial observations showed that acidic Cr(III) solutions that are
hydrolyzed by the addition of base at different rates results in solutions that have
different chemical properties; thus, Cr(III) speciation is dependent the method of
base addition [17]. Other researchers also noted that resulting hydrolysis
products from the oxidation of Cr(II) to Cr(III) were dependent on the oxidation
method used [18]. These observations suggest that Cr(III) forms a distribution of
species.
Initial ion exchange (IX) separations of hydrolyzed Cr(III) solutions
indicated that at least two species were present [19,20]. The most extensive
early work regarding Cr(III) speciation was completed by Marty, et al. [21,22,23].
This group developed ion exchange methods to separate more Cr(III) oligomers.
Monomeric, dimeric, trimeric, and tetrameric Cr(III) species were separated using
Sephadex SP C-25 cation exchange resin with a concentration gradient of
NaClO4 from 1.0M to 4.0M [21]. UV-VIS, pH titrations, and chromatographic
elution order were used to characterize the separated species resulting in
proposed structures, as shown in Figure 1A-1D.
9

Thompson and Connick also studied Cr(III) oligomers. They developed a
separation method based on the use of Dowex 50X4 resin [24]. Using NaClO4,
Ca(ClO4)2 and La(ClO4)3 as eluants, they obtained results consistent with Marty
et al. [25]. This separation method used large volumes of eluents resulting in
dilute Cr(III) oligomer solutions. Using EPR and similar characterization
techniques as Marty et al., they were unable to definitively eliminate the linear
arrangement for trimeric and tetrameric depicted in Figure 1E and 1F as opposed
to the triangular arrangement shown in Figure 1C-1D [26].
The oligomeric structures of Cr(III) have been studied by other methods as
well. The structure of the monomer as shown in Figure 1A has been confirmed
by EXAFS [27]. The dimer has been confirmed by EXAFS [28] in solution and in
the solid phase by crystallography [29]. The trimeric structure is best described
in aqueous solution as shown in Figure 1C. EXAFS measurements [28] and
charge density arguments based on elution order in capillary electrophoresis [30]
suggest the triangular arrangement. A solid-state crystal structure obtained
using organic solvents indicated a linear arrangement [31]. The structure of the
tetramer in solution has not been confirmed by other methods beyond those of
Marty et al. A solid-state crystal structure has been reported that is consistent
with Figure 1D [32]. Electrospray ionization mass spectrometry has been used to
obtain masses of various Cr(III), H2O, OH- clusters without prior separation [33].
10

Cr(III) reactivity
Cr(III) oxidation to Cr(VI) in alkaline systems has recently been of interest
due to the HLW disposal problem. Initially, the Cr(III) was to be removed by
caustic leaching by:
(2) )()()()( aqOHCrOHamOHCr −− →+ 43
However, the amount of Cr removed from tank waste by this reaction was very
low, so oxidative dissolution has been proposed. In this process, an oxidant is
introduced with the base to oxidize Cr(III) to Cr(VI). The variability in tank
chemistry presents a problem for designing an oxidative treatment that dissolves
chromium by oxidation under a wide range of conditions. It has been observed
that the same leaching conditions sometimes removes most of the Cr in a given
tank, but yields little affect on Cr in other tanks. Finding conditions for oxidation
that will remove Cr from all the tanks is the goal in tank waste processing;
however, fundamental knowledge regarding Cr(III) reactivity is lacking.
A plethora of oxidants that can successfully oxidize Cr(III) to Cr(VI) exist;
however, anticipation of which oxidant works best under a range of chemical
conditions remains in question. Very little information regarding the redox
reactions of Cr(III) under alkaline systems is known. Several non-mechanistic
studies of oxidation of Cr(III) have been reported, including oxidation with
hydrogen peroxide [34,35,36], cerium(IV) [37], bromate [38,39], permanganate
[38,40,41,42], peroxynitrite[43], ferrate [44], and periodate [45,46]. Detailed
mechanistic studies have been difficult because of the complex chemistry of
11

Cr(III) in alkaline conditions. These studies have involved the oxidation of
mixtures of hydrolyzed Cr(III) oligomers rather than individual oligomers.
An overview of several oxidants that may be promising for oxidative
leaching of Cr(IIII) form HLW has been reported [47]. This report gave
preliminary results on Cr(III) oxidation with oxygen, ozone, hydrogen peroxide,
permanganate and peroxydisulfate (persulfate). The researchers synthesized
several different Cr(III) solids and exposed the solids to the oxidant. Of all the
oxidants studied, the rate of oxidation by peroxydisulfate was the only one that
did not depend on the identity of the Cr(III) solids being tested. Peroxydisulfate is
also stable in alkaline systems and a powerful oxidant.
A mechanistic study using separated Cr(III) oligomers and hydrogen
peroxide as an oxidant has recently been reported [48]. The attack of the Cr(III)
µ-hydroxo bonds by hydrogen peroxide was slowed by an increase in base as
well as an increase in oligomerization. A similar kinetic study with other oxidants
such as peroxydisulfate would be informative to examine mechanistic
differences. Mechanistic information such as these on the oxidation of Cr(III) to
Cr(VI) will be helpful in designing a oxidative leaching method for the HLW
systems. Knowing what affects a chemical reaction will help in optimizing the
conditions for leaching.
Focus of this Thesis and Attribution
This thesis is organized three major sections. Chapter 2 covers Cr(III)
separation and characterization techniques that were developed in the course of
this research. Methods for better macroscale separation of Cr(III) are presented.
12

Evidence for the triangular structure of the trimer was also obtained. Chapter 3
details the kinetics and mechanism of oxidation of Cr(III) oligomers with
peroxydisulfate. Two oxidation pathways were observed as well as a decline in
reaction rates as base and/or in the degree of oligomerization increases.
Chapter 4 contains a study of Cr(III) speciation changes with pH and time. In the
pH range of 9 to 12, cationic oligomers are in solution. At pH’s greater than 12,
cationic species account for less than 2% of solution species.
A systematic study of Cr(III) reactivity requires the separation of Cr(III)
oligomers. Literature methods were difficult to reproduce and did not give high
enough concentrations of the oligomers needed. Chapter 2 addresses these
issues by developing a new separation technique that yields oligomers in high
concentration for characterization and further experiments. Judah I Friese
developed the IX method, with assistance by B. Ritherdon. A new, microscale
separation technique using CE was also developed. This was used to check the
purity of the oligomers obtained from the IX separation and to probe for species
larger than the tetramer. CE was also used to infer structural information based
on the elution order of the oligomers. The CE experiments were planned and
conducted by Friese. Ben Ritherdon provided instrument troubleshooting and
assistance with the experiments. S.B. Clark, L. Rao, Z. Zhang and D. Rai
provided helpful discussions and advice on IX procedures and Cr(III) solubility.
The manuscript was prepared by J. Friese and S.B. Clark and is in the format
required by Analytical Chemistry (J.I. Friese, B. Ritherdon, S.B. Clark, Z. Zhang,
13

L. Rao, D. Rai, “Chromatographic Separation and Characterization of Hydrolyzed
Cr(III) Species.” Accepted for publication in Analytical Chemistry, 2002).
Using the IX separation technique described in the paper above, a
systematic kinetic study of individual Cr(III) oligomers with peroxydisulfate was
prepared. Chapter 3 reports the results of this study, as well as oxidation of a
mixture of oligomeric species. A thermal degradation product from
peroxydisulfate accounted for one oxidation pathway, and oxidation by
peroxydisulfate was another pathway. Oxidation rates are slowed by an increase
in hydroxide concentration and in oligomerization. J. Friese planned these
experiments and both Friese and Ritherdon conducted them. Data analysis was
conducted by J. Friese with assistance from S.B. Clark, B. Ritherdon, L. Rao,
and Z. Zhang. The manuscript was prepared by J. Friese and S.B. Clark and is
in the format for Inorganic Chemistry (J.I. Friese, B. Ritherdon, S.B. Clark, Z.
Zhang, L. Rao, D. Rai, “Kinetics and Mechanism of the Oxidation of
Chromium(III) Oligomers by Peroxydisulfate Under Alkaline Conditions”
Submitted to Inorganic Chemistry, March 2002).
Elucidation of Cr(III) speciation over a large pH range is difficult due to the
formation of many different oligomer species. The CE procedure that was
developed and presented in Chapter 2 was used to detect cationic Cr(III) species
over a pH range of 1 to 13. The aging effect was also probed by sampling the
solutions over an eight month time period. Under moderately alkaline conditions
(pH 10 -12), cationic Cr(III) species account for a measurable portion of solution
species. Under alkaline conditions (pH ≥13) however, most of the species in
14

solution are neutral and/or anionic. These experiments were planned by J.
Friese and conducted by J. Friese and T. Oshiro. J. Friese, T. Oshiro and S.B.
Clark conducted all data analysis. Manuscript prepared by J. Friese and S.B.
Clark and is in the format required by Environmental Science and Technology (J.
I. Friese, T. Oshiro, S.B. Clark, “Study of the Speciation of Cr(III) in Alkaline
systems.” In preparation).
In addition to the contributions described above, S B. Clark provided
scientific direction, funding, and moral support for all aspects of the research
presented in this thesis. Funding was provided by and Environmental
Management Science Program to S.B. Clark under contract number FG07-
98ER14930 at Washington State University.
The new information in this thesis is presented as it relates to HLW in
Chapter 5. The new IX separation for Cr(III) oligomers will be useful in further
reactivity studies. Mechanistic studies are simplified by the use of individual
oligomers, and these can now be easily obtained in high concentrations. The
mechanistic study with peroxydisulfate has yielded several advantages and
disadvantages of its use as a potential oxidant in leaching Cr(III) from HLW.
These will be discussed as it relates to HLW and future needs. New approaches
to the study of Cr(III) in alkaline systems well also be presented and discussed.
These approaches include developing anionic Cr(III) separations, direct CE
detection methods, and other potential oxidants to study that are relevant to
HLW.
15

1 Weast, R. C.; Astle, M. J., Eds. CRC Handbook of Chemistry and Physics; 62nd ed.; CRC Press: Boca Raton, FL, 1981, B-12. 2 Cotton, F. A.; Wilkinson, G.; Murillo, C. A.; Bochman, M. Advanced Inorganic Chemistry; 6th ed.; John Wiley & Sons: New York, NY, 1999. 3 Nuclear Facility Decommissioning and Site Remedial Actions. A Selected Bibliography, Volume 18, Part 1A: Citations with abstracts, sections 1 through 9 Report ES/ER/TM---227/Pt.1A, Oak Ridge National Laboratory: Oak Ridge, TN, 1997, p.447 4 Nuclear Facility Decommissioning and Site Remedial Actions: A Selected Bibliography, Vol. 18 Part 2 Indexes Report ES/ER/TM---227/Pt.2, Oak Ridge National Laboratory: Oak Ridge, TN, 1997, p.418 5 Rapko, B. M.; Oxidative Alkaline Dissolution of Chromium from Hanford Tank Sludges: Results of FY 98 Studies, Report PNNL-11908, Pacific Northwest National Laboratory: Richland, WA, 1998. 6 Boston, H.L., River Protection Project, DOE/ORP-2000-10 7 Rapko, B. M.; Oxidative Alkaline Dissolution of Chromium from Hanford Tank Sludges: Results of FY 98 Studies, Report PNNL-11908, Pacific Northwest National Laboratory: Richland, WA, 1998 8 Landon, M.R. et. al. C Tank Farm and Tank 241-C-104 Systems and Components Functionality Assessment Report, RPP-7155,Richaland WA. 9 Simpson, B. C., Tank Characterization Report for Single-Shell Tanks 241- T-201, 241-T-202, 241-T-203 and 241-T-204, HNF-1501, RIchland WA. 10 Kupfer, M.J., Boldt, A.L., Higley, B.A., Hodgson, K.M., Shelton, L.W., Simpson, B.C., Standard Inventories of Chemicals and Radionuclides in Hanford Site Tank Wastes, HNF-SD-WM-TI-740, 1994 Lockheed Martin Hanford Corporation, Richland WA 11 Basolo, F., Person, R.G., Mechanisms of Inorganic Reactions. A Study of Metal Complexes in Solution, John Wiley and Sons, New York, 1993 12 Crimp, S.J., Spiccia, L., Krouse, H. R., Swaddle, T.W., Inorganic Chemistry, 1994, 33, 465 13 Brown, G. E. et. al., Chemical Reviews 1999, 99, 77-174. 14 Weil, J. A.; Bolton, J. R.; Wertz, J. E. Electron Paramagnetic Resonance: Elementary Theory and Practical Applications; Wiely: New York, 1994. 15 Guzman, N. A., Ed. Capillary Electrophoresis Technology; Marcel Dekker: New York, NY, 1993. 16 Chen, M.; Cassidy, R. M. Journal of Chromatography 1993, 640, 425-431. 17 Kohlschutter, H. W.; Melchior, O. Angew. Chem. 1936, 49, 865.
16

18 Altman, C.; King, E. L. Journal of the American Chemical Society 1961, 2825. 19 Altman, C.; King, E. L. Journal of the American Chemical Society 1961, 2825. 20 Ardon, M.; Plane, R. A. Journal of the American Chemical Society 1959, 81. 21 Stunzi, H.; Marty, W. Inorganic Chemistry 1983, 22, 2145. 22 Stunzi, H.; Rotzinger, F. P.; Marty, W. Inorganic Chemistry 1984, 23, 2160-2164. 23 Stunzi, H.; Spiccia, L.; Rotzinger, F. P.; Marty, W. Inorganic Chemistry 1989, 28, 66-71. 24 Thompson, M. E.; Connick, R. E. Inorganic Chemistry 1981, 20, 2279- 2285. 25 Finholt, J. E.; Thompson, M. E.; Connick, R. E. Inorganic Chemistry 1981, 20, 4151-4155. 26 Thompson, M.G.; Thesis, University of California at Berkeley, 1964. 27 Lindquist-Reis, P.; Munoz-Paez, A.; Diaz-Moreno, S.; Pattanaik, S.; Persson, I.; Sandstrom, M. Inorganic Chemistry 1998, 37, 6675-6683. 28 Rao, L.; Zhang, Z.; Friese, J. I.; Ritherdon, B.; Clark, S. B.; Hesss, N. J.; Rai, D. Journal of the Chemical Society - Dalton Transactions 2002, 267- 274. 29 Spiccia, L.; Stoeckli-Evans, H.; Marty, W.; Giovanoli, R. Inorganic Chemistry 1987, 26, 474-482. 30 Friese, J. I.; Ritherdon, B.; Clark, S. B.; Zhang, Z.; Rao, L.; Rai, D. Analytical Chemistry Accepted. 31 Harton, A.; Terrell, K.; Huffman, J. C.; MacDonald, C.; Beatty, A.; Li, S.; O'Connor, J. O.; Vincent, J. B. Inorganic Chemistry 1997, 36, 4875-4882. 32 Drljaca, A.; Hardie, M. J.; Raston, C. L.; Spiccia, L. Chem. Eur. J. 1999, 5, 2295-2299. 33 Stewart, I. I.; Olesik, J. W. Journal of Chromatography A 2000, 872, 227- 246. 34 Baloga, R. M.; Early, J. E. Journal of the American Chemical Society 1961, 83, 4906-4909. 35 Pettine, M.; Millero, F. J.; La Noce, T. Marine Chemistry 1991, 34, 29-46. 36 Petruzzelli, D.; Tiravanti, G.; Santori, M.; RPassino, R. Water Science Technology 1994, 30, 225-233.
17

37 Suwa, T.; Kuribayashi, N. Journal of Nuclear Science and Technology 1986, 23, 622-632. 38 Rearter, G. B.; Morando, P. J.; Blesa, M. A.; Hewlett, P. B.; Matijevic, E. Chemistry of Materials 1991, 3, 1101-1106. 39 Rodenas, L. G.; Morando, P. J.; Blese, M. A.; Duhalde, S.; Saragovi, C. Canadian Journal of Chemistry 1993, 71, 771-778. 40 Lumetta, G. J.; Rapko, B. M. Separation Science and Technology 1999, 35, 1495-1506. 41 Segal, M. G.; Williams, W. J. Journal of the Chemical Society - Farday Transactions 1986, 82, 3245-3254. 42 O'Brian, A. B.; Segal, M. G.; Williams, W. J. Journal of the Chemical Society - Farday Transactions 1987, 83, 371-382. 43 Lymar, S. L.; Gerasimov, O. V., Personal Communication 44 Sylvester, P.; Rtherford, L. A.; Gonzales-Martin, A.; Kim, J.; Rapko, B. M.; Lumetta, G. J. Environmental Science and Technology 2001, 35, 216-221. 45 Mills, A.; P., S. Journal of the Chemical Society - Farday Transactions 1993, 89, 3389-3394. 46 Hiremath, S. C.; Tuwar, S. M.; Naidibewoor, S. T. Indian Journal of Chemistry 1999, 38A, 61-64. 47 Krot, N. N.; Shilov, V. P.; Fedoseev, A. M.; Budantseva, N. A.; Nikonov, M. Y.; Yusov, A. B.; Yugarnov, A.; Charushnikova, I. A.; Preminov, V. P.; Astafurova, L. N.; Lapitskaya, T. S.; Makarenkov, V. I. "Development of Alkaline Oxidative Dissolution Methods for Chromium(III) Compounds Present in Hanford Site Tank Sludges," PNNL-12209, 1999. 48 Rao, L.; Zhang, Z.; Friese, J. I.; Ritherdon, B.; Clark, S. B.; Hesss, N. J.; Rai, D. Journal of the Chemical Society - Dalton Transactions 2002, 267- 274.
18

Table 1. Best Basis Inventory Estimates for Waste Components in Tank 241-C-104, 241-T-201 and 241-T-204 (Radionuclides are decayed to January 1, 1994)
Component Total Inventory (kg for chemicals; Ci for radionuclides) Tank 241-C-104
Total Inventory (kg for chemicals; Ci for radionuclides) Tank 241-T-201
Total Inventory (kg for chemicals; Ci for radionuclides) Tank 241-T-204
Al 91500 14.0 9.33 Bi 2.42 16600 8960 Ca 3030 173 35.9 Cl 812 151 117
Total Inorganic Carbon
49300 564 1220
Cr 1480 746 781 F 35100 708 1030 Fe 28100 1380 703 Hg 152 0 0 K 1340 671 1070 La 49.4 3470 2000 Mn 7130 6180 2450 Na 182000 4500 5530 Ni 2670 87.8 42.0
NO2 37000 43.8 49.4 NO3 19800 6730 9610 OH- 318000 14600 6640 Pb 849 29.6 54.0
PO43- 5260 1940 1310
Si 10400 259 261 SO4
2- 4560 38.6 63.2 Sr 88.8 156 87.0
Total Organic Carbon
14400 42.4 54.3
U 54500 8.12 11.0 Zr 65900 0 0
H-3 9.06 2.86 3.57 C-14 0.937 0.0411 0.055 Ni-59 23.4 0.000956 0.00119 Co-60 678 0.273 0.341 Ni-63 2310 0.0262 0.0327 Se-79 13.4 0.0000368 0.0000500 Sr-90 579000 21.7 0.882 Y-90 579000 21.7 0.882 Zr-93 58.3 0.000175 0.000196
Nb-93m 49.5 0.000145 0.000237 Tc-99 25.2 0.00121 0.00164
19

Ru-106 0.1010 4.2E-11 5.70E-11 Component Total Inventory (kg
for chemicals; Ci for radionuclides) Tank 241-C-104
Total Inventory (kg for chemicals; Ci for radionuclides) Tank 241-T-201
Total Inventory (kg for chemicals; Ci for radionuclides) Tank 241-T-204
Cd-113m 133 0.000489 0.000664 Sb-125 8.19 0.0000646 0.0000877 Sn-126 21.5 0.0000555 0.0000753 I-129 0.0139 0.00000299 3.10E-6
Cs-134 0.654 0.322 0.414 Cs-137 114000 6.6 1.40 Ba-137, 107000 6.98 1.48 Sm-151 50100 0.139 0.189 Eu-152 13.3 0.000182 0.000247 Eu-154 1930 0.611 0.762 Eu-155 824 0.457 0.571 Ra-226 0.00434 8.22E-9 1.12E-8 Ac-277 61.9 4.34E-8 5.89E-8 Ra-288 19.8 5.28E-13 7.17E-13 Th-229 0.439 1.02E-10 1.39E-10 Pa-231 111 1.00E-7 1.36E-7 Th-232 1.10 4.62E-14 6.27E-14 U-232 23.2 5.36E-8 7.27E-8 U-233 88.8 2.45E-9 3.32E-9 U-234 21.5 0.00267 0.00363 U-235 0.846 0.000119 0.000161 U-236 0.947 0.0000233 0.0000316 Np-237 0.0248 7.51E-6 0.0000102 Pu-238 244 0.485 0.606 U-238 18.2 0.00271 0.00368 Pu-239 5560 99.6 23.6 Pu-240 1100 6.40 1.50 Am-241 6370 4.32 4.25 Pu-241 16600 0.0125 0.0183 Cm-242 5.87 3.70E-6 5.03E-6 Pu-242 0.0965 6.23E-9 8.45E-8 Am-243 0.329 3.08E-9 4.19E-9 Cm-243 0.539 7.98E-8 1.08E-7 Cm-244 20.7 7.84E-8 1.06E-7
20

Table 2. Variation in the Rates of Hydrolytic Processes with the OH/Cr(III) Ratios in Monomers and Oligomers at 25oC and I = 1.0Ma
21
a. From Reference [8]. The abbreviations SBD and DBD correspond to a singly bridged dimer and a doubly bridged dimer, respectively.

Table 3. General Techniques for Chemical Speciation
22

Table 4. Characteristics of the Absorption Spectra of Cr(III) Species Species pH Peak Peak λmax, nm ε1 M-1cm-1 λmax, nm ε2 M-1cm-1 Monomer 2.0 575 14.0 408 16.7 Dimer 2.7 580 17.8 416 20.9 Trimer 2.5 582 19.6 424 29.4 Tetramer 1.8 585 21.0 425 31.0 ε is per chromium metal center
23

Figure 1. Solution Structures of Cr(III) Oligomers.
Cr
HOH2O
OH
H2O
OH2
OH2
Cr
OH2
OH2
OH2
OH2
Cr
HOH2O
OHH2O
OH2
HO
Cr
OH2
OH2
OH2
OH
Cr
H2O OH2OH2
Cr
OHH2O
OHH2O
HO
HO
Cr
OH2
OH2
OH
OH
Cr
H2O OH2OH2
Cr
OH2H2OOH2
Cr
OH2H2O
OH2H2O
OH2
OH2
3+ 4+
5+ 6+
A B
C D
CrH2O
H2OHO
OH
OH2
OH2
Cr
HO
OH
OH2
OH2
CrOH2
OH2
OH2
OH2
5+
CrH2O
H2OHO
OH
OH2
OH2
Cr
HO
OH
OH2
OH2
Cr
HO
OH
OH2
OH2
6+
CrOH2
OH2
OH2
OH2
E
F
24

Figure 2. UV-VIS Spectra of Oligomeric Species, I=3.0M with NaClO4
200 300 400 500 600 700 8000
5
10
15
20
25
30
35
40M
olar
ity A
dsor
ptio
n C
oeffi
cien
cy (ε
), M
-1cm
-1
Wavelength, nm
Monomer Dimer Trimer
25

Figure 3. ESR Spectra of Oligomeric Species, I=3.0M with NaClO4
0 1000 2000 3000 4000 5000 6000-800
-600
-400
-200
0
200
400
600
800
1000
Inte
nsity
Gauss
Monomer
0 1000 2000 3000 4000 5000 6000
-400
-200
0
200
400
600
800
Inte
nsity
Gauss
Trimer
0 1000 2000 3000 4000 5000 6000
0
50
100
150
200
250
Inte
nsity
Gauss
Dimer
0 1000 2000 3000 4000 5000 6000-1000
-800
-600
-400
-200
0
200
400
Inte
nsity
Gauss
Tetramer
26

Chapter 2
Chromatographic Separation and Characterization of Hydrolyzed Cr(III) Species
J. I. Friese1, B. Ritherdon1, S. B. Clark1, Z. Zhang2, L. Rao2, and D. Rai3
1Washington State University, Department of Chemistry, P.O. Box 644630, Pullman, WA 99164-4630 2Lawrence Berkeley National Laboratory, Chemical Sciences, Berkeley, CA 94720 3Pacific Northwest National Laboratory, Richland, WA
Abstract
Both macroscale and microscale methods to separate hydrolyzed Cr(III) species
from acidic to near-neutral pH solutions have been developed. The macroscale
approach is based on ion exchange, and involves separating monomeric, dimeric,
trimeric, tetrameric, and higher order Cr(III) oligomers from such solutions using a
gradient elution with increasing cationic charge. With this approach, the concentration
of a given fraction can be maximized, and complete resolution between these species
can be achieved. In addition, complete recovery of Cr(III) from the column is
achievable. For the microscale approach, capillary electrophoresis with indirect
detection is used to isolate and uniquely identify the same smaller oligomers, and a
fraction of larger Cr(III) species but which are not uniquely identified. Capillary
electrophoresis also provides indirect structural information for the Cr(III) trimer,
suggesting that it exists in a triangular configuration rather than as a linear species.
These methods are described in detail, and possible applications are discussed.
27

Introduction
The hydrolysis of trivalent chromium has been of interest to inorganic and
solution chemists for many decades. In most cases, this interest relates to its use in
chemical processes (e.g. the production of stainless steel and other alloys [1,2,3]) and
the subsequent waste streams and environmental problems that are generated.
Chromium has also been used in casings and structural materials of nuclear fuel
packages [1], and as a redox agent in the processing of defense-related nuclear
materials [2]. This has led to radioactive wastes contaminated with Cr, actinides, and
fission products that must be processed for eventual geologic disposal. This requires
that chromium be removed by oxidation to chromate for separation from the
radioactivity, but progress in the development of this chemical technology has been
hampered by a lack of understanding of Cr(III) speciation and reactivity in the waste
systems [3]. Knowledge of the fundamental reactivity of Cr(III) is limited due to the
complexity of its chemical behavior, scant structural knowledge for many Cr(III) species,
and few analytical tools for effective separation and characterization.
As with other highly charged cations such as Fe(III), Al(III), and Pu(IV) [4,5],
hydrolysis of Cr(III) results in a distribution of oligomeric species formed via µ-hydroxo
and/or µ-oxo bridges between the metal centers that lead to the formation of dimeric,
trimeric, tetrameric, and higher order oligomers from the Cr(III) monomer; possible
species are shown in Figure 1. Despite decades of study, no agreement exists on the
relative importance of these various species in the different chemical processing
systems, nor on the actual structures of the Cr(III) trimer and larger oligomers. For
example, in a recent paper we reported on the solubility and speciation of Cr(III) in
28

radioactive waste solutions and found that our experimental solubility data was
adequately described by considering only monomeric, dimeric, and possibly trimeric
species, even in highly alkaline solutions that should favor the formation of larger Cr(III)
oligomers [6]. The coordination geometries shown in Figure 1 for the monomer and
dimer are generally accepted for acidic to near-neutral solutions. A search of the
literature reveals two possible configurations for the trimer in solution, either linear or
triangular as shown [7,8,9]. Electron pair resonance data [7] for trimeric Cr(III) in
solution did not allow unique identification of either species. Measurement of proton
acidities for the µ-hydroxo moieties of the trimer in solution was not consistent with a
linear geometry [9]. More recently, we have reported structural parameters for the
triangular configuration [10]; we were unable to identify a linear Cr(III) species. A crystal
structure for the aggregated tetrameric Cr(III) species has been reported [11], but no
structural information for solution species is available. To our knowledge, no firm
structural data has been reported for oligomers larger than tetrameric.
In theory, the various species shown in Fig. 1 should be easily separable due to
their different charges. In practice, however, isolation and characterization of the larger
Cr(III) oligomers have been problematic due to their large cationic charges distributed
over their relatively small structures. Thompson and Connick [7,12,13] reported on the
separation of dimeric and trimeric Cr(III) from Cr(III) monomers and higher order
oligomers using Dowex 50W-X12 and very large quantities of metal-perchlorate salt
solutions as eluants. Although separation was achieved, the work was laborious and
resulting fractions of dimer and trimer were quite dilute. Bradley et al. [14] attempted to
separate a very large Cr(III) oligomer using size exclusion chromatography. They
29

hypothesized the presence of a Cr(III) species analogous to [AlO4Al12(OH)24(H2O)12]7+
and [GaO4Ga12(OH)24(H2O)12]7+. Although not confirmed, their work supported the
presence of a distribution of large oligomers composed of Cr(III) in an octahedral
geometry. No other structural or stoichiometric details were provided. Using Sephadex
SP C-25 cation exchanger, Stunzi et al. have published many reports on the isolation
and characterization of monomeric, dimeric, trimeric, and tetrameric Cr(III) species
using increasing concentrations of NaClO4 (1.0 – 4.0 M) in a gradient elution
[8,9,15,16]. Their procedure also required large volumes of eluant that produced dilute
fractions of the Cr(III) species.
The dilute fractions of hydrolyzed Cr(III) oligomers isolated by others make
spectroscopic characterization and structural determination difficult and often
ambiguous. In addition, although rarely mentioned in the literature, these methods
leave large quantities of Cr(III) irreversibly sorbed to the ion exchange or size exclusion
resin. This paper describes ion exchange methods that have been developed to isolate
macroscopic quantities of smaller Cr(III) oligomers (e.g., monomer, dimer, trimer, and
tetramer) with concentrations that allow further spectroscopic investigation. The
method, which relies on a Sephadex cation exchanger and solutions of metal-
perchlorate salts as eluants, has not (to our knowledge) been reported previously, and
is a significant improvement over published methods. As described herein, this method
has been demonstrated using both spectroscopic and radiometric techniques. Capillary
electrophoresis (CE) is a relatively new chromatographic technique that has been
shown to separate microscopic quantities (~10nL) of charged species [17,18,19,20,21].
Separation is based on net species charge density, which is the ratio of overall species
30

charge to its size. CE has been used to isolate minute quantities of larger Cr(III)
oligomers, to characterize the purity of the macroscopic fractions of Cr(III) oligomers
isolated by ion exchange, and to infer structural information about the Cr(III) trimer
based on its net charge density as suggested by CE elution order. Here, these
chromatographic methods are described and discussed in terms of further applications
for separation of small, highly charged inorganic species, and subsequent indirect
structural characterization.
Experimental
Stock solutions of trivalent Cr were made by dissolving Cr(ClO4)3⋅6H2O (Aldrich)
in 18 MΩ water to give a deep blue solution. Fresh solutions of base were prepared by
dissolution of NaOH or KOH pellets (Fisher). Hydrolysis of the Cr(III) was induced by
mixing equal volumes of equimolar concentrations (usually 0.2 M) of Cr(III) with either
NaOH or KOH. The base was added dropwise to the Cr(III) solution with rapid stirring.
During base addition, the Cr(III) solution color changed from blue to green, becoming
increasingly turbid with the formation of a visible precipitate after about 75% of the base
had been added. Dropwise base addition was continued until the full volume was
consumed. The resulting green suspension was stirred rapidly for four hours. During
this time, the suspended green precipitate gradually dissolved to give a green solution
with a pH of about 5.5. At the conclusion of this four-hour period, the pH of the solution
was adjusted to 3.0 with 1.0M HClO4, causing the green color to change to blue-green.
This method of hydrolysis, which is a variation of the approach originally reported by
Stunzi et al. [8], was chosen because it is known to yield a large quantity of the smaller
Cr(III) oligomers.
31

In some cases, 51Cr was used as a tracer to monitor the separation of Cr(III)
species by ion exchange. 51Cr was produced by neutron irradiation of Cr(ClO4)3⋅6H2O
to generate 1.06 µCi of activity. The irradiated Cr(ClO4)3⋅6H2O was dissolved in 18 MΩ
water. This solution was green due to small amounts of Cr(III) oxidized to Cr(VI) during
irradiation. An aliquot of this solution was then spiked into a non-radioactive Cr(III)
solution, which was hydrolyzed as described above to give a solution of 0.069 µCi of
51Cr-labeled oligomers. Appropriate radiation safety procedures must be followed when
using tracers such as 51Cr to avoid unnecessary radiation exposure.
Ion Exchange
Ion exchange columns were 12 cm in length, 1 cm inner diameter (ID), and filled
with 8 cm of Sephadex SP C-25 cation exchange resin. To prepare the column, the
resin was washed with 100 mL 2M NaOH, followed by 100 mL water, and then 100 mL
2M HCl. Once the Sephadex was in the proton form, excess protons were removed by
a final wash with 100 mL water. Eluants used for elution of the Cr(III) oligomers were
NaClO4 (Fisher), Ca(ClO4)2 (Aldrich), La(ClO4)3 (Alfa Aesar), Th(ClO4)4 and
(NH4)2Ce(SO4)3. Perchlorate salts, if available, were dissolved directly in 0.01M HClO4.
Th(NO3)4 (Baker) was dissolved in concentrated HClO4, and fumed to dryness.
Dissolution in concentrated perchloric acid followed by fuming was repeated three
times. Care must be taken to avoid fuming perchlorate salts in the presence of
organics. The excess perchlorate was removed by addition of water and fuming to
dryness until the pH upon water dissolution was greater than 1.5. (NH4)2Ce(SO4)3
(Smith Chemical Co.) was dissolved in 0.01M HClO4 to form a saturated solution.
32

To isolate a dimer fraction, 3 mL of the hydrolyzed Cr(III) solution was added to
the Sephadex column. 0.5 M Ca(ClO4)2 was added to wash off the monomer in a
clearly visible blue band; a broad blue-greenish band of the dimer also moved down the
column at a slower rate. When the dimer band was about 1 cm from the bottom of the
column, 0.25 mL of La(ClO4)3 was added. This caused the dimer band to become more
narrow, yielding a small volume (~ 1 mL) of dimeric Cr(III) that was approximately 30
mM in dimeric species (60 mM in total Cr(III)). Once the dimer was isolated, the top 2
cm of Sephadex, which was deep green, was discarded and replaced with fresh resin
prior to column regeneration. Care must be used when handling salts of Th4+, which
are all naturally radioactive.
To isolate the trimer, we added 3 mL of hydrolyzed Cr(III) solution, followed by
1.0 M NaClO4 to quickly elute the monomer. Next, 0.5 M Ca(ClO4)2 was added to elute
the dimer as quickly as possible; by this method, the dimer fraction is less concentrated
and consequently discarded. A broad and faint green band of trimer was observed
bleeding from the Cr(III) sorbed to the top of the column. When the leading edge of this
band was about 1 cm from the end of the column, 0.25 mL of La(ClO4)3 was added to
narrow the band, yielding a 2 mL volume fraction of trimer that was 5 to 9 mM in trimeric
Cr(III) (15-27 mM total Cr(III)). As with the dimer separation, a deep green band
remained sorbed to the top of the column; this Cr(III)-ladened Sephadex was replaced
with fresh resin.
Tetrameric Cr(III) was isolated by first following the method used to isolate the
dimer, working as quickly as possible. After the dimer was completely eluted, about 5
mL of La(ClO4)3 was added to wash off any remaining trimer. With this approach, the
33

trimer band remained broad and poorly defined; it was discarded. To elute a tetrameric
fraction from the deep green Cr(III) band sorbed to the top of the column, 0.25 M
Th(ClO4)4 was added. This generated a band that was well defined, which we eluted in
a volume of 3 mL. The fraction was 30 mM in tetramer (120 mM in total Cr(III)). Even
with Th4+ as the exchanging cation, the top 2 cm of Sephadex remained green. This
material was replaced prior to column regeneration.
Isolated fractions of Cr(III) oligomers obtained by our method were later
characterized by a combination of techniques, including inductively coupled plasma -
atomic emission spectrometry (total Cr concentration), gamma spectrometry (51Cr
activity levels), capillary electrophoresis (distributions of Cr(III) species and purity of
Cr(III) fractions isolated by ion exchange chromatography), ultraviolet-visible
spectrophotometry (total Cr and Cr(III) speciation, data reported elsewhere [10]), and by
x-ray absorption spectroscopy (structural information and speciation, data reported
elsewhere [10]). For those Cr(III) fractions separated by ion exchange that were
subsequently analyzed by CE, reduction of the concentrations of simple cations used
for elution was necessary prior to CE injection. This was accomplished by treatment
with K2SO4. The sulfate salts CaSO4, La2(SO4)3 and Th(SO4)2 are all relatively insoluble
compared to the analogous perchlorate salts, and consequently precipitated from
solution in the presence of K2SO4. In addition, KClO4 also has a relatively low solubility
and co-precipitated with the sulfate salts. The Cr(III) oligomers were separated from the
precipitates by centrifugation.
34

Instrumentation
Total Cr concentrations were measured at 205.55 nm using a Jobin Yvon JY24
sequential inductively coupled plasma – atomic emission spectrometer equipped with a
pneumatic nebulizer. 51Cr activity levels were determined using a Packard Cobra II
Auto-gamma counter that utilized a NaI modified well detector. To count the 320.1 keV
γ line of 51Cr, energy windows were set between 290 – 400 keV. Samples were
counted for 60 minutes or until 1% RSD was achieved in the overall count rate,
whichever came first. Ultraviolet-visible spectrophotometry was completed using an
OLIS-modified Cary 14 spectrophotometer. We have reported electronic spectra and
molar absorptivities elsewhere [10]; in general, increasing oligomerization causes a red
shift in absorbance maxima for the Cr(III) species. All measurements were made at
room temperature in 1 cm quartz vials.
Capillary Electrophoresis
CE chromatograms were collected using a Dionex capillary electrophoresis
instrument employing ultraviolet detection, and a Dionex advanced computer interface;
Dionex software was used for collection of the raw chromatographic data. The capillary
was fused silica, 69 cm long with a 75 µm ID. Because Cr(III) itself does not have a
large molar absorptivity, we used an indirect method of detection, as reported by Chen
and Cassidy [22]. For this approach, a buffer consisting of 4 mM hydroxy-isobutyric
acid (HIBA, Aldrich) served as the electrolyte, and 4 mM N,N-dimethylbenzylamine
(DBA, Aldrich) served as the chromophore. The monochromator of the CE detector
was set to 214 nm (molar absorptivity of DBA at λ = 214 nm is 6.0 × 103 cm-1 ⋅ mol-1 ⋅ l).
35

To this solution matrix, 10,000 - 30,000 V were applied in positive mode to give
approximately 2 - 6 µA of current. The presence of DBA in the matrix gave a large,
constant absorbance at 214 nm, unless it was displaced at the point of detection by
other non-absorbing constituents such as Cr(III) species or other cations.
Consequently, these species were registered as a decrease in signal in the
electropherograms.
Data Analysis
The Dionex software output is time (in 1.0 s intervals) versus absorbance. Origin
6.0 was used for processing this data, and for peak analysis. The various peaks in the
electropherograms were assigned to species using a process of elimination, as
described in the Results and Discussion section. For the simple cations (e.g., Na+,
K+,Ca2+, La3+, and monomeric Cr3+), the order of elution is consistent with previous
reports [22].
In CE, the order of species elution is determined by overall species charge
density, which is the ratio of charge of a cation to its size including its solvation sphere.
In positive mode, the species with the greatest net cationic charge density is detected
first. Consequently, the retention time of a cation in the capillary is directly related to its
overall size and net positive charge. The hydrated radius (r) of a species can be
correlated to its electrophoretic mobility (µ) as follows:
(1) πηµ
=6
qr
36

where q is the charge of the species in C and η is the viscosity of the solution in kg ⋅ m-1
s-1. The electrophoretic mobility for a given species is defined as the difference
between its apparent mobility (µapp) and the mobility of the electroosmotic flow (µeo).
Both parameters are related to the length of the entire capillary (Lt), length of travel to
the detector (Ld), the applied voltage (V), and the retention time (tn), as follows:
(2) Cr
tdapp Vt
LL=µ and
EOF
tdeo Vt
LL=µ
where tCr is the retention time of a given Cr species and tEOF is the retention time of the
electroosmotic front. Thus, from the retention time for a given Cr(III) species in an
electropherogram, information about its overall size is obtained and information about
its shape can be inferred.
Results and Discussion
In previous work, we have shown that aging of Cr(III) species to form larger
oligomers is a dynamic process [10] that has not been studied in detail, and little is
known about reverse processes. Furthermore, information on the overall net charge
densities of these species in solution, and in the case of the trimer, the distribution of
this charge within the structure (i.e. overall shape), is limited. We developed ion
exchange and capillary electrophoresis methods to address these problems.
Ion Exchange
Separation Cr(III) oligomers using previously published methods is difficult. The
Dowex ion exchange method of Finholt, Thompson, and Connick [7,12,13], could not be
followed exactly because the amount of cross-linking for the resin used in their study
37

was no longer commercially available. Isolation of the Cr(III) dimer (which we verified
by its electronic transitions [10]), and a second band that was presumably the trimer
was accomplished using Dowex 50W-X4 resin. However, the trimer was so dilute that
the species could not be characterized by spectroscopic or other methods. Using the
Sephadex SP C-25 method reported by Stunzi et al. [15], isolation of dimeric and
trimeric Cr(III) was possible, but overall concentrations of these species were also quite
low. In addition, both ion exchange methods resulted in very low overall total Cr
recoveries from the columns; significant fractions of Cr remained sorbed to the resins at
the top of the column. Duplication of the size exclusion approach reported by Bradley et
al. [14] was also attempted. The packed column was prepared with Sephadex G-25
followed by a Sephadex G-10 column with a total length of 75 cm (1 cm ID). Blue
dextran was run through the column first to determine the void volume, and was
quantitatively recovered. Next, a solution of hydrolyzed Cr was passed through the
column, but unlike with the ion exchange columns no colored bands developed
suggesting little or no separation. Also, the Cr sorbed to the column, mostly on the top
half, and could not be eluted. When blue dextran was run through the same column
again, a large fraction of it was retained, apparently due to interaction with the sorbed
Cr(III).
Ion exchange is best suited for separation of the smaller oligomers in
macroscopic amounts. Despite limited success with published methods, they became
the basis for our development work. We developed individual approaches to isolate
each specific Cr(III) oligomer fraction as described in the Experimental Section; this was
necessary because of reactivity between Cr(III) and the ion exchange resin and
38

changes in Cr(III) oligomer speciation with time [23]. Each individual separation was
optimized to maximize the concentration of the given Cr(III) oligomer for later
characterization. Except where noted below, each of these methods leaves large
quantities of green Cr(III) sorbed to the top of the column. Visual inspection of the
various shades of green, blue, and blue-green bands that developed below the band of
green at the top of the column were used to monitor separation on the column itself.
Separation and Cr(III) speciation were also monitored by use of the 51Cr tracer. Purity
of the separated bands and changes in speciation in those fractions were monitored by
CE, as described in detail below.
Using 51Cr as a tracer and a gradient elution approach, a single procedure
method was developed to isolate cleanly resolved fractions of these species, as shown
in Figure 2. In Fig. 2A, the gradient is based on simply increasing cationic charge (e.g.,
Na+ to Ca2+ to La3+ to Th4+) similar to the individual separations described above, and
the chromatographic bands obtained are labeled. Note that although the fractions are
generally well separated, the total concentrations of oligomeric species in a given
fraction are not necessarily optimized as with the individual separations described in the
Experimental Section. In our initial work, a large amount of 51Cr activity remained on
the column upon completion of the separations (see Table 1). Even after washing the
column with an additional 5 mL of Th(ClO4)4, that removed ~ 12% of the Cr, followed by
5 mL of 2.0 M HCl, that removed another 12%, about 20% of the Cr remained
“irreversibly” sorbed to the resin.
One of the difficulties of working with Th(ClO4)4 as an eluant is the presence of
natural radioactive daughters, which increases the background counts and decreases
39

our ability to discriminate the chromatographic bands of 51Cr-labeled oligomers. To
avoid this, the Th4+ cation was replaced with Ce4+ by using a saturated solution of
(NH4)4Ce(SO4)4. Once the trimer band was eluted with La3+, a concentration gradient of
Ce4+ was used to remove the tetramer and other oligomers from the column. These are
labeled in Fig. 2B. Interestingly, this gave quantitative recovery of all of the Cr(III) from
the column, as shown in Table 1. The total volume required for complete elution was
large compared to the separation using Th4+ (Fig. 2A), and complete resolution of many
of the bands was not achieved. The separation was improved (Fig. 2C) by increasing
the volumes used for all the eluants, and a distinct tetramer fraction was isolated. This
fraction was followed by bands containing species that are likely larger than tetrameric.
However, these species could not be identified because the electronic spectra,
stoichiometry, and structures of such species are not defined.
Capillary Electrophoresis
In CE, separation is based on net charge density rather than simply cationic
charge so that the order of elution for a given set of species such as shown in Fig. 1 is
not always easily predictable a priori. To uniquely identify the species represented by
the various chromatographic bands in an electropherogram, a process of elimination
using the Cr(III) oligomer fractions we isolated by ion exchange was employed. Even
with efforts to remove or reduce the concentrations of eluant cations used in ion
exchange, these species are still present, each of which is also separated into distinct
bands in CE. The order of elution of the simple cations has been reported by others
[22], and similar results are shown in Figure 3A. This solution also contained
monomeric Cr(III), as indicated. Fig. 3B is an electropherogram of the dimer fraction
40

obtained by ion exchange. Note that two Cr(III) species are present. To uniquely
identify each, a spike of monomeric Cr(III) was added to the dimer solution, and the
resulting electropherogram is also shown. The peak area that increased was identified
as the monomer, and by default the other peak was identified as the dimer. Relative
retention times for the trimer and tetramer were obtained by injecting isolated fractions
of each species separately as shown in Figs. 3C and 3D. Absolute retention times for
each species in the different electropherograms cannot be directly compared due to
differing operating conditions, but the retention times relative to the EOF are
comparable and elution order for the species are always the same.
A typical electropherogram for the Cr(III) species present in a hydrolyzed solution
which had not been separated by ion exchange is shown in Figure 4. Because no prior
separation was attempted with this solution, no other metal cations are present except
for K+ from the base. The smaller Cr(III) oligomers that we could uniquely identify are
marked; in addition, other Cr(III) species of higher net charge density are present but
cannot be uniquely identified. These species are clearly important, and ideally should
be considered in Cr(III) speciation and solubility work. Unfortunately, lack of
stoichiometric and structural information on these species limits their consideration. CE
can also be used to check the purity of the Cr(III) oligomers isolated by ion exchange.
Although spectrophotometric and radiometric data indicates that complete peak
resolution was achieved by our ion exchange methods (e.g., Fig. 2C),
electropherograms of each fraction collected as soon as possible (~ 24 h) after
separation indicates that other Cr(III) species are present. For example, an
electropherogram of the dimer solution after ion exchange separation showed that
41

monomer was present (e.g., Fig. 3B). Similarly, the tetrameric fraction always indicated
traces of dimer. The smaller Cr(III) species must be the result of dissociation of the
larger oligomers with time, consistent with LaChatlier’s principle of equilibrium.
For those Cr(III) species that can be uniquely identify in the electrophrograms,
some structural information can be inferred. For example, using formulas (1) and (2),
we can calculate the size of the Cr(III) monomer from its retention time in CE, and
estimate its hydrated radius to be about 4.69Å. This is somewhat large compared to
4.08 Å estimated by extended x-ray absorption fine structure (EXAFS) analysis of the
Cr(III) monomer in aqueous solution [24]. The EXAFS results include a second shell of
water molecules, suggesting an extended hydrated radius, but no interactions beyond
the second shell of water molecules could be observed. Note that tertiary hydration
shells are believed to exist for the trivalent lanthanide cations in aqueous solutions
[e.g.,25], which would increase the apparent size of the Cr(III) monomer; however, the
possibility of interaction between the Cr(III) monomer and the HIBA electrolyte as
reported for other metal cations cannot be excluded [21]. In addition, although others
have not been able to exclude the possibility of linear configurations for the larger Cr(III)
oligomers (especially for the trimer [7]), the order of elution we observe in CE suggests
that these species do not exist to any significant extent. As shown in Table 2, the
EXAFS information is used to estimate volumes and charge densities for the various
species shown in Fig. 1. Details on these calculations are given in the Supplemental
Information accompanying this paper. For the linear species, the estimated cationic
charge densities decrease with increasing oligomerization, which suggests that the
elution order should be monomer, followed by dimer, followed by trimer, followed by
42

tetramer. However, the tetramer and trimer elute before the monomer and dimer. This
demonstrates that the trimeric and tetrameric species have larger net charge densities
than the monomeric and dimeric species; such charge densities are not likely for the
linear configurations. Therefore, the trimer and tetramer likely exist as the non-linear
conformers shown in Fig. 1C and 1E, respectively. This is consistent with the work of
Stunzi et al. [9], who used pKa measurements for the µ-hydroxo protons to indirectly
support the predominance of the non-linear Cr(III) trimer.
Conclusions
We have shown that specific oligomers of Cr(III) can be isolated in concentrated
fractions by ion exchange using solutions of simple cations of increasing positive charge
as eluants. With sufficient diligence, separation of hydrolyzed species of other charged
metal cations such as Fe(III), Al(III) and Pu(IV) should also be possible, and ion
exchange provides sufficient volumes and concentrations for other subsequent
analyses, such as spectroscopic characterization. CE using indirect detection affords
simpler, microscale separations, but unique characterization of the isolated species
requires additional work. Whereas we used a process of elimination based on our ion
exchange work, other approaches could include coupling CE with mass spectrometry,
as demonstrated by others [26, 27, 28, 29]. The chromatographic separations we
described herein are necessary for improving modeling calculations in solution
speciation and solubility studies for the higher metal valence cations, and for studying
the rates and mechanisms by which metal cations hydrolyze, nucleate, and eventually
precipitate. In addition, our results demonstrate that the reverse processes (e.g.,
dissociation of larger Cr(III) oligomers into smaller Cr(III) species) are also possible, and
43

provide pathways for ingrowth of smaller oligomers. Study of these processes has been
inhibited by lack of analytical tools, such as effective methods to separate and identify
the important species that are present. Although our chromatographic separations
reported herein will aid in these studies, additional spectroscopic work is necessary to
determine the structures of the higher Cr(III) oligomers.
Acknowledgements
This work was supported by the U.S. Department of Energy’s Environmental
Management Sciences Program. JIF, BR, and SBC acknowledge contract number
FG07-98ER14930 at Washington State University; ZZ and LR acknowledge the support
of the Assistant Secretary for Environmental Management under contract number DE-
AC03-76SF0098 at Lawrence Berkeley National Laboratory; DR acknowledges contract
number DE-AC06-76RL01830 at Pacific Northwest National Laboratory. In addition, we
gratefully acknowledge Ms. Susan Bentjen (WSU) for assistance with the ICP-AES
analyses and the preparation of this manuscript, and Prof. Herbert H. Hill (WSU) for
many helpful discussions on chromatography.
Literature Cited
1 Nuclear Facility Decommissioning and Site Remedial Actions: A Selected Bibliography, Vol. 18 Part 2 Indexes Report ES/ER/TM---227/Pt.2, Oak Ridge National Laboratory: Oak Ridge, TN, 1997, 418 p.
2 Nuclear Facility Decommissioning and Site Remedial Actions. A Selected Bibliography, Volume 18, Part 1A: Citations with abstracts, sections 1 through 9 Report ES/ER/TM---227/Pt.1A, Oak Ridge National Laboratory: Oak Ridge, TN, 1997, 447 p.
44

3 Rapko, B. M.; Oxidative Alkaline Dissolution of Chromium from Hanford Tank Sludges: Results of FY 98 Studies, Report PNNL-11908, Pacific Northwest National Laboratory: Richland, WA, 1998.
4 Cotton, F. A.; Wilkinson, G.; Murillo, C. A.; Bochman, M. Advanced Inorganic Chemistry, 6th ed.; John Wiley & Sons: New York, NY, 1999, p.776.
5 Neu, M.; Runde, W. Plutonium Speciation, Solubilization, and Migration in Soils, Report LA-UR-99-3084, Los Alamos National Laboratory: Los Alamos, NM, 1999, 10 p.
6 Rai, D.; Hess, N. J.; Rao, L.; Zhang, Z.; Felmy, A. R.; Moore, D. A.; Clark, S. B.; Lumetta, G. J. Journal of Solution Chemistry accepted.
7 Finholt, J. E.; Thompson, M. E.; Connick, R. E. Inorganic Chemistry 1981, 20, 4151.
8 Stunzi, H.; Spiccia, L.; Rotzinger, F. P.; Marty, W. Inorganic Chemistry 1989, 28, 66.
9 Stunzi, H.; Marty, W. Inorganic Chemistry 1983, 22, 2145. 10 Rao, L.; Zhang, Z.; Friese, J. I.; Ritherdon, B.; Clark, S. B.; Hesss, N. J.; Rai, D.
Journal of the Chemical Society - Dalton Transactions 2002 267-274. 11 Drljaca, A.; Hardie, M. J.; Raston, C. L.; Spiccia, L. Chem. Eur. J. 1999, 5, 2295. 12 Thompson, G. Hydrolytic Polymerization in Cr(III) Solutions, Ph.D.. Thesis,
University of California at Berkeley, 1964. 13 Thompson, M. E.; Connick, R. E. Inorganic Chemistry 1981, 20, 2279. 14 Bradley, S. M.; Lehr, C. R.; Kydd, R. A. J. Chem. Soc. Dalton Trans. 1993, 15,
2415. 15 Stunzi, H.; Rotzinger, F. P.; Marty, W. Inorganic Chemistry 1984, 23, 2160. 16 Rotzinger, F. P.; Stunzi, H.; Marty, W. Inorganic Chemistry 1986, 25, 489. 17 Guzman, N. A. (ed.) Capillary Electrophoresis Technology; Marcel Dekker: New
York, NY, 1993. 18 Pacakova, V.; Coufal, P.; Stulik, K. Journal of Chromatography A 1999, 834, 257. 19 Timerbaev, A. R.; Shpigum, O. A. Electrophoresis 2000, 21, 4179. 20 Timerbaev, A. R. Talanta 2000, 52, 573. 21 Vogt, C.; Klunder, G. L. Fresenius Journal of Analytical Chemistry 2001, 370, 316. 22 Chen, M.; Cassidy, R. M. Journal of Chromatography A 1993, 640, 425. 23 Spiccia, L.; Marty, W. Inorganic Chemistry 1986, 25, 266. 24 Lindquist-Reis, P.; Munoz-Paez, A.; Diaz-Moreno, S.; Pattanaik, S.; Persson, I.;
Sandstrom, M. Inorganic Chemistry 1998, 37, 6675.
45

25 Choppin, G. R. Journal of Alloys and Compounds 1995, 223, 174. 26 Corr, J. J.; Anacleto, J. F. Analytical Chemistry 1996, 68, 2155. 27 Olesik, J. W.; Kinzer, J. A.; Grunwald, E. J.; Thaxton, K. K.; Olesik, S. V.
Spectrochimica Acta Part B - Atomic Spectroscopy 1998, 53, 239=251. 28 Majidi, V. Microchemical Journal 2000, 66, 3. 29 Deng, B. Y.; Chan, W. T. Electrophoresis 2001, 22, 2186.
46

Table 1. Recovery of Cr(III) from the ion exchange columns after completion of the separations shown in Figure 2. Mole
fractions of Cr(III) are determined from the amount of 51Cr activity either eluted in the wash solutions or remaining on the column.
Chromatogram First Wash
Solution Mole Fraction of Cr(III) Removed in First Wash
Second Wash
Solution
Mole Fraction of Cr(III) Removed in
Second Wash
Mole Fraction of Cr(III) Remaining
on Resin Figure 2A 5.0 mL,
0.25 M Th(ClO4)4
0.121 ± 0.004 5.0 mL, 2.0 M HCl
0.122 ± 0.004 0.199 ± 0.002, 21.0 mL of resin
Figure 2B 5.0 mL, 2.0 M H(ClO4)4
(7.42 ± 0.34) × 10-3 5.0 mL, 2.0 M
H(ClO4)4
(0.710 ± 0.91) × 10-3 (2.70 ± 0.41) × 10-3,31 mL of resin
Figure 2C 5.0 mL, 2.0 M H(ClO4)4
(1.33 ± 0.51) × 10-3 5.0 mL, 2.0 M
H(ClO4)4
(0.646 ± 0.95) × 10-3 (6.24 ± 0.31) × 10-3,24 mL of resin
47

Table 2: Estimated volumes and charge densities for the various Cr(III) species shown
in Figure 1. Details on the calculations used to obtain the volume estimates are provided in the Supplementary Information accompanying this paper. The charge densities are obtained by dividing the charge of the species by its estimated volume.
Linear Species Non-Linear Species
V (Å3) Charge Density V (Å3) Charge Density
Monomer 284.5
0.0105
Dimer 469.9
0.00851
Trimer 655.3
0.00763 559.5 0.00894
Tetramer 840.8
0.00714 649.1 0.00924
48
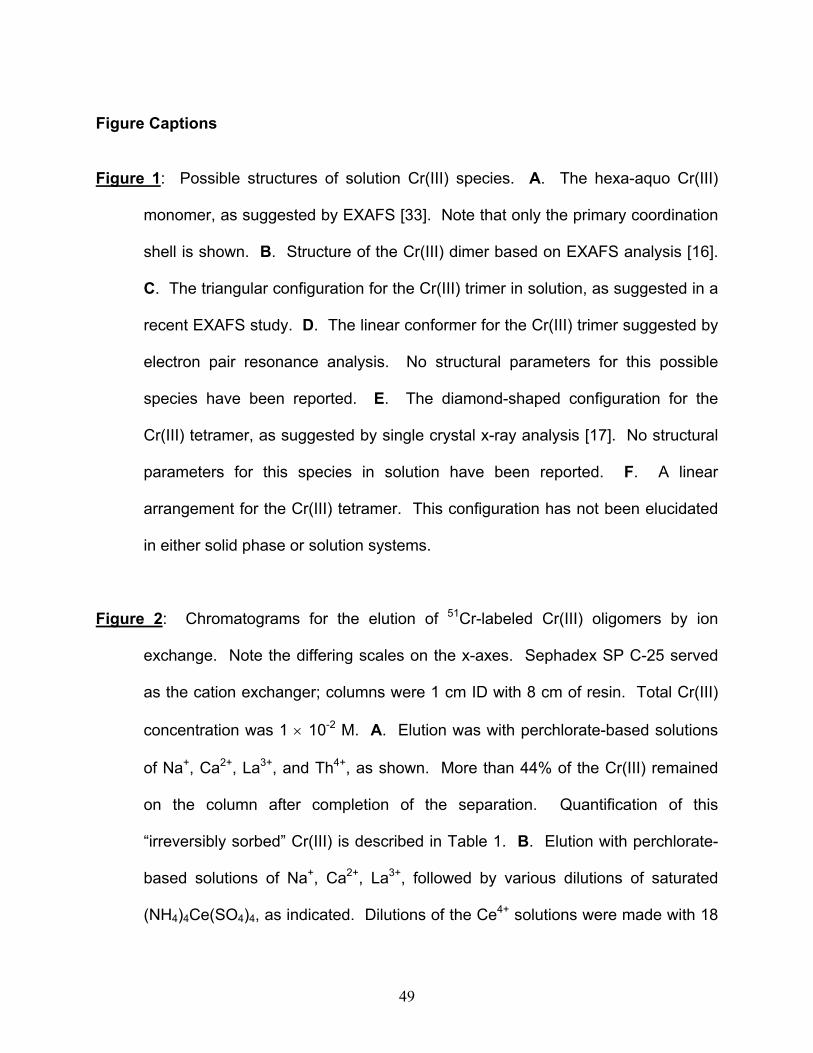
Figure Captions
Figure 1: Possible structures of solution Cr(III) species. A. The hexa-aquo Cr(III)
monomer, as suggested by EXAFS [33]. Note that only the primary coordination
shell is shown. B. Structure of the Cr(III) dimer based on EXAFS analysis [16].
C. The triangular configuration for the Cr(III) trimer in solution, as suggested in a
recent EXAFS study. D. The linear conformer for the Cr(III) trimer suggested by
electron pair resonance analysis. No structural parameters for this possible
species have been reported. E. The diamond-shaped configuration for the
Cr(III) tetramer, as suggested by single crystal x-ray analysis [17]. No structural
parameters for this species in solution have been reported. F. A linear
arrangement for the Cr(III) tetramer. This configuration has not been elucidated
in either solid phase or solution systems.
Figure 2: Chromatograms for the elution of 51Cr-labeled Cr(III) oligomers by ion
exchange. Note the differing scales on the x-axes. Sephadex SP C-25 served
as the cation exchanger; columns were 1 cm ID with 8 cm of resin. Total Cr(III)
concentration was 1 × 10⁻² M. A. Elution was with perchlorate-based solutions
of Na+, Ca2+, La3+, and Th4+, as shown. More than 44% of the Cr(III) remained
on the column after completion of the separation. Quantification of this
“irreversibly sorbed” Cr(III) is described in Table 1. B. Elution with perchlorate-
based solutions of Na+, Ca2+, La3+, followed by various dilutions of saturated
(NH4)4Ce(SO4)4, as indicated. Dilutions of the Ce4+ solutions were made with 18
49

MΩ H2O. Upon completion of the separation, approximately 2% of the Cr(III)
remained on the column (Table 1). Two 5.0 mL washes with perchloric acid
removed most of the sorbed Cr(III), as shown in Table 1. C. A second
chromatogram obtained by elution with perchlorate based solutions of Na+, Ca2+,
La3+, followed by various dilutions of saturated (NH4)4Ce(SO4)4 as indicated.
Larger volumes of eluants were used to improve resolution between the bands of
Cr(III) oligomers, compared to Figure 2B. This approach left very little Cr(III) on
the column (see Table 1).
Figure 3: Electropherograms obtained by completing capillary electrophoresis using
indirect detection on the Cr(III) oligomer fractions separated by ion exchange.
The buffer used was hydroxy-isobutyric acid/dimethylbenzylamine (HIBA/DBA),
as described in the Experimental section. A. CE analysis of a solution
containing the simple cations used as eluants and the Cr(III) monomer. The
concentration of ions present is approximately 1 × 10⁻⁴ M. Voltage was 30,000 V.
B. Electropherogram for the dimer fraction. The solid line is for the dimer
fraction obtained by ion exchange. The dashed line is the same solution to which
a spike of monomeric Cr(III) was added. Voltage was 20,000 V. C. CE analysis
of the trimer fraction using 20,000 V. D. CE separation of the tetrameric Cr(III)
fraction at 20,000 V.
Figure 4: Electropherogram for a hydrolyzed solution of Cr(III). This solution had not
been subjected to ion exchange. The bands for the Cr(III) species are labeled.
50

[Cr(III)]total = 5.0 × 10⁻³ M, HIBA/DBA buffer, total column length was 22 cm,
voltage was 30,000 V.
51

CrH2O
H2OHO
OH
OH2
OH2
CrOH2
OH2
OH2
OH2
CrH2O
H2O OH2
OH2
OH2
OH2
CrH2O
H2OHO
OH
OH2
CrOH2
OH2
OH2
CrH2O OH2
OH2
OHHOCr
H2O
H2OHO
OH
OH2
OH2
Cr
HO
OH
OH2
OH2
CrOH2
OH2
OH2
OH2
CrH2O
H2O
OH
HO
CrOH2
OH2
OH
CrH2O OH2
OH2
OHHO
CrH2O OH2
OH2
OH
3+ 4+
5+
5+
6+
A B
C D
E
CrH2O
H2OHO
OH
OH2
OH2
Cr
HO
OH
OH2
OH2
Cr
HO
OH
OH2
OH2
6+F
CrOH2
OH2
OH2
OH2
Monomer Dimer
TrimerTrimer
TetramerTetramer
Figure 1
2.98Å 1.95Å 1.97Å
2.98Å 1.94Å
2.98Å 2.98Å
52

14 16 18 20 22 24 26 28 30 32 340
4000
8000
12000
16000 A
Tetra
mer
Trim
er
Dim
er
Mon
omer
Th4+La3+Ca2+
Na+
5 10 15 20 25 30 35 40 45 50 55 60 65 70 750
5000
10000
15000
BHigher Oligomers
Tetra
merTr
imer
Dim
er
Mon
omer
1:51:101:501:100La3+Ca2+Na+
Activ
ity p
er m
L (c
pm/m
L)
10 20 30 40 50 60 70 80 90 100 110 120 130 140 150 160 1700
1250
2500
3750
5000
CHigher Oligomers
Tetra
mer
Trim
er
Dim
er
Mon
omer
Sat. Ce4+1:21:51:101:50
wat
erLa3+Ca2+Na+
Volume Eluted (mL)
Figure 2
53

54
10 11 12 13 14 15 16 17 18 19
D Tetramer
Ca2+
Na+La3+ Dimer
Time (Minutes)
C La3+
Trimer
B Ca2+
Na+
DimerLa3+
Monomer
Rel
ativ
e Ab
sorb
ance
5 6 7 8 9 10 11
-0.004
0.000
ALa3+MonomerNa+
Ca2+K+
Figure 3

55
2 3 4 5 6
-0.018
-0.012
-0.006
0.000
Cr(III)Species
K+
Monomer
Dimer
Abso
rban
ce
Time (Minutes)
2.8 3.0 3.2 3.4
-0.006
-0.004
-0.002
0.000
High
er O
ligom
ers
Trimer
Time (Minutes)
Figure 4

Chapter 3
Kinetics and Mechanism of the Oxidation of Chromium(III) Oligomers by Peroxydisulfate Under Alkaline Conditions J.I. Friese1, B. Ritherdon1, S.B. Clark1, Z. Zhang2, L. Rao2, D. Rai3 1Washington State University, Department of Chemistry, P.O. Box 644630, Pullman, WA 99164-
4630 2Lawrence Berkeley National Laboratory, Chemical Sciences Division, Berkeley, CA 94720 3Pacific Northwest National Laboratory, Richland, WA 99352
Abstract:
The oxidation of oligomeric mixtures of Cr(III) as well as monomeric,
dimeric, trimeric, tetrameric Cr(III) by peroxydisulfate proceeds by two pathways.
The faster pathway involves the oxidation by a thermal degradation product of
peroxydisulfate. It slows significantly as base concentrations increase such that
it is not significant at high base concentrations. In the second pathway, the
oxidation of chromium(III) occurs through the formation of an intermediate
species with peroxydisulfate prior to oxidation to Cr(VI). The formation of the
intermediate species does not involve electron transfer but rather ligand
exchange with hydroxide. Kinetic studies were conducted over a temperature
range from 5.5 to 41.0 oC. The activation parameters are: ∆H* = 60.65 ± 7.88
kJ/mol and ∆S* = -18.8 ± 2.4 J/mol⋅K for the formation of the intermediate
species; ∆H* = 26.31 ± 0.68 kJ/mol and ∆S* = -143.9 ± 3.7 J/mol⋅K for the
subsequent oxidation.
56

Introduction
The hydrolysis of trivalent chromium has been of interest to inorganic and
solution chemists for many decades. More recently, the oxidation of
chromium(III) to the more soluble chromium(VI) anion has gained attention as a
method for removing Cr(III) from high level radioactive waste generated during
the processing of defense related nuclear materials [1]. Non-mechanistic studies
of dissolution and oxidation of hydrolyzed Cr(III) using many oxidants have been
reported, which include hydrogen peroxide [2,3,4], Ce(IV)[5], bromate [6,7],
permanganate[6,8,9,10], peroxynitrite [11], ferrate [12], and periodate [13,14].
Detailed mechanistic studies of oxidation have been limited in part due to the
complex nature of Cr(III) speciation.
Cr(III) can hydrolyze to form many different species of varying ionic charge
in near-neutral to highly basic matrices [15]. Furthermore, the speciation of the
hydrolyzed Cr(III) is dynamic and changes with time [16]. However, the lifetimes
of the species are sufficiently long to allow isolation and further study [16,17].
We and others have used chromatographic techniques to isolate specific Cr(III)
oligomers [16,17,18,19]. Kinetic studies with isolated Cr(III) oligomers simplifies
the oxidation reactions and provides the opportunity to extract mechanistic
information that cannot be obtained by study of a mixture of species alone (e.g.
19).
Figure 1 (A-D) indicates oligomeric forms of cationic Cr(III) that have been
separated and structurally identified [16,17,18,19]; and Figure 1 (E-H) are the
anionic species postulated to exist in alkaline systems. Using hydrogen
57

peroxide, we have studied the oxidation of these species and observed that the
rate of oxidation is dependent on Cr(III) speciation [19]. However, hydrogen
peroxide is not stable in alkaline conditions, which may limit its usefulness.
Peroxydisulfate, more commonly known as persulfate, is a powerful
oxidant that is stable under alkaline conditions [20]. It has been proposed as a
potential oxidant for oxidative dissolution of Cr(III) in high level radioactive waste
systems [1]. For this reason, we have studied the kinetics and mechanism of the
oxidation of the individual monomer, dimer, trimer, and tetramer Cr(III) species
with peroxydisulfate under alkaline conditions ranging from 0.01M to 0.1M NaOH.
In addition, we report results on the kinetics of oxidation of unseparated Cr(III)
with peroxydisulfate under highly alkaline conditions (e.g., 1.0M and 5.0M
NaOH).
Experimental Section
Materials. Potassium persulfate (Merck, NJ), sodium persulfate (Alfa
Aesar, MA) and sodium hydroxide (T.J. Baker, NJ) were used as received, and
the solutions were made using carbonate free 18MΩ water. Sodium perchlorate
(Acros, NJ) was recrystallized three times from water. Cr(III) oligomers were
synthesized from chromium(III) perchlorate (Aldrich) using methods previously
published [16]. Sodium peroxydisulfate is an order of magnitude more soluble
than potassium peroxydisulfate. For this reason, the sodium peroxydisulfate salt
was used for most of the experiments. Oxidation is not affected by which cation
is used.
58

Instrumentation. A modernized Olis Cary-14 spectrophotometer and an
Olis U.S.A. stopped-flow attachment with a 2.0 cm cell was used for collecting
most kinetic data. Optical spectra and some kinetic data were obtained using an
Ocean Optics Chem2000 spectrophotometer with a 1.0cm quartz cell. With
either instrument, we monitored chromate growth at 373 nm (ε~5000 M-1cm-1,
and is dependent on NaOH concentration). With the Olis system, absorbance
changes were observed at a single wavelength, whereas with the Ocean Optics
instrument the entire UV-Visible spectrum (200-850 nm) was monitored. Blank
kinetic runs were obtained under each condition with either the Cr(III) species or
peroxydisulfate omitted. Both Cr(III) and peroxydisulfate were needed to
produce an absorbance change at 373 nm.
Computation. Kinetic curves were fitted with the nonlinear least-
squares routine in Microcal Origin 6.0 software. Each reported rate constant is
the average of at least three values from replicate kinetic runs, which were
generally reproducible within 5%. The flooding method [21] was used with
respect to peroxydisulfate for all kinetic runs. The dependence of the pseudo-
first-order rate constants on peroxydisulfate concentration was used to derive the
rate law. All reported errors are 1σ unless otherwise noted.
Methods. The isolation of the individual Cr(III) species by ion exchange
is presented elsewhere.16 Typically, experimental kinetic runs involved rapidly
mixing equal volumes of (1) NaOH/Na2S2O8/NaClO4, and (2) Cr(III)
species/NaClO4. Upon mixing, species in solution were diluted by 50% except
for sodium perchlorate. Unless noted otherwise, the ionic strength was
59

maintained with sodium perchlorate at 3.0M under all conditions. Temperature
was controlled between 5.0oC and 45oC with a circulating water bath to ±0.1oC
when using the Olis Cary instrument. Experiments conducted with the Ocean
Optics instrument were completed at room temperature.
Variables explored in the rate of oxidation include Cr(III) species (e.g.
monomer, dimer, trimer, tetramer), Cr(III) species concentrations, peroxydisulfate
concentration, base concentration, and temperature. During oxidation reactions,
Cr(V) was never detected by EPR or spectrophotometric methods under any
experimental conditions. Since the molar extinction coefficient of Cr(III) in the
wavelength region of 300 – 450 nm is very small (~ 15-30 cm-1M-1) and the initial
concentration of Cr(III) in our experiments is low (~10µM), it is not feasible to
follow the decrease in [Cr(III)] spectrophotometrically. Under alkaline conditions,
acid catalyzed degradation of peroxydisulfate is negligible; however, thermal
degradation to form sulfate radical, hydroxyl radical, and molecular oxygen
occurs. The kinetics and mechanism of this process have been studied by
Kolthoff from 0.1M base to very acidic conditions [20]. In our work, EPR
experiments did not detect measurable amounts of sulfate radical in 1.0M
peroxydisulfate solution at 0.1M base at 77K or room temperature.
Results
Separated Cr(III): The separation of Cr(III) oligomers was completed under
acidic conditions, and then introduced into alkaline systems. The stability of the
Cr(III) oligomers in base is important for the kinetic experiments. Over the
course of the kinetic experiment further oligomerization may occur, which will
60

change the species present. The stability of the individual oligomers in base was
tested by rapidly mixing a given Cr(III) species with NaOH in the absence of
peroxydisulfate. After waiting at least 2 half-lives of the oxidation reaction in the
presence of peroxydisulfate (approx. 1.5 to 2 hours), peroxydisulfate was added
and the rate of the reaction was observed. By comparing these observed rate
constants with the observed rate constants when peroxydisulfate was added
immediately, the stability of the separated Cr(III) species in base was probed.
On these timescales, isolated monomer, trimer and tetramer in base underwent
significant oligomerization at [NaOH] ≥ 0.1M; interestingly, the dimer did not
change to any significant extent unless base concentrations exceeded 2.0M.
When the isolated species were immediately oxidized by peroxydisulfate,
two types of kinetic curves were observed. Figure 2A indicates that multiple first
order processes occurred when base concentrations were low(≤ 0.1M) and could
be described with equation 1 below. Figure 2B shows a kinetic trace obtained
under high base concentrations (≥1.0M), which can be described with a single
first-order exponential expression as shown in equation 2.
(1) ))((2
))((10372
21 tktknm
obsobs eAeAyAbs −− ++=
(2) ( )( )tknm
obsAeyAbs −+= 0372
Using this analysis for the kinetic traces of the separated Cr(III) oligomers at
different peroxydisulfate concentrations ([OH-]=0.1M), Figure 3 was obtained by
fitting the traces to equation 1. Under these conditions, both observed rate
constants give a linear relationship to peroxydisulfate with a zero intercept. If the
base concentration is lowered one order of magnitude from 0.1M to 0.01M
61

NaOH, the linear dependence of k1obs is unchanged, whereas the relationship of
k2obs with peroxydisulfate becomes nonlinear (Figure 4). The k2obs values plateau
at high peroxydisulfate concentrations, indicating a saturation effect. This
demonstrates that at high peroxydisulfate concentrations, the rate constant no
longer increases. A scheme that accounts for these observations is:
(3) −+→−+ OHVICrOHIIICrOX rk )()(
where OX is an electron acceptor other than peroxydisulfate that may be a
thermal degradation radical from peroxydisulfate.
(4) −− +→←−+−
OHIOHIIICrOSk
k
1
1)(282
(5) −+→ 242)(2 SOVCrI k
Using this scheme, reaction 3 gives the initial fast formation of Cr(VI)
described by k1obs. Plotting k1obs versus peroxydisulfate concentrations yields a
linear relationship with a slope of kr (Figure 3A). Typically electron transfer from
Cr(IV) to Cr(V) is assumed to be the rate determining step due to the subsequent
change in coordination number and geometry that is required [22]. Step 5 is
shown as a two-electron transfer; however, this may be an oversimplification.
Reaction 5 may involve two one-electron transfers, with Cr(IV) oxidation to Cr(V)
being slow. From our observations, we cannot distinguish between these two
options. According to the above scheme using steps 4 and 5, the observed rate
constant should have the following relationship with peroxydisulfate, if a steady
state approximation is used where d[I]/dt = 0:
(6) ][
][2
82
2822
2 −
−
+=
OSkOSk
kc
obs where 1
21 ][k
kOHkkc+
=−
−
62

Figure 4 shows kobs versus peroxydisulfate concentration that is
adequately described by equation 6. This provides two constants, k2 and the
combined rate constant, kc, which are dependent on each other.
The dimer was oxidized at different base concentrations at room
temperature. The kinetic curves for this data were fit to a single exponential
equation 2 indicating that the fast reaction 3 does not happen to an appreciable
extent at lower temperatures. The observed rate constant dependence on
peroxydisulfate was fit to equation 6 (data not shown). A plot of the combined
rate constant (kc) vs [OH-] suggests a slope of k-1/k1 (which is equivalent to 1/Keq)
and a y-intercept of k2/k1, as shown in Figure 5. Note that kc is dependent on
[OH-], whereas k2 is independent of OH-, as defined by equation 6.
The dependence of the observed rate constant, k2obs, on peroxydisulfate is
linear (Figure 3) and becomes saturated when NaOH is low (Figure 4). By using
the proposed scheme, one would expect that at higher base concentrations the
value of kc gets larger and this trend is shown in Figure 5. When kc>>[S2O82-],
then equation 6 from the proposed scheme becomes equation 7, which is linear
with a slope of k2/kc and a zero intercept.
(7) ][ 282
22
−= OSkk
kc
obs
Equation 7 is valid for the separated oligomers when base concentrations are
about 0.1M (see Table 1).
The resolved rate constants in Table 1 are derived from this kinetic
scheme by fitting the peroxydisulfate dependence on the pseudo-first-order rate
constants to a linear expression or equations 6 and 7. A complete data set of the
63

raw observed rate constants is available in the Supporting Information
accompanying this paper.
Unseparated Cr(III): Unseparated Cr(III) solutions allow for the use of base
concentrations higher than 0.5M and are more representative of the radioactive
waste systems where Cr(III) will be removed by oxidative dissolution. Except for
the dimer, the separated Cr(III) oligomers will further hydrolyze and polymerize
under these base concentrations within the time scale of the reactions (~2
hours). Using unseparated Cr(III) that had not aged more than several hours,
kinetic data was obtained at 1.0M and 5.0M base. Figure 6 shows a saturation
effect at 1.0 M base; conversely Figure 7 is a linear relationship at 5.0M base. At
21.6oC and 5.0M base, the range of peroxydisulfate concentrations was
extended to 1.0M S2O82-, which remained linear. It should be noted that at both
1.0M and 5.0M base concentrations, the kinetic curves can be described using a
single exponential equation. Much like the separated oligomers, the fast reaction
(3) is not important as the base concentrations are increased. The kinetic data
from the unseparated Cr(III) was analyzed using the same method as that
obtained using separated Cr(III) species. The resolved rate constants are
presented in Table 2.
One would expect an elementary kinetic step to obey the Arrhenius
equation:
(8)
−
= RTEa
Aek
Using the temperature data from Figures 6 and 7, the activation energy (Ea) was
obtained, as shown in Figure 8 and Table 3. The Arrhenius plot for k2 is well
64

behaved, whereas the plot for the temperature dependence of kc is not linear.
This was expected since kc is not an elementary kinetic step, but rather a
combination of several processes. The Arrhenius plot for the 5.0M base data is
shown in Figure 9 and activation parameters are presented in Table 3. From the
activation energies, we can estimate the activation enthalpies and entropies
according to equations 9 and 10, where R is the gas constant, h is Plank’s
constant, and kb is Boltzman’s constant.
(9) RTEH a −=∆ *
(10)
=∆
TkeAhRSb
ln*
These values are also reported in Table 3.
Discussion
Reaction 3 has several important properties. The extent of oxidation that
happens via this pathway is dependent on the concentration of peroxydisulfate.
Secondly, it is dependent on hydroxide concentration. The pathway slows
dramatically as hydroxide increases such that this pathway is unimportant under
highly alkaline conditions. A possible explanation of this observation is that
hydroxide is coordinated directly to the Cr(III) as shown in reaction 3, and must
be displaced by the oxidant for electron transfer to occur by this pathway. As
base concentrations increase this becomes less likely, resulting in oxidation
primarily by the second pathway represented by reactions 4 and 5.
The saturation effect in Figure 4 is indicative of an intermediate species.
The rate of oxidation of Cr(III) does not increase linearly as peroxydisulfate is
65

increased. The nature of the intermediate species is of interest, but unfortunately
analytical techniques to probe it are limited. Cr(V) could not be detected
indicating that it is most likely a very short-lived intermediate species. The Cr(III)
species and base dependence on the rate give some insight into the mechanism.
Because the rate of reaction slows with the increase of base, and the rate is
determined by reaction 5, where:
(11) ][)(2 Ik
dtVIdCr
=
and the value of k2[I] decreases.
Figure 5 indicates that the value of k2 is independent of base
concentration; thus, [I] must decrease as base concentration increases. For this
to be the case, reaction 4 must have a base dependence similar to reaction 3. It
is likely that the intermediate species must lose a hydroxide ligand. Whether or
not peroxydisulfate complexes directly to Cr(III) cannot be determined by the
data presented here; however, if OH- is displaced, complexation maintains the
six coordinate nature of Cr(III).
Reaction 4 most likely does not involve electron transfer. As shown in
Figure 7, the finite non-zero intercept indicates that at 5.0M base, the rate
determining step is no longer defined by reaction 5, where reaction 4 is a pre-
equilibrium step. At 5.0M base, the reaction 4 pathway no longer satisfies the
pre-equilibrium situation. Under pseudo-first-order conditions with respect to
peroxydisulfate, reaction 4 would be the rate determining step yielding a
dependence on peroxydisulfate described by:
(12) 12
821 ][ −− += kOSkkobs
66

Figure 7 shows that reaction 4 is reversible and most likely involves ligand
exchange. Electron transfer between Cr(III) and Cr(IV) is known to be reversible
and fast relative to Cr(IV) oxidation to Cr(V). It is important to note that at low
Cr(III) concentrations and high oxidant levels, Cr(IV) reduction to Cr(III) should be
negligible.
Each of the Cr(III) species show different values for kc (Table 1), which
indicates that the equilibrium in reaction 4 is a function of Cr(III) speciation. If it
were an equilibrium in which the transfer of one electron occurs, it should be
independent of Cr(III) species. It is unlikely that reaction 4 involves the breaking
of µ-hydroxo bonds in the oligomers, as severing them would make the reaction
irreversible. The charge differences of the species in Figure 1 would likely affect
the ligand exchange reaction based on electrostatic effects.
The activation parameters in Table 3 obtained from the unseparated Cr(III)
systems may also shed light upon the nature of the transition states between
reactions 4 and 5. In reaction 5, the large negative ∆S* value is consistent with a
change in coordination number from the rate determining step of Cr(IV) to Cr(V).
For reaction 4, the formation of an intermediate by coordination of the
peroxydisulfate to the Cr(III) species is a more ordered system than the original
system represented by the reactants. Because reaction 3 was not significant at
high base, no activation parameters were obtained.
The slope of the line in Figure 5 as indicated by equation 6 gives a hint of
the pre-equilibrium step, reaction 4. The intercept of this line should be k2/k1.
Figure 5 shows a zero intercept within experimental error. The value of k2/k1 is
67

expected to be small because k2 is small and k1 is large, making the ratio very
small. This value cannot be distinguished from zero from the experimental data
in Figure 5.
The overall rate of oxidation with peroxydisulfate is slower than that of
hydrogen peroxide and has a different mechanism of oxidation19. However, the
trends in reactivity for peroxydisulfate and hydrogen peroxide oxidation of Cr(III)
species are similar; the rate of oxidation slows with increased oligomerization of
Cr(III).
Acknowledgments: This work was supported by the U.S. Department of
Energy’s Environmental Management Sciences Program. JIF, BR, and SBC
acknowledge contract number FG07-98ER14930 at Washington State University;
ZZ and LR acknowledge the support of the Assistant Secretary for Environmental
Management under contract number DE-AC03-76SF0098 at Lawrence Berkeley
National Laboratory ; DR acknowledges contract number DE-AC06-76RL01830
at Pacific Northwest National Laboratory. We also acknowledge the assistance
of David Kramer and Art Roberts of WSU’s Institute of Biological Chemistry for
assistance with EPR measurements, and Jim Hurst of the Chemistry Department
for many helpful discussions.
Supporting Information Available: Complete tables of observed rate
constants for all chemical conditions are provided in the appendix.
68

Literature Cited
1. Rapko, B. M. "Oxidative Alkaline Dissolution of Chromium from Hanford Tank Sludges: Results of FY 98 Studies," Pacific Northwest National Laboratory, 1998.
2. Baloga, R. M.; Early, J. E. Journal of the American Chemical Society 1961, 83, 4906-4909.
3. Pettine, M.; Millero, F. J.; La Noce, T. Marine Chemistry 1991, 34, 29-46. 4. Petruzzelli, D.; Tiravanti, G.; Santori, M.; Passino, R. Water Science
Technology 1994, 30, 225-233. 5. Suwa, T.; Kuribayashi, N. Journal of Nuclear Science and Technology 1986,
23, 622-632. 6. Reartes, G. B.; Morando, P. J.; Blesa, M. A.; Hewlett, P. B.; Matijevic, E.
Chemistry of Materials 1991, 3, 1101-1106. 7. Rodenas, L. G.; Morando, P. J.; Blese, M. A.; Duhalde, S.; Saragovi, C.
Canadian Journal of Chemistry 1993, 71, 771-778. 8. Lumetta, G. J.; Rapko, B. M. Separation Science and Technology 1999, 35,
1495-1506. 9. Segal, M. G.; Williams, W. J. Journal of the Chemical Society - Faraday
Transactions 1986, 82, 3245-3254. 10. O'Brian, A. B.; Segal, M. G.; Williams, W. J. Journal of the Chemical Society -
Faraday Transactions 1987, 83, 371-382. 11. Lymar, S. L.; Gerasimov, O. V., personal communication. 12. Sylvester, P.; Rutherford, L. A.; Gonzales-Martin, A.; Kim, J.; Rapko, B. M.;
Lumetta, G. J. Environmental Science and Technology 2001, 35, 216-221. 13. Mills, A.; P., S. Journal of the Chemical Society - Faraday Transactions 1993,
89, 3389-3394. 14. Hiremath, S. C.; Tuwar, S. M.; Naidibewoor, S. T. Indian Jounal of Chemistry
1999, 38A, 61-64. 15. Cotton, F. A.; Wilkinson, G.; Murillo, C. A.; Bochman, M. Advanced Inorganic
Chemistry; 6th ed.; John Wiley & Sons: New York, NY, 1999. p. 741-742 16. Friese, J. I.; Ritherdon, B.; Clark, S. B.; Zhang, Z.; Rao, L.; Rai, D. Analytical
Chemistry Accepted. 17. Stunzi, H.; Marty, W. Inorganic Chemistry 1983, 22, 2145-2153. 18. Thompson, M. E.; Connick, R. E. Inorganic Chemistry 1981, 20, 2279-2285. 19. Rao, L., Zhang, Z., Friese, J.I., Ritherdon, B., Clark, S.B., Hess, N.J., Rai, D.,
J. Chem. Soc., Dalton Trans., 2002, 267-274
69

20. Kolthoff, I. M.; Miller, I. K. Journal of the American Chemical Society 1951, 3055-3059.
21. Espenson, J. H. Chemical Kinetics and Reaction Mechanisms; Second ed.; McGraw-Hill:, 1995.
22. Altman, C.; King, E. L. Journal of the American Chemical Society 1961, 2825-2831.
70

Table 1: Resolved rate constants for the oxidation of individual Cr(III) species with peroxydisulfate. See text for detailed explanation. 0.01M NaOHa Rate constant Monomer Dimer Trimer Tetramer kr (s-1) 0.01813 ± 0.002 0.0168 ± 0.008 0.01325 ± 0.006 0.00469 ± 0.001 k2 (s-1) 0.00022 ± 0.00003 0.00075 ± 0.00008 0.00073 ± 0.00005 0.00077 ± 0.00004 kc 0.148 ± 0.055 0.2756 ± 0.077 0.5193 ± 0.0911 0.6994 ± 0.139 k2/kc 1.486E-3 ± 5.88E-4 2.721E-3 ± 8.14E-4 1.405E-3 ± 2.65E-4 1.10E-3 ± 2.26E-4 0.05M NaOHa Rate Constant Monomer Dimer Trimer Tetramer k1 (s-1) 0.00211 ± 0.0003 0.00918 ± 0.0006 0.0080 ± 0.0011 0.00328 ± 0.001 k2/kc 2.972E-4 5.442E-4 2.81E-4 2.205E-4 0.10M NaOHa Rate Constant Monomer Dimer Trimer Tetramer k1 (s-1) 9.28E-4 ± 2.02E-5 0.00695 ± 0.00014 0.00478 ± 0.00026 0.00232 ± 0.001 k2/kc 1.48E-4 ± 4.0E-6 2.97E-4 ± 2.5E-6 1.79E-4 ± 2.9E-6 1.48E-4 ± 1.16E-6
71
Dimerb [NaOH] (M) k2 (min-1) kc (M) 1.5 0.246 ± 0.086 0.638 ± 0.119 0.5 0.195 ± 0.103 0.281 ± 0.040 0.33 0.304 ± 0.055 0.162 ± 0.059 0.25 0.263 ± 0.041 0.105 ± 0.039 0.1 0.234 ± 0.72 0.0865 ± 0.047 0.05 0.291 ± 0.107 0.0417 ± 0.012 a. [Cr(III)] species = 10-5M, µ=3.0M, 35.6oC. Kinetic curves were fit using equation 1. k1obs linear dependence on persulfate yields the slope kr. k2obs nonlinear dependence was fit using equation 6 yielding k2 and kc. b. [dimer] = 10-5M, µ=3.0M, 22.2oC. Kinetic curves were fit using equation 2. kobs nonlinear dependence was fit using equation 6 yielding k2 and kc.

Table 2. Rate constants for the oxidation of unseparated Cr(III) species using the schemes elucidated for the individual Cr(III) species.
[NaOH] (M) Temp (oC) k2 (min-1)a kc (M-1)a 1.0M 22.2 0.5764 ± 0.0233 0.60129 ± 0.05144 1.0M 30.7 0.7456 ± 0.025 0.3285 ± 0.03138 1.0M
37.6 0.99876 ± 0.02398 0.28319 ± 0.02054
k1 (M-1min-1)b k-1 (M-1min-1)b 5.0M 5.5 0.3086 ± 0.012 0.1495 ± 0.00133 5.0M 21.4 2.072 ± 0.062 0.0408 ± 0.0048 5.0M 30.8 4.13 ± 0.17 0.075 ± 0.016 5.0M 41.0 6.33 ± 0.17 0.197 ± 0.015
a. Equation 6 b. Equation 7
72

Table 3. Activation parameters for the oxidation of unseparated Cr(III) species obtained from Figures 8 and 9.
Rate constant Ea (J/mol) ∆H*(kJ/mol) ∆S* (J/mol K) k2 at 1.0M base 28801 ± 748 26.31 ± 0.68 -143.9 ± 3.7 k1 at 5.0M base 63132 ± 8198 60.65 ± 7.88 -18.8 ± 2.4 k-1 at 5.0M base 51550 ± 5022 49.10 ± 4.80 -87.0 ± 9.7
73

Figure Captions Figure 1: Structures of Cr(III) species. A. The hexa-aquo Cr(III) monomer. B.
Structure of the Cr(III) dimer based on EXAFS analysis [18]. C. The Cr(III)
trimer in solution, as suggested by recent EXAFS [18] and capillary
electrophoresis [19] D. The Cr(III) tetramer, as suggested by single crystal x-
ray analysis E.-H. Analogous anionic Cr(III) species proposed to in alkaline
systems.
Figure 2: Typical kinetic data under low and high base. A. Oxidation of Cr(III)
under relatively low concentration of OH-. [NaOH] = 0.1M [Cr(III)] = 1X10⁻⁵
M, µ = 3.0M with NaClO4, [S2O82-] =0.01M and T = 35.6oC. Least squares fit
of kinetic data to equation 1. B. Oxidation of Cr(III) under highly alkaline
conditions. [NaOH] = 5.0M, [Cr(III)] = 1X10⁻⁴M,µ ≈ 8.0M with NaOH, and
Na2S2O82-, [S2O8
2-] = 0.9966M, and T = 22.2oC. 5.0M Least squares fit of
kinetic data to equation 2.
Figure 3: The dependence of observed rate constants on peroxydisulfate
concentration at 0.10M NaOH and 35.6oC. Ionic strength is constant at 3.0M
with NaClO4. A. The observed rate constant k1obs (fast reaction) obtained
from fitting kinetic data to equation 1. B. The observed rate constant k2obs
(slow reaction) obtained from fitting kinetic data to equation 1.
Figure 4: The dependence of observed rate constants for the slow reaction
pathway (k2obs) on peroxydisulfate concentration at 0.01M NaOH and 35.6oC.
Ionic strength is held constant at 3.0M with NaClO4. The data points are least
squares fit to equation 6.
74

Figure 5: Hydroxide dependence on resolved rate constants from equation 6
obtained by oxidation of the dimeric species at 22.2oC. [dimer] = 1X10⁻⁵M,
[S2O82-] = 0.9966M (•) k2 (min-1) from reaction 5 is independent of [OH-]. ()
kc (M) from equation 6 has a linear dependence on hydroxide with a slope of
0.41 ± 0.02.
Figure 6: The dependence of observed rate constants on peroxydisulfate
concentration for a mixture of Cr(III) species at 1.0M NaOH and [Cr(III)] =
1X10⁻⁴M. Data is fit to equation 6.
Figure 7: The dependence of observed rate constants on peroxydisulfate
concentration for a mixture of Cr(III) species at 5.0M NaOH and [Cr(III)] =
1X10⁻⁴M. Data is fit to equation linear equation using a least squares
approach. Dependence on peroxydisulfate concentration is linear up to 1.0M
peroxydisulfate. (Data not shown).
Figure 8: A. Arrhenius plots for k2 and kc from reactions 4 and 5 obtained from
oxidation of unseparated Cr(III) mixtures at 1.0M NaOH and [Cr(III)] = 1X10-
4M.
Figure 9: Arrhenius plots for k1 () and k-1 () from reaction 4 obtained from
oxidation of unseparated Cr(III) mixtures at 5.0M NaOH and [Cr(III)] = 1X10-
4M.
75

OH
CrH2O
H2O OH2
OH2
OH2
OH2
CrH2O
H2OHO
OH
OH2
CrOH2
OH2
OH2
CrH2O OH2
OH2
OHHO
3+A
C
CrHO
HO OH
OH
OH2
OH2
-1
CrHO
HO O
O
OH2
CrOH
OH2
CrH2O OH2
OH2
OO
-3
E
G
Figure 1
76
CrH2O
H2OHO
OH
OH2
OH2
CrOH2
OH2
OH2
OH2
CrH2O
H2O
OH
HO
CrOH2
OH2
OH
CrH2O OH2
OH2
OHHO
CrH2O OH2
OH2
OH
4+
5+ 6+
B
CrHO
HO O
O
OH2
OH2
CrOH
OH
OH2
OH2
-2
CrHO
HO
O
O
CrOH
OH
O
CrH2O OH2
OH2
OO
CrH2O O 2
OH2
O
-4
F
H
D
H

77
0 500 1000 1500 2000 2500 300.0
0.2
0.4
0.6
0.8
1.0
By0 = 1.0366±0.0048k = 0.001555±0.00002A1 = -0.9997±0.0006
Abso
rban
ce
Time (s)
0 1000 2000 3000 4000 5000 6000 70000.00
0.02
0.04
0.06
0.08
0.10A
y0 = 0.10029±0.00026A1 = -0.0399±0.00042k1 = 6.636E-3±1.34E-4A2 = -0.06022±0.00018k2 = 2.894E-4±3.4E-6Ab
sorb
ance
Figure 2
00
8000

78
0.0 0.2 0.4 0.6 0.8 1.00.000
0.001
0.002
0.003
0.004
0.005
0.006
0.007
0.008 A
Monomer Dimer Trimer Tetramer
k 2obs
k 1obs
[S2O82-] (M)
0.0 0.2 0.4 0.6 0.8
B
[S2O82-] (M)
Monomer Dimer Trimer Tetramer
Figure 3
1.00.0
5.0x10⁻⁵
1.0x10⁻⁴
1.5x10⁻⁴
2.0x10⁻⁴
2.5x10⁻⁴
3.0x10⁻⁴

79
0.0 0.1 0.2 0.3 0.4 0.5 0.6 0.7 0.8 0.9 1.0 1.10.0000
0.0001
0.0002
0.0003
0.0004
0.0005
0.0006
0.0007
0.0008
0.0009k 2o
bs (s
-1)
[S2O82-] (M)
Monomer Dimer Trimer
Figure 4

80
0.0 0.2 0.4 0.6 0.8 1.0 1.2 1.4 1.60.0
0.1
0.2
0.3
0.4
0.5
0.6
0.7
0.8
k2
kc
k 2 (m
in-1) o
r kc (
M)
[OH-] (M)
Figure 5

81
0.0 0.2 0.4 0.6 0.8 1.00.0
0.2
0.4
0.6
0.8
k obs (
s-1)
[S2O82-] (M)
22.2C 30.0C 37.6C
Figure 6

82
0.04 0.06 0.08 0.10 0.12 0.140.0
0.2
0.4
0.6
0.8
1.0
1.2
k obs (
s-1)
[S2O82-] (M)
5.5C 21.6C 30.8C 41.0C
Figure 7

83
0.00320 0.00328 0.00336
-0.6
-0.5
-0.4
-0.3
-0.2
-0.1
0.0
ln k
2
1T
0.00320 0.00328 0.00336-1.4
-1.3
-1.2
-1.1
-1.0
-0.9
-0.8
-0.7
-0.6
-0.5
-0.4
ln k
c
1T
Figure 8

84
0.0032 0.0033 0.0034 0.0035 0.00-4.5
-4.0
-3.5
-3.0
-2.5
-2.0
-1.5
-1.0
-0.5
0.0
0.5
1.0
1.5
2.0ln
k1 o
r k-1 (M
-1s -1
)
1T
Figure 9
36

Chapter 4
The Speciation of Cationic Cr(III) Oligomers as a Function of pH and Aging Time. J. I. Friese, T. Oshiro, S. B. Clark
Washington State University, Department of Chemistry, P.O. Box 644630, Pullman, WA 99164-4630
Abstract
The speciation of hydrolyzed, cationic Cr(III) was studied in systems of
relatively large concentrations of total Cr(III) (e.g., > 0.1 mM) using capillary
electrophoresis. With this approach, distributions of monomeric, dimeric,
trimeric, tetrameric, and higher oligomers were observed over a wider range of
pH values, although these species are not predicted by current equilibrium
models for Cr(III). The concentrations of cationic species were quantified as a
function of pH and changes in the distributions of these species was studied as a
function of aging time. The larger oligomers form slowly with time concomitant
with the release of protons. These results demonstrate the complexity of
hydrolysis and speciation when predicting their environmental behavior.
85

Introduction
Chromium(III), like other higher charged metal cations such as Al(III),
Fe(III), Th(IV) and Pu(IV), can hydrolyze in the presence of base to form a
distribution of oligomeric species [1, 2]. While this property has been known for
many decades, the chemistry of oligomerization and the resulting speciation is
not well understood or predictable. Biologically, Cr(III) is an essential trace metal
[3], and the desired end product in the remediation of the more mobile and toxic
chromate anion [3, 4]. The primary interest in its hydrolysis arises from
environmental problems generated by its use in chemical processes. Industrial
processes that generate Cr(III) wastes include the production of stainless steel
and other metal alloys [3, 4], the tanning of leathers [3,5], the use of Cr
containing metal alloys as casings and structural materials of nuclear fuel
packages [6], and as a redox agent in the processing of defense-related nuclear
materials [7]. In each case, these waste streams contain relatively large
concentrations of total Cr(III), and oligomerization is very likely. Regardless of
the source of Cr contamination, our knowledge of the fundamental reactivity and
chemical speciation of Cr(III) over a wide range of environmental conditions is
limited due to the complexity of its chemical behavior and the limited number of
analytical tools for effective separation and characterization of the various Cr(III)
species formed.
Dimeric, trimeric, and tetrameric cationic species of Cr(III) have been
isolated and characterized [8, 9, 10, 11, 12, 13, 14], and higher order oligomers as
86

well as neutral and anionic species are presumed to exist in some solutions [10,
11, 12]. The coordination geometries shown in Figure 1 for the monomeric and
dimeric Cr(III) cations are generally accepted for acidic to near-neutral solutions.
We have confirmed the triangular arrangement and reported structural
parameters of the cationic trimer based on elution order from a capillary
electrophoresis column [12] and x-ray absorption studies [13]. The crystal
structure for a tetrameric Cr(III) solid has been reported by others [14], but no
structural information for solution species is available. The relative importance of
these various species in the different chemical or biological systems mentioned
above is uncertain, as are the structures of the larger Cr(III) oligomers.
Depending on chemical conditions, these oligomers may be cationic, neutral, or
anionic in the environment. The behavior of these various species in the
environment will be very different, and although the amount of a given species
may be small, its environmental fate can be very important. For example, we
have shown that the reactivity (e.g. oxidation) of the different species shown in
Figure 1 is quite different, with the rate of oxidation being limited by the higher
oligomers [13, 15] that may be present in the smallest quantity.
Recently, we reported the separation and identification of cationic Cr(III)
species as shown in Figure 1 using capillary electrophoresis (CE) [12]. CE has
been shown to separate microscopic quantities (~ 10nL) of charged species in a
fused silica capillary [16, 17, 18, 19, 20, 21]. Cr(III) species are separated on the
CE column based on net charge density, which is a ratio of species charge to
size. Our initial separation work included some preliminary studies that
87

demonstrated an aging effect; higher order oligomers form slowly with time,
apparently at the expense of the smaller oligomers [12]. Others have
demonstrated that the distribution of hydrolyzed Cr(III) species in solution
depends upon both the method used to initiate hydrolysis, and the amount of
time that the hydrolyzed solutions are allowed to age [22, 23, 24]. In all cases,
aging of the cationic oligomers is accompanied by a release of protons,
presumably from the bridging µ-hydroxo bond to yield a µ-oxo bridge [25]. Here,
we report on our investigation of the changes in cationic Cr(III) species as a
function of pH and aging time at relatively high concentrations of Cr(III) and show
that larger, cationic Cr(III) oligomers grow slowly via hydrolysis along with an
even slower release of protons to yield complex Cr(III) species that are not
considered by current solubility models for trivalent Cr.
Experimental
The “apparent solubility” of Cr(III) was measured in samples over the pH
range of 1 to 14. We define the apparent solubility as the total amount of
aqueous Cr(III) species that passes through a 0.1 µm filter. The initial Cr
concentration for each solution was 1.2 × 10⁻⁴ M. The pH of each sample was
measured using a standard glass electrode. Aliquots of the aqueous phase were
withdrawn immediately, filtered (0.1 µm filter), and acidified with 2% nitric acid.
The original samples were allowed to age, and additional aliquots were
withdrawn, filtered, and analyzed, as described. Each sample was analyzed for
total Cr concentration by a Jobin Yvon JY24 inductively coupled plasma atomic
emission spectroscopy (ICP-AES) equipped with a pneumatic nebulizer.
88

Capillary Electrophoresis Sample Preparation: Each sample was
prepared using a stock solution of 0.20M chromium(III) perchlorate (Aldrich).
12.5 mL of the stock Cr(III) solution was diluted to approximately 20 mL with
18MΩ water in a 50 mL beaker. Potassium hydroxide (Baker) or perchloric acid
(Fisher) was added with vigorous stirring to adjust the pH to the desired value.
The sample was transferred to a 25 mL volumetric flask and diluted to volume.
After transfer to a 30 mL scintillation vial, the pH of the sample was measured
with a glass electrode. At pH’s greater than 5, Cr(III) solids precipitated from
solution as aging occurred. The samples were not filtered prior to injection onto
the CE column due to concern that interaction between the filter materials and
the Cr(III) species present would alter the distribution of species in the samples.
Capillary Electrophoresis Procedures: All electropherograms were
collected using a Dionex capillary electrophoresis system in positive mode. An
indirect method of detection was used, as described previously [12]. A 69 cm
fused silica capillary column (ID=75µm) and 30,000 volts (unless otherwise
noted) were used in all experiments. The electrolyte solution was 10mM in α-
hydroxyisobutyric acid (HIBA) and 4 mM dimethylbenzyl amine (DBA) adjusted to
~pH 4.0 with acetic acid. Gravity injection at 50mm for 20 seconds was used for
all samples.
The linear dynamic range of the indirect detection method was 0.05 AU.
Two dilutions (10µL to 0.5mL and 10µL to 1.0mL) were performed on each
sample immediately prior to injection into the CE column with 18 MΩ water. The
more concentrated of the two dilutions was necessary to detect the less
89

abundant species. The less concentrated dilution was necessary to acquire the
abundant species in the linear range of the detection method. Unless noted, the
more concentrated (2 × 10⁻³ M total Cr(III)) dilution was used in the figures.
Under the experimental conditions used, only cationic species were detected.
Potassium hydroxide was used in the CE experiments instead of sodium
hydroxide because K+ has higher mobility than Na+. The use of K+ avoided
overlap of Na+ peaks with those of the higher oligomeric forms. The elution of
metal ions we observe is consistent with literature reports using similar
electrolyte buffers [21].
Peak areas were determined by fitting the electropherogram peaks using
the Bi-Gaussian function in Orgin 6.0, which is expressed as:
2
2
12 )(*)(
σrtx
eH−−
×=y
where H is the peak height, tr is the retention time and σ1 is the left standard
deviation of the peak. Bands must have a minimum 5 second peak width (5
absorbance points) to be fitted. The peak area for each band is an average from
four electropherograms, with the reported uncertainties being one standard
deviation of the average.
Results and Discussion
Knowledge of the variability in Cr(III) solubility and the speciation of the
dissolved Cr(III) over a wide pH range is important for predicting its
environmental behavior over a range of conditions. Figure 2 shows the
“apparent” Cr(III) solubility we observed from pH 1 to 14. As described in the
90

Experimental Section, the data in Figure 2 is not the thermodynamically-defined
solubility, but is consistent with previous thermodynamic studies of Cr(III)
solubility by Rai et al. [26]. At low pH, soluble cationic species dominate, and this
has been described mathematically by considering the cationic monomer shown
in Figure 1. In the neutral pH range, an amorphous (Cr(OH)3) solid precipitates
from solution, and the only solution species considered by Rai et. al. is
Cr(OH)3o
(aq). The increase in apparent solubility above pH 10 has been attributed
solely to the formation of the Cr(OH)4-(aq) monomer. Cr(III) solubility in highly
alkaline solutions (0.1 to 10M NaOH) was modeled in a later study by
considering an anionic monomer and dimer; although the data could be
adequately described with these species, the authors suggested that the
possibility of an anionic trimer species could not be excluded [27]. Although
consideration of the trimer and higher oligomers under acidic, neutral, and
alkaline conditions is not necessary for modeling the solubility data, previous
experimental work [e.g., 8, 9, 10, 11, 12, 13, 14] suggests that these species
exist. The solubility and speciation of Cr(III) changes slowly with time, as shown
in Figure 2 and described in [27], which makes equilibrium descriptions difficult,
at best. Consideration of the simplest species in a mathematical is an adequate
“first approximation”, but other minor species are likely important when
attempting to predict the environmental behavior of Cr(III).
Figure 3 shows a typical electropherogram (positive mode) of hydrolyzed
Cr(III) using CE obtained for a solution that contained 5.0 × 10⁻³ M total Cr(III), pH
~ 3.0 at t = 0 days (e.g., no aging time). The peaks for the individual Cr(III)
91

species are labeled; peak identification and order of species elution are
described in [12]. Note that under the experimental conditions used, only
cationic species were observed. A band for K+ (from the KOH used to adjust the
pH) is observed first, eluting in approximately 2 minutes. The monomer elutes at
about 3.2 minutes and gives the largest absorbance change. The dimer elutes
later, at about 6.2 minutes. The trimer elutes at 2.9 minutes and is preceded by
the tetramer at 2.8 minutes. The band that elutes immediately before the
tetramer represents a larger cationic oligomer or a mixture of larger oligomers
that have not yet been identified or characterized.
Figure 3 demonstrates that CE can be used to determine the distribution
of species present initially upon hydrolysis, and the change in that distribution as
a function of time. Although small shifts in band elution time are observed as
solution conditions are changed, the order of species elution and the relative
retention times remain constant. Figure 4A gives electropherograms of cationic
Cr(III) species over a pH range of 1 to 13 present immediately after sample
preparation for solutions that are 2 mM in total Cr(III). For the samples at pH
1.24 and 2.26, no base was added, so therefore no band for K+ was observed.
The Cr(III) monomer peak, eluting at about 3.6 min, is present up to pH 5.90, and
there is a significant decrease in all species from pH 4.95 to 5.90. Dimer and
trimer are also clearly present in the acidic pH range. As the pH is increased
above 5.90, the K+ peak becomes the dominant band, with other smaller bands
(both negative and positive) consistently observed. The Cr(III) species giving
rise to these bands have not yet been identified, but in all cases are cationic. We
92

believe that the negative bands represent dissolved species, whereas positive
bands must correspond to species large enough to scatter light and hence, are
likely colloidal.
As shown in Figure 2, the amount of total Cr(III) present in solution varies
with pH. The electropherograms in Figure 4A can be used to estimate the
fraction of cationic species present in solution as a function of pH with no aging
time from the areas of the individual bands. Peak area was estimated for the
negative bands only, as described in the Experimental section. The calibration
curves of the peak areas for the monomer and dimer species gave the same
slope within experimental error (data not shown), and we estimated
concentrations of Cr(III) species for each negative band using that calibration.
These concentrations were summed for each electropherogram to yield an
estimate of total cationic species, as shown in Table 1. As expected, the
concentrations of cationic Cr(III) species decrease as pH increases, so that
under alkaline conditions, cationic Cr(III) species account for only a small fraction
of the total Cr(III) in solution. Nonetheless, these cationic species are present in
measurable quantities up to pH values of approximately 11.
Figure 4B shows electropherograms as a function of time for two of the
samples (one acidic and one alkaline) that were allowed to age at room
temperature over a period of 8 to 9 months. Also shown are the changes in pH
for these samples as a function of time. For the acidic sample, the initial pH was
approximately 4, and the cationic monomer, dimer, and trimer are clearly
present, with the monomer being the dominant species. With time, the
93

concentration of the monomer decreases. The concentration of the dimer
appears remain fairly constant, with the only significant change in the dimer
occurring sometime after 68 days. The trimer and tetramer concentrations
increase with time. At the same time, the concentration of hydrogen ions in
solution increased by more than an order of magnitude within 68 days, and two
orders of magnitude after 270 days. Estimates of the concentrations of the
monomeric and trimeric species as a function of time and pH are provided in
Table 2. Note that the increase in trimer concentration occurs more slowly than
the decrease in monomer concentration.
For the electropherograms obtained as a function of time with the alkaline
solution (Figure 4B, right side), bands for distinct species cannot be identified,
but an estimate of cationic species can be obtained as done for the cationic
species present with no aging time (e.g., t = 0, Table 1). The changes in
speciation and pH for the alkaline system occurred more slowly than that
observed for the acidic system. The concentration of hydrogen ions increased by
only half an order of magnitude within the first 68 days, but after approximately
240 days the pH dropped by more than 2 pH units. During this same time period,
the fraction of cationic species increased by less than two within the first 68 days,
and had approximately doubled after 240 days.
Our CE results indicate that hydrolysis and aging of Cr(III) in solution
slowly produces an increase of larger cationic Cr(III) species in near neutral
systems, along with a decrease in pH. This can best be explained by the
deprotonation of µ-hydroxo bridges of the Cr(III) species, which has been
94

demonstrated with the dimer, trimer, and tetramer [8, 9, 11]. For example, this
can be described for the dimer as:
+++++ + →+ →−
HOHOCrHOHOHCrOHCr AgingOHAging 222 28222
48222
362 ])()([])()([])([ / µµ
Note that the release of the proton from the µ-hydroxo bridge also reduces the
overall cationic charge on the species.
Collectively, our results demonstrate that as solutions containing relatively
large concentrations total of Cr(III) (> 0.1 mM) age (regardless of the initial pH),
the release of protons occurs slowly with time concomitant with an increase in
oligomerization and a decrease in total Cr(III) in solution, even though equilibrium
calculations indicate that the monomer and smaller oligomers should become
more significant as the concentration of protons increases. Clearly, the reaction
above describing this aging process is not considered in most thermodynamic
descriptions of solubility.
Concentrated Cr(III)-bearing wastes have been released to the
environment in the past primarily in the early days of the tanning industry [5], and
the potential for release of wastes containing large concentrations of Cr(III)
remain today (e.g., in the processing of high level radioactive wastes [28]).
Current published solubility data for Cr(III) does not consider the oligomeric
species observed in our work. Perhaps most interesting to consider is the
behavior of Cr(III) in such waste streams under more typical environmental pH
conditions, e.g. pH 4 to 9, in the context of our results. Although the total
solubility of Cr(III) is decreasing over the pH range of 4 to 6, the distribution of
95

cationic species changes with time from initially the relatively simple cationic
monomer to more complex cationic oligomers. In the pH range of 6 to 9, total
concentrations in solution are quite low, with a significant fraction being cationic.
Although the solubility of Cr(III) increases above pH 9, the fraction of cationic
species remains low and the increase in concentration is the result of increases
in anionic or neutral species not examined in this work. At the same time,
however, one must consider that 1% of millimolar Cr(III) concentrations yields
micromolar concentrations of Cr(III), which is small but still significant from an
environmental perspective. For example, our results demonstrated that after 8
months, the fraction of cationic species in our alkaline system (Figure 4B)
increased to more than 10 µM. Clearly, these species should be considered
when predicting the environmental fate of Cr(III) in such systems, but the
thermodynamic data needed to include them in speciation models is lacking. In
addition to consideration of the Cr(III) itself, the aging of these oligomers provides
a source of protons that can also affect overall environmental quality.
Acknowledgements: This work was supported by the U.S. Department of
Energy’s Environmental Management Sciences Program. The authors
acknowledge contract number FG07-98ER14930 between Washington State
University and the Department of Energy. In addition, we gratefully acknowledge
Ms. Susan Bentjen for assistance with the preparation of this manuscript and
Prof. Herbert H. Hill for many helpful discussions of chromatography.
96

1 Cotton, F. A.; Wilkinson, G.; Murillo, C. A.; Bochman, M. Advanced Inorganic Chemistry, 6th ed.; John Wiley & Sons: New York, NY, 1999, p.776. 2 Neu, M.; Runde, W. Plutonium Speciation, Solubilization, and Migration in
Soils, Report LA-UR-99-3084, Los Alamos National Laboratory: Los Alamos, NM, 1999, 10 p.
3 Weast, R. C.; Astle, M. J. (eds) CRC Handbook of Chemistry and Physics; CRC Press: Boca Raton, FL, 1981. p. B-12.
4 Cotton, F. A.; Wilkinson, G.; Murillo, C. A.; Bochman, M. Advanced Inorganic Chemistry, 6th ed.; John Wiley & Sons: New York, NY, 1999, p. 738.
5 Thorstensen, T. C.(ed) Practical Leather Technology; Krieger Publishing: Malabar, FL, 1993.
6 Nuclear Facility Decommissioning and Site Remedial Actions: A Selected Bibliography, Vol. 18 Part 2 Indexes Report ES/ER/TM---227/Pt.2, Oak Ridge National Laboratory: Oak Ridge, TN, 1997, 418 p.
7 Nuclear Facility Decommissioning and Site Remedial Actions. A Selected Bibliography, Volume 18, Part 1A: Citations with abstracts, sections 1 through 9 Report ES/ER/TM---227/Pt.1A, Oak Ridge National Laboratory: Oak Ridge, TN, 1997, 447 p.
8 Stunzi, H.; Marty, W. Inorganic Chemistry 1983, 22, 2145. 9 Stunzi, H.; Rotzinger, F. P.; Marty, W. Inorganic Chemistry 1984, 23, 2160-2164. 10 Thompson, M. E.; Connick, R. E. Inorganic Chemistry 1981, 20, 2279- 2285. 11 Finholt, J. E.; Thompson, M. E.; Connick, R. E. Inorganic Chemistry 1981, 20, 4151-4155. 12 Friese, J.I., Ritherdon, B., Zhang, Z., Rao, L., Clark, S.B. Analytical Chemistry, Accepted 13 Rao, L.; Zhang, Z.; Friese, J. I.; Ritherdon, B.; Clark, S. B.; Hesss, N. J.;
Rai, D. Journal of the Chemical Society - Dalton Transactions 2002, 267-274.
14 Drljaca, A.; Hardie, M. J.; Raston, C. L.; Spiccia, L. Chem. Eur. J. 1999, 5, 2295.
15 Friese,J.I., Ritherdon, B., Clark, S.B., Zhang, Z., Rao, L., Rai, D, “Kinetics and Mechanism of the Oxidation of Chromium(III) Oligomers by Peroxydisulfate Under Alkaline Conditions.” Submitted to Inorg. Chem. (2002)
97

16 Guzman, N. A. (ed.) Capillary Electrophoresis Technology; Marcel Dekker: New York, NY, 1993.
17 Pacakova, V.; Coufal, P.; Stulik, K. Journal of Chromatography A 1999, 834, 257.
18 Timerbaev, A. R.; Shpigum, O. A. Electrophoresis 2000, 21, 4179. 19 Timerbaev, A. R. Talanta 2000, 52, 573. 20 Vogt, C.; Klunder, G. L. Fresenius Journal of Analytical Chemistry 2001,
370, 316. 21 Chen, M.; Cassidy, R. M. Journal of Chromatography 1993, 640, 425-431. 22 Kohlschutter, H. W.; Melchior, O. Angew. Chem. 1936, 49, 865. 23 Laswick, J. A.; Plane, R. A. Journal of the American Chemical Society 1959,
81, 3564. 24 Ardon, M.; Plane, R. A. Journal of the American Chemical Society 1959, 81. 25 Cotton, F. A.; Wilkinson, G.; Murillo, C. A.; Bochman, M. Advanced Inorganic Chemistry; 6th ed.; John Wiley & Sons: New York, NY, 1999. 26 Rai, D.; Sass, B. M.; Moore, D. A. Inorganic Chemistry 1987, 26, 345-349. 27 Rai, D.; Hess, N. J.; Rao, L.; Zhang, Z.; Felmy, A. R.; Moore, D. A.; Clark, S. B.; Lumetta, G. J. Journal of Solution Chemistry Accepted. 28 Rapko, B. M. "Oxidative Alkaline Dissolution of Chromium from Hanford Tank Sludges: Results of FY 98 Studies," Pacific Northwest National Laboratory, 1998. PNNL-11908
98

Figure Captions Figure 1. Cr(III) oligomers that have been separated and characterized
elsewhere. See text for details.
Figure 2. Concentration of dissolved Cr(III) in solutions of varying pH. Each
solution was 1.2 × 10⁻⁴ M Cr(III); pH was adjusted by addition of either HClO4 or
NaOH. Aliquots were filtered through a 0.1µm filter and diluted with 2% nitric
acid. Total [Cr(III)] was measured by ICP-AES. pH was measured by a glass
electrode.
Figure 3. Electropherogram for the separation of hydrolyzed Cr(III) species, as
described in [12]. The bands corresponding to the individual Cr(III) species are
labeled. [Cr(III)]total = 5.0 × 10⁻³ M, pH ~3.0, and no aging time. HIBA/DBA buffer
at pH 4.5, total column length was 22 cm, voltage was 30,000 V.
Figure 4. A. Electropherograms for the separation of cationic Cr(III) species
present in solutions of pH ranging from 1.24 to 12.85. [Cr(III)]total = 2 × 10⁻³ M,
HIBA/DBA buffer, total column length was 69 cm, voltage was 30,000 V. pH
values were measured with a glass electrode prior to injection. B. Changes in
the electropherograms of two hydrolyzed Cr(III) solutions as a function of time.
An acidic solution (initial pH 3.97) was monitored (left hand side), along with an
alkaline solution (initial pH 12.85, right hand side). Changes in pH are also
shown for each system, and were measured with a glass electrode. [Cr(III)]total =
2 × 10⁻³ M, HIBA/DBA buffer, total column length was 69 cm, voltage was 30,000
V.
99

Table 1. Concentrations of total cationic Cr(III) species estimated the electropherograms shown in Figure 4A. Only negative peaks were considered, as described in the text. The uncertainty is the total uncertainty (1σ) obtained by summing the uncertainties obtained from each individual peak.
pH
Cationic [Cr(III)] Ma
Uncertainty
1.24 1.04E-03 9.45E-05 2.26 1.03E-03 1.06E-043.00 9.59E-04 4.01E-053.97 9.81E-04 2.85E-054.95 8.49E-04 2.28E-055.90 2.98E-05 3.70E-066.75 2.81E-05 4.65E-068.03 1.32E-05 5.14E-069.04 1.26E-05 6.49E-06
10.19 6.40E-06 1.15E-0610.97 6.38E-06 9.98E-0712.01 3.13E-06 1.46E-0612.85 1.85E-06 1.60E-06
100

Table 2: Estimates of changes in the concentrations of cationic Cr(III) species as a function of time. Data obtained from peak areas for the negative peaks shown in Figure 4B. Measurements of the changes in pH are also shown.
Acidic Days [Mono] M Uncertainty [Tri] Mb Uncertainty pH Alkaline Days Cationic
[Cr(III)] Ma Uncertainty3.97 0.0 9.75E-04 2.84E-05 8.37E-06 2.17E-06 12.85 0.0 1.85E-06 1.60E-063.74 1.0 8.90E-04 5.38E-05 3.90E-05 5.32E-07 12.67 5.0 5.19E-06 7.33E-073.55 2.0 1.09E-03 8.86E-06 4.29E-05 8.05E-06 12.66 15.1 8.89E-06 5.09E-073.4 3.0 1.00E-03 2.79E-05 4.25E-05 2.09E-06 12.61 28.1 1.56E-06 7.40E-073.17 6.8 9.50E-04 1.35E-05 4.03E-05 2.94E-06 12.31 68.0 2.36E-06 4.01E-073.04 15.8 7.69E-04 3.44E-05 4.74E-05 2.08E-06 9.72 239.2 9.27E-06 1.37E-062.91 28.0 7.16E-04 3.07E-05 3.05E-05 3.86E-06 2.58 68.0 2.71E-04 3.62E-05 1.43E-05 2.12E-06a. [Cr(III)]T is the sum of all detected cationic species by CE. b. The dimer signal could not be deconvoluted in the electropherogram under the CE conditions used.
101

Figure 1
CrH2O
H2O OH2
OH2
OH2
OH2
CrH2O
H2OHO
OH
OH2
CrOH2
OH2
OH2
CrH2O OH2
OH2
OHHO
CrH2O
H2O
OH
HO
CrOH2
OH2
OH
CrH2O OH2
OH2
OHHO
CrH2O OH2
OH2
OH
3+
5+ 6+
CrH2O
H2OHO
OH
OH2
OH2
CrOH2
OH2
OH2
OH2
4+
102

2 4 6 8 10 12 140.0
2.0x10⁻⁵
4.0x10⁻⁵
6.0x10⁻⁵
8.0x10⁻⁵
1.0x10⁻⁴
1.2x10⁻⁴
1.4x10⁻⁴
Detection Limit
Figure 2[C
r]
pH
0 days 7 days
103

104
2 3 4 5 6
-0.018
-0.012
-0.006
0.000
Cr(III)Species
K+
Abso
rban
ce
Time (Minutes)
2.8 3.0 3.2 3.4
-0.006
-0.004
-0.002
0.000
CrH2O
H2O
OH
HO
CrOH2
OH2
OH
CrH2O OH2
OH2
OHHO
CrH2O OH2
OH2
OH
6+
CrH2O
H2OHO
OH
OH2
CrOH2
OH2
OH2
CrH2O OH2
OH2
OHHO
5+
Cr
OH2H2O
OH2H2O
OH2
OH2
3+
High
er O
ligom
er
Time (Minutes)
Figure 3
CrH2O
H2OHO
OH
OH2
OH2
CrOH2
OH2
OH2
OH2
4+

pH 1.24 pH 8.03
pH 2.26 pH 9.04
pH 3.00 pH 10.19
pH 3.97 pH 10.97
pH 4.95
pH 12.01
pH 5.90
2 3 4 5 6Time (Minutes)
pH 12.85
2 3 4 5 6 7
Rel
ativ
e Ab
sorb
ance
Time (Minutes)
pH 6.75
Figure 4A
105

Rel
ativ
e Ab
sorb
ance
pH 3.97, 0 days
pH 12.85, 0 days
pH 3.74, 1.0 day
pH 12.67, 5.0 days
pH 3.17, 6.8 days
pH 12.66, 15.1 days
pH 3.04, 10.9 days
pH 12.61, 28.1 days
pH 2.58, 68.0 days
pH 12.31, 68.0 days
2 3 4 5Time (minutes)
pH 1.95, 271.1 days
2 3 4 5
Time (minutes)
pH 9.72, 239.2 days
0 10 20 30 40 50 60 225 250 275
2
3
4
pH
Time (days)
0 10 20 30 40 50 60 225 250 2759
10111213
AlkalineAcidic Figure 4B
pH
Time (days)
106

Chapter 5
Conclusion
The study of Cr(III) chemistry under alkaline systems is quite complex.
Many different oligomeric structures of Cr(III) can form that can be cationic,
neutral, or anionic. A systematic analysis of the speciation and reactivity of these
oligomers is needed to understand and solve problems related to HLW. The
chapters of this thesis are important steps in this process. The complexity is
being unraveled although there is still much work that needs to be done to solve
problems related to HLW.
The new IX method developed using Sephadex cation exchange resin and
perchlorate salts of sodium, calcium, lanthanum, and thorium has greatly
simplified the separation of the monomer, dimer, trimer, and tetramer. These
Cr(III) species can now be separated from each other, yielding fractions of
sufficient concentrations to allow further characterization or reactivity studies.
The development of a CE method for the separation of microscopic amounts of
Cr(III) species was shown to have many advantages. The purity of the
monomer, dimer, trimer, and tetramer fractions from IX separations have been
confirmed using CE. The CE check of the IX separations showed that isolated
Cr(III) species will eventually form a distribution of species with time. The
isolated dimer fraction showed monomer contamination and the tetramer fraction
had dimer contamination.
107

Currently there are no separation procedures that are able to separate
anionic species in large enough quantities for characterization. Anion exchange
resins may be able to separate macroscopic amounts of anionic species, but to
our knowledge a separation procedure has not been developed. There may be
several difficulties involved in developing an anionic method of separation. The
need to keep the eluants at the exact same pH as the Cr(III) solution to prevent
change in Cr(III) speciation will be important. If neutral or acidic eluants are
used, the anionic Cr(III) species will be protonated and become cationic.
Though direct identification of the oligomers cannot be accomplished by
CE, some structural information was deduced. The elution order of the trimeric
species from the CE column suggests that the triangular arrangement of Cr(III)
centers is favored over the linear arrangement, and the linear trimer species is
not formed in significant amounts during hydrolysis. Oligomers higher than the
tetramer were detected by CE, the structures and composition of which are
unknown. These species were not eluted from the IX column and thus could not
be obtained in macroscale amounts for characterization.
We have shown that cationic species are important in moderately alkaline
solutions. However it is presumed that at base concentrations higher than pH
13, anionic species are the dominant species. In addition to anionic IX, CE in
negative mode to detect anionic species may also be useful for studying this
system. A potential issue is that CE cannot have an electrolyte at high base.
The speciation of Cr(III) oligomers may change if an electrolyte that is acidic or
neutral is used.
108

CE have been shown to be able to separate cationic oligomers higher
than the tetramer. A characterization method that can detect micromolar
amounts of oligomers would be useful in identifying these higher species. One
type of detector that may be of use in identifying these species is a mass
selective detector (MSD). MSD generally have low detection limits and can also
provide mass information of detected species. Electrospray ionization mass
spectrometry (ESI-MS) has been shown to be able to mass identify several
oligomeric forms of Cr(III) [1]. A coupling of CE with electrospray ionization mass
spectrometer can offer a preliminary identification of the eluting Cr(III) species.
Another advantage of this method compared to current CE procedures for the
separation of Cr(III) oligomers is that it is a direct detection method.
There are problems in using a coupling of CE to ESI-MS. The amount of
Cr(III) species eluting from the column is very small. Detection of species may
be difficult due to the small sample sizes used in CE. The transfer of species
from liquid to the gas phase for mass selective detection may alter the speciation
such that the species distribution that is observed may not be representative of
the aqueous solution distribution. Despite these potential difficulties, CE-ESI-MS
is method that may be able to study other systems besides Cr(III) hydrolysis.
The study of the hydrolysis of other metal cations would benefit from the methods
developed for Cr(III).
Separation methods for individual Cr(III) oligomers is needed for a
systematic study of alkaline systems. Success in separating, characterizing, and
verifying the purity of relatively large amounts of Cr(III) species by IX was
109

necessary to the study of the oxidation mechanism of individual Cr(III) species
and mixtures of species with peroxydisulfate.
The oxidation reaction proceeds by two pathways, a fast pathway and a
slower pathway. The fast pathway involves the oxidation of Cr(III) by thermal
degradation products of peroxydisulfate. Higher oligomers are oxidized at a
slower rate than lower oligomers. This pathway also slows with increase in base
concentrations, such that at 1.0M NaOH, the pathway does not occur to a
significant extent.
The slow pathway takes place in two steps. The first step is the
association of peroxydisulfate and the Cr(III) oligomer without electron transfer.
The formation of this intermediate species is slowed by increase in base and
increase in oligomerization. The second step involves the electron transfer
oxidation of the Cr(III) species by peroxidisulfate. The second step is
independent of both hydroxide concentration and Cr(III) oligomer used.
The idea that the rate of the association of peroxydisulfate with the Cr(III)
decreases as oligomers increase gives evidence to the nature of the oligomers in
acidic conditions. The rate of water exchange from the tetramer is faster than the
dimer [2], but the rate of peroxydisulfate exchange with Cr(III) is slower for the
tetramer. This observation can be explained by an electrostatic argument. The
deprotonated tetramer will have a higher negative charge than the deprotonated
dimer. The association of the peroxydisulfate anion with the tetramer will have to
overcome this electrostatic repulsion to associate with peroxydisulfate, thus
making this kinetic step slower for the tetramer.
110

The kinetic results have several implications for HLW systems. Some of
the tanks have hydroxide concentrations in excess of 10M. In these systems, a
dilution of the wastes may be necessary in order for peroxydisulfate to oxidize
Cr(III) at a faster rate. The overall oxidation rates of reaction are slow, with half-
lives greater than 45 minutes. Because of the volume of HLW to be processed,
caustic oxidative leaching with peroxydisulfate may be too time consuming to be
practical. Peroxydisulfate may also oxidize other metal cations such as the
actinides to more soluble forms. While peroxydisulfate has chemical properties
that are desirable for the leaching process, it may not be ideal for HLW systems.
For this reason, further oxidation kinetic work needs to be done with other
oxidants. Hydrogen peroxide and peroxydisulfate have been studied
mechanistically; however other oxidants should be studied. Potassium
permanganate is another promising oxidant that has not been studied
mechanistically. It is known that KMnO4 removes Cr(III) from HLW, but an
understanding of this reaction is unknown.
The oxidation of mixed element species also should be done. Because
the HLW tanks are an incredibly complex mixture of elements, the synthesis,
characterization, and oxidation of mixed element Cr(III) species would be of
interest. The easies element to do this with may be iron. Iron(III), much like
Cr(III), can hydrolyze to form oligomers [3]. A synthesis technique that uses both
Fe(III) and Cr(III) may contain oligomers that have both Fe(III) and Cr(III) centers
with µ-hydroxo bonds. The oxidation of Cr(III) to Cr(VI) for these species should
be studied to test the effect of the addition of mixed complexes.
111

The change in speciation observed in isolated Cr(III) oligomer solutions
motivated a systematic study of speciation as a function of pH and aging time.
Cr(III) samples over a pH range from one to thirteen were prepared and analyzed
by CE. These samples were also set aside for analysis by injections made on a
CE column over an eight month period to monitor the speciation change with
time and pH.
All of the samples became more acidic with time. Despite the acidification
of the samples, higher oligomers grew in with time, while the concentration of
monomer decreased. Similarly, the concentration of higher oligomers grew as
pH was increased. In the neutral pH range, the solubility of Cr(III) is low, and the
amount of detected cationic decrease as well with pH and time. In the pH range
of nine to twelve, cationic species account for a large fraction of soluble species.
Under alkaline systems, cationic species account for less than 2% of the solution
species the majority of the Cr(III) solution species are neutral and/or anionic.
Ion exchange was also a useful technique for the study of Cr(III)
speciation. Whereas it cannot separate higher oligomers like CE, the
separations of the lower oligomers are well defined. There was correlation
between decrease in monomer and increase in higher oligomers as pH is
increased. Dimer and trimer concentrations did not hydrolyze as dramatically as
the monomer. The IX experiments showed the same trends as the CE
experiments.
The separation procedures (both CE and IX) are generally applicable to
other hydrolysis systems. The characterization techniques used to study the
112

Cr(III) hydrolysis system are not unique to Cr. The procedures, techniques, and
methods developed and put into practice in the study of Cr(III) hydrolysis problem
are also procedures, techniques and methods that can be used to study other
chemical systems, not just Cr(III).
1 Stewart, I. I.; Olesik, J. W. Journal of Chromatography A 2000, 872, 227- 246. 2 Crimp, S.J., Spiccia, L., Krouse, H. R., Swaddle, T.W., Inorganic Chemistry, 1994, 33, 465 3 Cotton, F. A.; Wilkinson, G.; Murillo, C. A.; Bochman, M. Advanced Inorganic Chemistry; 6th ed.; John Wiley & Sons: New York, NY, 1999.
113

Appendix I
Supplementary Information for: Chromatographic Separation and Characterization of Hydrolyzed Cr(III) Species
J. I. Friese1, B. Ritherdon1, S. B. Clark1, Z. Zhang2, L. Rao2, and D. Rai3
Estimating the Charge Density of Cr(III) Oligomers
Chromatographic separation in capillary electrophoresis is based on charge
density, with the species having the greatest positive charge density eluting first (in
positive mode) [1]. Charge density is defined as the ratio of the charge of the species
divided by its size. For the Cr(III) structures shown in Fig. 1 (main paper), we assume
that size is adequately described by the volume of the species, and that volume can be
estimated from published structural data. We can calculate the geometric volumes for
the various species using standard formulas taken from [2].
We assume that the monomeric Cr(III) species is spherical, and EXAFS data [3]
indicates that the radius for this species 4.08 Å, if the first coordination shell of six water
molecules and the second hydration shell of 12 water molecules are included. The
exact solution for this volume is calculated using the formula given in Figure S.1, which
yields a volume of 284.5 Å3 (Table 2, main paper). This spherical volume is used as the
basis for estimating the volumes of the other species. For example, the volume of the
dimer can be calculated using twice the volume of the spherical monomer, minus the
volume of overlap shared by the two spheres, as shown in Fig. S.2. The Cr – Cr
distance for this species in solution is reported to be 2.98 Å by extended x-ray
114

absorption fine structure (EXAFS) [4]; using this distance and the radius of the two
identical spheres, we can calculate the volume of this convex lens shape according to
the formula shown in Fig. S.2. Similarly, the volumes of the linear configurations for the
trimer and tetramer are estimated by adding the same volume of the sphere, minus the
area of overlap (Figs. S.3 and S.4, respectively). Since no structural parameters have
been reported for these species, we assume that each Cr – Cr distance is the same as
in the dimeric species. The results of these calculations are given in Table 2 (main
paper).
To estimate the volume of the triangular configuration of the trimer, we assume
that all the Cr atoms are equidistant and form an equilateral triangle; the Cr – Cr
distances are again 2.98 Å as indicated by EXAFS [4]. The volume of this species is
approximated, as shown in Figure S.5. We first sum the volume of 3 spheres. As with
the dimer, the overlap shared by any two spheres must be subtracted. We must also
consider the volume shared by all three spheres. Here, we do not obtain an exact
solution for the volume of the overlap; we approximate this volume by treating it as a
triangular prism. Although not exact, the error associated with this approximation is
small relative to the total volume of the species. The estimated volume using the
approach is given in Table 2 (main paper).
For the diamond-shaped tetramer, no structural data is reported for this species
in solution; however, single crystal data indicates that the Cr centers are nearly
equidistant in the solid phase [5], with adjacent Cr – Cr distances 2.96 to 2.98 Å apart.
For simplicity, we use 2.98 Å as above. If an additional monomer is added to the trimer
to give the tetrameric species shown in Figure S.6, we must again subtract the volume
115

shared by any two spheres, and approximate the overlap between the three spheres as
described for the trimer. With these structural constraints, overlap between all four
spheres is not physically possible. Table 2 (main paper) shows the volume estimated
for the aggregated tetramer.
1 Guzman, N. A. (ed.) Capillary Electrophoresis Technology; Marcel Dekker: New York, NY, 1993.
2 Kieck, K.; Geick, R. (eds.); Engineering Formulas, 6th edition, McGraw-Hill, New York, 1990.
3 Lindquist-Reis, P.; Munoz-Paez, A.; Diaz-Moreno, S.; Pattanaik, S.; Persson, I.; Sandstrom, M. Inorganic Chemistry 1998, 37, 6675.
4 Rao, L.; Zhang, Z.; Friese, J. I.; Ritherdon, B.; Clark, S. B.; Hess, N. J.; Rai, D. Journal of the Chemical Society - Dalton Transactions submitted.
5 Drljaca, A.; Hardie, M. J.; Raston, C. L.; Spiccia, L. Chem. Eur. J. 1999, 5, 2295.
116

Figures for Appendix I: Estimates of species volumes and charge densities Geometric representations are for the Cr(III) species shown in Fig. 1 (main paper). For all geometric representations, we assume that the radius of each sphere is 4.08 Å, and the distance between adjacent Cr centers is 2.98 Å. Figure S.1: Volume of Monomer
Vmono = 4/3 π r3
Vmono = 284.5Å3
Figure S.2: Volume of Dimer
h s
Vdi = 2Vmono-Vseg
Vseg = (π/6)h[3/4 s2+h2]
Vdi = 4/3 π r3 - (π/6)h[3/4 s2+h2]
Vdi = 469.9 Å3
Figure S.3: Volume of a Linear Trimer
Vlintri ≈ 3Vmono – 4Vseg
h s
Vlintri ≈ (3) 4/3 π r3-(4)( π/6)h[3/4 s2+h2]
Vlintri ≈ 655.3 Å3
117
r
r
r

Figure S.4: Volume of a Linear Tetramer
Vlintet ≈ 4Vmono – 6Vseg
Vlintet ≈ (4) 4/3 π r3-(6)( π/6)h[3/4 s2+h2]
Vlintet ≈ 840.8 Å3
Figure S.5: Volume of a Triangular Trimer
Vtritri = 3Vmono-6Vseg+Voverlap Voverlap ≈ (1/2)s(x/2)√(x-(x/2)2)
Vtritri ≈ (3) 4/3 π r3-(6)( π/6)h[3/4 s2+h2]+
(1/2)s(x/2)√(x-(x/2)2)
h s
r
h s
r
Vtritri ≈ 559.5 Å3 x
Figure S.6: Volume of a Diamond-Shaped Tetramer
Vtetra ≈ 4Vmono-10Vseg+2Voverlap
Vtetra ≈ (4) 4/3 π r3-(10)(π/6)h[3/4 s2+h2]+ (2)(1/2)s(x/2)√(x-(x/2)2)
Vtetra ≈ 973.88 Å3
h s
r
x
118

Appendix II
Supporting Information: Observed rate constants obtained by fitting kinetic curves to equation 1. Ionic strength held constant at 3.0M with NaClO4.
k1obs (s-1) 1σ k2obs (s-1) 1σ [NaOH] (M) [S2O82-] (M) Temp. (C) Species [Cr(III)]
(M) 5.46E-05 3.45E-05 7.78E-06 5.23E-07 0.100 0.050 35.6 Monomer 1.00E-051.24E-04 2.07E-05 1.52E-05 2.06E-06 0.100 0.100 35.6 Monomer 1.00E-052.01E-04 1.28E-04 2.92E-05 5.52E-06 0.100 0.200 35.6 Monomer 1.00E-054.27E-04 6.20E-05 6.17E-05 2.06E-06 0.100 0.400 35.6 Monomer 1.00E-056.19E-04 6.16E-05 9.99E-05 3.88E-06 0.100 0.700 35.6 Monomer 1.00E-059.50E-04 6.28E-06 1.50E-04 1.14E-05 0.100 0.997 35.6 Monomer 1.00E-051.91E-04 1.54E-05 7.67E-06 8.93E-07 0.100 0.029 35.6 Dimer 1.00E-053.42E-04 2.76E-06 1.46E-05 4.33E-07 0.100 0.050 35.6 Dimer 1.00E-056.83E-04 9.31E-06 3.01E-05 9.96E-07 0.100 0.100 35.6 Dimer 1.00E-051.36E-03 1.67E-04 5.79E-05 2.74E-06 0.100 0.200 35.6 Dimer 1.00E-05
2.82E-03 1.43E-04 1.16E-04 1.24E-05 0.100 0.400 35.6 Dimer 1.00E-055.02E-03 2.25E-04 2.04E-04 6.64E-06 0.100 0.070 35.6 Dimer 1.00E-056.91E-03 3.50E-04 2.98E-04 1.18E-05 0.100 0.997 35.6 Dimer 1.00E-052.28E-04 1.40E-05 8.38E-06 5.64E-07 0.100 0.050 35.6 Trimer 1.00E-054.73E-04 3.65E-05 1.76E-05 3.57E-07 0.100 0.100 35.6 Trimer 1.00E-059.74E-04 6.73E-05 3.58E-05 2.44E-06 0.100 0.200 35.6 Trimer 1.00E-051.93E-03 2.46E-04 7.10E-05 2.54E-06 0.100 0.400 35.6 Trimer 1.00E-053.32E-03 3.97E-04 1.25E-04 3.13E-06 0.100 0.700 35.6 Trimer 1.00E-054.50E-03 4.55E-04 1.78E-04 3.79E-06 0.100 0.996 35.6 Trimer 1.00E-05
119

k1obs (s-1) 1σ k2obs (s-1) 1σ [NaOH] (M) [S2O82-] (M) Temp. (C) Species [Cr(III)]
(M) 1.19E-04 2.64E-05 7.64E-06 1.16E-06 0.100 0.050 35.6 Tetramer 1.00E-052.11E-04 8.50E-06 1.22E-05 2.49E-06 0.100 0.100 35.6 Tetramer 1.00E-054.58E-04 2.66E-05 2.94E-05 1.32E-06 0.100 0.200 35.6 Tetramer 1.00E-059.12E-04 1.95E-05 5.97E-05 1.73E-06 0.100 0.400 35.6 Tetramer 1.00E-051.52E-03 2.89E-04 1.04E-04 7.36E-06 0.100 0.700 35.6 Tetramer 1.00E-052.02E-03 6.90E-04 1.38E-04 1.58E-05 0.100 0.996 35.6 Tetramer 1.00E-058.82E-05 3.81E-05 2.47E-06 3.72E-08 0.050 0.005 35.6 Monomer 1.00E-051.69E-04 7.17E-05 6.60E-05 3.93E-06 0.050 0.028 35.6 Monomer 1.00E-052.53E-04 1.72E-04 6.66E-05 2.23E-05 0.050 0.050 35.6 Monomer 1.00E-052.47E-04 1.64E-05 7.46E-06 5.95E-07 0.050 0.100 35.6 Monomer 1.00E-055.54E-04 3.61E-05 1.86E-05 1.62E-06 0.050 0.200 35.6 Monomer 1.00E-058.91E-04 1.83E-05 3.66E-05 1.10E-06 0.050 0.400 35.6 Monomer 1.00E-051.84E-03 2.19E-04 7.48E-05 9.29E-06 0.050 0.700 35.6 Monomer 1.00E-051.98E-04 1.98E-05 9.12E-05 9.12E-06 0.050 0.0053 35.6 Dimer 1.00E-054.77E-04 2.41E-05 1.17E-04 1.98E-05 0.050 0.0285 35.6 Dimer 1.00E-056.68E-04 2.59E-04 1.51E-04 2.16E-05 0.050 0.050 35.6 Dimer 1.00E-052.14E-03 5.95E-04 1.84E-04 3.28E-05 0.050 0.200 35.6 Dimer 1.00E-054.77E-03 4.90E-04 3.52E-04 2.44E-05 0.050 0.400 35.6 Dimer 1.00E-055.18E-03 9.37E-04 4.24E-04 4.99E-05 0.050 0.700 35.6 Dimer 1.00E-057.48E-03 9.49E-04 5.90E-04 8.81E-06 0.050 0.996 35.6 Dimer 1.00E-055.31E-04 1.22E-04 2.10E-06 5.95E-06 0.050 0.0053 35.6 Trimer 1.00E-056.23E-04 2.12E-04 2.80E-05 4.45E-05 0.050 0.0285 35.6 Trimer 1.00E-052.56E-03 6.38E-04 4.78E-04 1.10E-04 0.050 0.200 35.6 Trimer 1.00E-053.58E-03 1.06E-03 8.13E-04 1.81E-04 0.050 0.400 35.6 Trimer 1.00E-055.58E-04 1.06E-04 1.61E-05 1.97E-05 0.050 0.0053 35.6 Tetramer 1.00E-05
120

k1obs (s-1) 1σ k2obs (s-1) 1σ [NaOH] (M) [S2O82-] (M) Temp. (C) Species [Cr(III)]
(M) 8.29E-04 3.51E-04 2.05E-04 2.13E-05 0.050 0.0285 35.6 Tetramer 1.00E-051.86E-03 6.08E-04 3.72E-04 1.97E-05 0.050 0.050 35.6 Tetramer 1.00E-052.77E-03 1.30E-03 4.56E-04 1.18E-04 0.050 0.100 35.6 Tetramer 1.00E-054.81E-03 9.47E-04 8.46E-04 1.73E-05 0.050 0.200 35.6 Tetramer 1.00E-054.85E-03 6.17E-04 1.04E-03 1.45E-04 0.050 0.400 35.6 Tetramer 1.00E-056.20E-03 5.96E-04 7.17E-04 8.90E-05 0.050 0.700 35.6 Tetramer 1.00E-056.70E-03 5.75E-04 3.74E-04 8.80E-05 0.050 0.996 35.6 Tetramer 1.00E-052.04E-03 1.16E-03 3.97E-05 2.43E-05 0.010 0.028 35.6 Monomer 1.00E-051.87E-03 9.79E-04 3.18E-05 0.010 0.050 35.6 Monomer 1.00E-052.34E-03 1.20E-03 9.59E-05 1.90E-05 0.010 0.100 35.6 Monomer 1.00E-053.73E-03 1.12E-03 1.33E-04 4.68E-05 0.010 0.200 35.6 Monomer 1.00E-051.09E-02 4.15E-03 1.68E-04 5.23E-05 0.010 0.400 35.6 Monomer 1.00E-051.27E-02 9.82E-03 1.65E-04 2.48E-05 0.010 0.700 35.6 Monomer 1.00E-056.43E-04 2.78E-04 5.40E-05 3.70E-05 0.010 0.028 35.6 Dimer 1.00E-051.57E-03 4.60E-04 1.24E-04 2.20E-05 0.010 0.050 35.6 Dimer 1.00E-052.33E-03 8.15E-04 1.95E-04 5.82E-05 0.010 0.100 35.6 Dimer 1.00E-053.33E-03 1.55E-03 2.78E-04 1.07E-05 0.010 0.200 35.6 Dimer 1.00E-055.50E-03 3.40E-03 5.16E-04 1.21E-04 0.010 0.400 35.6 Dimer 1.00E-051.21E-02 4.85E-04 4.89E-04 3.23E-05 0.010 0.700 35.6 Dimer 1.00E-052.85E-02 5.62E-03 5.93E-04 1.64E-04 0.010 0.996 35.6 Dimer 1.00E-053.42E-03 4.19E-04 3.42E-03 4.19E-04 0.010 0.028 35.6 Trimer 1.00E-054.27E-03 6.64E-04 4.27E-03 6.64E-04 0.010 0.100 35.6 Trimer 1.00E-055.69E-03 1.28E-03 5.69E-03 1.34E-03 0.010 0.200 35.6 Trimer 1.00E-051.80E-03 1.20E-03 2.53E-04 1.99E-05 0.010 0.028 35.6 Tetramer 1.00E-052.06E-03 1.23E-03 3.25E-04 3.03E-05 0.010 0.050 35.6 Tetramer 1.00E-05
2.56E-05
121

k1obs (s-1) 1σ k2obs (s-1) 1σ [NaOH] (M) [S2O82-] (M) Temp. (C) Species [Cr(III)]
(M) 3.56E-03 1.08E-03 4.40E-04 6.21E-05 0.010 0.100 35.6 Tetramer 1.00E-054.59E-03 2.00E-03 5.62E-04 6.31E-05 0.010 0.200 35.6 Tetramer 1.00E-053.20E-03 3.27E-04 6.47E-04 9.38E-05 0.010 0.400 35.6 Tetramer 1.00E-055.48E-03 5.30E-04 6.43E-04 8.84E-05 0.010 0.700 35.6 Tetramer 1.00E-056.27E-03 7.60E-04 7.92E-04 5.91E-05 0.010 0.996 35.6 Tetramer 1.00E-05
122

Supporting Information: Observed rate constants obtained by fitting kinetic curves fit to equation 2. Ionic strength held constant at 3.0M with NaClO4 for dimer at room temperature experiments. kobs (min-1) 1σ [NaOH] (M) [S2O8
2-] (M) Temp. (C) Species [Cr(III)] (M) 0.011 0.003 1.50 0.030 22.2 Dimer 1.00E-04 0.020 0.006 1.50 0.050 22.2 Dimer 1.00E-04 0.028 0.005 1.50 0.080 22.2 Dimer 1.00E-04 0.033 0.005 1.50 0.100 22.2 Dimer 1.00E-04 0.057 0.007 1.50 0.200 22.2 Dimer 1.00E-04 0.081 0.006 1.50 0.310 22.2 Dimer 1.00E-04 0.065 0.020 0.50 0.005 22.2 Dimer 1.00E-04 0.103 0.012 0.50 0.008 22.2 Dimer 1.00E-04 0.109 0.026 0.50 0.010 22.2 Dimer 1.00E-04 0.142 0.012 0.50 0.022 22.2 Dimer 1.00E-04 0.186 0.006 0.50 0.050 22.2 Dimer 1.00E-04 0.225 0.002 0.50 0.100 22.2 Dimer 1.00E-04 0.326 0.026 0.50 0.400 22.2 Dimer 1.00E-04 0.340 0.027 0.50 0.600 22.2 Dimer 1.00E-04 0.364 0.043 0.50 0.800 22.2 Dimer 1.00E-04 0.365 0.034 0.50 0.889 22.2 Dimer 1.00E-04 0.049 0.013 0.50 0.001 22.2 Dimer 1.00E-04 0.080 0.021 0.33 0.001 22.2 Dimer 1.00E-04 0.140 0.010 0.33 0.005 22.2 Dimer 1.00E-04 0.105 0.032 0.33 0.008 22.2 Dimer 1.00E-04 0.143 0.030 0.33 0.010 22.2 Dimer 1.00E-04 0.130 0.035 0.33 0.022 22.2 Dimer 1.00E-04 0.181 0.011 0.33 0.050 22.2 Dimer 1.00E-04 0.210 0.021 0.33 0.100 22.2 Dimer 1.00E-04 0.297 0.024 0.33 0.400 22.2 Dimer 1.00E-04 0.319 0.045 0.33 0.600 22.2 Dimer 1.00E-04 0.321 0.052 0.33 0.800 22.2 Dimer 1.00E-04 0.321 0.052 0.33 0.964 22.2 Dimer 1.00E-04 0.062 0.012 0.25 0.001 24.2 Dimer 1.00E-04 0.114 0.009 0.25 0.005 24.2 Dimer 1.00E-04 0.123 0.012 0.25 0.008 24.2 Dimer 1.00E-04 0.129 0.012 0.25 0.010 24.2 Dimer 1.00E-04 0.154 0.012 0.25 0.050 24.2 Dimer 1.00E-04 0.184 0.014 0.25 0.100 24.2 Dimer 1.00E-04 0.266 0.001 0.25 0.400 24.2 Dimer 1.00E-04 0.275 0.023 0.25 0.600 24.2 Dimer 1.00E-04 0.285 0.016 0.25 0.800 24.2 Dimer 1.00E-04 0.298 0.014 0.25 1.000 22.2 Dimer 1.00E-04 0.079 0.013 0.10 0.001 22.2 Dimer 1.00E-04 0.125 0.006 0.10 0.005 22.2 Dimer 1.00E-04 0.124 0.002 0.10 0.008 22.2 Dimer 1.00E-04 0.133 0.004 0.10 0.010 22.2 Dimer 1.00E-04 0.107 0.025 0.10 0.022 22.2 Dimer 1.00E-04
123

kobs (min-1) 1σ [NaOH] (M) [S2O82-] (M) Temp. (C) Species [Cr(III)] (M)
0.162 0.016 0.10 0.050 22.2 Dimer 1.00E-04 0.147 0.014 0.10 0.100 22.2 Dimer 1.00E-04 0.232 0.017 0.10 0.200 22.2 Dimer 1.00E-04 0.258 0.008 0.10 0.400 22.2 Dimer 1.00E-04 0.301 0.006 0.10 0.700 22.2 Dimer 1.00E-04 0.295 0.011 0.10 0.980 22.2 Dimer 1.00E-04 0.128 0.005 0.05 0.022 22.2 Dimer 1.00E-04 0.154 0.020 0.05 0.050 22.2 Dimer 1.00E-04 0.193 0.005 0.05 0.100 22.2 Dimer 1.00E-04 0.213 0.008 0.05 0.200 22.2 Dimer 1.00E-04 0.243 0.022 0.05 0.400 22.2 Dimer 1.00E-04 0.283 0.009 0.05 0.700 22.2 Dimer 1.00E-04 0.309 0.005 0.05 0.909 22.2 Dimer 1.00E-04 0.008 0.000 1.00 0.005 22.2 Mix 1.00E-04 0.021 0.002 1.00 0.015 22.2 Mix 1.00E-04
0.031 0.004 1.00 0.025 22.2 Mix 1.00E-04 0.050 0.002 1.00 0.050 22.2 Mix 1.00E-04 0.167 0.007 1.00 0.250 22.2 Mix 1.00E-04 0.241 0.020 1.00 0.450 22.2 Mix 1.00E-04 0.301 0.002 1.00 0.650 22.2 Mix 1.00E-04 0.340 0.029 1.00 0.850 22.2 Mix 1.00E-04 0.357 0.010 1.00 0.980 22.2 Mix 1.00E-04 0.016 0.001 1.00 0.005 30.0 Mix 1.00E-04 0.062 0.004 1.00 0.025 30.0 Mix 1.00E-04 0.103 0.008 1.00 0.050 30.0 Mix 1.00E-04 0.321 0.014 1.00 0.250 30.0 Mix 1.00E-04 0.416 0.007 1.00 0.450 30.0 Mix 1.00E-04 0.503 0.032 1.00 0.650 30.0 Mix 1.00E-04 0.552 0.025 1.00 0.850 30.0 Mix 1.00E-04 0.547 0.054 1.00 0.980 30.0 Mix 1.00E-04 0.029 0.002 1.00 0.005 37.6 Mix 1.00E-04 0.099 0.008 1.00 0.025 37.6 Mix 1.00E-04 0.155 0.006 1.00 0.050 37.6 Mix 1.00E-04 0.458 0.023 1.00 0.250 37.6 Mix 1.00E-04 0.604 0.002 1.00 0.450 37.6 Mix 1.00E-04 0.707 0.030 1.00 0.650 37.6 Mix 1.00E-04 0.755 0.033 1.00 0.850 37.6 Mix 1.00E-04 0.769 0.024 1.00 0.980 37.6 Mix 1.00E-04 0.025 0.002 5.00 0.040 5.5 Mix 1.00E-04 0.034 0.001 5.00 0.060 5.5 Mix 1.00E-04 0.040 0.000 5.00 0.080 5.5 Mix 1.00E-04 0.044 0.001 5.00 0.100 5.5 Mix 1.00E-04 0.053 0.001 5.00 0.120 5.5 Mix 1.00E-04 0.123 0.003 5.00 0.040 21.6 Mix 1.00E-04 0.163 0.004 5.00 0.060 21.6 Mix 1.00E-04
124

125
kobs (min-1) 1σ [NaOH] (M) [S2O82-] (M) Temp. (C) Species [Cr(III)] (M)
0.213 0.005 5.00 0.080 21.6 Mix 1.00E-04 0.253 0.011 5.00 0.100 21.6 Mix 1.00E-04 0.281 0.011 5.00 0.120 21.6 Mix 1.00E-04 0.329 0.006 5.00 0.140 21.6 Mix 1.00E-04 0.227 0.022 5.00 0.040 30.8 Mix 1.00E-04 0.321 0.012 5.00 0.060 30.8 Mix 1.00E-04 0.426 0.015 5.00 0.080 30.8 Mix 1.00E-04 0.467 0.040 5.00 0.100 30.8 Mix 1.00E-04 0.566 0.022 5.00 0.120 30.8 Mix 1.00E-04 0.650 0.017 5.00 0.140 30.8 Mix 1.00E-04 0.442 0.036 5.00 0.040 41.0 Mix 1.00E-04 0.582 0.055 5.00 0.060 41.0 Mix 1.00E-04 0.728 0.065 5.00 0.080 41.0 Mix 1.00E-04 0.840 0.069 5.00 0.100 41.0 Mix 1.00E-04 0.963 0.074 5.00 0.120 41.0 Mix 1.00E-04 1.065 0.059 5.00 0.140 41.0 Mix 1.00E-04