specialist health and resilient environment (share) service · specialist health and resilient...
TRANSCRIPT

Children’s Social Care Innovation Programme Evaluation Report 33
Specialist Health and Resilient Environment (SHARE) Service Evaluation report
July 2017
Ana Calderón, Julian Edbrooke-Childs, Louise Chapman, Jessica Rees, Marjolein Maas and Miranda Wolpert – Anna Freud National Centre for Children and Families
John Rodger and Matthew Cutmore – York Consulting
2
Contents
List of figures 5
List of tables 6
Executive summary 6
Summary of the project and evaluation 7
Methodology 7
Key findings 8
What were the facilitators to implementing and sustaining SHARE? 11
What were the barriers to implementing and sustaining SHARE? 11
How can SHARE be sustained in the long-term? 12
Summary of implications and recommendations for policy and practice 12
Overview of the project 14
What the project was intending to achieve 14
What the project was intending to do to achieve these outcomes 14
Overview of relevant existing research relating to this innovation 15
Changes to the project’s intended outcomes or activities 15
Context within which this innovation has been taking place 16
Overview of the evaluation 18
Evaluation questions 18
Methodology used to address these questions 18
Focus groups with staff and interviews with parents, carers and young people 19
Changes to evaluation methodology from the original design 20
Key findings 22
Characteristics of SHARE and of young people in SHARE 22
Does SHARE reduce the number of young people becoming engaged in statutory
social care services? 23
SHARE data 23
Contextual data 23
What led young people to crisis? 25
Does SHARE improve the quality of care provision for young people who are or
might become engaged in statutory social care services? 28

3
Parents 28
What is the impact of SHARE on young people’s mental health? 30
Young people 30
Routinely collected data 31
What might be some of the mechanisms by which SHARE reduces the number of
young people becoming engaged in statutory social care services? 34
Parents 34
Young people 36
Focus Groups 37
What is staff’s experience of SHARE? 37
Focus Groups 37
Observation tools 38
What are young people’s and parents’ experiences of SHARE? 38
Parents 38
Young people 41
What are the barriers and facilitators to implementing and sustaining SHARE? 44
Facilitators 44
Barriers 45
What are the results of SHARE’s cost-benefit analysis? 46
CBA Constraints 46
SHARE support typology 46
The Costs 46
The benefits: removal of adverse outcomes 47
Estimating outcomes 48
Summary of monetised adverse outcomes avoided 50
Fiscal return on investment (FROI) 50
Sustainability 50
Conclusions 51
Recommendations 51
Limitations of the evaluation and plans for the future 52
Limitations of this evaluation 52

4
Appropriateness of evaluation approach 53
Capacity built for future evaluation and the sustainability of the evaluation 53
Recommendations for future evaluation 54
Implications and recommendations for policy and practice 55
Capacity and sustainability of this innovation 55
Conditions necessary for this innovation to be embedded 55
Consideration of future development of this innovation and wider application 56
References 58
Appendices 59
Appendix A: Wigan’s theory of change 59
Appendix B: SHARE Looked After Children (LAC)/ Child In Need (CIN) figures 60
Appendix C: SHARE routinely collected data (September 2015 to Sept 2016) 61
The Health of the Nation Outcome Scales, Child and Adolescent Mental Health
(HoNOSCA) 61
Strengths and Difficulties Questionnaire (SDQ) 62
Appendix D: Experience of Service Questionnaire (CHI_ESQ) 65
Parents 65
Young people 65
Appendix E: Contextual data (Source: Wigan Council) 66
Number of children in care 66
Rate of children in care 67
Rate of children entering care 68
Rate of children leaving care 69
Children entering care for a second or subsequent time 70
Children returning home 72
Children re-referred to social services 74
Children in residential care 76

5
List of figures
Figure 1: Rate of 11 to 18 year old children who entered and left care before and
after the implementation of SHARE (T1 and T2, respectively) per 10,000 children in
Wigan. 24
Figure 2: Individual HoNOSCA trajectories (from T1 to T2) for 26 young people in
SHARE who had paired data. 32
Figure 3: HoNOSCA trajectory of 4 young people with 7 or more data points. 32
Figure 4: Frequency of answers given to CHI-ESQ questions by interviewed parents.
40
Figure 5: Frequency of answers given by interviewed young people to CHI-ESQ
questions by interviewed young people. 43
Figure 6: Number of children who were in care by age and month 66
Figure 7: Rate of children in care per 10,000 children in Wigan by age and month 67
Figure 8: Rate of children entering care per 10,000 children in Wigan by age and
month 68
Figure 9: Rate of children leaving care per 10,000 children in Wigan by age and
month 69
Figure 10: Percentage of children entering care for second or subsequent time out
of all the children entering care in Wigan by age and month 71
Figure 11: Percentage of children returning home out of all the children leaving care
in Wigan by age and month 73
Figure 12: Percentage of children who were re-referred to social services out of all
the children referred to social services 75
Figure 13: Percentage of children who were in residential care out of all the children
in care 77
6
List of tables
Table 1: Monetised outcomes for 11 closed cases 49
Table 2: Monetised adverse outcomes avoided 50
Table 3: Descriptive statistics of HoNOSCA 61
Table 4: Descriptive statistics of all the SDQ sub-scales and Total Difficulties Scale
62
Table 5: Frequency of young people who were in the clinical and non-clinical group
according to young people and parents in all the SDQ subscales and the Total
Difficulties Scale 62
Table 6: Clinical change in young people reported by young people and parents in all
the SDQ subscales and Total Difficulties Scale 63
Table 7: Reliable change in young people reported by young people and parents in
all the SDQ subscales and Total Difficulties Scale 63
Table 8: Reliable change and clinical change in young people reported by young
people and parents in all the SDQ subscales and Total Difficulties Scale 64
Table 9: Number of children who were in care by age and month 66
Table 10: Rate of children in care per 10,000 children in Wigan by age and month 67
Table 11: Rate of children entering care per 10,000 children in Wigan by age and
month 68
Table 12: Rate of children leaving care per 10,000 children in Wigan by age and
month 69
Table 13: Number and percentage of children entering care for second or
subsequent time out of all the children entering care in Wigan by age and month 70
Table 14: Number and percentage of children returning home out of all the children
leaving care in Wigan by age and month 72
Table 15: Number and percentage of children who were re-referred to social services
out of all the children referred to social services 74
Table 16: Number and percentage of all the children in care who were in residential
care 76

7
Executive summary
Summary of the project and evaluation
The aim of SHARE (Specialist Health and Resilient Environment), which is an
extension or renewal of existing support services provided in routine hours, was to
implement a model of supporting young people at risk of becoming engaged with
statutory social care services as a result of complex emotional and behavioural
problems. SHARE works with young people aged from 11 to 17 over a period of at
least 12 weeks, including support for their family and access to psychiatric and
psychological services. SHARE’s team includes a registered manager, clinical
psychologist, advanced mental health practitioners, social workers, key workers and
support workers.
The primary outcome of SHARE was a reduction in the number of young people
becoming engaged in statutory care services due to parents or carers being unable
to manage the presenting risk in relation to complex mental health issues. To
achieve the full implementation of SHARE, there were 4 objectives:
the development of a new specialist multi-professional team
the implementation of a new integrated duty system with a single assessment
of need and single care pathway for this group of young people, enabling
capacity for crisis response (see Appendices for single assessment form)
the provision of a residential setting that could work in a flexible way to provide
a crisis response to this group of young people, and bridging placements that
would support transitions back to family based care
the training of a cohort of specialist foster carers who could provide a similar
model of care as described above, and support their peers in being able to
provide permanent placements for this cohort, where appropriate
Methodology
An explanatory case study design was employed to explore and describe SHARE
and also to develop theories of the causal mechanisms of the impact of SHARE on
young people’s outcomes. A quantitative, multi-level, mixed methods design was
used with a qualitative component to triangulate the quantitative data. The evaluation
comprised:
routinely collected clinical data
quantitative data at local authority level

8
parents’ and young people’s experience data
qualitative data (such as interviews with young people and parents, and focus
groups with professionals involved in SHARE)
SHARE’s staff observation tools.
Key findings
Through the implementation of SHARE, evidence from this evaluation suggests that
the primary outcome was achieved. Evidence suggests that during SHARE’s single
assessment, all 37 young people who entered SHARE between October 2015 and
the beginning of October 2016 were reported by staff as being at risk of requiring
respite or planned short term breaks (defined as a Child in Need – CIN). However,
during SHARE only 7 (19%) became Children in Need (CIN). After the single
assessment, an assessment by a social worker and advanced mental health
practitioner identified that 19 (out of the 37) were at risk of becoming looked after
(LAC) by the local authority if services did not get involved. Out of these 19, only 2
(11%) became LAC whilst in SHARE.
Contextual data showed mixed results, and future evaluations could examine the
impact of SHARE on rates of LAC and LAC leaving care, as an indication of
placement stability across Wigan once it is rolled out county-wide. For example, on
the one hand, contextual data showed that the mean rate of 11 to 18-year old
children and young people becoming a LAC in Wigan per 10,000 children decreased
from Time 1 (October 2014 to September 2015) to Time 2 (October 2015 to July
2016). On the other hand, contextual data also showed that the rate of 11 to 18-year
old LAC leaving care at Wigan decreased from Time 1 to Time 2. When interpreting
these results, it is important to keep in mind that causality should not be inferred, as
contextual data includes a larger group of children and young people than the ones
accessing SHARE, and other factors than SHARE might be influencing changes
and/or fluctuations in numbers in contextual data.
Implication and recommendation: a longer time-frame and a bigger cohort of young
people would be needed to observe changes in LAC rates associated with SHARE
at local authority level. This could provide evidence of the impact of SHARE on rates
of children going into care. Nonetheless, these are useful indications of what SHARE
could do in the future to evaluate their services.
The following questions arose from SHARE:
does SHARE improve the quality of care provision for young people who are,
or might become, engaged in statutory social care service?

9
what might be some of the mechanisms by which SHARE reduces the
number of young people becoming engaged in statutory social care services,
and which aspects are most beneficial?
what is staff’s experience of SHARE?
what are young people’s and parents’ experiences of SHARE?
Regarding the first question, where parents had negative expectations of SHARE
based on previous experiences with other services, they reported that SHARE
provided a reliable service that could be accessed easily in crisis situations. Young
people reported a positive impact of SHARE’s care: for example, an improved
understanding of emotions; an improved ability to express emotions; increased
confidence; feeling able to ask for help; more positive future thinking; working though
specific difficulties such as with eating, self-harm, family relationships, or medication;
and improved social communication. Outcome data showed that, as a group, young
people’s mental and physical health and social functioning (as reported by clinicians)
improved from assessment to the second measurement point, and from the second
measurement point to the third (controlling for length of time between
measurements), but did not show a significant difference between assessment and
last measurement point (controlling for length of time between measurements). It
was not possible to conduct an analysis of the Strength and Difficulties
questionnaires completed by young people and parents, because of the small
sample size. In terms of implications and recommendations, larger sample sizes and
longer follow-up periods would be needed to provide more robust conclusions,
because changes in empowerment, mental health, wellbeing and resilience might
take longer to be reflected in the standardised measures. In addition, a measure
such as the Goals and Goal Based Outcomes (Law & Jacob, 2013) could be used to
record the specific changes that young people are interested in and that go beyond
symptom change, such as being able to take the bus or feel confident to express
opinions, although it may be less suitable for use in episodes of crisis.
In terms of the mechanisms by which SHARE reduced the number of young people
becoming engaged in statutory social care services, parents and staff felt that
SHARE improved their mental health and wellbeing by increasing parental
knowledge of their young person’s treatment, and by providing them with practical
skills and strategies that increased their self-confidence and enabled them to cope
better in crisis situations. Young people reported that SHARE’s support and out-of-
hours accessibility prevented the escalation of risk and met their multiple needs. In
addition, person-centred characteristics of the SHARE team, such as being down to
earth, non-judgemental, relaxed, reliable, good listeners, caring, and genuine,
allowed young people to feel safe, to feel comfortable and to build strong therapeutic
relationships. Both young people and staff highlighted the multi-disciplinary team
(MDT) as crucial to SHARE’s success.
10
According to staff, the MDT was the mechanism by which the service more
effectively met the needs of young people because – as reported by them – the right
colleagues with the right areas of expertise were able to come together efficiently to
address the children’s, young people’s and families’ needs. These positive outcomes
were ascribed to increased information sharing and sharing of expertise, in addition
to high levels of staff support. Staff also described SHARE as filling an important gap
left by other services in the care for children, young people and families, in terms of
providing out-of-hours care, intensive input to the whole family and safer care
resulting from information-sharing and collaboration between disparate
organisations. SHARE’s relational focus seems to be central to the many benefits
reported in interviews by parents and young people. Therefore, this evaluation
supports the change in policy of moving the focus from a transactional service to a
relational one. Learning from SHARE should be spread to other services to help
promote a focus on crisis service provision that is organised around the needs of
children and families.
Regarding staff’s experience of SHARE, staff reported high levels of job satisfaction
compared to previous roles, which was explained by the ability to make a difference
to the lives of children, young people and families, and collaborating with, and
learning from, colleagues. In particular, feeling supported by colleagues was talked
about as a source of job satisfaction, as was having ownership and flexibility to work
in an innovative way. Staff also reported that, during their work with other staff
members, there were opportunities to identify risks and discuss concrete plans to
mitigate these risks; that everyone had the opportunity to contribute during
discussions, and that all points of view were respected. Building on the success of
the cross-sector working and the multi-disciplinary team, cross-sector training would
be recommended to further integrate staff across both health and social care.
Overall, parents reported high levels of satisfaction with SHARE in all data strands:
all 12 interviewed parents reported a positive experience of SHARE; 7 out of the 8
parents who agreed to complete the Experience of Service Questionnaire (CHI-ESQ)
after the interview reported that they were satisfied overall with SHARE; and the 5
parents who completed SHARE’s feedback questionnaire, provided by SHARE’s
staff, also reported high levels of satisfaction with staff and the model. As with
parents, young people also reported high levels of satisfaction in all data strands: all
10 young people interviewed described a positive experience of using the SHARE
service; all 9 young people who agreed to complete the CHI-ESQ after the interview
reported that they were satisfied overall with SHARE; and the 9 young people who
completed SHARE’s feedback questionnaire provided by SHARE’s staff also
reported high levels of satisfaction with staff and the model. This highlights the
importance and impact of a holistic approach such as the one implemented by
SHARE.

11
What were the facilitators to implementing and sustaining SHARE?
The MDT was seen as a facilitator to implementing and sustaining SHARE, as it
allowed staff to share information and expertise, leading to enhanced inter-collegial
support for staff and better support for children, young people, and families. In
addition, MDTs made staff feel better supported by colleagues in SHARE, compared
to previous positions, and therefore better able to support children, young people
and families.
Related to the above, staff discussed the team approach to cases as being a unique
strength of SHARE, which increased staff confidence as they then had the skills and
knowledge of colleagues to draw on. Decisions were also made in an informed
manner as different members of the MDT were involved.
Another facilitator was the flexibility to work in an innovative way, which meant that
challenges could be efficiently and effectively addressed. This in turn brought high
levels of job satisfaction and enthusiasm to make things work, which was felt by
parents and young people. Flexibility also allowed SHARE to address ongoing
issues and come up with solutions that were adequate for the local context.
An integrated and well-organised MDT, plus flexibility to work in an innovative way,
seemed to motivate and empower staff which in turn had a positive impact on young
people, parents and families.
What were the barriers to implementing and sustaining SHARE?
The implementation of SHARE was not without challenges. One of those was
establishing cross-sector working through the MDT. In particular, even though the
MDT was seen as a facilitator, staff reported that initially there was confusion over
the different roles. This was present across the project: at the implementation board
level, heads of departments had to work together to coordinate efforts, and, at
implementation level, staff from different working backgrounds had to adjust their
practice.
Another barrier to the innovation was the communication of SHARE to other
services: some staff reported tensions with other services raised by a lack of
awareness about the programme.
Despite innovation and flexibility being reported as facilitators, they were also
reported as barriers because it meant that processes and procedures had to be
developed from scratch. This process was described by some staff as being
12
unwieldy in the first instance and requiring refinement over time. In line with this,
disparate information systems were a barrier to the implementation of this innovation
because it led to problems of sharing information and a duplication of paperwork.
This resulted in a large amount of administrative work and duplication of reports and
information needing to go to different services.
Integration of SHARE with other services is crucial and requires an improvement of
infrastructure and data sharing to facilitate efficient cross-sector working. This may
also result in improved data collection systems, meaning additional analyses could
be conducted to inform the evaluation of SHARE, such as examining whether
demographic and case characteristics moderate the impact of SHARE on mental
health outcomes, and the associations between using SHARE and changes in
academic attainment.
How can SHARE be sustained in the long-term?
Cost-benefit analysis (CBA), conducted by our partner York Consulting, calculated
an optimistic Fiscal Return on Investment (FROI) of 3.3 (i.e., all outcomes sustained
for 12 months), which translates into savings of approximately £3.3 for every £1
invested in SHARE. Even under the most pessimistic scenario (which would be 50%
of all outcomes sustained for 12 months), FROI remained positive and was 1.7.
These results support SHARE’s long-term sustainability. Wider dissemination of
SHARE to increase knowledge and accessibility is needed. However, this should be
contingent on confidence in future funding and staffing capacity.
Summary of implications and recommendations for policy and practice
In Wigan there is a need for SHARE to provide appropriate care for young people
and families in crisis, as indicated by the findings of this evaluation. In particular,
parents in interviews reported that their, and their children’s, needs required support
that other services were unable to provide, and young people in interviews said that
SHARE’s breadth of support met their multiple needs. Staff in focus groups stated
that MDT work effectively met the needs of young people and parents because the
right colleagues, with the right areas of expertise, were able to come together
efficiently to address their needs.
Within this context, wider dissemination of information about SHARE would help the
innovation to be embedded and to reach a greater number of young people and
parents. However, dissemination would also mean that more young people and
families would access SHARE, and hence more resources would be needed in order
to cope with future staffing and demand. Therefore, funding for the programme

13
would need to be secured so that service users did not become reliant on a service
that might then be withdrawn in the future.

14
Overview of the project
The project evaluated the implementation and initial outcomes of SHARE (Specialist
Health and Resilient Environment), which is an extension or renewal of existing
support services provided in routine hours. It aims to implement a model of
supporting young people at risk of becoming engaged in statutory social care
services as a result of complex emotional and behavioural problems. SHARE works
with young people aged from 11 to 17 over a period of at least 12 weeks, including
support for their family, and access to psychiatric and psychological services.
SHARE’s team includes a registered manager, clinical psychologist, advanced
mental health practitioners, social workers, key workers and support workers.
What the project was intending to achieve
The primary outcome was a reduction in the number of young people becoming
engaged in statutory social care services (for example, Looked After Child, Child
Protection Plan, Child in Need) due to parents or carers being unable to manage the
presenting risk in relation to complex mental health issues.
The secondary outcomes were:
a reduction in the number of young people who become engaged in statutory
social care services following discharge from an inpatient mental setting
a reduction in the number of young people being admitted to inpatient mental
health settings
a reduction in the number of young people engaged in statutory social care
services accommodated in residential care provision
an increase in the number of young people engaged in statutory social care
services accommodated in foster care or family placements
an increase in the number of young people who could remain in the care of the
parents
What the project was intending to do to achieve these outcomes
To achieve the full implementation of SHARE, there were 4 objectives:
the development of a new, specialist, multi-professional team

15
the implementation of a new, integrated, duty system with a single assessment
of need and single care pathway for this group of young people, enabling
capacity for crisis response (see Appendices for single assessment form)
the provision of a residential setting that could work in a flexible way to provide
a crisis response to this group of young people and bridging placements that
would support transitions back to family based care
the training of a cohort of specialist foster carers who could provide a similar
model of care as described above, and support their peers in being able to
provide permanent placements for this cohort, where appropriate
Overview of relevant existing research relating to this innovation
It is known that 75% of adult mental health problems begin before age 18 and, that
of those adults who are diagnosed with a psychiatric disorder by the time they are
26, half had a disorder before age 15, rising to three-quarters (75%) by the age of 18
(Kim-Cohen, 2003). Children in care, and care leavers, are more likely to attempt
suicide than their peers; are more likely to enter the criminal justice system; and are
more likely to experience poor heath, educational and social outcomes (House of
Commons, 2016). Specifically, 45% of looked after children, aged 5-17 years, were
assessed as having a mental disorder (Meltzer et al., 2003). This presents as an
issue for both health and social care.
The costs associated with poor mental health across the lifetime are startling. For
mental health disorders, the annual short-term costs of disorders among children
aged 5–15 in the UK are estimated to be £1.58 billion and the long-term costs £2.35
billion (Strelitz, 2012). For the population with emotional disorders, currently aged 5-
16, the long-term effects of adolescent depression projected into adulthood, are
estimated to have a total annual cost of £301 million; the cost of crime attributable to
adults who had conduct problems in childhood is estimated at £60 billion a year in
England and Wales (Strelitz, 2012).
Changes to the project’s intended outcomes or activities
The only major change to the intended outcomes or activities, as funded by the
Social Care Innovation Fund Programme, is that, at the time this report was written,
SHARE House was still not opened. Delays in its implementation were due to
various problems with the first house that was intended to become the SHARE
house, the difficulties of finding a second house, and some administrative delays
with Ofsted.

16
A further minor modification to SHARE’s activities had to do with zoning. SHARE’s
multi-disciplinary team was going to meet daily to review each young person and
identify whether they were presenting as “high”, “medium” or “low” risk. This would
then indicate the levels of support or response needed for that day. This was not
possible, due to everyday work related activities and the consequently inconsistent
availability of staff in the office at any one time. However, they compromised and
undertook the zoning activity on a weekly basis during multi-disciplinary team
meetings, where each young person was discussed and the team planned the
support for the next week. In addition, informal updates to team members on
contemporary risk information are provided daily as required.
Thirdly, there was a low recruitment of foster carers. The original bid stated that the
level of foster carers being accessed would be a minimum of 2, and, at first, 2 sets of
foster carers expressed an interest to be included in the project. However, only one
pair (2 people) ended up agreeing to take part. Out of those 2 people, one dropped
out and one is still fully involved. The SHARE team believes that, in the future, there
is a place for foster carers to remain involved as an additional support mechanism.
However, the recruitment of these carers would need to be carefully considered, as
foster parents need to support young people who present complex needs (for
example, suicide ideation and self-harm).
Context within which this innovation has been taking place
Wigan Borough includes the towns and villages of Leigh, part of Ashton-in-
Makerfield, Ince-in-Makerfield, Hindley, Orrell, Standish, Atherton, Tyldesley,
Golborne, Lowton, Billinge, Astley, Haigh and Aspull. Its estimated mid-2015
population was 322,022 people, of which 23% (74,777) were estimated to be under
19 years of age (ONS, 2016). Regarding gender of people under 19, 49% were
female. Wigan was ranked 63rd most deprived LA out of 152 LAs in England in 2015
(1st being most deprived), with 15% of pupils in primary school and 13% of pupils in
secondary school eligible for free school meals (compared to 16% and 14% in
England, respectively) (GOV.UK, 2016). Of young people aged 16-18 years in
Wigan, 5% were not in education, employment or training in 2015, compared to 4%
in England.
In 2016, Wigan Borough had 46,386 pupils in 134 schools, 18 academies and 20
Sure Start Children Centres; 4% primary pupils’ and 3% secondary pupils’ first
language was other than English (compared to 20% and 16% in England,
respectively). The rate of looked after children (LAC) per 10,000 children aged under
18 in 2015 was 75 (and in England was 60), whilst the rate of children in need per
10,000 in 2015 was 371.9, and in England was 337.3 (GOV.UK, 2016). There are 5

17
residential children’s homes for children in care in Wigan: 2 provide long-term care
and 3 provide short term breaks (Wigan Council, 2016).
Wigan does not have an in-patient mental health facility for children and young
people, but uses Fairhaven Young People’s Unit, which is approximately 10 miles
from Wigan’s city centre. This entails that all children and young people’s mental
health Tier 4 admissions are made outside the LA’s borders.
Wigan Council and Wigan Borough Clinical Commissioning Group report that the
problem of acute mental health among adolescents, and the mental health of
children in care or at the edge of care, is present across Wigan Borough, but is most
prevalent in the towns and villages of Wigan, Standish, Aspull, Shevington,
Winstanley, Billinge and Orrell.
In 2014, when SHARE’s proposal was first submitted, Wigan Council and Wigan
Borough Clinical Commissioning Group reported that in Wigan there were:
406 young people present at hospital with acute mental health problems – this
costs the hospital £350K per annum
20 of the young people (above) present at accident and emergency which
costs the health and social care system £861K per annum (based on a
detailed analysis of costs for 7 cases and extrapolated for the 20)
7 young people each year become looked after for varying periods of time, due
to mental health challenges which costs £63K per annum
95 young people with mental health challenges are currently in care within the
borough, costing £6.1M per annum
24 young people with mental health challenges are in care outside the borough
at a cost of £3.2M per annum. Cost benefit analysis suggests that preventing 4
of these 24 young people from being placed in out of Borough residential care
will save the cost of this project beyond the period of investment
2,122 young people identified as ‘in need’, that have an increased likelihood of
developing mental health issues and presenting themselves to the system at a
crisis point

18
Overview of the evaluation
Evaluation questions
The primary research question was: does SHARE reduce the number of young
people becoming engaged in statutory social care services?
The secondary questions were:
does SHARE improve the quality of care provision for young people
experiencing emotional or behavioural crisis, who are, or might become,
engaged in statutory social care services, as measured by a reduction in the
number of young people admitted to A&E and inpatient units, for example?
what might be some of the mechanisms by which SHARE reduces the number
of young people becoming engaged in statutory social care services, and what
aspects of the 4 components (specifically, specialist multi-professional team,
integrated duty system with a single assessment of need and single care
pathway, residential setting, or training of specialist foster carers) are most
beneficial?
what is staff’s experience of SHARE?
what is the young people and parents or carers’ experience of SHARE?
what are the barriers and facilitators to implementing and sustaining SHARE?
how can SHARE be sustained in the long-term?
what is the feasibility of collecting economic data for cost benefit analysis?
Methodology used to address these questions
An explanatory case study design was employed to explore and describe SHARE,
and also to develop theories of the causal mechanisms of the impact of SHARE on
young people’s outcomes. A quantitative, multi-level, mixed methods design was
used with a qualitative component to triangulate the quantitative data.
The evaluation comprised the following strands:
routinely collected clinical data was analysed to explore how appropriately
young people’s mental health needs were met by SHARE
quantitative data was used to examine changes in young people’s service
utilisation and outcomes from before, during and after SHARE, using data
19
already collected as part of case management systems in Children’s Social
Care
patient experience data was gathered using routinely collected experience
surveys (which were administered after the implementation of SHARE –
supplemented with other experience of service measures) were analysed to
understand the impact of these services on young people’s and parents or
carers’ experience of care
qualitative data (namely, interviews with young people and parents, and focus
groups with professionals involved in SHARE) was analysed to understand
how experience of SHARE compared to previous experiences with other
support services and how service users’ and providers’ needs were met; the
barriers and facilitators to implementation; and what led young people to crisis,
to inform how SHARE could be further revised to better meet the needs of
young people to prevent crisis and placement breakdown
participant observation tools were used to collect data by professionals in
SHARE to gain detailed understanding of the experience of these services
York Consulting led the cost-benefit analysis (CBA)
Focus groups with staff and interviews with parents, carers and young people
All SHARE staff were invited to participate in focus groups. Before conducting the
focus groups, researchers explained the aims of the focus groups, provided
information sheets to participants, and answered their questions. Staff consent for
focus groups was recorded.
Overall, 17 staff took part in 3 focus groups conducted in December 2015, which
included 5 key workers, 3 managers, thee support workers, 2 social workers, 2
advanced mental health practitioners, one clinical psychologist, and one residential
care worker. All focus groups were conducted in December 2015. Five participants
were male and the rest were female. The mean age of participants was 39 years
(ranging from 24 to 55 years). In terms of ethnicity, all participants were white,
except for one, who was black. Only 2 participants worked part-time and one
participant did not answer. The average years’ experience working with a similar
population was 13 years (ranging from 2 to 31 years).
Parents and young people were invited to participate in interviews by SHARE staff,
who provided an information sheet explaining the study. If parents of young people
were interested in participating, they completed the Expression of Interest form,
which was then sent to researchers at AFNCCF. Researchers then contacted
potential participants and agreed on a specific date and place for the interviews. A
20
full explanation of the research was provided to parents and young people before the
beginning of the interviews. Interviewees gave their informed consent to be
interviewed, and for the researcher to record and transcribe the interview.
A total of 12 parents of 10 young people were interviewed; 11 were parents and one
was a grandmother; hence, none were carers. The average age of parents was 47
(SD=10.01), and ranged between 34 and 62 years. Regarding gender, 8 parents
were female, 3 were male and one did not have demographic information. Ten
parents reported being white and 1 was mixed race. In terms of marital status, 6
were married, 4 were divorced and 1 had never been married. Regarding
occupation, 6 worked in the public sector, 2 were self-employed, and one was
retired.
Ten young people were interviewed. At the time of the interview, one young person
was in foster care, one was in Tier 4, and the rest were living at home. Ages ranged
between 13 and 17 (average age=16, SD=1.2); 6 of them were female, 3 were male
and one was transgender. Regarding ethnicity, 8 were white, one mixed race and
one not declared. In terms of education, one young person was in Year 9, 2 in Year
11, and 5 in college, and 2 were not declared.
Changes to evaluation methodology from the original design
Due to the extension of SHARE, qualitative data collection was also extended until
end of July 2016 and quantitative data collection was extended until beginning of
October 2016. As the SHARE house was not open by the time this report was
written, it could not be evaluated.
The original economic evaluation partner did not have the capacity to carry out this
aspect of the evaluation, due to unexpected lack of staffing. Therefore York
Consulting conducted the economic evaluation. We were only expecting to be able
to examine the feasibility of collecting data for CBA and as there was more data
available, results of the CBA analysis are presented below.
The evaluation team at Anna Freud National Centre for Children and Families were
recently (Monday 14th November) informed by Wigan Council that 2 young people
who were known to SHARE had unfortunately passed away in the first 2 weeks of
November; one young person who had engaged with the service for the last 6
months died by suicide and cause of death of the other young person, who had just
been introduced to the service in October, is still “not stipulated”. Data collection for
the evaluation was completed in the beginning of October 2016 and, therefore, we
have not been able to report on these tragic deaths in our evaluation report. Nothing
similar happened whilst we were conducting the evaluation. Wigan Council and their

21
partners via the Warwickshire Safeguarding Children Board are currently following
protocols to examine what led each young person to this situation, and to determine
whether there are any lessons to be learnt, and will provide details in writing to DfE
once these enquires are concluded. Nevertheless, Wigan Council, SHARE, and
AFNCCF wanted to include a note in our evaluation report to ensure transparency.

22
Key findings
This section presents a summary of all the results obtained for SHARE. For all the
results that were available please refer to the Appendices, except for the qualitative
analysis of the parents and young people’s interviews which are available on
request.
Characteristics of SHARE and of young people in SHARE
The total number of cases referred to SHARE between October 2015 and the end of
October 2016 was 60 young people. Out of those, 17 (28%) were rejected by
SHARE and 43 (72%) accepted. Referral rejection would occur when the young
person being referred did not meet the service criteria; for example, the young
person may have presented within the community with anxiety or depression but had
no hospital attendance or were not at risk of Tier 4 or becoming LAC, or may have
been a young person with significant social care or behavioural issues without
significant mental health issues. The 43 cases that were admitted to SHARE would
otherwise have been referred to Social Services, hence acceptance of those
referrals implied a reduction in caseload size for social worker at Wigan.
Out of the 43 accepted cases, 17 (40%) were males and 26 (60%) females. The
mean age was 16 years (SD=1.24), and ranged from 13 to 17. In addition, out of the
43 accepted referrals 22 (51%) of them were closed by late October 2016. The
average length of SHARE’s involvement in the closed cases was 22.3 weeks
(range=5.3 to 46.3 weeks). Only one young person has been re-admitted to SHARE
after being discharged.
Of the 21 cases that were open by the end of October 2016, 9 of them had been
referred by Social Care, 8 by Child and Adolescent Mental Health Services
(CAMHS), 3 by CAMHS Assessment and Response Team (CART) and one from
Tier 4. Two social workers had 10 to 11 cases each, and 6 key workers had 3 to 4
cases each.
From September 2015 until the end of October 2016, SHARE supported young
people in activities 164 times; provided therapeutic support to young people 67
times; had 3,097 telephone contacts, and visited young people on 296 occasions.

23
Does SHARE reduce the number of young people becoming engaged in statutory social care services?
SHARE data
During SHARE’s single assessment, all 37 young people who entered SHARE
between October 2015 and the beginning of October 2016 were identified by
clinicians as at risk of requiring respite or planned short-term breaks (defined as a
Child in Need – CIN). During SHARE, only 7 (19%) became Children in Need (CIN).
Furthermore, during the initial assessment that each young person accessing
SHARE had with a Social Worker and an Advanced Mental Health Practitioner, a
trajectory outlining the potential risks in this area if nothing were to be put in place
was conducted. Out of the 19 young people who, during that assessment, were
identified by clinicians as at risk of becoming LAC if there were no services involved,
only 2 (11%) became LAC whilst in SHARE.
Contextual data
In order to answer this question, we compared the local authority indicators for the
year before SHARE started (October 2014 to September 2015, or T1), to the period
after SHARE was implemented (October 2015 to July 2016, or T2). Tables and
figures for children aged 0 to 10, and 11 to 18 in Wigan, for all the indicators
presented below, can be found in the Appendix. In this section we present a
summary of results for children aged 11 to 18 as that is the age range covered by
SHARE.
The mean number of 11 to 18- year old children who were LAC in Wigan per month
increased from 200 (range= 197 to 203) at T1 to 205 (range=199 to 209) at T2. On
the same lines, the mean rate of LAC children and young people aged 11 to 18 per
10,000 children in Wigan per month increased from 78.9 (range=77.7 to 80) in T1 to
80.7 (range=78.4 to 82.4) in T2.
In terms of the rate of children and young people becoming LAC per month in Wigan
per 10,000 children, the mean rate for 11 to 18-year old children decreased from 1.3
(range=0.4 to 2.4) at T1 to 1 (range= 0 to 2.4) at T2. On the other hand, the rate of
11 to 18-year old LAC leaving care in Wigan per month decreased from 2 (range=
0.8 to 2.8) at T1 to 1.8 (range=0.8 to 3.2) at T2. However, data presented important
fluctuations between the months that composed T1 and T2, as shown in Figure 1
below.

24
Figure 1: Rate of 11 to 18 year old children who entered and left care before and after the
implementation of SHARE (T1 and T2, respectively) per 10,000 children in Wigan.
Source: Wigan council
The mean percentage of children aged 11 to 18 becoming LAC per month for a
second or subsequent time (out of all the children who entered care), decreased
from 6% (range=0% to 18%) at T1 to 5% (range=0% to 33%) at T2.
The mean percentage of children aged 11 to 18 who returned home after a period of
being looked after per month (out of all the children leaving care), decreased from
9% (range=0% to 30%) at T1 to 7% (range=0% to 27%) at T2. The average number
of days per month that children who left care and returned home increased from 266
(range=9 to 1400 days) at T1 to 349 (range=3 to 1645) at T2.
The mean percentage of LAC children who were in residential care per month (out of
all the children who were in care) decreased from 9.6% (range=8.5% to 10%) at T1
to 8.7% (range=7.7% to 9.8%) at T2.
The mean percentage of children aged 11 to 18 who were re-referred to children’s
social services per month (out of all the children referred to children’s services)
increased from 7% (range=5% to 9%) at T1 to 8% (range=6% to 10%) at T2.
As stated above, SHARE aims to reduce the number of young people becoming
engaged with statutory services, and also works with young people who are in foster
care, or young people who are referred to social care. Contextual data was
examined to show what could be examined in future evaluations of SHARE. The
contextual figures show a mixed picture. On the one hand, after SHARE’s
implementation, the mean rate of children entering care per 10,000 children in Wigan
decreased, as also did the mean percentage of children becoming LAC, per month,
for a second or subsequent time. On the other hand, after SHARE’s implementation,
0.00.51.01.52.02.53.03.5
Oct
-14
No
v-1
4
Dec
-14
Jan
-15
Feb
-15
Mar
-15
Ap
r-1
5
May
-15
Jun
-15
Jul-
15
Au
g-1
5
Sep
-15
Oct
-15
No
v-1
5
Dec
-15
Jan
-16
Feb
-16
Mar
-16
Ap
r-1
6
May
-16
Jun
-16
Jul-
16
T1 T2Rat
e o
f LA
C c
hild
ren
pe
r 1
0,0
00
Aged 11 to 18 (T1-Entering care) Aged 11 to 18 (T1-Leaving care)
Aged 11 to 18 (T2 - Entering care) Aged 11 to 18 (T2 - Leaving care)
25
the mean percentage of children who were re-referred to social services per month
increased, and the mean percentage of children returning home after a period of
being looked after per month decreased. However, causality should not be inferred.
Contextual data includes a larger group of children and young people than the one
accessing SHARE, and other factors than SHARE might be influencing changes
and/or fluctuations in numbers in contextual data. This is why future evaluations of
SHARE, with a longer time-frame and a bigger cohort of young people, would be
needed to observe changes in LAC rates associated with SHARE at local authority
level.
What led young people to crisis?
Parents
Many parents reported several problems in their young person’s life:
“[young person] has a lot of issues” (Parent 4).
The accumulation of such problems developed into a crisis situation:
“…just built up on him all at once” (Parent 1)
“one thing after another” (Parent 4)
“build-up of everything really” (Parent 4).
Crisis situations included self-harm and suicide attempts, parents believed several
problems experienced by their young person led to such behaviour:
“[young person] was self-harming, she’d taken 2 overdoses and it’s an
accumulation of what’s happened” (Parent 8)
as young people were unable to cope with situations “that he can’t really deal
with…he just can’t cope” (Parent 4).
Parents frequently discussed their experiences with self-harm:
“he’d been admitted into hospital because they were concerned about his
threatening to harm himself” (Parent 6)
“he’d been self-harming and that was the reason from admission” (Parent 2)
and suicide:
“twice he tried to commit suicide in school” (Parent 11)
26
“my daughter was taken into hospital because she’d taken an overdose”
(Parent 7)
“my son ended up on the wrong side of the motorway bridge and wanted to
end his life” (Parent 4)
Issues within the family were identified as one of the issues leading to a crisis
situation. Parents described how their young person often did not disclose their
issues:
“he doesn’t want to express it to me what he’s feeling” (Parent 1)
“[young person] wouldn’t speak to us, would he? Really shut us out” (Parent
5)
This lack of communication resulted in parents being unaware of the severity of the
situation:
“we don’t know why he went to that bridge” (Parent 11).
However, some parents were aware of the impact that issues within the family had
upon their young person:
“he’s had a bit of a bust up with his dad the night before and I think it had sent
him a bit wrong” (Parent 4)
In many cases, parents were made aware of their child’s mental health issues
through the school:
“he had a counsellor at college, she picked him up straight away” (Parent 1);
“they’d rung us from college to say that they were very concerned about him
and they didn’t feel they could let him out of college on his own because it
wasn’t safe” (Parent 6)
Parents also described the difficulties their young person had in school due to
bullying:
“people constantly having a go” (Parent 5)
“she was getting bullied from day one” (Parent 8)
and due to the pressure of school:
“transition from high school to college he started having problem” (Parent 9)

27
“the pressures, obviously, of school, like exams and things like that” (Parent
4)
Young People
The most reported reason for hospital admission was suicide attempt:
“I tried to hang myself…I ended up going into hospital because that’s what
were best for me” (Young Person 8)
“I was in hospital at the beginning of August for an overdose” (Young Person
2)
and self-harm:
“because of self-harming and suicide attempts” (Young Person 4)
“I was having a few problems and stuff like with my eating and then with self-
harm, and then I got put into hospital in a unit last year” (Young Person 1)
Several young people were unable to recall events leading up to their crisis situation:
“I was quite ill so I can’t really remember like being…the details of it really”
(Young Person 6)
or briefly discussed their experiences:
“just like problems with friends and that and family issues” (Young Person 4).
Those young people who felt able to discuss their personal experiences reported a
build-up of events:
“because I just got worse…it gradually built up” (Young Person 5)
“it was more just building up, yeah” (Young Person 6)
This build-up of events was reported to overwhelm young people, resulting in a crisis
situation:
“they’d all just kind of come at once and it was just too much so she put me
onto the ward” (Young Person 9).
Family issues were reported to lead to the young person’s mental health issues or
crisis situation. These included arguments:
“I got kicked out, well I had an argument with my dad” (Young Person 2)

28
the death of a loved one:
“I lost my Nan…it proper did destroy me – and that’s when I just went downhill
completely” (Young Person 8),
a history of mental health:
“I was living with my mum then and she’s got mental health issues…so it was
going to happen whether I liked it or not” (Young Person 7)
and abuse:
“my dad was very abusive with my mum…and he emotionally abused me as I
got older” (Young Person 8)
Does SHARE improve the quality of care provision for young people who are or might become engaged in statutory social care services?
Parents
The expectations parents had of SHARE were found to be strongly based on their
previous experience of other services. As many parents reported negative feelings
about CAMHS, it was relevant to compare the services received in SHARE to
CAMHS during interviews. Parents had negative expectations of SHARE due to their
experience with other services, which were not necessarily borne out when they
engaged with the service:
“SHARE sort of came into our lives and at the time I thought oh, here we go
again, same old crap, different people” (Parent 8)
“I was thinking, hmm they might be a bit like CAMHS and the Crisis
Team…but actually they’ve surprised me, I’m quite impressed” (Parent 7)
“I guess from using other services I didn’t believe they’d be as good as they
have been” (Parent 3)
The main difference between SHARE and CAMHS in parent-reported comparisons
was the ability to contact a person directly in crisis situations:
“there’s somebody to always ring, like I can always ring here and say
‘somethings happened, what do you suggest I do…whereas at Community
CAMHS…they don’t have the resources to be able to do something like this
service” (Parent 2)
29
Parents reported experiencing a fragmented service at CAMHS, which led to the
perception of a less integrated service compared to SHARE. As a result of a more
integrated service, SHARE was better able to fulfil promises made to parents:
“they said they were doing certain things, okay it might take 2 or 3 weeks, but
it got done. It wasn’t like oh, we’re going to do this and then 2 or 3 weeks later
you go and there’s still nothing…that’s what CAMHS did” (Parent 8)
Being able to do this created a sense of reliability and trust for parents in relation to
SHARE, which in turn facilitated the therapeutic relationship of the service:
“what helps with SHARE is that you get to know the people and they get to
know you and it’s easy to have a more open relationship with them” (Parent 3)
Another key difference between SHARE and CAMHS was parent-reported
accessibility of services:
“CAMHS service that’s half an hour away from our house is really difficult. So
SHARE being able to come to our house has been amazing” (Parent 3)
The home visits provided by SHARE were perceived as more personable by parents
and thus were found to provide better care for young people:
“I obviously prefer SHARE. I just think you get more of a one-to-one…CAMHS
is good for what they did, but [young person] needed more…it felt like the
package was put together for us and that’s what we needed at the time”
(Parent 4)
The specific support SHARE services provided to parents included practical support
such as supporting young people to attend college, doctors’ appointments, or parent
or carer appointments. A key part of SHARE was providing days out for young
people to provide respite for parents. These outings included taking young people
“…out bowling, they’ve taken him out for coffee” (Parent 6) or taking him “down the
town, take him out for a drive” (Parent 5).
In addition to providing support services for young people, SHARE also provided
support for parents in therapy sessions and in real world situations:
“once I was concerned about something because he’s got involved with this
girl who apparently self-harmed…so I rang [clinician] and I said, what shall I
do because I don’t want him to go to this place; so she said, ‘put him on, don’t
worry;’ so she had a chat to him, she said, ‘you can’t contain him, he’ll have to
go out, you can’t make him stay in,’ but, she said, ‘he’s promised me he’ll be
safe and he’ll come home and he’ll text you when he’s there.’…I don’t know
what I would have done without them” (Parent 6)

30
In addition, SHARE services provided support for parents experiencing low mental
wellbeing as a consequence of their personal experiences with mental health
problems:
“I wasn’t sleeping- they knew that- and their way of giving me respite was by
taking him out” (Parent 1)
This support was important for parents as “you blame yourself, you thought you’d
done something wrong, is there anything you could have done, could you have done
something different?” (Parent 2)
What is the impact of SHARE on young people’s mental health?
This section presents the results obtained on the impact of SHARE on young
people’s mental health. Routinely collected data was used to make the evaluation
sustainable beyond its end. In contrast with a randomised controlled trial (RCT)
where random allocation of participants ensures homogeneity of groups at baseline,
the methodology of this evaluation entails challenges when identifying a comparator
group that is actually comparable (namely, 2 groups without systematic differences
at baseline). An approach that could be used to overcome this limitation is the use of
synthetic controls, which was the original intention of this evaluation when trying to
obtain pre-implementation data and contextual data. In future evaluations, a
synthetic control group could be used, using propensity score matching on routine
clinical data from other similar services, or wider local authority, to try and make
groups similar and more comparable. Despite this limitation, routinely collected data
was collected and analysed in order to explore how young people are (or are not)
changing after accessing SHARE.
Young people
All 10 of the young people gave examples of the positive impact which the service
has had on their mental health. Examples given included an improved understanding
of emotions; an improved ability to express emotions; increased confidence; feeling
able to ask for help; more positive future thinking; working though specific difficulties
such as with eating, self-harm, family relationships, or medication; and improved
social communication. The breadth of the support they had received was noted by
several young people. For instance, one young person said:
”I think they’re amazing like because in the space of 2 months – I’ve never
worked with anyone like that… I’ve never worked with anyone in such a short
space of time and they’ve given me so much help” (Young Person 8)

31
Most of the young people reported that they had been taught multiple coping
strategies or techniques.
Routinely collected data
In SHARE, all young people have SDQs completed within the first few weeks of
accepting the referral, whilst HONOSCA’s are completed by week 3. Out of the 37
young people who accessed SHARE between October 2015 and beginning of
October 2016, 29 had a recorded Health of the Nation Outcome Scales for Children
and Adolescents (HoNOSCA) score at assessment (T1). The reason why the
remaining 8 young people did not have HoNOSCA scores is unknown, but it might
be that at least some of them are from the initial stages of the project, when, due to
setting-up, procedures may have been missed. In addition, 26 of those 29 had
multiple HoNOSCAs recorded with an average of 3.9 (SD=2.02), and a maximum of
8 HoNOSCAs. Taking into account all data points available for each young person,
results showed that they were separated by an average of 46.11 days (SD=22.44),
with a minimum of 6 days and a maximum of 143 days.
Difference in mean on paired HoNOSCA scores between T1 (mean=25.04,
SD=7.27) and the second assessment or T2 (mean=19.73, SD=9.71), controlling for
length of time between T1 and T2, was statistically significant (F(2,23)=4.01, p=.032,
n=26). The average days between T1 and T2 were 48, with a minimum of 9 days
and a maximum of 143 days. The difference between T2 and third assessment or T3
(mean=17.9, SD=9.13), controlling for the length of time between T2 and T3, was
significant (F(2,18)=4.89, p=.02, n=21), with 52 days on average between T2 and T3
(ranging from 28 to 85 days). Individual trajectories of paired-scores from T1 to T2
are presented in

32
Figure 2.

33
Figure 2: Individual HoNOSCA trajectories (from T1 to T2) for 26 young people in SHARE who
had paired data.
N.B. Each colour represents a different young person
Source: SHARE outcome data
As a group, young people did not present significantly lower HoNOSCA scores at
their last measurement (Last score: mean=13.58, SD=8.38; F(2,23)=0.27, p=0.77,
n=26), when controlling for length of time between first and last measurement. In
most of the cases, treatment trajectories were not linear as can be seen in the run
chart below (Figure 3) that includes the 4 young people who had at least 7
measurement points.
Figure 3: HoNOSCA trajectory of 4 young people with 7 or more data points.
Source: SHARE outcome data
0
5
10
15
20
25
30
35
40
T1 T2
Ho
NO
SC
A s
co
re
0
10
20
30
40
50
T1 T2 T3 T4 T5 T6 T7 T8
Ho
NO
SC
A s
co
re
Time points

34
Regarding the Strength and Difficulties Questionnaire (SDQ), 17 young people
completed it at T1 and 10 at T2; whilst 14 parents completed the SDQ at T1 and 5 at
T2. Paired SDQ numbers were lower, with 7 completed by young people and 3
completed by parents. Time between measurements of SDQs varied from 11 to 61
days, with an average of 22.5 days (SD=19.69) for young people-report and between
10 and 22 days, with an average of 15 days (SD=6.43) for parent-report. Due to the
low frequency of completed SDQs, no further statistical analyses were conducted.
The SDQ also has clinical cut-off points that divide young people in a clinical or non-
clinical range for each sub-scale and the Total Difficulties Scale (Goodman et al.
2001). In the Total difficulties scale, 10 out of 17 (59%) young people were in the
clinical range at T1 and 7 out of 10 (70%) people at T2 according to young people-
report, whilst 9 out of 14 (64%) young people were in the clinical range at T1 and 4
out of 5 (80%) at T2 according to parent-reports.
Out of the 7 young people who had paired SDQs completed by young people, 1
recovered (moved from the clinical to the non-clinical group) and reliably improved
(the change in score was not due to random fluctuations or measurement error); 5
did not recover, or have a reliable change in scores, and one deteriorated (moved
from the non-clinical group to the clinical group) but did not have a reliable change in
the Total Difficulties Scale.
Of the 3 young people who had a paired SDQ completed by parents, 2 did not
recover, or have a reliable change in scores, and one deteriorated (moved from the
non-clinical group to the clinical group) but did not have a reliable change in the Total
Difficulties Scale.
Results presented in this section are mostly descriptive and our confidence in the
findings is very likely to change when a bigger sample is obtained, especially of
results that require paired data. In addition, given the short time frame in which
young people and parents accessed the service, and as they were accessing the
service during crisis when high levels of distress were experienced, it is unsurprising
that change in mental health symptoms was not observed. A longer follow-up of
those who access SHARE is necessary.

35
What might be some of the mechanisms by which SHARE reduces the number of young people becoming engaged in statutory social care services?
Parents
Parents discussed how SHARE increased parental knowledge of their young
person’s treatment:
“because all we did was drop her off at CAMHS, she goes in, has her
treatment, comes out but she didn’t want to talk about it so we didn’t know
anything about it” (Parent 3).
Parents believed SHARE provided them with skills enabling them to cope better in
crisis situations:
“think if I was to be faced with difficulties again, I wouldn’t find it quite so scary
and I think that if there was another inpatient admission, I probably wouldn’t
feel quite as overwhelmed and out of my depth that I did feel when he went in
the first time because I’ve had mental health put on the agenda more” (Parent
2)
“having the psychologist come over to our house, give us advice on what to
say to [young person], how to use your emotions or, you know, not use your
emotions but how you’re supposed to feel and what emotions you should be
showing to the young person that would help them and help yourself because
otherwise you just don’t know” (Parent 6)
“I kind of notice my behaviours as well as his behaviours…they’ve taught me
how to not react to those clashes in the same way” (Parent 7).
Parents frequently discussed the support they received from the staff at SHARE and
this support was found to be important for parents as “you don’t think you need it but
you do” (Parent 1). SHARE provided parents with the information and emotional
support necessary to cope with their young person’s mental health problems. In the
interviews, parents also reported that SHARE provided practical support in different
aspects of their lives, including returning to work:
“they actually said, ‘you need to be going back to work now’ and I was like,
‘but I don’t want to leave him’ and it was supporting through that as well”
[Parent 9]).
This supportive relationship was extended to family members to improve treatment
outcomes for their young person:

36
“they went right, we’ve got to help you as a family unit and then once we get
into that we can help everyone. And then the whole thing realistically revolves
around [young person], because if they didn’t help us out…they could do
whatever they wanted and it wouldn’t help [young person] because we’d still
be stuck in the same rut” (Parent 8).
Overall, SHARE was reported as being effective in improving the mental health and
wellbeing of both parents and young people. Firstly, parents reported improvements
in their young person since using SHARE:
“it’s getting him through the bad part and back to the good part…that’s what
they’re helping with” (Parent 1)
“there has been a huge improvement in [young person]” (Parent 9)
“it’s the first time I’ve seen him smile in ages” (Parent 11)
Secondly, parents reported improvements within themselves as a result of SHARE
service involvement:
“I’ve started to pick out that I can tell when a mood’s going to come on and he
changes” (Parent 1)
“they’ve saved me from going schizs…and they saved my marriage” (Parent
8)
“peace of mind…I knew he was safe, and I could relax a bit” (Parent 5)
The most commonly reported improvement in parents was found to be their
increased confidence in dealing with their young person’s feelings and behaviours:
“I’m more confident in knowledge how to deal with things now” (Parent 1)
This increase in confidence was found in both parents and their young person:
“I would say it’s a confidence booster for both me and [young person]” (Parent
1).
Parents also discussed practical skills they learnt from SHARE services to allow
them to remain calm in situations:
“I just take a deep breath and think, right, we’ve got to think about [young
person]” (Parent 6)
“I’m here, I’m calm, I’m collected, I know what I’m saying, I know what I’m
doing” (Parent 4)
37
and strategies they have learnt from SHARE staff that has in turn changed their
outlook or behaviour:
“what SHARE has done is say to us, okay well…it’s okay to say that, maybe
don’t say that but here’s an idea…and that’s just been brilliant for us” (Parent
3)
“now I turn round and say ‘I can’t, I’m too busy’ and I don’t feel bad about it.
SHARE has given me that” (Parent 8)
Young people
Two mechanisms were identified which enabled young people to engage with
SHARE, rather than statutory social care services. Firstly, young people reported
finding SHARE easy to engage with due to the nature of the extended support
provided. The service was reported as being very easy to access, as support was
available out of hours. This was reported as being particularly important in
preventing an escalation of risk:
“Like when you're really down try and call someone or speak to someone
about it instead of acting on anything” (Young Person 4)
Some young people noted the breadth of support being provided by the service as
particularly helpful in meeting their multiple needs:
“They’ve helped me find somewhere to live, I've got a job, I'm volunteering,
I'm back talking to my dad. So everything I've actually asked them to help me
with they have done” (Young Person 2)
Young people also identified the importance of this support extending to the whole
family:
“I find it useful not only for me but for my parents as well because obviously
when I’m struggling they struggle; so they’ve been able to ring SHARE as well
for their own like needs and stuff. So to know that they have support as well is
more like comforting for me” (Young Person 6).
Secondly, characteristics of the team as a whole, as well as individual team
members, were highlighted as being very important. Several young people noted
that having a multi-professional team had many benefits. The description of how
young people viewed SHARE’s team members can be found in the relevant research
question below.

38
Focus Groups
In the focus groups, the integration and collaboration between the multi-disciplinary
team (MDT) was repeatedly highlighted by all staff as crucial to SHARE’s success. It
was described as being the mechanism by which the service more effectively met
the needs of young people because – as reported by staff – the right colleagues with
the right areas of expertise were able to efficiently come together to address the
children’s, young people’s and families’ needs. These positive outcomes were
ascribed to increased information-sharing and sharing of expertise, in addition to
high levels of staff support.
In addition, staff described SHARE as filling an important gap left by other services in
the care for children, young people and families, in terms of providing out-of-hours
care, intensive input around the whole family, and safer care resulting from
information-sharing and collaboration between disparate organisations.
Staff reported that by giving children, young people and families the skills to manage
emotional and behavioural difficulties more effectively in the home or school, there is
a likelihood of reduced access to services, and, in particular, crisis support services,
in the future. In addition, by empowering families to better manage emotional and
behavioural difficulties, staff discussed cases where a child going into care or
becoming looked after had been avoided. Staff also described the potential for cost
saving by empowering families to better manage emotional and behavioural
difficulties and therefore, not having to access other social, health and justice
services in the future. Examples of the impact of SHARE on children, young people
and families were given in all focus groups, including preventing children becoming
looked after; empowering children, young people and families; and improving
outcomes, even when children and young people were taken into care. In addition,
examples of the impact of the MDT on supporting staff to better support children,
young people and families were also frequently mentioned.
What is staff’s experience of SHARE?
Focus Groups
All staff reported high levels of job satisfaction compared to previous roles, which
was explained by the ability to make a difference to the lives of children, young
people and families, and collaborating with, and learning from, colleagues; in
particular, feeling supported by colleagues was talked about as a source of job
satisfaction, as was having ownership and flexibility to work in an innovative way.
The innovative nature of the project was described as something of a double-edged
sword as, on the one hand, SHARE was providing a valuable, new service, filling a

39
much needed gap. On the other hand, the novelty of the service means that
processes and procedures had to be developed from scratch, with lessons learnt
and implemented along the way. Still, freedom to have this flexibility meant that
challenges could be efficiently and effectively addressed. Likewise, transparency and
clarity of aims were crucial in maintaining boundaries to this flexibility. Nonetheless,
developing new processes was described by some as being unwieldy in the first
instance, as they required refinement over time. Examples included referral
processes, crisis management, and location and facilities.
Staff also reported high levels of uncertainty about the future of the service after the
end of the project, including both whether or not there would be funding for the
service and, if so, what the funding would be contingent upon: for example, some
staff were concerned that their caseloads might increase, meaning they would not be
able to provide the dedicated, intensive work with families that is so effective
currently.
Observation tools
Four staff completed 14 observation tools from December 2015 until January 2016.
Through the observation tools, most of the time (12 out of 14), staff reported that
they agreed that during their work with other staff there were opportunities to identify
risks and discuss concrete plans to mitigate these risks; that everyone had the
opportunity to contribute during discussions; and that all points of view were
respected. In addition, 13 out of 14 times staff reported that during their shift, service
users had the opportunity to talk about what they wanted, and 12 out of 14 staff
agreed that service users had the opportunity to ask questions, that service users felt
as if they understood what was talked about and their views were listened to and
respected.
As an additional comment, staff highlighted difficulties with office space to complete
administrative work, building space to conduct group supervision and neutral or
clinical spaces in which to hold family meetings.
What are young people’s and parents’ experiences of SHARE?
Parents
Overall parents reported high levels of satisfaction with SHARE: all the 12
interviewed parents reported a positive experience of SHARE; 7 out of the 8 parents
who agreed to complete the Experience of Service Questionnaire (CHI-ESQ) after
the interview reported that they were overall satisfied with SHARE (see Figure 4);

40
and the 5 parents who completed SHARE’s feedback questionnaire, when requested
by a member of SHARE’s team, also reported high levels of satisfaction with staff
and the model.
In the ESQ, parents reported that SHARE staff provided enough information; that
they felt listened to by staff; and that staff took their concerns seriously and treated
them well. Similarly, in SHARE’s feedback questionnaire, all 5 parents reported that
all the things that were important to them were covered in the sessions; they felt that
their child was supported by their key worker; felt supported by staff at SHARE; felt
involved in their child’s Care Planning; and felt that their, and their child’s, views
were taken into consideration.
All 5 parents who completed SHARE’s feedback questionnaire reported that SHARE
was making a positive difference to their lives. When asked about more details
regarding SHARE’s positive difference, parents mentioned the staff and said that
they had been very supportive (even during their days off), non-judgemental,
positive, compassionate, understanding, hardworking and determined, not only with
children and young people but also with parents.
Many parents reported how staff “…went beyond her duties” (Parent 4) or had “gone
than extra mile” (Parent 8) in the care of their young person, with several members
of staff working outside their hours:
“[clinician] wasn’t working, and I could just ring her” (Parent 5)
“I texted [clinician] once and she wasn’t at work, but she answered me”
(Parent 6)
Understanding and recognising the dedication of SHARE staff in their work
developed a sense of trust in parents, in terms of SHARE caring for both their young
person:
“I felt I could trust him with them, I was happy for them to take him out”
(Parent 6)
and parents themselves:
“I keep a lot of it bottled up, but she seemed to manage to grab it out of
me...she’s really good at what she does” (Parent 8)

41
Figure 4: Frequency of answers given to CHI-ESQ questions by interviewed parents.
Overall, the majority of parents were extremely positive about SHARE. When
questioned about aspects of SHARE they liked least, suggestions in terms of service
improvement were made rather than criticisms. These improvements included early
intervention family therapy (Parent 5), managing parent support groups (Parent 5),
implementing programmes similar to SHARE across the UK (Parent 2) and creating
information booklets about SHARE (Parent 2). The latter suggestion was important
as parents were found to lack capacity to retain information during emotional crisis
situations:
“…you’re bombarded with so much information…I just didn’t take it on board
but if I’d had a physical document in my hand with some information about
what it was, then possibly that would have sunk in a little bit more” (Parent 2)
Parents expressed fear and worry about the end of service:
“I am quite fearful of when they do discharge us from SHARE…” (Parent 2)
“the only thing I worry about is, [young person]’s turned sixteen…what age do
they still work with you” (Parent 5)
However, parents felt SHARE had provided them with the knowledge and skills
necessary to cope after the service has ended:
“I suppose by the time it stops, she’d have given me all the confidence that I
need to continue and all the information that I need” (Parent 4)
0 1 2 3 4 5 6 7
Listened to me
Easy to talk to
Treated well
Took worries seriously
Know how to help
Provided enough explanation
SHARE team working together
Convenient time
Recommend to a friend
Overall good help
Number of parents
Certainly True
Partly True
Not true

42
Only one parent or carer expressed a negative experience of SHARE following a
session with one clinician who they found to be patronising. Two points were raised
by Parent 10. Firstly:
“I think that’s the problem with SHARE, there’s just not enough mental health-
trained staff”.
Secondly, they believed the practical support provided by SHARE was unhelpful for
their young person:
“the care that they’re giving is not helping [young person]. They’re taking her
out to Starbucks. Well, I’m sorry that’s not helping her mental health” (Parent
10)
As Parent 10 expressed a positive experience with several SHARE staff members
during the interview – “[clinician]…she was fantastic, absolutely brilliant; I feel he
does listen to what we say. He’s got a very calming influence [clinician]” – it is
reasonable to conclude this interviewee had a negative experience with one aspect
of the service and not the service overall. Nevertheless, these points are important to
acknowledge when considering service improvement.
Young people
As with parents, young people reported high levels of satisfaction: all of the 10 young
people interviewed described a positive experience of using the SHARE service; all
the 9 young people who agreed to completed the CHI-ESQ after the interview
reported that they were overall satisfied with SHARE (see Figure 5: Frequency of
answers given by interviewed young people to CHI-ESQ questions by interviewed
young people.
); and the 9 young people who completed SHARE’s feedback questionnaire
requested by a member of SHARE’s team also reported high levels of satisfaction
with staff and the model.
In interviews, the service was described by the young people as good, supportive,
fun and helpful. Three young people referred to the service as ‘amazing’. One young
person explained that:
“I think they are really supportive….I think I’d struggle if I didn’t have them like
to offer me support” (Young Person 3).
In SHARE’s feedback questionnaire, all 9 young people reported that SHARE was
making a positive difference to their lives. When asked to provide more details,
young people said that SHARE was helping to reduce their symptoms (for example,

43
self-harm, low self-esteem, lack of confidence), was providing support to them and
their families, and was preventing arguments at home.
Team members were described as being easy to talk to, often due to the frequency
of contact with the young person:
“I can call [staff] or [staff] or the house. And if the person that picks up isn’t
someone that I know they can put me onto someone that I do know so that I
can put a face to the name on the phone” (Young Person 9)
Young people described how this allowed them to feel safe, to feel comfortable and
for strong therapeutic relationships to be built up:
“Could talk to them like I knew them, like I’ve known them for years; every
single one of them were like that because they’re all just nice people. And I
found it easy to talk to them, really easy” (Young Person 8)
Other positive characteristics of the team which young people identified included
being down-to-earth, non-judgemental, relaxed, reliable, good listeners, caring, and
genuine:
“Just like when you talk to them they don't try and interrupt straightaway and
try and like solve everything straightaway, they help you run you through it
slowly” (Young Person 4)
Empowerment and involvement emerged as key aspects of the young people’s
positive experience. All of the young people spoke about ways in which the service
had listened to them; involved them in their care, or made them feel empowered.
Half of the young people reported being actively involved in the development of their
care. The process was described by one young person as:
“They give views as well and I give mine and we’d compromise” (Young
Person 5)
For example, support was put in place when one young person found speaking in
meetings difficult:
“So, I’d write out some questions and points that I needed to be put across
previous to it; it had been suggested by [clinician] that I did that. Then I could
hand it to her and she’d make sure that all of those points got mentioned and
any questions got addressed and answered in that meeting” (Young Person
9)
Young people also reported SHARE asking for, and actively responding to, feedback
about the service. This was mirrored in the CHI-ESQ and SHARE’s feedback

44
questionnaire. In the latter, all 9 young people reported that all the things that were
important to them were covered in sessions; that they felt supported by their key
worker and by other staff at SHARE; were involved in their Care Planning, and felt
that their views were taken into consideration. In the CHI-ESQ all young people who
completed the questionnaire reported that staff provided enough information, that
they felt listened to by staff, that staff took their concerns seriously and treated them
well.
Figure 5: Frequency of answers given by interviewed young people to CHI-ESQ questions by
interviewed young people.
In the interviews, 8 of the young people identified an aspect of the service that could
be improved. Five of these young people wanted an extension of the service, either
in terms of an extension to other areas of the country; overnight access to the
telephone support, or access to the service after age 18. Other points of
improvement included needing more individual therapy and more access to groups.
Two young people identified negative experiences of the service; one sometimes
found the high quantity of sessions to be tiring and boring and another found the
family therapy sessions unhelpful. The parent of the former was also interviewed,
and was very satisfied with SHARE: “I’ve not really got any negatives to give you”.
Indeed, the parent suggested implementing programmes similar to SHARE across
the UK and creating information booklets about SHARE to help parents remember
information during an emotional crisis:
“…you’re bombarded with so much information…I just didn’t take it on board
but if I’d had a physical document in my hand with some information about
what it was, then possibly that would have sunk in a little bit more”.
0 1 2 3 4 5 6 7 8 9
Listened to me
Easy to talk to
Treated well
Took worries seriously
Know how to help
Provided enough explanation
SHARE team working together
Convenient time
Recommend to a friend
Overall good help
Number of young people
Certainly True
Partly True
Not true

45
What are the barriers and facilitators to implementing and sustaining SHARE?
Facilitators
Parents
Parents reported good communication both within SHARE services and outside
SHARE with external services such as CAMHS:
“good communication within SHARE and between SHARE and community
CAMHS” (Parent 8)
This communication was found to be a facilitator for parents as:
“we kept an open channel of communication going at a time of crisis, which
was really, really useful” (Parent 2)
SHARE staff was found to be more impartial and pragmatic during emotional
situations, which, according to parents, facilitated access to SHARE:
“they have a more structured view than us, we’re all just in crisis all the time.
They can see properly in steps and phases” (Parent 5)
This external support was also found to facilitate the involvement of young people in
SHARE:
“if I was having a problem with [young person], because sometimes your
relationship they get a bit fed up with you, so it’s somebody else to talk to”
(Parent 9)
The 24-hour support services provided by SHARE also facilitated involvement
“because children just don’t work 9 ‘till 5” (Parent 4).
Young people
Explanations that young people gave for the success of SHARE focused on the
strong accessibility of the service:
“I just think it’s good that they are available most of the time on weekends and
stuff and they can come out and do assessments pretty much whenever’
(Young Person 3)
Furthermore, young people described the intensive support they received from
SHARE during a crisis, in terms of immediate telephone or support in person, and
46
follow-up. Other explanations young people gave for the success of SHARE focused
on the adaptability of the service to each young person’s needs:
“Yeah, they always kind of bend what they are saying towards your needs or
like how you are (…) Like if you struggle with speaking about things and
topics then they can like find alternatives. Like I struggle expressing my
emotions a lot so I’m doing some work with a social worker on like expressing
it through a scrap book in artistic ways” (Young Person 3)
Adaptability in the nature, formality and location of contact with staff was noted as a
facilitator to young people:
“Like you can just drop her a text saying, ‘Do you want to go for a brew
somewhere?’ and she always seems to be within a couple of hours she’ll
come and see me. They’ve never not got enough time for you” (Young Person
2)
Focus Groups
In the focus groups, staff highlighted MDT as a facilitator to implementing and
sustaining SHARE, as it allows sharing information and expertise, leading to
enhanced inter-collegial support for staff and better support for children, young
people, and families. A number of positive outcomes were also experienced by staff
themselves, as staff felt better supported by colleagues in SHARE, compared to
previous positions, and therefore better able to support children, young people and
families.
Related to the above, in all focus groups, staff discussed the team approach to
cases as being a unique strength to SHARE, increasing staff confidence as they
know they have the skills and knowledge of colleagues to also draw on and
decisions are made in an informed manner as different members of the MDT are
involved.
Barriers
Young people
Only 2 young people identified barriers to successfully implementing the service.
Both reported finding the appointments difficult at times; one young person found the
number of sessions tiring and one person identified that their own difficulties with
talking to people was sometimes a barrier.
47
Focus Groups
In terms of the barriers, as reported in all focus groups by the majority of staff,
disparate information systems have led to problems of sharing information and a
duplication of paperwork. This has resulted in a large amount of administrative work
and duplication of reports and information needing to go to different services.
Additionally, staff reported that initially, there was confusion over the different roles of
the MDT, and a few staff reported tensions with other services raised by a lack of
awareness about the programme.
What are the results of SHARE’s cost-benefit analysis?
A cost-benefits analysis (CBA) for SHARE was conducted by an independent party
(York Consulting). The following is the report prepared by John Rodger and Matthew
Cutmore.
CBA Constraints
it has not been possible to directly analyse primary cost or outcome data for
the SHARE project
the SHARE project does not have a monitoring system in place to directly
calculate support costs and outcomes
it has not been possible to establish a historical comparator group from
existing SHARE records
there is no direct evidence regarding the sustainability of outcomes achieved
by the SHARE project
SHARE support typology
It is estimated that the SHARE project will support 46 young people annually across
3 typologies
1. Self-harm or suicidal: 42%
2. Social circumstances: 39%
3. Long term mental health: 19%
The Costs
the costs take account of the total steady-state costs associated with
providing support to young people

48
typically, we would have sought to establish the resource cost per case.
Unfortunately, data at this level was unavailable
data relating to other services (for example, social care) supporting the young
person around the same time as SHARE was also unavailable
it has also not been possible to cost generic support typologies
annual steady-state costs are estimated to be £433,830
the cost per young person supported is £9,431
The benefits: removal of adverse outcomes
benefits/cost avoidance are calculated for the 12 months immediately after the
young person exits support. Outcomes data for discharged cases was
provided by the SHARE team. We provided advice around key outcomes
including the level of change required to claim each outcome. This was then
translated into financial benefits by applying proxy values that are associated
with these outcomes
we cannot accurately predict what will happen to these young people in the
future – there are too many variables. Although we recognise the work of
SHARE (and other support services) may benefit young people well in to their
adult lives, to keep the model robust we only capture benefits that are
immediate and can be tracked
when monetising outcomes into benefits, we have used only robust financial
proxies. Benefits have been weighted to reflect the following post-SHARE
statuses:
successful closure (Step Away): the young person requires no further
direct support from social care or mental health services. This includes
cases where kinship care was arranged, recognising that this, for some
young people, is a successful outcome. We assume benefits are
sustained for one year
referred/remained open to other agency: the young person requires
additional support (not from social care). To reflect ongoing support
costs and the likelihood of outcomes being sustained over the longer-
term, we reduce the financial benefits by 25%
remained open to social care: The young person requires additional
support from social care. To reflect more intensive ongoing support
costs and an increased likelihood of regression on outcomes recorded,
we reduce the financial benefits by 50%
49
looked after: the young person is in the care of the Local Authority. The
cost of this outweighs any benefits of the support provided. Benefits
are set to zero
Estimating outcomes
The SHARE project assessed the outcomes for 11 closed cases. Status on closure
was as follows:
step Away: 4 (36%)
step Down: 5 (46%)
step Up: 1 (9%)
transferred: 1 (9%)
Monetised outcomes have been weighted to reflect outcome status.
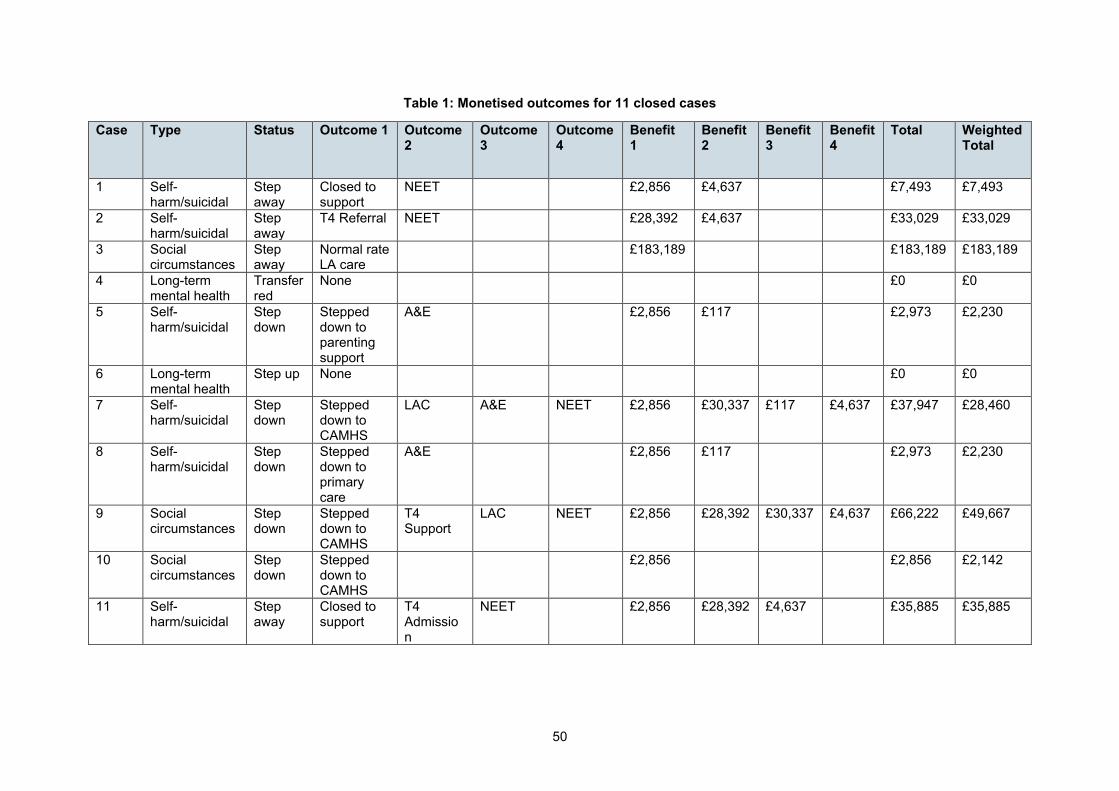
50
Table 1: Monetised outcomes for 11 closed cases
Case Type Status Outcome 1 Outcome 2
Outcome 3
Outcome 4
Benefit 1
Benefit 2
Benefit 3
Benefit 4
Total Weighted Total
1 Self-harm/suicidal
Step away
Closed to support
NEET £2,856 £4,637 £7,493 £7,493
2 Self-harm/suicidal
Step away
T4 Referral NEET £28,392 £4,637 £33,029 £33,029
3 Social circumstances
Step away
Normal rate LA care
£183,189 £183,189 £183,189
4 Long-term mental health
Transferred
None £0 £0
5 Self-harm/suicidal
Step down
Stepped down to parenting support
A&E £2,856 £117 £2,973 £2,230
6 Long-term mental health
Step up None £0 £0
7 Self-harm/suicidal
Step down
Stepped down to CAMHS
LAC A&E NEET £2,856 £30,337 £117 £4,637 £37,947 £28,460
8 Self-harm/suicidal
Step down
Stepped down to primary care
A&E £2,856 £117 £2,973 £2,230
9 Social circumstances
Step down
Stepped down to CAMHS
T4 Support
LAC NEET £2,856 £28,392 £30,337 £4,637 £66,222 £49,667
10 Social circumstances
Step down
Stepped down to CAMHS
£2,856 £2,856 £2,142
11 Self-harm/suicidal
Step away
Closed to support
T4 Admission
NEET £2,856 £28,392 £4,637 £35,885 £35,885

51
Summary of monetised adverse outcomes avoided
Details of the adverse outcomes avoided as a result of SHARE support are shown
below. We have calculated the annual adverse outcomes avoided based on the
outcomes recorded in the sample of 11 cases and annualised to reflect 46 cases.
Table 2: Monetised adverse outcomes avoided
Adverse outcome Count Total Weighted Benefits
Visit to A&E 13 £1,101
Becoming LAC 8 £190,296
Being NEET 21 £87,260
High-cost looked after placement 4 £766,063
T4 admission 13 £326,508
Ongoing support 29 £68,674
The aggregate financial benefits, when account has been taken for ongoing support
needs, for these outcomes is £1,439,902.
Fiscal return on investment (FROI)
the Fiscal Return on Investment (FROI) shows the benefit/cost ratio for the
SHARE service
total benefits (adverse outcomes avoided) were calculated to be £1,439,902
total annual steady-state costs were calculated to be £433,830
based on the above Fiscal Return on Investment is shown to be 3.3
this demonstrates a positive cost benefit outcome equating to a saving of
£3.30 for every £1 invested in the SHARE project
Sustainability
In order to take into account sustainability of outcomes, we have calculated the
Fiscal Return on Investment under 3 scenarios:
optimistic: (all outcomes sustained for 12 months) = FROI 3.3
base: (75% of all outcomes sustained for 12 months) = FROI 2.4
pessimistic: (50% of all outcomes sustained for 12 months) = FROI 1.7
52
Conclusions
due to data limitations, it has been necessary to make a number of
constraining assumptions to conduct the SHARE cost benefit analysis
based on annual costs of £433,830 and estimated annual benefits of
£1,439,902, the programme reveals a positive FROI of 3.3. A saving of
approximately £3 for every £1 invested
even under the most pessimistic scenario of 50% outcome sustainability, the
FROI remains positive at 1.7
Recommendations
the SHARE project needs to calculate the staff time associated with different
types of interventions and fine tune the costs
the project needs to record outcomes against every young person supported
on an annual basis to improve the robustness of estimated benefits
the project needs to track young people 12 months after support to check the
sustainability of outcomes
the project should repeat this CBA exercise, based on the information
generated above, in 12 months’ time to test and improve CBA estimates

53
Limitations of the evaluation and plans for the future
Limitations of this evaluation
as the implementation and the evaluation of the programme started at the
same time, delays in implementation entailed delays in the evaluation and
made the evaluation of SHARE house not possible within the timeframe. In
addition, this also meant that some of the interviews with young people or
parents were conducted when the young person was still experiencing high
levels of emotional and behavioural difficulties, which introduced higher levels
of uncertainty to the outcome that parents thought SHARE could achieve.
Furthermore, this also added an extra layer of complexity to the
implementation of the project because, when the team was organising
processes and procedures, they also had to recruit young people and parents
for the interviews
data at local authority level was used to compare indicators before and after
SHARE’s implementation. However, causality should not be inferred. This is
not only because SHARE is currently reaching a small percentage of children
and young people who could benefit from such a programme, but also
because factors other than SHARE are likely to be influencing changes and/or
fluctuations in numbers in contextual data
focus groups were conducted in December 2015; hence, some of the results
reported here might have changed since then
even though most of the young people completed the questionnaires when
admitted to SHARE, only a few had paired data (for example, 3 young people
had paired SDQs completed by parents and 7 had SDQs self-completed).
Therefore, results presented were mostly descriptive, and our confidence in
the findings is very likely to change when a bigger sample is obtained.
Furthermore, given the short time frame in which young people and parents
access the service, and as they are accessing the service during crisis when
high levels of distress are experienced, it is unsurprising that change in
mental health symptoms was not observed. A longer follow-up of those who
access SHARE is necessary
as data was routinely collected, as opposed to being collected under
controlled conditions, there may be variations in how data was collected and
recorded. Even though this limitation is present in all service evaluations, it is
important to acknowledge as it might have an influence on the results of future
SHARE evaluations too

54
local authority indicators were compared for the year before SHARE started
(October 2014 to September 2015), to 9 months after SHARE was
implemented (October 2015 to July 2016). This difference was due to the
timing for data collection, analysis and report writing
even though efforts were made to have a comparator group for exploring the
impact of SHARE on young people’s mental health, it was not possible to
obtain routinely collected data for a comparable group of young people
interviews were all conducted with parents as no carer showed interest in
participating. Hence, as opposed to the original plan, carers’ views of SHARE
could not be included in this evaluation
Appropriateness of evaluation approach
Bearing in mind the above limitations, the strengths of the evaluation were that it
addressed the central questions from different perspectives (those of staff, young
people, and parents) using a number of data sources. This allowed a triangulation of
data, which resulted in more reliable findings. The evaluation drawing on quantitative
data can also be sustained by SHARE after the end of our evaluation. It would be
useful to continue to capture qualitative data from service users. However, this would
be more sustainable if open-ended responses to questionnaires (such as on the
CHI-ESQ) were used, as opposed to interviews or focus groups.
Capacity built for future evaluation and the sustainability of the evaluation
In line with the evaluation strategy, onsite quantitative data was generated and
collected by SHARE in order to promote sustainability of the evaluation. Hence, it is
expected that SHARE’s evaluation will be sustainable in the future. Nonetheless, we
will work with the implementation team to feed back findings from the evaluation to
ensure lessons learnt about barriers and facilitators to implementation are
considered when sustaining SHARE after the end of the project. We will be
particularly focused on advising how best to continue service evaluation. This may
include:
recommendations about additional measures to collect (such as experience or
outcome measures)
embedding the use of the participant observation tool as a tool for self-
reflection and evaluation
developing templates for the implementation team to update analyses when
new data is collected (for example, run charts of routine clinical data)
55
recommendations about the use of the synthetic control group, using
propensity score matching on routine clinical data from other similar services
or wider local authority, to try and make groups similar and more comparable.
The exit strategy will involve the implementation team reviewing the evaluation report
and providing feedback, and a handover period where the implementation team can
ask evaluation questions post-exit. The exit strategy will be particularly focused on
ensuring the implementation team is left with the skills, understanding and planning
to collect, analyse, interpret and disseminate outcomes in accordance with the
medium- and long-term aims.
Recommendations for future evaluation
In addition to the above, the following recommendations are made:
a measure such as the Goals and Goal Based Outcomes (Law & Jacob,
2013) could be used to record specific changes that young people are
interested in, and that go beyond symptom change, such as being able to
take the bus or feel confident to express opinions. This measure consists of a
recording sheet where the young person and clinician record up to 3 goals. At
T2, the young person states on a scale from 0 to 10 how close he or she feels
to reaching those goals. This measure may be less suitable for use in
episodes of crisis
in order to examine the medium-term impact of SHARE and whether its
positive effects are sustained, we recommend a follow-up evaluation in 8 to
12 months, including a mixture of outcome measures and qualitative data
from service user feedback questionnaires
continuing the evaluation for a longer time frame, and for a larger number of
young people, is also recommended. Outcome results presented in this report
were mostly descriptive and our confidence in the findings is very likely to
change when a bigger sample is obtained

56
Implications and recommendations for policy and practice
Capacity and sustainability of this innovation
As shown above, the CBA report from York Consulting stipulated that, in order to
take into account sustainability of outcomes, we have calculated the Fiscal Return on
Investment (FROI) under 3 scenarios:
optimistic: all outcomes sustained for 12 months = FROI 3.3
base: 75% of all outcomes sustained for 12 months = FROI 2.4
pessimistic: 50% of all outcomes sustained for 12 months = FROI 1.7
This implies that SHARE is sustainable even in a pessimistic scenario, in which a
saving of approximately £1.7 for every £1 invested is projected.
Sustainability of SHARE will also depend on workforce and wider service
transformation, i.e., change in focus from a transactional service to a relational one.
As evidenced in interviews, young people and parents responded positively to
SHARE’s relational service, in which SHARE team and families established
personable and trusting relationships.
Conditions necessary for this innovation to be embedded
Specific recommendations to support the embedding of this innovation are included
in the next section. Overall in Wigan there is a need for SHARE to provide
appropriate care for young people and families in crisis, as indicated by the findings
of this evaluation. In particular, in interviews, parents reported that their, and their
children’s, needs required support that other services were unable to provide; and
young people in interviews said that SHARE’s breadth of support met their multiple
needs. Staff in focus groups stated that MDT work effectively met the needs of
young people and parents because the right colleagues with the right areas of
expertise were able to come together efficiently to address their needs.
Within this context, wider dissemination of information about SHARE would help the
innovation to be embedded and to reach a greater number of young people and
parents. However, dissemination would also mean that more young people and
families would access SHARE, and hence more resources would be needed in order
to cope with future staffing and demand. Therefore, funding for the programme
would need to be secured so service users did not become reliant on a service that
might then be withdrawn in the future.

57
Consideration of future development of this innovation and wider application
Future developments of SHARE as identified in the evaluation include:
longer time-frame and a bigger cohort of young people would be needed to
observe changes in LAC rates associated with SHARE at local authority level.
This could provide evidence of the impact of SHARE on rates of children
going into care. Nonetheless, these are useful indications of what SHARE
could do in the future to evaluate their services
larger sample sizes and longer follow-up periods would be needed to provide
more robust conclusions. This is because changes in empowerment, mental
health, wellbeing and resilience might take longer to be reflected in the
standardised measures. In addition, a measure such as the Goals and Goal
Based Outcomes (Law & Jacob, 2013) could be used to record specific
changes that young people are interested in and that go beyond symptom
change, such as being able to take the bus or feel confident to express
opinions, although it may be less suitable for use in episodes of crisis
SHARE’s relational focus seems to be central to the many benefits reported in
interviews by parents and young people. Therefore, this evaluation supports
the change in policy of moving the focus from a transactional service to a
relational one. Learning from SHARE should be spread to other services to
help promote a focus on crisis service provision that is organised around the
needs of children and families
building on the success of the cross-sector working and the multi-disciplinary
team, cross-sector training would be recommended to further integrate staff
across both health and social care
young people and parents were highly satisfied with a relational and flexible
service, which was felt to be more attuned to the needs of the whole family
than previous services. This highlights the importance and impact of a holistic
approach such as the one implemented by SHARE
an integrated and well-organised MDT, plus flexibility to work in an innovative
way, seem to motivate and empower staff, which in turn has a positive impact
on young people, parents and families
integration of SHARE with other services is crucial and requires an
improvement of infrastructure and data-sharing to facilitate efficient cross-
sector working. This may also result in improved data collection systems,
meaning the additional analyses could be conducted to inform the evaluation
of SHARE, such as examining whether demographic and case characteristics
58
moderate the impact of SHARE on mental health outcomes, and the
associations between using SHARE and changes in academic attainment
wider dissemination of SHARE to increase knowledge and accessibility is
needed. However, this should be contingent on confidence in future funding
and staffing capacity
59
References
Department for Education. 'Local authority interaction tool (LAIT)' 2016 (viewed on 5
July 2016)
House of Commons. ‘Mental health and well-being of looked-after children: Fourth
Report of Session 2015–16’ 2016 (viewed on 5 July 2016)
Kim-Cohen, J., Caspi, A., Moffitt, T.E., Harrington, H., Milne, B.J., & Poulton R.
(2003). Prior juvenile diagnoses in adults with mental disorder: developmental follow-
back of a prospective-longitudinal cohort. Archives of general psychiatry, 60(7), 709–
717.
Law, D. & Jacob, J. (2013). Goals and Goal Based Outcomes. London, CAMHS
Press.
Meltzer, H., Gatward, R., Corbin T., Goodman, R. & Ford, T. ‘The mental health of
young people looked after by local authorities in England’ Social Survey Division of
the Office for National Statistics 2003 (viewed on 5 July 2016)
Office for National Statistics (ONS). Population Estimates Analysis Tool 2016
(viewed on 5 July 2016)
Strelitz, J. Chapter 3: ‘The economic case for a shift to prevention’ in the Annual
Report of the Chief Medical Officer 2012, Our Children Deserve Better: Prevention
Pays. 2012 (viewed on 5 July 2016)
Wigan Council. Residential children's homes 2016 (viewed on 5 July 2016
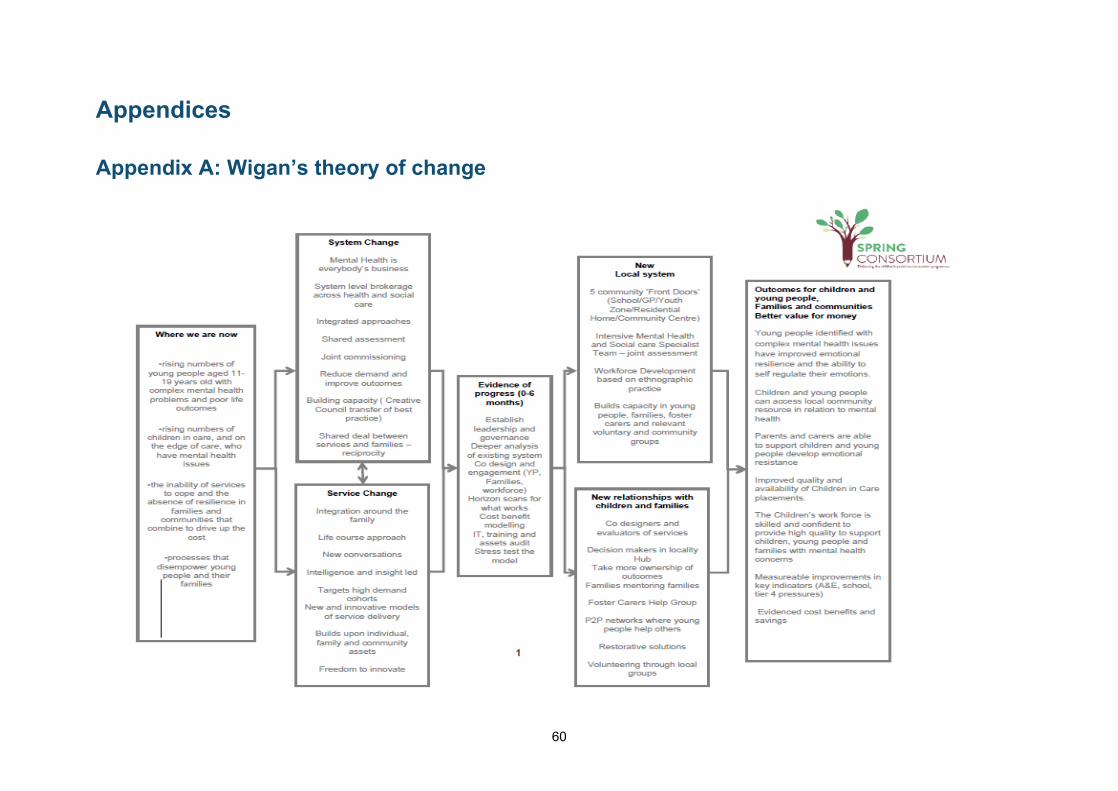
60
Appendices
Appendix A: Wigan’s theory of change
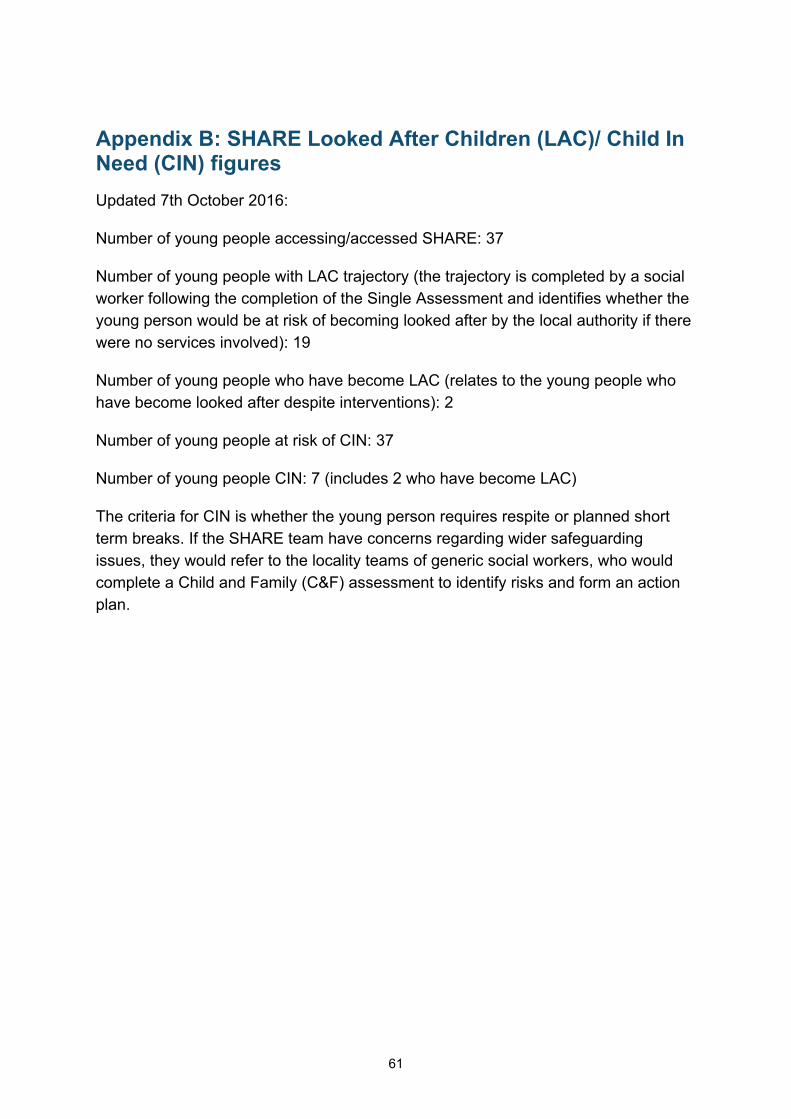
61
Appendix B: SHARE Looked After Children (LAC)/ Child In Need (CIN) figures
Updated 7th October 2016:
Number of young people accessing/accessed SHARE: 37
Number of young people with LAC trajectory (the trajectory is completed by a social
worker following the completion of the Single Assessment and identifies whether the
young person would be at risk of becoming looked after by the local authority if there
were no services involved): 19
Number of young people who have become LAC (relates to the young people who
have become looked after despite interventions): 2
Number of young people at risk of CIN: 37
Number of young people CIN: 7 (includes 2 who have become LAC)
The criteria for CIN is whether the young person requires respite or planned short
term breaks. If the SHARE team have concerns regarding wider safeguarding
issues, they would refer to the locality teams of generic social workers, who would
complete a Child and Family (C&F) assessment to identify risks and form an action
plan.
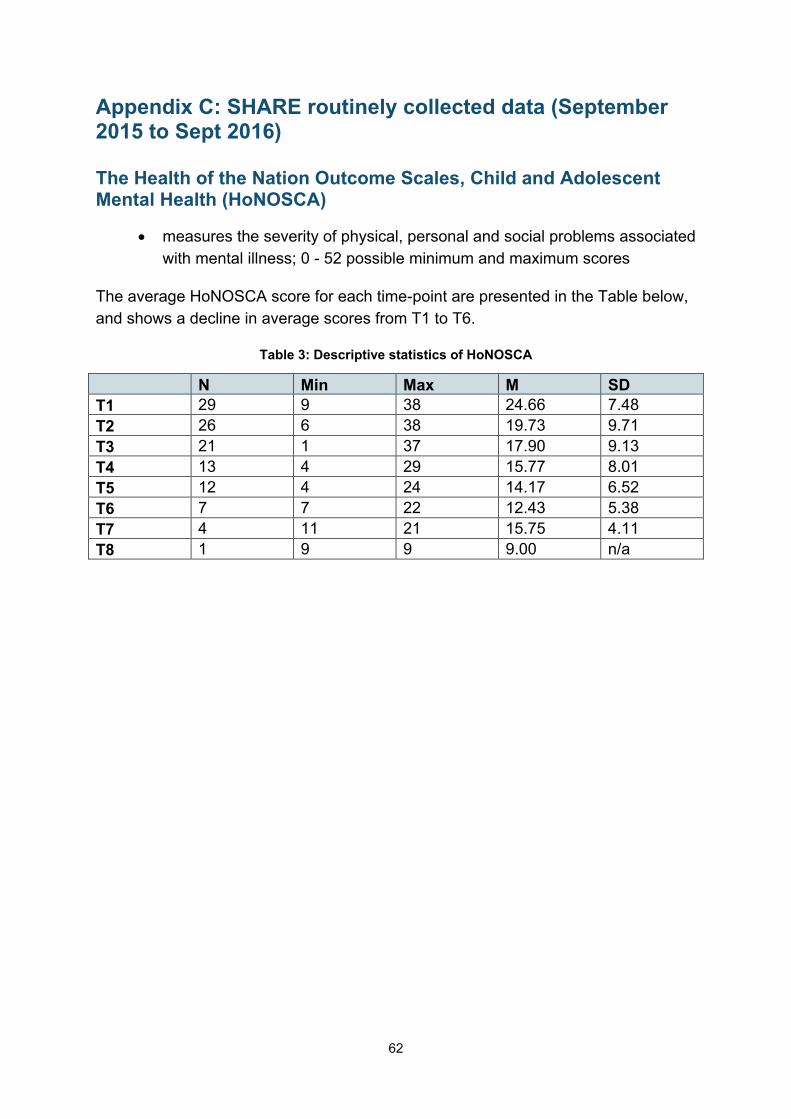
62
Appendix C: SHARE routinely collected data (September 2015 to Sept 2016)
The Health of the Nation Outcome Scales, Child and Adolescent Mental Health (HoNOSCA)
measures the severity of physical, personal and social problems associated
with mental illness; 0 - 52 possible minimum and maximum scores
The average HoNOSCA score for each time-point are presented in the Table below,
and shows a decline in average scores from T1 to T6.
Table 3: Descriptive statistics of HoNOSCA
N Min Max M SD
T1 29 9 38 24.66 7.48
T2 26 6 38 19.73 9.71
T3 21 1 37 17.90 9.13
T4 13 4 29 15.77 8.01
T5 12 4 24 14.17 6.52
T6 7 7 22 12.43 5.38
T7 4 11 21 15.75 4.11
T8 1 9 9 9.00 n/a

63
Strengths and Difficulties Questionnaire (SDQ)
possible individual scores go from 0 to 40 in Total Difficulties scale and 0 to
10 in sub-scales)
Table 4: Descriptive statistics of all the SDQ sub-scales and Total Difficulties Scale
T1 T2
N Min Max M SD N Min Max M SD
Young people
Emotional 17 2 10 7.12 1.83 10 4 8 6.30 1.34
Conduct 17 1 10 4.06 2.44 10 2 6 3.80 1.69
Hyperactivity 17 1 10 6.06 2.73 10 3 9 6.80 1.87
Peer 17 0 8 4.24 2.08 10 2 9 4.90 1.85
Tot diff 17 0 10 7.18 2.65 10 3 10 7.10 2.51
Prosocial 17 5 29 21.5 6.09 10 16 30 21.8 4.42
Impact 17 1 8 5.76 1.95 10 2 8 4.80 2.39
Parents
Emotional 14 1 9 6.36 3.10 5 5 9 7.40 1.52
Conduct 14 0 7 3.43 2.31 5 0 5 2.40 1.82
Hyperactivity 14 2 10 6.29 2.30 5 4 10 6.80 2.39
Peer 14 0 7 4.36 2.06 5 3 10 5.80 2.68
Tot diff 14 4 10 7.43 1.95 5 4 9 6.60 2.30
Prosocial 14 6 30 20.4 7.26 5 15 30 22.4 6.73
Impact 14 2 9 4.50 2.21 5 3 9 6.40 2.70
Table 5: Frequency of young people who were in the clinical and non-clinical group according
to young people and parents in all the SDQ subscales and the Total Difficulties Scale
Young People Parent
Non-clinical Clinical Non-clinical Clinical
Emotional T1 5 12 3 11
T2 5 5 0 5
Conduct T1 11 6 8 6
T2 7 3 4 1
Hyper T1 10 7 7 7
T2 5 5 2 3
Peer T1 13 4 4 10
T2 8 2 1 4
Prosocial T1 15 2 13 1
T2 8 2 4 1
Total diff T1 7 10 5 9
T2 3 7 1 4
Impact T1 1 16 0 14
T2 0 10 0 5

64
Table 6: Clinical change in young people reported by young people and parents in all the SDQ
subscales and Total Difficulties Scale
Young People Parent
Recovered
No change
Deterioration
Recovered
No change
Deterioration
Emotional 2 4 1 0 2 1
Conduct 1 5 1 0 3 0
Hyper 1 5 1 0 3 0
Peer 1 6 0 0 3 0
Prosocial 0 6 1 0 2 1
Total diff 1 5 1 0 3 0
Impact 0 6 1 0 3 0
Table 7: Reliable change in young people reported by young people and parents in all the SDQ
subscales and Total Difficulties Scale
Young People Parent
Reliably Improved
No change
Reliably deterior-ated
Reliably Improved
No change
Reliably deterior-ated
Emotional 0 7 0 0 3 0
Conduct 0 7 0 0 3 0
Hyper 0 7 0 0 3 0
Peer 0 7 0 0 3 0
Prosocial 0 7 0 0 3 0
Total diff 1 6 0 0 2 1
Impact 2 5 0 0 2 1

65
Table 8: Reliable change and clinical change in young people reported by young people and
parents in all the SDQ subscales and Total Difficulties Scale
RCC – Young People RCC – parents
Reliably Improved
No change
Reliably deterior- ated
Reliably Improved
No change
Reliably deterior-ated
Emotional CT
Recovered 0 2 0 0 0 0
No change 0 4 0 0 2 0
Deteriorated 0 1 0 0 1 0
Conduct CT
Recovered 0 1 0 0 0 0
No change 0 5 0 0 3 0
Deteriorated 0 1 0 0 0 0
Hyper CT
Recovered 0 1 0 0 0 0
No change 0 5 0 0 3 0
Deteriorated 0 1 0 0 0 0
Peer CT
Recovered 0 1 0 0 0 0
No change 0 6 0 0 0 0
Deteriorated 0 0 0 0 0 0
Prosocial CT
Recovered 0 0 0 0 0 0
No change 0 6 0 0 3 0
Deteriorated 0 1 0 0 0 0
Total diff CT
Recovered 1 0 0 0 0 0
No change 0 5 0 0 2 0
Deteriorated 0 1 0 0 1 0
Impact CT
Recovered 0 0 0 0 0 0
No change 2 4 0 0 2 1
Deteriorated 0 1 0 0 0 0

66
Appendix D: Experience of Service Questionnaire (CHI_ESQ)
Parents
What was really good? (7 comments)
felt listened to (5)
helpful advice and care (3)
individualised care / treated like a person (2)
empathetic staff (1)
What needs improving? (3 comments)
have residential house open (1)
more mental health trained staff (1)
more people aware of SHARE (1)
Anything else? (3 comments)
brilliant / helpful service (2)
helped us to get support from other services (1)
Young people
What was really good? (7 comments)
having someone to speak to / someone to listen (4)
amount of contact / always had time for me (3)
lovely, friendly staff (2)
help in crisis / time of need (2)
coping strategies for whole family (1)
What needs improving? (2 comments)
more 1:1 therapy / outreach work (1)
be supported by service for longer (1)
Anything else (1 comment)
staff are amazing (1)

67
Appendix E: Contextual data (Source: Wigan Council)
Number of children in care
Table 9: Number of children who were in care by age and month
T1 T2
Oct-14
Nov-14
Dec-14
Jan-15
Feb-15
Mar-15
Apr-15
May-15
Jun-15
Jul-15
Aug-15
Sep-15
Oct-15
Nov-15
Dec-15
Jan-16
Feb-16
Mar-16
Apr-16
May-16
Jun-16
Jul-16
Under 11
304 307 305 308 308 302 289 292 293 292 296 294 282 272 278 279 279 279 275 265 247 241
11 plus
198 203 199 198 197 202 200 201 199 202 203 199 199 202 205 206 209 204 203 204 208 208
Total 502 510 504 506 505 504 489 493 492 494 499 493 481 474 483 485 488 483 478 469 455 449
Figure 6: Number of children who were in care by age and month
0
50
100
150
200
250
300
350
Oct-
14
No
v-1
4
De
c-1
4
Ja
n-1
5
Fe
b-1
5
Ma
r-1
5
Ap
r-1
5
Ma
y-1
5
Ju
n-1
5
Ju
l-15
Au
g-1
5
Se
p-1
5
Oct-
15
No
v-1
5
De
c-1
5
Ja
n-1
6
Fe
b-1
6
Ma
r-1
6
Ap
r-1
6
Ma
y-1
6
Ju
n-1
6
Ju
l-16
T1 T2
Nu
mb
er
of
LA
C c
hild
ren
Aged 0 to 10 (T1) Aged 11 to 18 (T1) Aged 0 to 10 (T2) Aged 11 to 18 (T2)
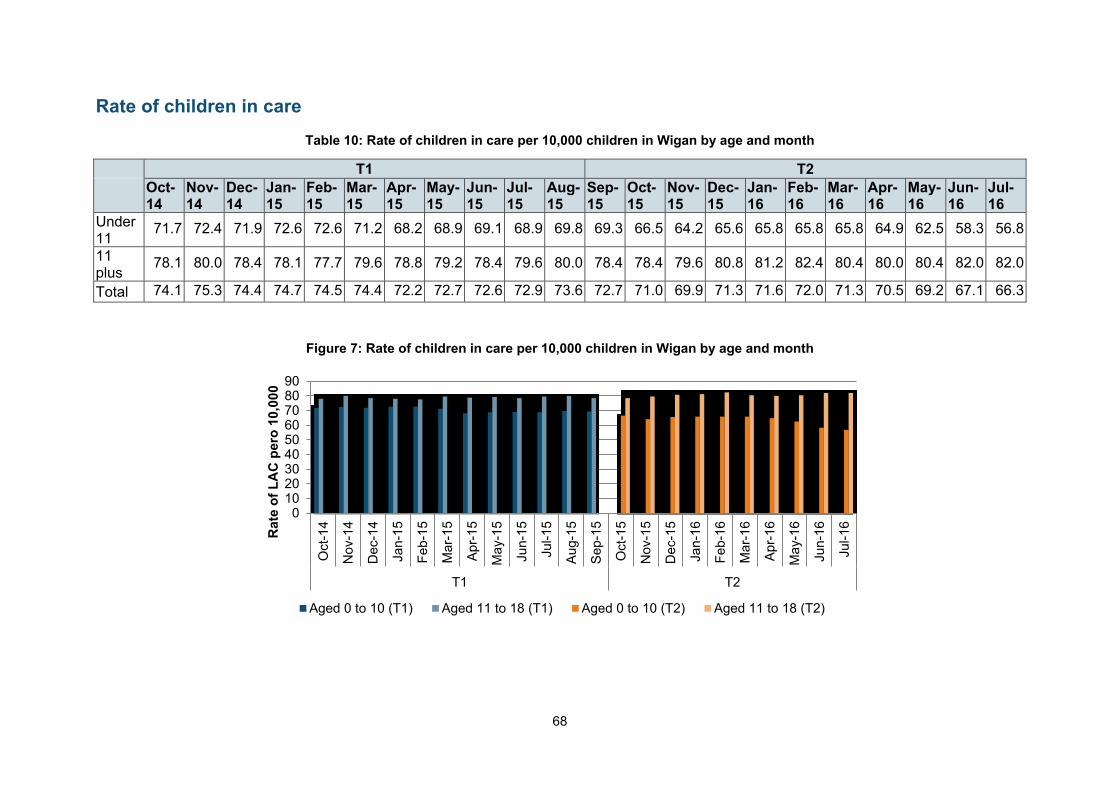
68
Rate of children in care
Table 10: Rate of children in care per 10,000 children in Wigan by age and month
T1 T2
Oct-14
Nov-14
Dec-14
Jan-15
Feb-15
Mar-15
Apr-15
May-15
Jun-15
Jul-15
Aug-15
Sep-15
Oct-15
Nov-15
Dec-15
Jan-16
Feb-16
Mar-16
Apr-16
May-16
Jun-16
Jul-16
Under 11
71.7 72.4 71.9 72.6 72.6 71.2 68.2 68.9 69.1 68.9 69.8 69.3 66.5 64.2 65.6 65.8 65.8 65.8 64.9 62.5 58.3 56.8
11 plus
78.1 80.0 78.4 78.1 77.7 79.6 78.8 79.2 78.4 79.6 80.0 78.4 78.4 79.6 80.8 81.2 82.4 80.4 80.0 80.4 82.0 82.0
Total 74.1 75.3 74.4 74.7 74.5 74.4 72.2 72.7 72.6 72.9 73.6 72.7 71.0 69.9 71.3 71.6 72.0 71.3 70.5 69.2 67.1 66.3
Figure 7: Rate of children in care per 10,000 children in Wigan by age and month
0102030405060708090
Oct-
14
No
v-1
4
De
c-1
4
Ja
n-1
5
Fe
b-1
5
Ma
r-1
5
Ap
r-1
5
Ma
y-1
5
Ju
n-1
5
Ju
l-15
Au
g-1
5
Se
p-1
5
Oct-
15
No
v-1
5
De
c-1
5
Ja
n-1
6
Fe
b-1
6
Ma
r-1
6
Ap
r-1
6
Ma
y-1
6
Ju
n-1
6
Ju
l-16
T1 T2
Ra
te o
f L
AC
pe
ro 1
0,0
00
Aged 0 to 10 (T1) Aged 11 to 18 (T1) Aged 0 to 10 (T2) Aged 11 to 18 (T2)
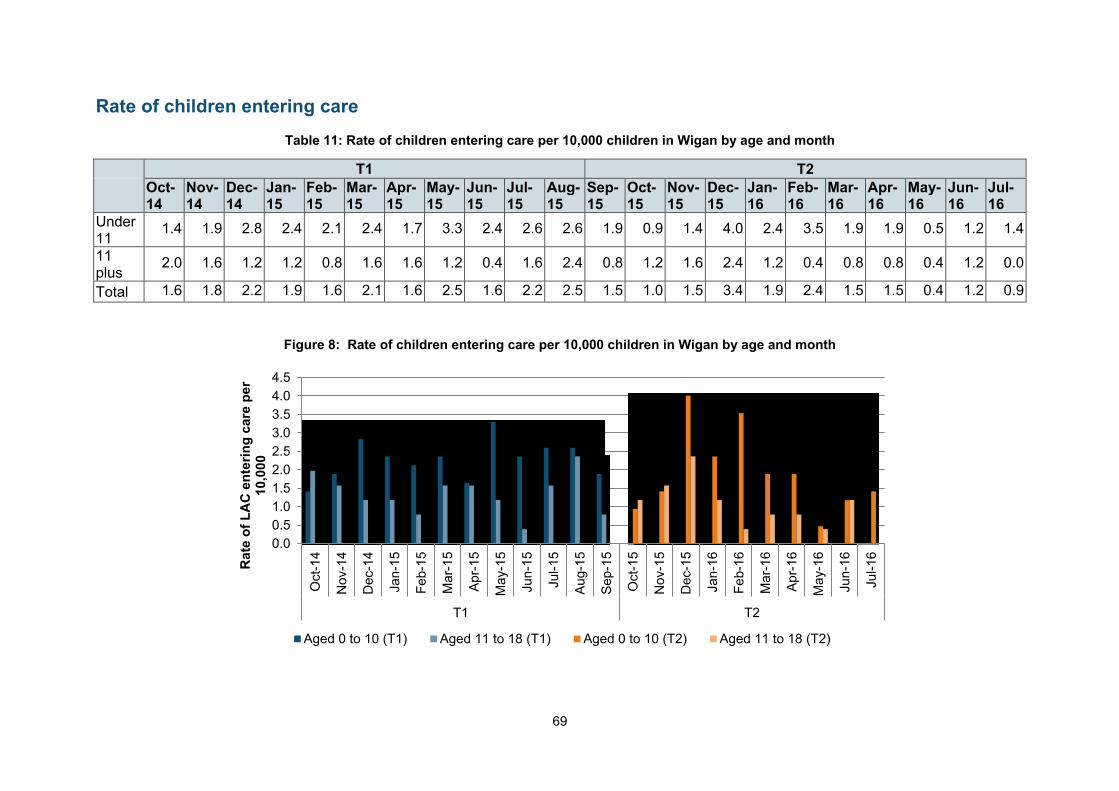
69
Rate of children entering care
Table 11: Rate of children entering care per 10,000 children in Wigan by age and month
T1 T2
Oct-14
Nov-14
Dec-14
Jan-15
Feb-15
Mar-15
Apr-15
May-15
Jun-15
Jul-15
Aug-15
Sep-15
Oct-15
Nov-15
Dec-15
Jan-16
Feb-16
Mar-16
Apr-16
May-16
Jun-16
Jul-16
Under 11
1.4 1.9 2.8 2.4 2.1 2.4 1.7 3.3 2.4 2.6 2.6 1.9 0.9 1.4 4.0 2.4 3.5 1.9 1.9 0.5 1.2 1.4
11 plus
2.0 1.6 1.2 1.2 0.8 1.6 1.6 1.2 0.4 1.6 2.4 0.8 1.2 1.6 2.4 1.2 0.4 0.8 0.8 0.4 1.2 0.0
Total 1.6 1.8 2.2 1.9 1.6 2.1 1.6 2.5 1.6 2.2 2.5 1.5 1.0 1.5 3.4 1.9 2.4 1.5 1.5 0.4 1.2 0.9
Figure 8: Rate of children entering care per 10,000 children in Wigan by age and month
0.0
0.5
1.0
1.5
2.0
2.5
3.0
3.5
4.0
4.5
Oct-
14
No
v-1
4
De
c-1
4
Ja
n-1
5
Fe
b-1
5
Ma
r-1
5
Ap
r-1
5
Ma
y-1
5
Ju
n-1
5
Ju
l-15
Au
g-1
5
Se
p-1
5
Oct-
15
No
v-1
5
De
c-1
5
Ja
n-1
6
Fe
b-1
6
Ma
r-1
6
Ap
r-1
6
Ma
y-1
6
Ju
n-1
6
Ju
l-16
T1 T2
Ra
te o
f L
AC
en
teri
ng
ca
re p
er
10
,00
0
Aged 0 to 10 (T1) Aged 11 to 18 (T1) Aged 0 to 10 (T2) Aged 11 to 18 (T2)

70
Rate of children leaving care
Table 12: Rate of children leaving care per 10,000 children in Wigan by age and month
T1 T2
Oct-14
Nov-14
Dec-14
Jan-15
Feb-15
Mar-15
Apr-15
May-15
Jun-15
Jul-15
Aug-15
Sep-15
Oct-15
Nov-15
Dec-15
Jan-16
Feb-16
Mar-16
Apr-16
May-16
Jun-16
Jul-16
Under 11
2.8 0.5 3.3 0.9 1.7 2.8 4.5 2.4 1.7 1.7 1.4 2.4 3.1 2.8 2.1 1.7 2.1 1.7 2.1 1.9 5.2 2.1
11 plus
1.6 0.8 2.8 2.4 2.0 1.2 2.8 1.2 2.0 2.4 2.4 2.4 2.4 1.6 2.4 1.6 1.6 3.2 2.4 0.8 0.8 1.2
Total 2.4 0.6 3.1 1.5 1.8 2.2 3.8 1.9 1.8 1.9 1.8 2.4 2.8 2.4 2.2 1.6 1.9 2.2 2.2 1.5 3.5 1.8
Figure 9: Rate of children leaving care per 10,000 children in Wigan by age and month
0
1
2
3
4
5
6
Oct-
14
No
v-1
4
De
c-1
4
Ja
n-1
5
Fe
b-1
5
Ma
r-1
5
Ap
r-1
5
Ma
y-1
5
Ju
n-1
5
Ju
l-15
Au
g-1
5
Se
p-1
5
Oct-
15
No
v-1
5
De
c-1
5
Ja
n-1
6
Fe
b-1
6
Ma
r-1
6
Ap
r-1
6
Ma
y-1
6
Ju
n-1
6
Ju
l-16
T1 T2
Ra
te o
f L
AC
le
avin
g c
are
pe
ro 1
0,0
00
Aged 0 to 10 (T1) Aged 11 to 18 (T1) Aged 0 to 10 (T2) Aged 11 to 18 (T2)

71
Children entering care for a second or subsequent time
Table 13: Number and percentage of children entering care for second or subsequent time out
of all the children entering care in Wigan by age and month
Month
Aged under 11 Aged 11 plus Total
Entering care
2nd time+
% 2nd time+
Entering care
2nd time+
% 2nd time+
Entering care
2nd time+
% 2nd time+
Oct-14 6 0 0% 5 2 18% 11 2 18%
Nov-14 8 2 17% 4 1 8% 12 3 25%
Dec-14 12 0 0% 3 1 7% 15 1 7%
Jan-15 10 0 0% 3 0 0% 13 0 0%
Feb-15 9 0 0% 2 0 0% 11 0 0%
Mar-15 10 0 0% 4 2 14% 14 2 14%
Apr-15 7 0 0% 4 1 9% 11 1 9%
May-15
14 0 0% 3 0 0% 17 0 0%
Jun-15 10 0 0% 1 0 0% 11 0 0%
Jul-15 11 0 0% 4 0 0% 15 0 0%
Aug-15 11 0 0% 6 0 0% 17 0 0%
Sep-15 8 0 0% 2 1 10% 10 1 10%
Oct-15 4 0 0% 3 0 0% 7 0 0%
Nov-15 6 0 0% 4 0 0% 10 0 0%
Dec-15 17 0 0% 6 3 13% 23 3 13%
Jan-16 10 0 0% 3 1 8% 13 1 8%
Feb-16 15 0 0% 1 0 0% 16 0 0%
Mar-16 8 1 10% 2 0 0% 10 1 10%
Apr-16 8 1 10% 2 0 0% 10 1 10%
May-16
2 0 0% 1 1 33% 3 1 33%
Jun-16 5 0 0% 3 0 0% 8 0 0%
Jul-16 6 0 0% 0 0 0% 6 0 0%

72
Figure 10: Percentage of children entering care for second or subsequent time out of all the
children entering care in Wigan by age and month
0
0
0
0
0
0
0
0
Oct
-14
No
v-14
Dec
-14
Jan
-15
Feb
-15
Mar
-15
Ap
r-1
5
May
-15
Jun
-15
Jul-
15
Au
g-1
5
Sep
-15
Oct
-15
No
v-15
Dec
-15
Jan
-16
Feb
-16
Mar
-16
Ap
r-1
6
May
-16
Jun
-16
Jul-
16
T1 T2
Pe
rce
nta
ge
of
ch
ild
ren
en
teri
ng
ca
re
for
a s
ec
on
d o
r s
ub
se
qu
en
t ti
me
Aged 0 to 10 (T1) Aged 11 to 18 (T1) Aged 0 to 10 (T2) Aged 11 to 18 (T2)
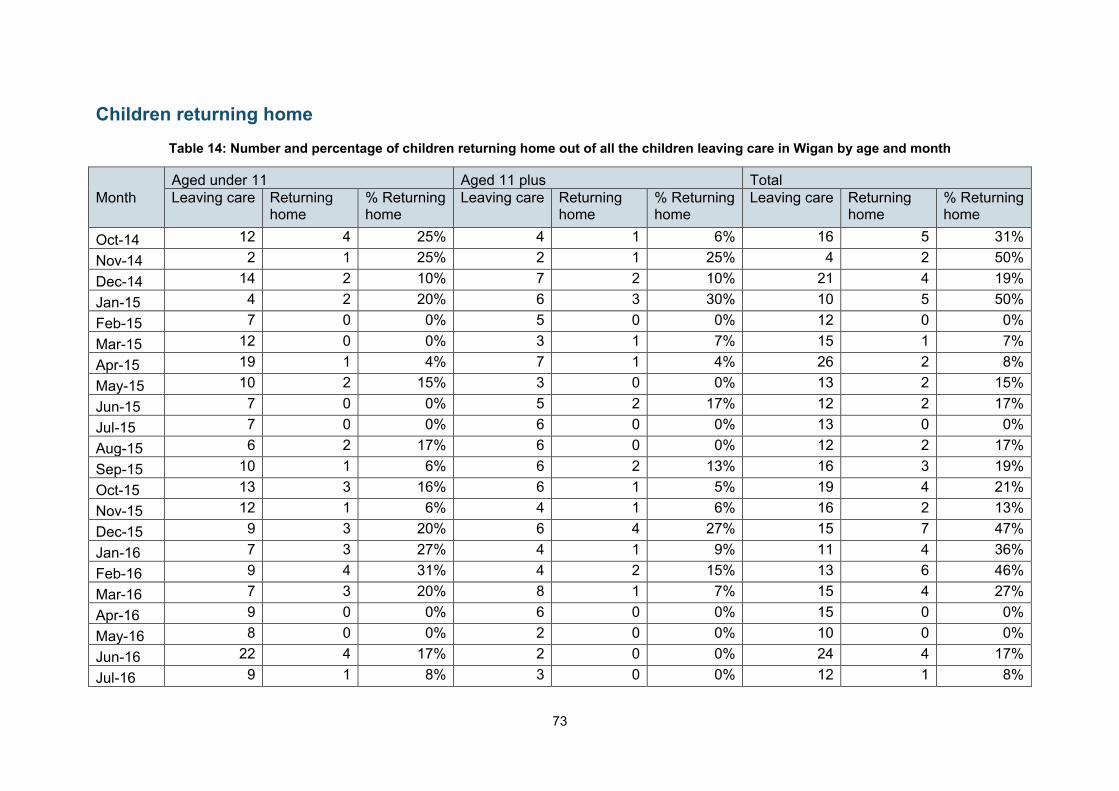
73
Children returning home
Table 14: Number and percentage of children returning home out of all the children leaving care in Wigan by age and month
Month
Aged under 11 Aged 11 plus Total
Leaving care Returning home
% Returning home
Leaving care Returning home
% Returning home
Leaving care Returning home
% Returning home
Oct-14 12 4 25% 4 1 6% 16 5 31%
Nov-14 2 1 25% 2 1 25% 4 2 50%
Dec-14 14 2 10% 7 2 10% 21 4 19%
Jan-15 4 2 20% 6 3 30% 10 5 50%
Feb-15 7 0 0% 5 0 0% 12 0 0%
Mar-15 12 0 0% 3 1 7% 15 1 7%
Apr-15 19 1 4% 7 1 4% 26 2 8%
May-15 10 2 15% 3 0 0% 13 2 15%
Jun-15 7 0 0% 5 2 17% 12 2 17%
Jul-15 7 0 0% 6 0 0% 13 0 0%
Aug-15 6 2 17% 6 0 0% 12 2 17%
Sep-15 10 1 6% 6 2 13% 16 3 19%
Oct-15 13 3 16% 6 1 5% 19 4 21%
Nov-15 12 1 6% 4 1 6% 16 2 13%
Dec-15 9 3 20% 6 4 27% 15 7 47%
Jan-16 7 3 27% 4 1 9% 11 4 36%
Feb-16 9 4 31% 4 2 15% 13 6 46%
Mar-16 7 3 20% 8 1 7% 15 4 27%
Apr-16 9 0 0% 6 0 0% 15 0 0%
May-16 8 0 0% 2 0 0% 10 0 0%
Jun-16 22 4 17% 2 0 0% 24 4 17%
Jul-16 9 1 8% 3 0 0% 12 1 8%
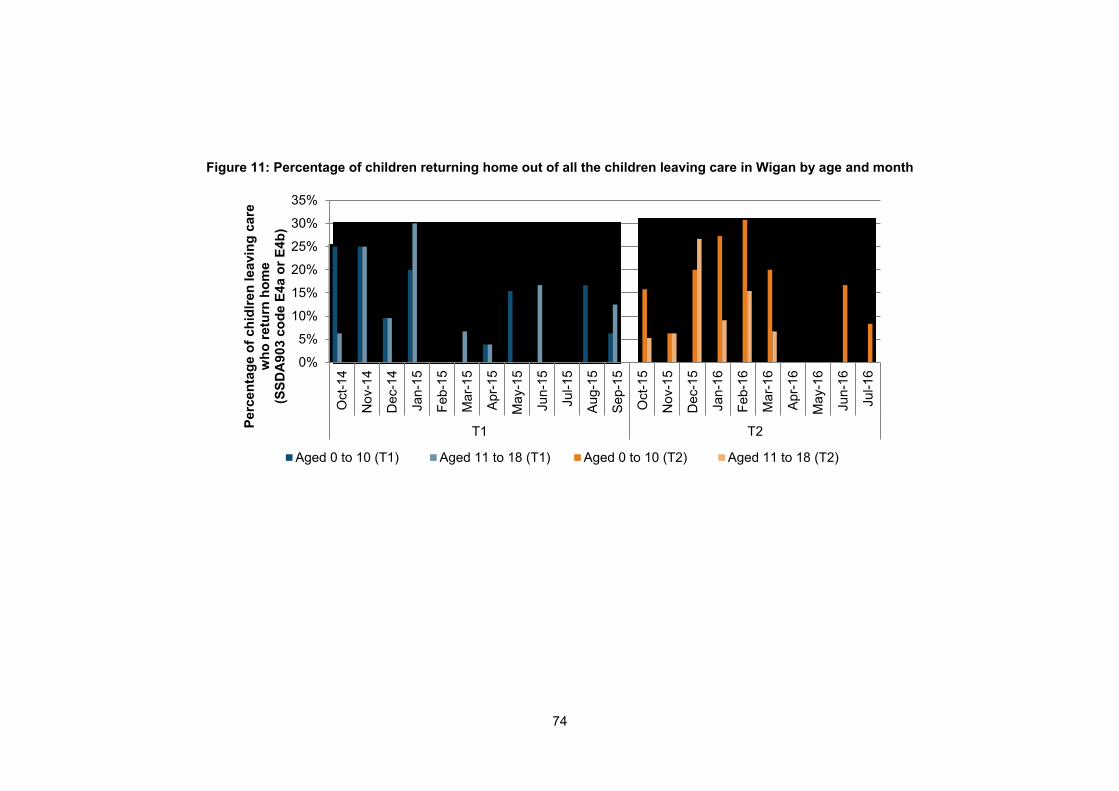
74
Figure 11: Percentage of children returning home out of all the children leaving care in Wigan by age and month
0%
5%
10%
15%
20%
25%
30%
35%
Oct-
14
No
v-1
4
De
c-1
4
Ja
n-1
5
Fe
b-1
5
Ma
r-1
5
Ap
r-1
5
Ma
y-1
5
Ju
n-1
5
Ju
l-15
Au
g-1
5
Se
p-1
5
Oct-
15
No
v-1
5
De
c-1
5
Ja
n-1
6
Fe
b-1
6
Ma
r-1
6
Ap
r-1
6
Ma
y-1
6
Ju
n-1
6
Ju
l-16
T1 T2
Pe
rce
nta
ge
of
ch
idlr
en
le
avin
g c
are
w
ho
re
turn
ho
me
(S
SD
A9
03
co
de
E4
a o
r E
4b
)
Aged 0 to 10 (T1) Aged 11 to 18 (T1) Aged 0 to 10 (T2) Aged 11 to 18 (T2)

75
Children re-referred to social services
Table 15: Number and percentage of children who were re-referred to social services out of all
the children referred to social services
Month
Aged under 11 Aged 11 plus Total
Re-referral % re-referral
Re-referral % re-referral
Re-referral % re-referral
Total referrals
Oct-14 73 19% 19 5% 92 23% 392
Nov-14 70 14% 35 7% 105 22% 488
Dec-14 75 17% 28 6% 103 24% 433
Jan-15 50 12% 24 6% 74 18% 404
Feb-15 59 13% 38 9% 97 22% 443
Mar-15 81 16% 25 5% 106 21% 494
Apr-15 74 17% 25 6% 99 23% 434
May-15 56 15% 23 6% 79 21% 372
Jun-15 81 19% 38 9% 119 28% 424
Jul-15 80 16% 38 7% 118 23% 512
Aug-15 52 15% 24 7% 76 21% 355
Sep-15 74 20% 29 8% 103 27% 379
Oct-15 58 17% 26 8% 84 25% 338
Nov-15 53 16% 34 10% 87 26% 338
Dec-15 81 22% 33 9% 114 31% 372
Jan-16 66 18% 35 9% 101 27% 369
Feb-16 58 17% 29 9% 87 26% 335
Mar-16 76 19% 27 7% 103 25% 406
Apr-16 61 15% 23 6% 84 21% 407
May-16 84 20% 40 9% 124 29% 424
Jun-16 67 19% 22 6% 89 26% 347
Jul-16 47 17% 21 8% 68 24% 280
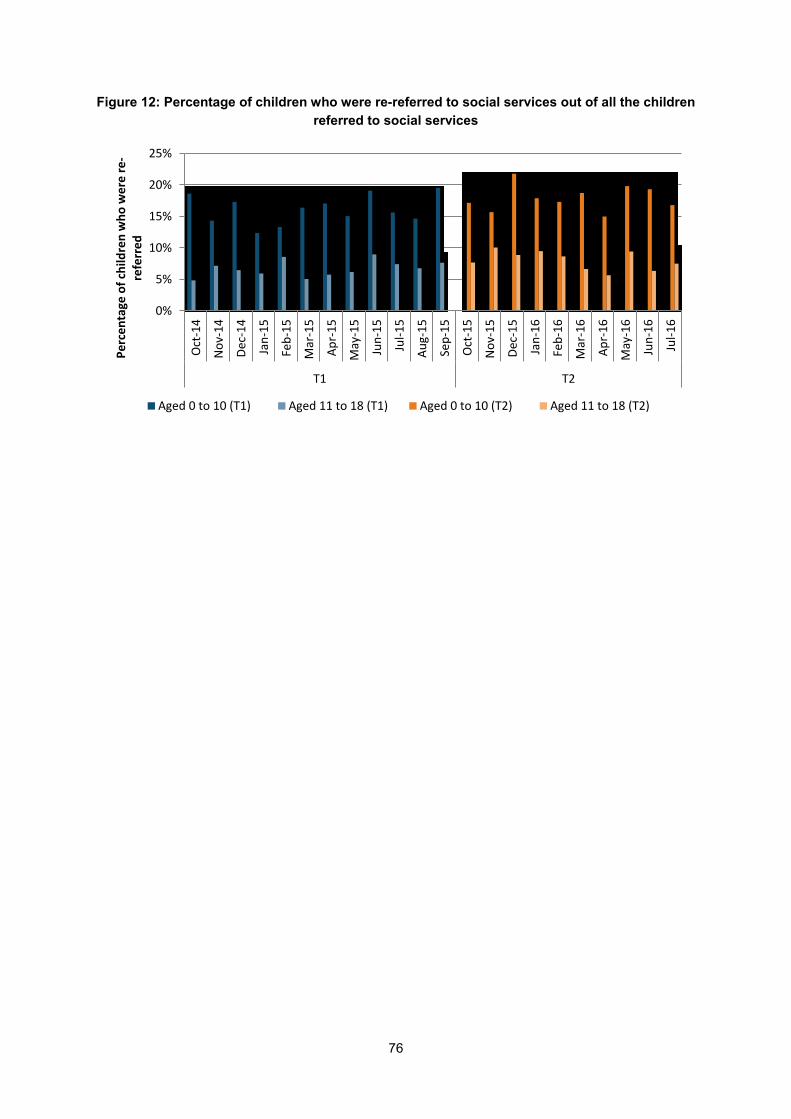
76
Figure 12: Percentage of children who were re-referred to social services out of all the children
referred to social services
0%
5%
10%
15%
20%
25%
Oct
-14
No
v-1
4
Dec
-14
Jan
-15
Feb
-15
Mar
-15
Ap
r-1
5
May
-15
Jun
-15
Jul-
15
Au
g-1
5
Sep
-15
Oct
-15
No
v-1
5
Dec
-15
Jan
-16
Feb
-16
Mar
-16
Ap
r-1
6
May
-16
Jun
-16
Jul-
16
T1 T2
Pe
rce
nta
ge o
f ch
ildre
n w
ho
we
re r
e-
refe
rre
d
Aged 0 to 10 (T1) Aged 11 to 18 (T1) Aged 0 to 10 (T2) Aged 11 to 18 (T2)

77
Children in residential care
Table 16: Number and percentage of all the children in care who were in residential care
Month
Aged under 11 Aged 11 plus Total
In residential care
% in residential care
In residential care
% in residential care
Total in residential care
% Total in residential care
Total in care
Oct-14 2 0.4% 48 10% 50 10% 502
Nov-14 1 0.2% 49 10% 50 10% 510
Dec-14 2 0.4% 50 10% 52 10% 504
Jan-15 2 0.4% 49 10% 51 10% 506
Feb-15 2 0.4% 49 10% 51 10% 505
Mar-15 2 0.4% 50 10% 52 10% 504
Apr-15 3 0.6% 48 10% 51 10% 489
May-15 3 0.6% 46 9% 49 10% 493
Jun-15 3 0.6% 49 10% 52 11% 492
Jul-15 3 0.6% 46 9% 49 10% 494
Aug-15 3 0.6% 47 9% 50 10% 499
Sep-15 4 0.8% 42 9% 46 9% 493
Oct-15 4 0.8% 43 9% 47 10% 481
Nov-15 3 0.6% 43 9% 46 10% 474
Dec-15 2 0.4% 41 8% 43 9% 483
Jan-16 2 0.4% 42 9% 44 9% 485
Feb-16 2 0.4% 41 8% 43 9% 488
Mar-16 2 0.4% 40 8% 42 9% 483
Apr-16 2 0.4% 37 8% 39 8% 478
May-16 3 0.6% 39 8% 42 9% 469
Jun-16 3 0.7% 41 9% 44 10% 455
Jul-16 3 0.7% 44 10% 47 10% 449
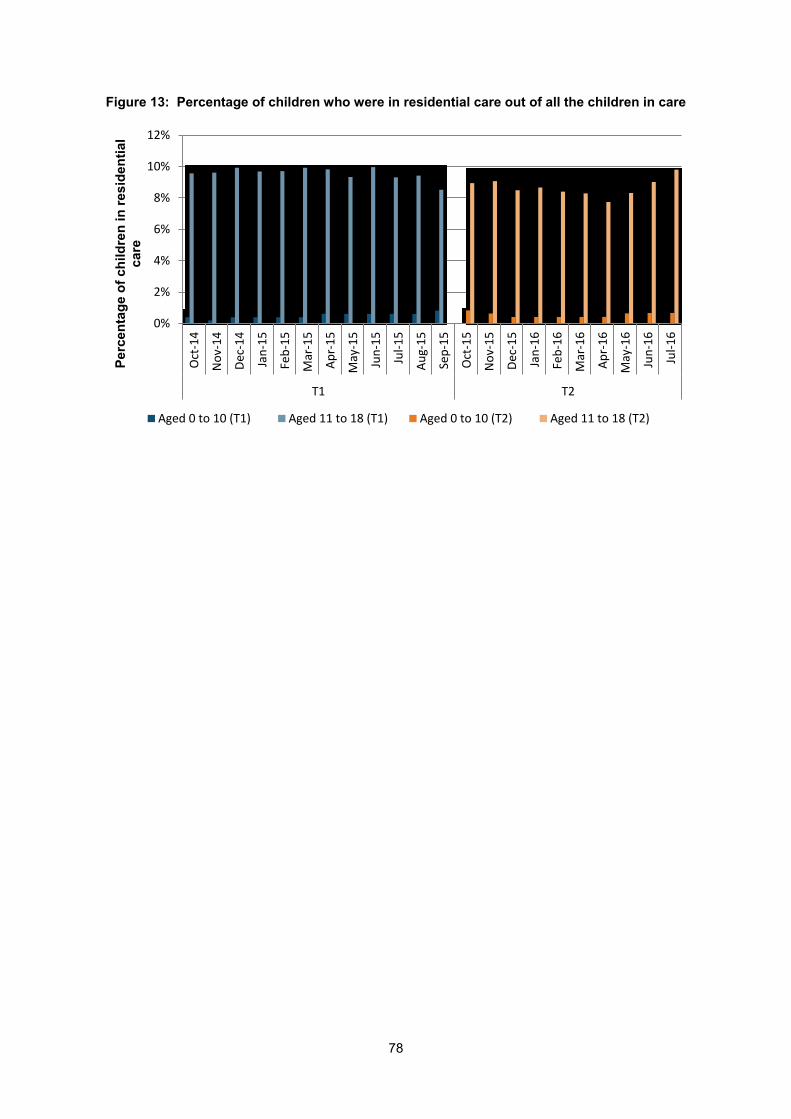
78
Figure 13: Percentage of children who were in residential care out of all the children in care
0%
2%
4%
6%
8%
10%
12%
Oct
-14
No
v-1
4
Dec
-14
Jan
-15
Feb
-15
Mar
-15
Ap
r-1
5
May
-15
Jun
-15
Jul-
15
Au
g-1
5
Sep
-15
Oct
-15
No
v-1
5
Dec
-15
Jan
-16
Feb
-16
Mar
-16
Ap
r-1
6
May
-16
Jun
-16
Jul-
16
T1 T2
Pe
rce
nta
ge
of
ch
ild
ren
in
re
sid
en
tia
l c
are
Aged 0 to 10 (T1) Aged 11 to 18 (T1) Aged 0 to 10 (T2) Aged 11 to 18 (T2)

79
© Department for Education
Reference: DFE-RR603
ISBN: 978-1-78105-663-9
The views expressed in this report are the authors’ and do not necessarily reflect those of
the Department for Education.
Any enquiries regarding this publication should be sent to us at:
[email protected] or www.education.gov.uk/contactus
This document is available for download at www.gov.uk/government/publications