special education advisory panel - dese.mo.gov · significant disproportionality . the department...
TRANSCRIPT

Special Education Advisory Panel
March 2, 2018

2
Significant Disproportionality
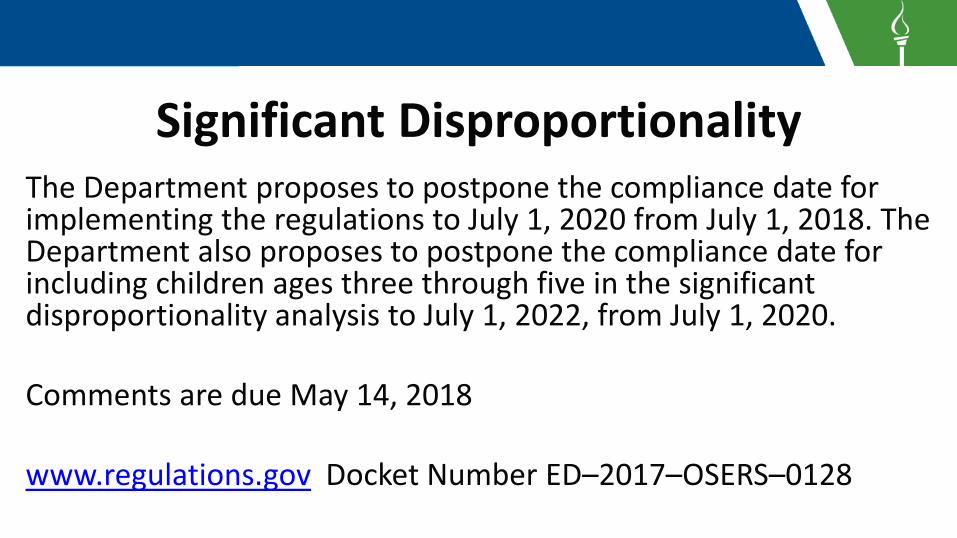
Significant Disproportionality The Department proposes to postpone the compliance date for implementing the regulations to July 1, 2020 from July 1, 2018. TheDepartment also proposes to postpone the compliance date for including children ages three through five in the significantdisproportionality analysis to July 1, 2022, from July 1, 2020.
Comments are due May 14, 2018
www.regulations.gov Docket Number ED–2017–OSERS–0128

Significant Disproportionality “The Department is concerned, however, given the public comments it has received in response to its general solicitation in 2017 on regulatory reform, that the Equity in IDEA regulations may not appropriately address the problem of significant disproportionality. We therefore propose to postpone by two years the compliance dates for the regulations so that we may review all of the issues raised and determine how to better serve children with disabilities.”

Areas Reviewed for Racial/Ethnic Disproportionality • Disproportionate Representation (APR Indicators 9 & 10)
All students with disabilities – identification rates Students with disabilities in six areas: ID, ED, LD, Autism, SLP, OHI
• Significant Discrepancies in Discipline Rates (SWD & Nondisabled) (APR Indicator 4B) OSS > 10 days
• Significant Disproportionality All students with disabilities – identification rates Students with disabilities in six areas: ID, ED, LD, Autism, SLP, OHI More restrictive placements OSS > 10 days OSS <= 10 days ISS > 10 days ISS <= 10 days Total Discipline Removals

Significant Disproportionality Criteria • Minimum cell size (numerator): 10 • Minimum n size (denominator): 30 • Number of years: 3 • Risk ratio: 3.5 for all areas (Identification, Placements,
Discipline) • Progress: Decrease from Year 1 to Year 2 and from Year 2
to Year 3, with overall decrease in risk ratio from Year 1 to Year 3 of 0.2
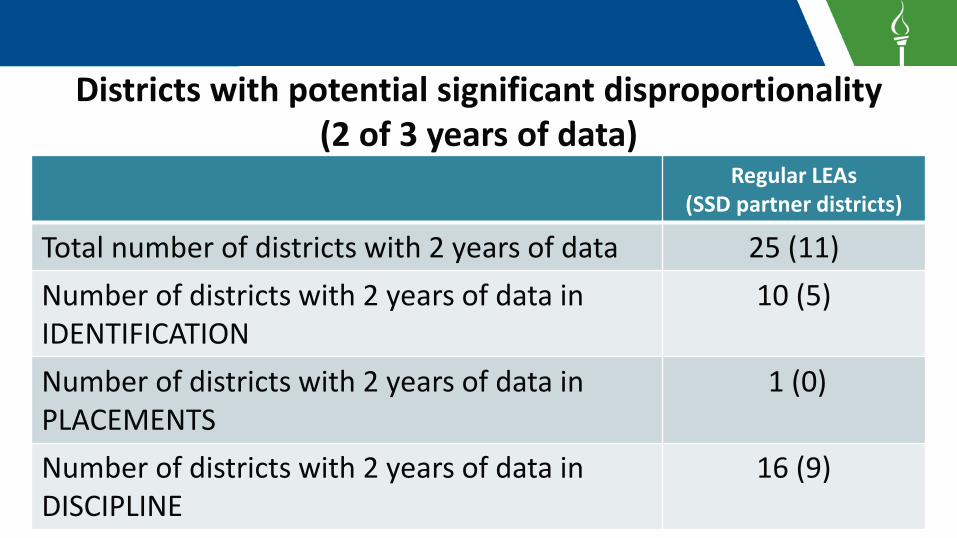
Districts with potential significant disproportionality (2 of 3 years of data)
Regular LEAs (SSD partner districts)
Total number of districts with 2 years of data 25 (11) Number of districts with 2 years of data in 10 (5) IDENTIFICATION Number of districts with 2 years of data in 1 (0) PLACEMENTS Number of districts with 2 years of data in 16 (9) DISCIPLINE
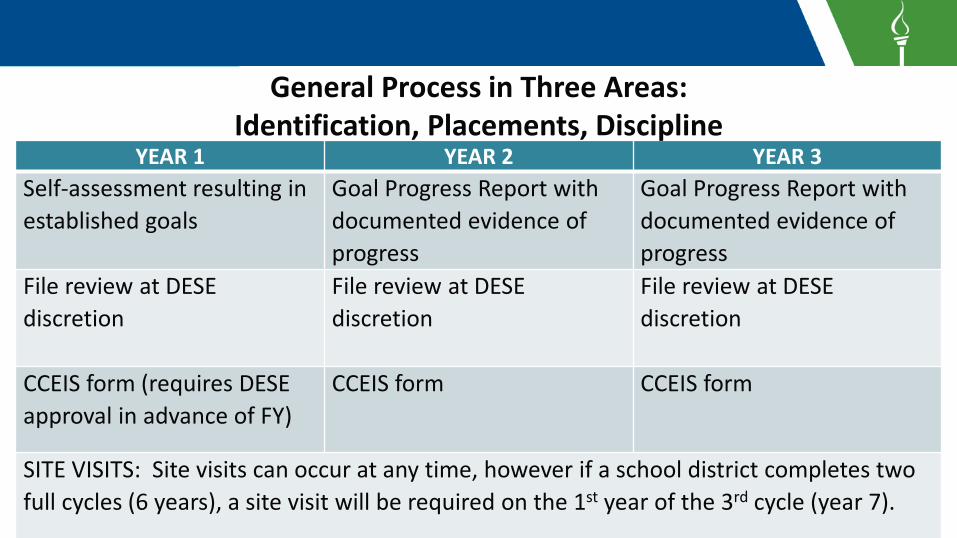
General Process in Three Areas: Identification, Placements, Discipline
YEAR 1 YEAR 2 YEAR 3 Self-assessment resulting in established goals
Goal Progress Report with documented evidence of progress
Goal Progress Report with documented evidence of progress
File review at DESE File review at DESE File review at DESE discretion discretion discretion
CCEIS form (requires DESE CCEIS form CCEIS form approval in advance of FY)
SITE VISITS: Site visits can occur at any time, however if a school district completes two full cycles (6 years), a site visit will be required on the 1st year of the 3rd cycle (year 7).
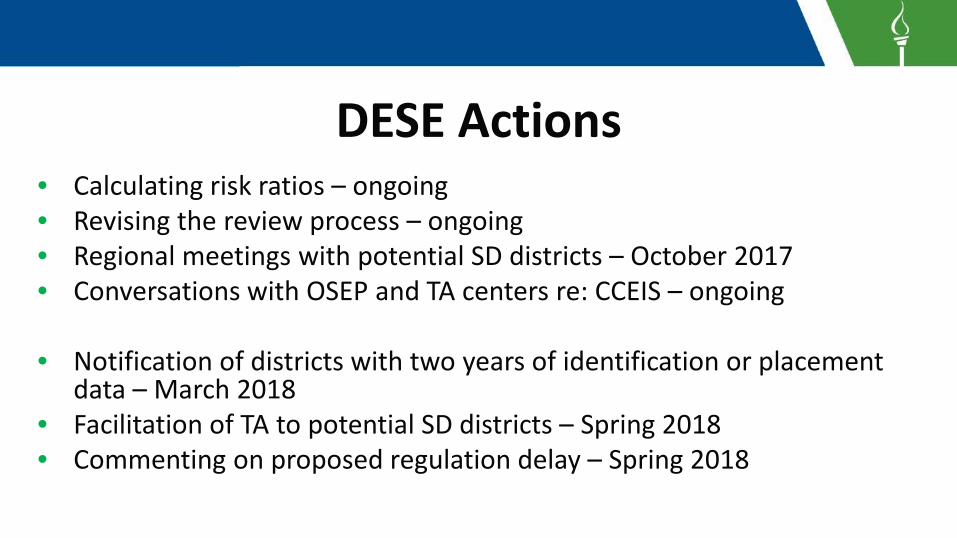
DESE Actions • Calculating risk ratios – ongoing • Revising the review process – ongoing • Regional meetings with potential SD districts – October 2017 • Conversations with OSEP and TA centers re: CCEIS – ongoing
• Notification of districts with two years of identification or placementdata – March 2018
• Facilitation of TA to potential SD districts – Spring 2018 • Commenting on proposed regulation delay – Spring 2018

10
Alternate Assessment (MAP-A) 1% Cap

ESSA Changes
• NCLB included a 1% cap on “proficiency rates” on alternate assessments
• ESSA changed to a 1% cap on “participation” on alternate assessments
• The additional 2% assessment used in many states removed as an option under ESSA
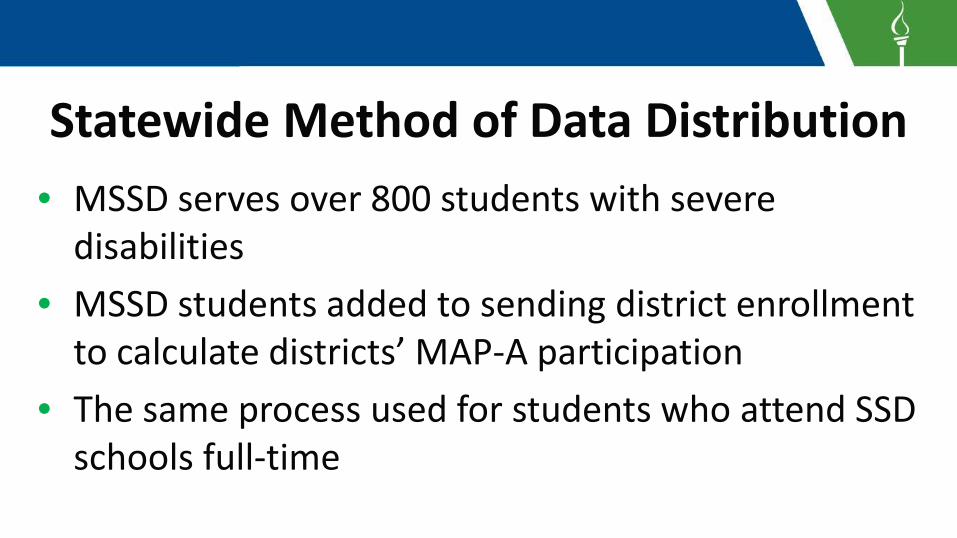
Statewide Method of Data Distribution • MSSD serves over 800 students with severe
disabilities • MSSD students added to sending district enrollment
to calculate districts’ MAP-A participation • The same process used for students who attend SSD
schools full-time
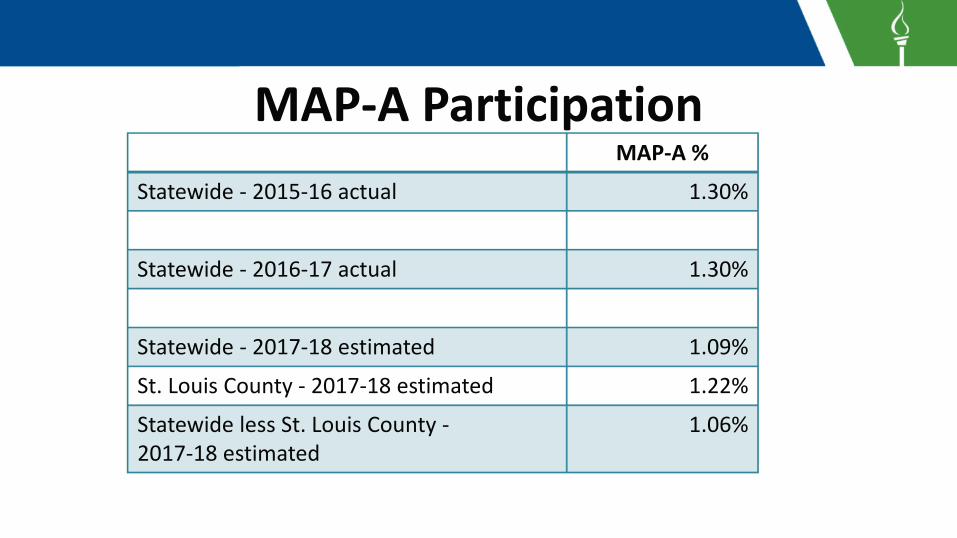
MAP-A Participation MAP-A %
Statewide - 2015-16 actual 1.30%
Statewide - 2016-17 actual 1.30%
Statewide - 2017-18 estimated 1.09%
St. Louis County - 2017-18 estimated 1.22%
Statewide less St. Louis County - 1.06% 2017-18 estimated
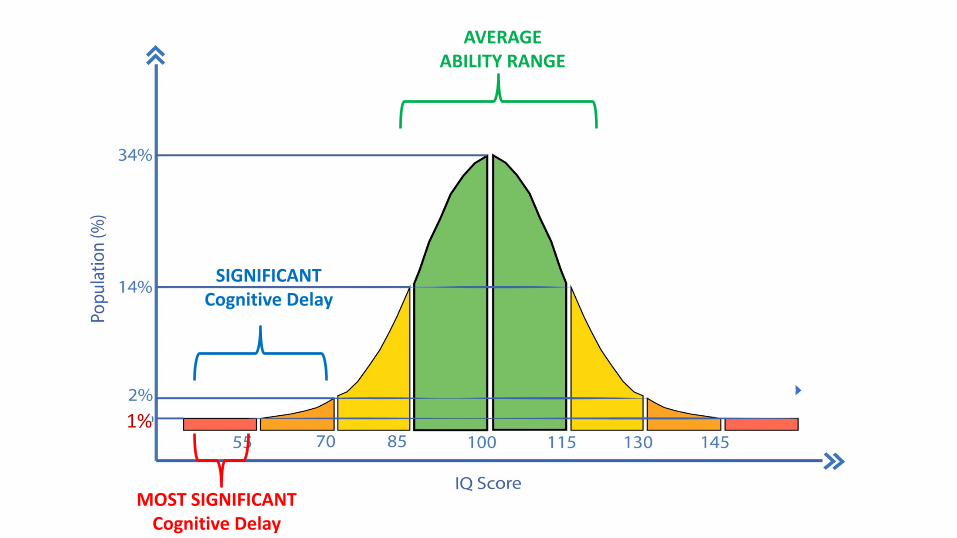
AVERAGE ABILITY RANGE
SIGNIFICANT Cognitive Delay
1%
nnnnnnnnnn nnnnnnnnnn nnnnnnnnnn nnnnnmmm mmmmmm mmnnnnnnn nnnnnnnnnn nnnnnnnnnn nnnnnnnnnn nnnnnnnnnn nnnnnnnnnn
MOST SIGNIFICANT Cognitive Delay
,.. ._ ..... _,_.,.....a!.~ ds"ll• .-•CIW
, .. I--'"°=--- ~~;-: - . 1:;IJ':.":,-Q: lr" ~ ... ~,:--..nC;·td:---..:'
Au ~ -:.~ !Q-n:,..~l(,:,~ al:U-~l/!!llit~ ! • . C:U~
N.m : . :'1. l ::e..,::-,l :il~ :-:e1e~~ :!t-vt: , :i.---!:-:·1 !1 ::e, .. , 1 , ,,: ~:,i:~:-:-1:· ~~:-:rv r i }:::•i .., ei . :..: :~a ~ ~:! « ::~ ~ . t t, 1u ~ lc-J 1,t.-i,~t d 1~ ~ ~ ·-.J "Jd" IC • .f t!.t lf&k, t ~ ci111.!:.1 i,,, e-!'/tJ 1H t!.t 1t.-i,~t IC \ • ,rp"-t IC~~ - i,,, t!.t M:u!..i l 'II- N DH11- r \. ,r;m:d ;, :;. t ; M:u ;·. ~ .&[~ ,";; .f,n :;u - ;.· : ~n· 11·• · 10.1.(r ;; ~ ;;.- ;.· :
':· .!! ~; · ,' , .,( r :,;ir d:!'.:.- • · 1, ,f 1,t fi 'l, ': · t ; /:;- ,..;a1::11~-;.· :
~ ::.=~~ 7,.!=.,~~~~- d ~ C~ MissouriAhem.teksessment Decision M•kingO,ed:fut ::::i 1!.-=:1!~.'!~ !~~d:"~ '!: b,=ei:1"!-,:~k o~wb~!~C: 1~ca-!
=r-c:te€..1..e:r~~ r.- ~ ='=~,.1~ ....!"=!a 2r_:,,I) .. ::::i 1!.-1:1!· • .'!~:l.~d:"~ ~=b,=c r,!-c~leo'~ wb~;~C: 1-rJ ...a-!
=r-c:vc€..1.ie:f4> "*"'r.• ~ ='=~.,.-.....: 1._s n. }I
'"' :J 1!.:,, • .'!=-,:e~~:-.. -::. '*:i.-: iW,,..:-. 1 r,!a~ ~ =~-=!'~ 1......: -r-
"' o.._. b &. .. .e<.- 1t.,:P:ke..t c F'i-w&.1!,ltt, ~ f,., ,\a,j,;:,{,.,..,»t,.
- ~ .... n-n, • .;a-:.:...,~~l _:J 1'h ,:..-i:=-:= ........ . . ... J, ¥= =---=-d=!'.u!ri..,. ... -w6,~ .-.... - "!I .-..!
e : !"~ -=:~=•'~-=1:::S '!-;r-,=Jld,,d'.:r l:".,..---:..l.e ..... , _:J 11'; ,:.-i;-!= .r.:J ~ :. ... , -.-:-,,C.!'':,o= ~;.-e,.;Crd:, -, ,·-!',~-;-.' fl ; *"
: · 11.?ls:O.· ~ d ·=-: .... ! : t~~- ~d = ~!"~ i~o k'c!i
:::J ~ 1:..-i~:11:~ r ~ C rft~. ~ ,-1 1:~ ~ ie.;.«A~!r.:e ~ Ut.:=! '!: -~~d.e."C".co: rl!'l..t.: i:: ~ i,;ip. A.b :0..,:~1.b.!r'!ll'.\o e.lli=-1!::1 :!cae :=i~ tt=..~:=~~dt .a:5.= !:.=~ 111.b
...... , :::J ft.: 1:..-1:-:..:::---r.1 r.•--..-.c •'!:!c:::i :O. S<d,:~rl'f,..J!:~ ~ ='il : ~,. • •
~ ~ . ! . : ~ le:=1.-f, .bl\f
:::J ~ : , :..-1':-:-----r.1 /!.=C e-h~:::<;p""::1,11:: -.~ <:,.T:·w-~.&n ~ ··;-,:,.,,.
••
..abUd 11!!-1~~-~~ "-• -.i•!!i·-~-~ =w ••~-;."(• s-~ :c;::;:~ry~~fr.l't-~ 1..-~ ~
=1 -.iI:11:;d: lw:1
, .. S:· • .!~:~. 1:,: ....-...:_s'.: ""'"'= ,-:.-.::...-¢: •n:u.-.-: rd"e~-:.-~ m 1::U.!!:;!::. S:..,--Ql;;o,;~t ~ ;i-,lk .;
'.-J!--- 1'°-71!ia..:!o-, '!::r.!. d":-1 ;~
~. ~ .~.ii!,,,i,1"·---·~"""•-iaO-• -U!U.et.SNOl'-..=', ~ ... .Jt~,- .;,,..c,...., ...JJ .!10 «------·~· I-'""-------' El!.._, _-~
"'
lt:! 1l.---!,.1t.-, t ~ d~- =! ~b,e(":" ,et.-;oe ;.1 : :ari~ 1""".ffl" : ~ t: 1~ 1(":",.,:-;oe l :i.1t m.'lf 61· 1: .11 m ~~:d'h ~ ,a r. 1i.;x~,
m
, 1 1!!.~Jt l ~ -1 CJ !_• • ;!lf t!!!.Jl('b l!.1111, .. r: llttHHfl!-1
~ d .,.;,•Nn,,CD,.i!.1.,.--& .... lt: 1~.f;.-:t".;'= , L-tJy c d 1d~ai.: 'Y. r.1·~ v.,_~l!!(;.--11r. 1i.c: .:ii:~ ,d m; f ( ct: : •1/r.«il!lmil:! 0 1l: 1.:c-a1:0t!r-="'o!'o. -:.1: ! 0 <"-• tJ>. m
m tb 1l.--i:!.!t".;•. ~ e .1.;","-.,:•. :::~ ':1t"-: -:: 1X = 1:.r.! r!1~i ~. -~: · i l': 1'ci'...1~ n ~ :.r.~ (; .. =-: 1·1! : f-:-..-.f '-:~ t .::•p;,1 w,1',{ a\ 1: ::i
m lt:! 1l.---!:-:te:.:= ~::e.i,.,e~ :·. :::~ t:.'l::a: :i .,,.,~ ~ ~ .£:, ~ : 1-::e ::i: ffflt::! ::,r.::.::! dd/J:.:'::: ffla.-!:C'!C-ep. ~ ~~ lm 11.h :.-:J}, r..f..1:1 1:::1" r ~:-.11 v.1:~ le:. :-t ,-:~ r f 1d r :,;'-::~ r4il-:i
"' 1!.e 1:i.e :•1tce,. r.i U!.'.: .'I!!.,: : ~ :, b: -=:'!r.u.e! ,..ie .. ..fy;,-te'. ~ md°:!1 e,,. h · l!"'..!..e.1!>.1: ~
&a:.::!l!"'..!::e.1;.:tt, m
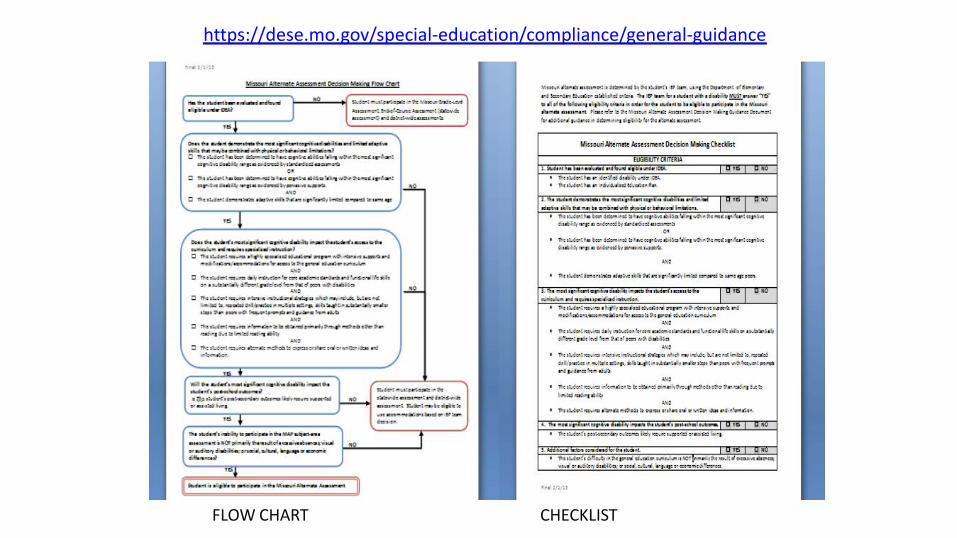
https://dese.mo.gov/special-education/compliance/general-guidance
FLOW CHART CHECKLIST
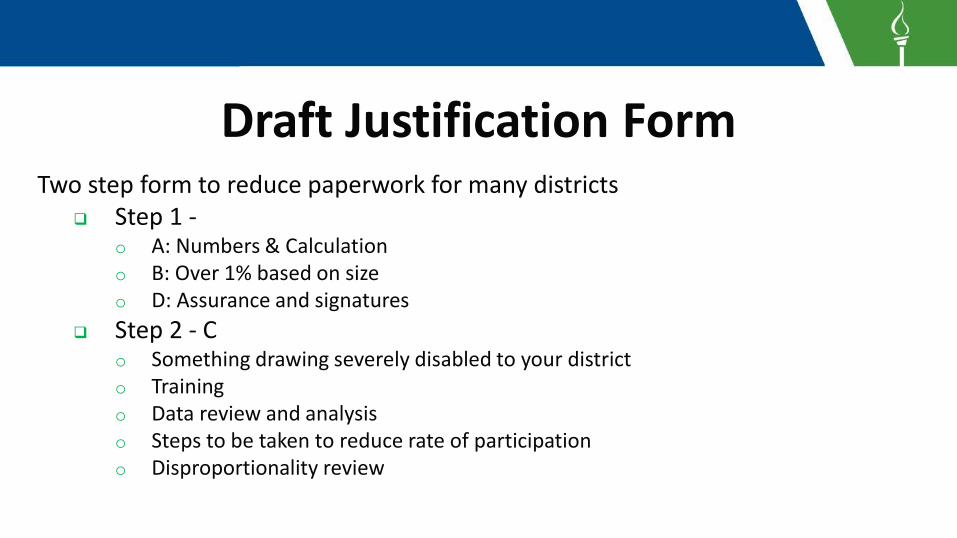
Draft Justification Form Two step form to reduce paperwork for many districts
Step 1 -o A: Numbers & Calculation o B: Over 1% based on size o D: Assurance and signatures
Step 2 - C o Something drawing severely disabled to your district o Training o Data review and analysis o Steps to be taken to reduce rate of participation o Disproportionality review

DESE Actions • Letters to districts based on 2015-16 data – March 2017 • District summary reports included 2016-17 data – July 2018 • Letters to districts based on estimated 2017-18 data – February 2018 • 1% Waiver Request to US Department of Education – February 2018 • On-site meeting with St. Louis County districts – February 7, 2018 • Meeting with regional TA/PD providers – February 2018
• Future meetings with other larger districts over 1% – March 2018

18
Discipline Data
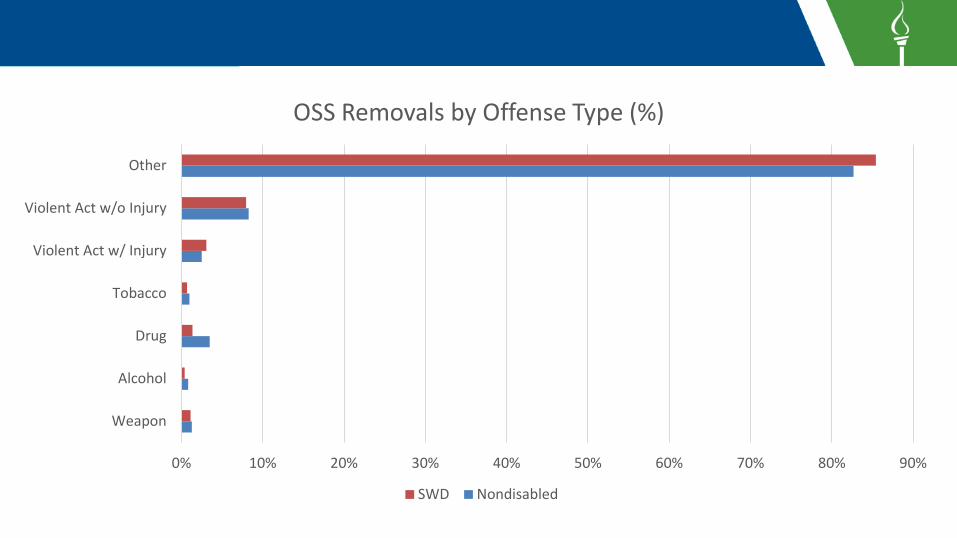
OSS Removals by Offense Type (%)
Other
Violent Act w/o Injury
Violent Act w/ Injury
Tobacco
Drug
Alcohol
Weapon
0% 10% 20% 30% 40% 50% 60% 70% 80% 90%
SWD Nondisabled
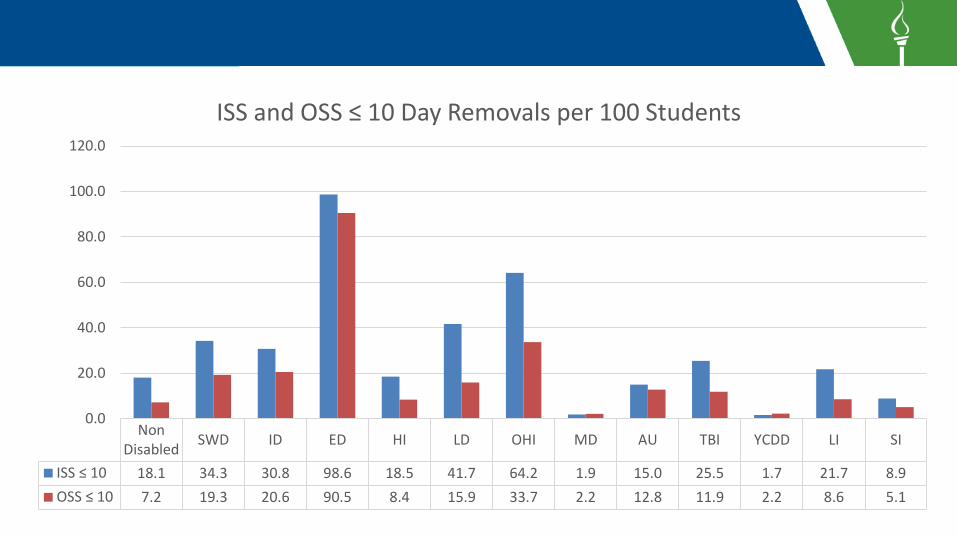
ISS and OSS ≤ 10 Day Removals per 100 Students120.0
100.0
80.0
60.0
40.0
20.0
0.0
ISS ≤ 10 18.1 34.3 30.8 98.6 18.5 41.7 64.2 1.9 15.0 25.5 1.7 21.7 8.9 OSS ≤ 10 7.2 19.3 20.6 90.5 8.4 15.9 33.7 2.2 12.8 11.9 2.2 8.6 5.1
Non SWD ID ED HI LD OHI MD AU TBI YCDD LI SIDisabled

OSS > 10 Day Removals per 100 Students 1.20
1.00
0.80
0.60
0.40
0.20
0.00 Non SWD ID ED HI LD OHI MD AU TBI YCDD LI SIDisabled
OSS > 10 0.19 0.29 0.37 1.06 0.25 0.29 0.56 0.00 0.10 0.00 0.00 0.20 0.06
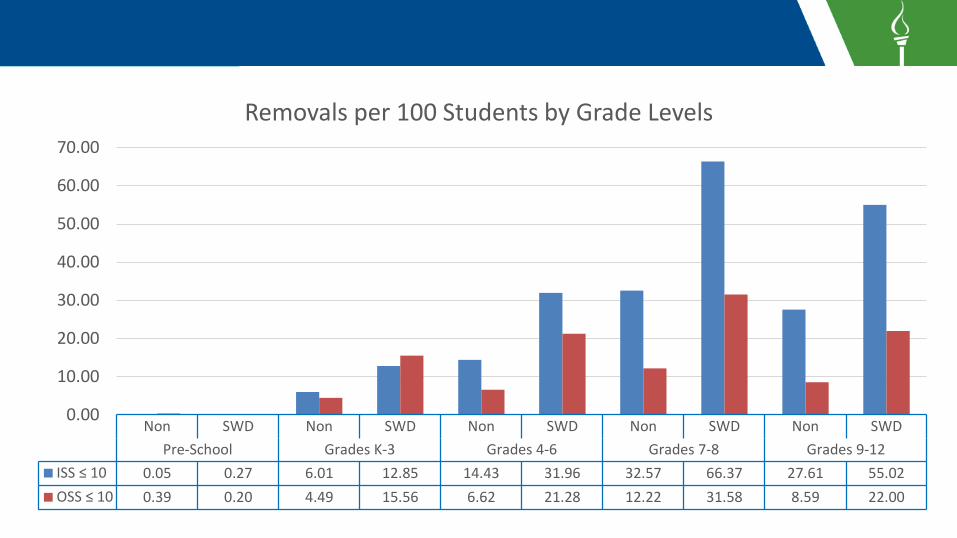
Removals per 100 Students by Grade Levels 70.00
Non SWD Non SWD Non SWD Non SWD Non SWD Pre-School Grades K-3 Grades 4-6 Grades 7-8 Grades 9-12
ISS ≤ 10 0.05 0.27 6.01 12.85 14.43 31.96 32.57 66.37 27.61 55.02 OSS ≤ 10 0.39 0.20 4.49 15.56 6.62 21.28 12.22 31.58 8.59 22.00
0.00
10.00
20.00
30.00
40.00
50.00
60.00