special correspondent -...
TRANSCRIPT

AAnnnneexxuurreess
Geoinformatic Modelling for Certain Georesources and Geohazards of Attur Valley, Tamil Nadu, India.
430
Annexure - IA
News » States » Tamil Nadu
Published: June 22, 2011 02:22 IST | Updated: June 22, 2011
02:22 IST
Mild tremors in three districts
Special Correspondent
Mild tremors were reported in a few pockets of Salem, Krishnagiri and Namakkal districts on Tuesday morning.
The Salem meteorological observatory here recorded the tremors with an intensity of 2.9 in the Richter scale at Vazhapadi, Ethapur and Attur areas in Salem district and at Namagiripettai, Vadugampatti, Pudupatti and Mettala villages in Namakkal district at 5.22 a.m.
The second bout of tremors occurred at Uthangarai and surrounding villages in Krishnagiri district with an intensity of 3.2. at 8.22 in the morning. People who rushed out of their houses claimed that they heard some loud noise and saw a few utensils and other things falling and rolling.
They said they could feel the tremors.Salem Collector K Maharabushanam visited the meteorological office and studied the seismic recordings.
Keywords: tremors, Richter scale
Printable version | Jun 23, 2011 1:46:31 AM | http://www.thehindu.com/news/states/tamil-nadu/article2124145.ece
© The Hindu
http://www.thehindu.com/news/states/tamil-nadu/article2124145.ece?css=print

AAnnnneexxuurreess
Geoinformatic Modelling for Certain Georesources and Geohazards of Attur Valley, Tamil Nadu, India.
431
Annexure - IB Date: 29/01/2011 URL: http://www.thehindu.com/2011/01/29/stories/2011012964120700.htm
Back
Tamil Nadu
Mild tremor in Attur block
Special Correspondent
SALEM: Mild tremor was felt in a cluster of villages and hamlets at the foothills of Kalrayan Hills near Talavasal in Attur block early on Friday. No loss of life or damage to property was reported.
No tremor was recorded at the Meteorological station in Salem.
© Copyright 2000 - 2009 The Hindu

AAnnnneexxuurreess
Geoinformatic Modelling for Certain Georesources and Geohazards of Attur Valley, Tamil Nadu, India.
432
Annexure - IC
Date:09/06/2008 URL: http://www.thehindu.com/2008/06/09/stories/2008060953960500.htm
Back
TamilNadu - Vellore Mild tremor in Vellore, Tiruvannamalai
Special Correspondent
VELLORE: A mild tremor sparked panic in Vellore and Tiruvannamalai districts on Saturday night.
The Regional Meteorological Centre in Chennai said the quake, measuring 3.8 on the Richter scale, was felt at Vellore, Ambur, Gudiyatham and Walajapet at 11.45 p.m.
Officials said the epicentre was 12.8 degree North (latitude) and 78.8 degree East (longitude).
Residents of Kosapet in Vellore said they heard a sound similar to that of people walking on the roof of a tiled house.
In Tiruvannamalai district, residents of Polur, Sandhavasal and surrounding areas felt the tremor around the same time.
© Copyright 2000 - 2009 The Hindu

AAnnnneexxuurreess
Geoinformatic Modelling for Certain Georesources and Geohazards of Attur Valley, Tamil Nadu, India.
433
Annexure - ID
Online edition of India's National Newspaper Wednesday, September 26, 2001
Front Page | National | Southern States | Other
States | International | Opinion | Business | Sport | Miscellaneous | Classifieds | Employment | Inde
x | Home

AAnnnneexxuurreess
Geoinformatic Modelling for Certain Georesources and Geohazards of Attur Valley, Tamil Nadu, India.
434
Front Page | Previous | Next
Parts of T.N., Pondy, Karnataka, A.P. rocked
By Our Tamil Nadu Bureau
CHENNAI, SEPT. 25. A `moderate' earthquake, measuring 5.6 on the Richter scale, shook parts of Tamil Nadu, Karnataka, Andhra Pradesh and Pondicherry around 8.30 tonight. Its epicentre lay 50 km east of Pondicherry, in the Bay of Bengal.
As the ground shook under their feet for a few seconds, people rushed out of homes and commercial establishments. A wave of panic swept Chennai and telephone lines were jammed. However, no serious damage to property or casualties were reported.
According to the Deputy Director-General of Meteorology, Chennai, Mr. A.K. Bhatnagar, the tremors were felt in two spells of about five seconds each. The epicentre was located at the latitude of 11.8 north and the longitude of 80.4 east.
After shocks ruled out
He said that despite the intensity, Tamil Nadu remained in the `safer zone' as the epicentre lay in the sea. On the possibility of `aftershocks', he said tremors of this magnitude did not normally give room for them.
Mr. Bhatnagar said the last tremor in the southern peninsula was experienced on December 12 last year, with Idukki in Kerala as its epicentre.
Sources in Pondicherry said the impact of the tremor was felt all over, but no serious damage was reported. It was `unusual' for this port town to feel a quake. It was only in 1966 that it experienced one. Cuddalore and Kancheepuram also reported shocks.
Prof. Periyakali of Madras University, researching applied geology, felt that the tremor could have been due to a shear zone running across Chennai-Kolar-Bangalore.
Because the Deccan is a comparatively `more stable' plate, serious damage was unlikely due to the present tremors.
There could have been a direct link between the intensity of

AAnnnneexxuurreess
Geoinformatic Modelling for Certain Georesources and Geohazards of Attur Valley, Tamil Nadu, India.
435
Section : Front Page Previous : Taliban vows to attack any aggressor Next : Ban on Indian TV channels
Front Page | National | Southern States | Other
States | International | Opinion | Business | Sport | Miscellaneous | Classifieds | Em
ployment | Index | Home
Annexure – IE
Volume 18 - Issue 21, Oct. 13 - 26, 2001
India's National Magazine
from the publishers of THE HINDU
Table of
Contents
THE STATES
Shaken South
The movement of the Indian plate was the basic cause of the earthquake that struck some parts of Tamil Nadu, Andhra Pradesh and Karnataka on September 25.
T.S. SUBRAMANIAN
ON September 25 an earthquake struck Chennai and other parts of Tamil Nadu, including the composite districts of Thanjavur, North Arcot, South Arcot and Chengalpattu, the Union Territory of Pondicherry, Nellore and Chittoor districts in Andhra Pradesh, and parts of Karnataka including its capital Bangalore. There was no major damage anywhere.
According to A.K. Bhatnagar, Deputy Director-General, Meteorology, Regional Meteorological Centre, India Meteorology Department, based in Chennai, the earthquake, which measured 5.6 on the Richter scale, occurred at 8-27 p.m. It had its epicentre in the Bay of Bengal, 50 km east of Pondicherry, located at a latitude of 11.8° N and a longitude of 80.4° E.
D.C. Mishra, Director, National Institute of Geophysical Research, Hyderabad, said the earthquake was of moderate intensity. He said it occurred at the point of contact between

AAnnnneexxuurreess
Geoinformatic Modelling for Certain Georesources and Geohazards of Attur Valley, Tamil Nadu, India.
436
the deep sea and the continental shelf in the Bay of Bengal. Such zones are vulnerable to earthquakes because they are usually faulted. Faults are weaknesses in the earth's crust.
Mishra said the earthquake did not whip up tidal waves because its focus was deep in the sea and its magnitude was too low for tidal waves to occur.
Dr. L.S. Suryanarayanan, Director-in-charge, Geological Survey of India (GSI), Tamil Nadu, Kerala and Pondicherry, said the
focus of the earthquake was 12 km below the sea surface.
The basic cause of the earthquake was the Indian plate's movement. The Himalayas form the northern margin of this plate. According to Suryanarayanan, the reason for the movement is the heat generation inside the earth. This heat difference led to the movement of the plate several million years ago. When movements take place not only at intra-plate but inter-plate junctions, collisions occur and this leads to earthquakes.
Suryanarayanan said there were alternating hill and valley formations deep below the Cauvery delta area, which formed the basement. These were created by tectonic disturbances millions of years ago. There were structural weaknesses in the planes of these hills and valleys. "On account of these weak planes, differential movements do take place in the basement at the time of the plate's movement," he said.
Cracks had developed in the Indian plate about 80 million years ago. The entire Indian plate, along with the cracks, started moving north about 50 million years ago. The Himalayas were thrown up by this movement. About 25 to 30 million years ago, the Indian plate started hitting against the mass of the Eurasian plate, which is situated in the north.
Suryanarayanan said, "In this process of jerks which it (the Indian plate) is undergoing, earthquakes occur in weak planes, along faults and at places where major stresses are developing. The release of the strain leads to earthquakes, and further displacement follows."
There have been tremendous advances in the understanding of the earth and its processes in the last 50 years. Geologists had tried to understand the structure of the earth by studying earthquakes, Suryanarayanan said.
The GSI, Chennai, has sent two teams to make macroseismic

AAnnnneexxuurreess
Geoinformatic Modelling for Certain Georesources and Geohazards of Attur Valley, Tamil Nadu, India.
437
surveys to study the effect of the September 25 earthquake on people, the ground, and structures such as buildings and bridges in Chennai, Pondicherry, Cuddalore, Chidambaram, Vellore, Tiruchi, Dharmapuri and other places.
Suryanarayanan said the "felt-effect" of the Bhuj earthquake was high in Pondicherry, Bhuvanagiri, Cuddalore, Chidambaram and other places. (Tremors were felt in Chennai also on that day.) The felt-effect of that earthquake was high in Pondicherry because it was absorbed, not passed on, he said.
The absorption was because of the loose packing of sediments.
Asked how an earthquake had jolted Tamil Nadu, hitherto considered to be a seismically safe zone, Suryanarayanan explained that the rim of the Indian plate, which had borne the brunt of collisions and a high number of earthquakes, had totally broken. The plate proper, which was away from the margin, was considered to be less prone to earthquakes.
Now peninsular India might have to be categorised as Zone III instead of Zone II. The GSI's seismic zonation map made in the 1960s has undergone several revisions. A draft revision is being done now.
Following "predictions" that there could be after-shocks, rumours filled the air about the imminence of another earthquake. But Bhatnagar asserted that there was no scientific method anywhere in the world to predict earthquakes in respect of location, time and magnitude. In the case of moderate earthquakes, only aftershocks of mild intensity could occur and these might not cause any major damage, he said. He clarified that no forecast had been issued in this regard by the IMD. "Predictions circulated by any individual are not to be trusted," Bhatnagar said.
Officials of the Nuclear Power Corporation of India Limited (NPC) said the two reactors of the Madras Atomic Power Station (MAPS) at Kalpakkam, about 55 km from Chennai, continued to operate safely at their rated capacity (170 MWe each). "There was no disturbance to the nuclear and conventional systems, and power flow to the southern grid is being maintained as usual," said K. Hariharan, Station Director, MAPS. He

AAnnnneexxuurreess
Geoinformatic Modelling for Certain Georesources and Geohazards of Attur Valley, Tamil Nadu, India.
438
added: "The Indian nuclear reactors have adequate safety design features built in to take care of seismic effects." He pointed out that the nuclear power stations at Kakrapar (Gujarat) and Tarapur (Maharashtra) were not affected in any way by the January 2001 earthquake.
Annexure – IF
Date:02/07/2010 URL: http://www.thehindu.com/2010/07/02/stories/2010070255500400.htm
Back
Tamil Nadu - Chennai Evidence of huge deposits of platinum in State
Special Correspondent
The two prospects are in Namakkal and Coimbatore — Photo: DIPR
SITE MAPPING: Chief Minister M. Karunanidhi being briefed on the mineral resources in the State by GSI scientist N.P.Nathan, at the Secretariat in Chennai on Thursday.
CHENNAI: The Geological Survey of India (GSI) has found two significant platinum prospects in Tamil Nadu, according to Santha Sheela Nair, Secretary of the Union

AAnnnneexxuurreess
Geoinformatic Modelling for Certain Georesources and Geohazards of Attur Valley, Tamil Nadu, India.
439
Ministry of Mines.
The two prospects are in Sittampundi of Namakkal district (covering Karungalpatti, Chettiyampalaiyam and Tasamapalaiym blocks) and Mettupalayam of Coimbatore (Solavanur, Mallanayakkampalaiyam and Karappadi blocks).
Describing them as “good discoveries,” Ms Nair told reporters on Thursday that “we are at the scientific stage where there is an evidence of substantial deposits of platinum which needs to be explored further to understand the exact location and quantities.”
The GSI was engaged in the exploratory work for the last three years. As of now, exploration was carried out up to 30 metres. If explored further, – say 200 to 300 metres , scientists of the GSI were of the view that "the potential will be even greater, both in quantity and quality,” the Mines Secretary said. Earlier, in the presence of
Chief Minister M. Karunanidhi, Ms. Nair and senior officials of the State government at the Secretariat, GSI Director-General N.K. Datta and Tamil Nadu Minerals (TAMIN) Chairman and Managing Director K. Manivasan signed a memorandum of understanding.
Ms. Nair said the MoU was signed to facilitate further exploration of mineral development of the State. By associating with the GSI, the TAMIN would be able to diversify its activities. At present, the organisation was focussing on granites.
Pointing out that there were greater possibilities for collaboration with the State agency, N.P. Nathan, senior scientist in the GSI, said other minerals such as limestone, magnesite and iron ore could be covered. The Union Secretary reiterated that many more levels had to be crossed before reaching the stage of mining. Under the existing constitutional framework, mineral wealth belonged to States, which would receive royalties.
Durai Murugan, Law Minister, and K. Shanmugam and Rajeev Ranjan, Principal Secretaries for Finance and Industries, were present when the MOU was signed.
© Copyright 2000 - 2009 The Hindu

AAnnnneexxuurreess
Geoinformatic Modelling for Certain Georesources and Geohazards of Attur Valley, Tamil Nadu, India.
440
Annexure – IG Date:01/06/2009 URL: http://www.thehindu.com/2009/06/01/stories/2009060151680300.htm
Back Tamil Nadu – Salem Heavy rain lashes Salem and suburbs Special Correspondent
Large boulder rolls down from Karia Perumal Karadu Hills
Photo: P. Goutham
Nature’s fury: The boulder that rolled down from Karia Perumal Karadu Hills in
Salem on Sunday. –
SALEM: Heavy rains accompanied by thunder and strong winds lashed the city and its suburbs for the second consecutive day on Saturday.
All low-lying areas came under a sheet of knee-deep rain water that mixed with waste water from the sewers posing serious health hazards to residents.

AAnnnneexxuurreess
Geoinformatic Modelling for Certain Georesources and Geohazards of Attur Valley, Tamil Nadu, India.
441
Many people had a miraculous escape when a big boulder rolled down the Karia Perumal Karadu Hills to the residential colony at its foothills on Sunday.
The heavy boulder came crashing down and fell on the tiled house of Natarajan whose family was away at that time. Two houses were damaged in the incident.
Yercaud registered the highest rainfall of 80 m.m. for the past 24 hours ending at 8 a.m. on Sunday. Mettur registered the second best of 72 m.m. of rain followed by Salem (69.8 m.m.), Edapadi (69 m.m.), Omalur (28.6 m.m.), Sankagiri (28.2 m.m.), Gengavalli (21.2 m.m.), Vazhapadi (20 m.m.) and Attur (4.80 m.m.).
In Namakkal district Tiruchengode registered a maximum rainfall of 67 m.m. followed by Rasipuram with 65 m.m
Annexure - IH
9(L)/TN/S/O
NEW INDIAN EXPRESS/CHENNAI/26/10/2007
Landslide in Yercaud
Heavy downpour washed away a 10- metre stretch near the third hairpin bend on
the arterial Salem-Yercaud ghat road. Stone walls raised to 20 ft and sand bags along
with a large portion of the road were washed
Salem
Rain and thunder showers triggered a landslide and washed away a portion of the
arterial SalemYercaud ghat road near here on Thursday.
Heavy downpour in Salem district, particularly in the hill town of Yercaud, washed
away a 10-metre stretch near the third hairpin bend on the arterial Salem-Yercaud
ghat road. As a result, movement of traffic was badly affected for several hours.
The same stretch was affected by rains last month.
However, as the landslide had taken place during the Chief Minister's visit here,
officials had repaired the stretch on a warfooting then.

AAnnnneexxuurreess
Geoinformatic Modelling for Certain Georesources and Geohazards of Attur Valley, Tamil Nadu, India.
442
Stone walls were raised to 20 ft and sand bags were placed to protect further damage
to the road side.
But, the stone wall and sand bags along with a large portion of the road were washed
away on Thursday due to continuous rain for two days.
The road has not been closed to traffic as yet.
Officials of the highway department and the Yercaud union have inspected the
damaged stretch and employed staff to repair the key ghat road linking Yercaud
with Salem city.

Annexure..
Geoinformatic Modelling for Certain Georesources and Geohazards of
Attur Valley, Tamil Nadu, India.
443
Water Quality – Pre Monsoon - 2007 Annexure –IIA
Id X Y Location Ca Mg Na K HCO3 CO3 SO4 Cl NO3 F TDS_ Hard Cond pH_
1 78.01 11.60 Elampillai 48 291.60 230 47 957.70 0.00 58 709 10 0.65 1907 1320 3610 7.8
2 78.04 11.53 Attaiyampatti 20 36.45 143 20 481.90 0.00 72 23 10 0.53 599 200 1060 7.8
3 78.62 12.25 Singarapettai 96 54.68 97 1 292.80 0.00 72 234 4 1.2 719 465 1240 7.3
4 78.76 11.58 Thalaivasal 30 71.69 110 1 201.30 0.00 62 223 18 0.93 678 370 1230 7.6
5 78.79 11.56 Aragalur 16 82.62 179 37 305.00 0.00 106 291 11 0.87 913 380 1610 7.9
6 78.74 11.47 Veeraganur 32 75.33 230 63 561.20 0.00 72 269 13 0.95 1079 390 1920 8.0
7 78.63 11.56 Manjani 54 149.45 143 3 152.50 0.00 202 425 35 0.82 1209 750 2110 7.6
8 78.65 11.50 Gangavalli 16 20.66 17 2 133.36 1.58 6 18 1 0.84 167 125 310 8.1
9 78.51 11.65 Peddanaikanpalayam 112 126.36 437 1 225.70 0.00 288 851 22 0.85 2025 800 3530 7.6
10 78.33 11.82 Kombur 56 55.89 53 13 305.00 0.00 96 121 1 1.6 552 370 990 7.8
11 78.33 11.97 Menasi 52 41.31 76 18 353.80 0.00 48 85 10 1 541 300 920 8.0
12 78.39 11.91 Pappireddipatti 56 75.33 120 18 274.50 0.00 56 277 8 0.9 805 450 1430 7.7
13 78.32 12.20 Kambainallur 64 111.78 219 13 231.80 0.00 78 518 28 1.4 1245 620 2180 7.6
14 78.74 12.20 Krishnapuram 152 204.12 138 15 195.20 0.00 86 752 55 0.53 1688 1220 3030 7.8
15 78.58 12.20 Pavakkal 64 68.04 442 4 518.50 0.00 278 425 22 0.7 1638 440 2400 7.5
16 78.44 12.25 Kallavi 112 89.91 258 2 506.30 0.00 134 418 22 0.83 1364 650 2280 7.4
17 78.92 11.89 Sankarapuram 64 78.00 242 3 537.00 0.00 113 269 17 0.2 1113 480 1750 7.7
18 79.10 11.81 Rishivandhiyam 132 54.00 161 6 275.00 0.00 125 333 24 0.2 1055 550 1760 7.4
19 78.91 11.66 Kanianur 50 21.00 230 3 329.00 0.00 146 181 8 0.19 831 210 1270 7.5
20 79.02 11.74 Madur 24 43.00 173 4 366.00 0.00 84 135 11 0.04 695 235 1080 7.5
21 78.94 11.83 Murar_Palayam 68 78.00 265 4 811.00 0.00 134 135 22 0.08 1187 490 1730 7.9

Annexure..
Geoinformatic Modelling for Certain Georesources and Geohazards of
Attur Valley, Tamil Nadu, India.
444
22 79.09 11.82 Rishivandiyam 148 34.00 150 8 348.00 0.00 86 298 16 0.01 969 510 1620 7.4
23 78.13 11.60 Nalikkalpatty 40 85.05 173 36 341.60 0.00 86 319 1 0.98 914 450 1630 7.8
24 78.29 11.59 Kamalapatty 30 20.66 48 13 208.40 1.56 25 46 2 0.87 320 160 550 7.9
25 78.49 11.54 Kirippatti 40 46.17 35 2 228.61 1.36 17 60 11 0.73 389 290 730 7.8
26 78.53 11.45 Sendarappatti 56 116.64 288 227 518.50 0.00 195 496 77 0.74 1910 620 3000 7.8
27 78.50 11.57 Malliakarai 32 150.66 129 4 616.10 0.00 20 312 6 0.84 983 700 1890 8.0
28 78.84 11.98 Bommidi 26 29.16 53 6 163.01 1.93 23 46 8 0.89 319 185 530 8.1
29 78.29 12.09 Kadathur 152 72.90 258 20 561.20 0.00 197 425 7 1.4 1437 680 2510 7.6
30 78.11 12.23 Pulikarai 68 77.76 81 39 323.30 0.00 50 227 26 0.32 820 490 1450 7.7
31 78.27 12.05 Sunkarahalli 112 174.96 117 14 591.70 0.00 161 404 16 1.2 1350 1000 2540 7.8
32 79.08 12.01 Kallippadi 56 83.00 529 38 671.00 0.00 233 596 13 0.11 1928 480 2840 8.0
33 78.95 11.89 Thimmanendal 96 102.00 184 6 403.00 0.00 149 383 8 0.02 1157 660 1930 8.0
34 79.00 11.92 Ariyalur 100 88.00 184 5 433.00 0.00 144 284 39 0.02 1194 610 1900 8.0
35 79.08 11.89 S.kolathur 60 92.00 161 45 561.00 0.00 106 220 18 0.02 1044 530 1650 8.1
36 78.14 11.87 Danishpet 20 52.25 69 6 332.48 2.48 19 46 1 0.93 421 265 760 7.9
37 78.09 11.88 Theevattipatti 56 184.68 621 16 1220.00 0.00 48 851 1 0.78 2391 900 4450 7.9
38 78.09 11.72 Karuppur 32 106.92 140 20 756.40 0.00 17 92 23 0.84 888 520 1630 8.2
39 78.04 11.71 Muthunaickanpatti 60 97.20 276 39 323.30 0.00 528 277 4 0.67 1456 550 2400 7.6
40 78.05 11.75 Omalur 30 34.02 196 22 396.50 0.00 58 128 22 0.63 764 215 1280 7.8
41 77.96 11.74 Tholasampati 40 150.66 483 12 817.40 0.00 144 496 57 0.92 1987 720 3320 7.9
42 77.98 11.69 Tharamangalam 8 38.88 437 9 799.10 0.00 77 255 14 0.73 1287 180 2230 8.2
43 78.00 11.85 Marakottai 26 49.82 145 6 359.90 18.00 27 138 13 1.1 648 270 1160 8.6
44 78.10 11.74 Thekkampatti 4 52.25 28 2 245.30 4.60 10 11 4 0.54 277 225 520 8.3
45 78.04 11.89 Gundaakkal 56 123.93 161 14 286.70 0.00 288 298 17 0.78 1160 650 1980 7.8
46 77.96 11.77 Manathal 20 57.11 225 16 750.30 0.00 48 64 12 0.89 858 285 1420 7.9

Annexure..
Geoinformatic Modelling for Certain Georesources and Geohazards of
Attur Valley, Tamil Nadu, India.
445
47 79.09 11.50 Kaludhur 60 68.00 322 92 519.00 18.00 204 376 11 0.51 1448 430 2200 8.3
48 79.01 11.44 Eluthur 84 52.00 108 5 317.00 0.00 80 156 29 0.2 772 425 1250 7.6
49 78.51 11.26 Uppliyapuram 60 85.05 154 1 359.90 0.00 118 248 22 0.66 868 500 1670 8.2
50 78.65 11.20 Sengattuppatti 56 75.33 55 1 414.80 0.00 73 96 9 0.43 573 450 1140 8.2
51 78.50 11.39 Thalugai 52 174.96 186 5 445.30 30.00 144 355 70 0.69 1240 850 2520 8.3
52 78.48 11.33 Nagayanallur 80 75.33 166 2 353.80 24.00 187 248 4 0.97 947 510 1750 8.3
53 77.99 11.77 Olaipatti 92 177.39 345 59 1067.50 0.00 144 489 18 0.92 1921 960 2950 7.6
54 77.89 11.76 Nangavalli 92 99.63 230 156 610.00 0.00 264 355 17 0.69 1577 640 2650 7.6
55 77.86 11.81 Kunjandiyur 38 52.25 62 7 263.00 1.96 13 71 17 0.54 497 310 900 7.9
56 77.89 11.69 Jalakandapuram 204 99.63 237 34 347.70 0.00 48 752 24 0.82 1655 920 2840 7.6
57 77.79 11.81 Mulakadu 56 75.33 67 12 390.40 0.00 40 92 33 0.65 683 450 1210 7.6
58 77.97 11.84 Amaram 24 131.22 207 14 280.60 0.00 82 362 74 0.64 1288 600 2170 7.9
59 79.26 11.58 M.parur 80 49.00 391 28 580.00 0.00 242 355 18 0.06 1515 400 2020 8.2
60 79.22 11.63 Mavadandal 56 58.00 368 379 677.00 24.00 226 510 33 0.88 2106 380 3170 8.4
61 79.26 11.58 M.Parur 108 49.00 143 13 439.00 0.00 84 213 16 0.1 900 470 1410 8.0
62 78.62 11.09 Nallavannipatti 44 58.32 55 2 164.94 4.90 23 145 22 0.33 452 350 940 8.5
63 78.37 11.18 Sangampatti 44 31.59 242 18 390.40 18.00 101 160 39 0.1 849 240 1580 8.5
64 78.40 11.16 Mahadevi 16 54.68 170 0 353.80 48.00 69 106 16 1.52 657 265 1270 8.4
65 78.46 11.21 Pachchiperumalpatti 30 48.60 242 4 311.10 18.00 84 241 21 0.68 845 275 1560 8.3
66 79.18 11.60 Erangi 14 54.00 191 5 445.00 0.00 58 103 29 0.24 776 255 1130 8.1
67 79.08 11.67 Vadapoondi 32 30.00 104 5 317.00 6.00 46 67 6 0.19 475 205 780 8.3
68 79.03 11.70 Kurur 48 102.00 391 15 628.00 12.00 187 411 25 1.02 1591 540 2400 8.3
69 78.94 11.51 Vallimarudham 30 47.00 150 53 397.00 24.00 53 110 21 0.04 759 270 1180 8.4
70 79.08 11.54 Vilambavur 28 56.00 288 5 628.00 18.00 134 113 21 1.19 1049 300 1520 8.3
71 78.45 11.98 Chettipatti 50 53.46 67 7 140.30 0.00 54 206 11 0.32 557 345 870 8.1

Annexure..
Geoinformatic Modelling for Certain Georesources and Geohazards of
Attur Valley, Tamil Nadu, India.
446
72 78.80 11.20 Velur 20 12.15 101 2 274.53 10.27 17 18 1 0.37 345 100 650 8.6
73 79.01 11.39 Tirumandurai 20 18.23 198 1 378.20 78.00 36 32 15 1.21 587 125 1130 8.7
74 79.08 11.35 Kilumattur 80 155.52 895 4 305.00 0.00 499 1446 4 0.87 3236 840 5570 8.2
75 78.98 11.36 Eraiyoor 40 109.35 283 27 414.80 0.00 240 425 6 0.62 1338 550 2400 8.1
76 78.80 11.26 Tiruppayyarnattam 26 55.89 87 28 366.00 0.00 58 113 2 0.38 553 295 1040 8.1
77 78.88 11.27 Elambalur 34 17.01 327 20 457.50 0.00 86 199 42 0.29 954 155 1780 7.7
78 78.98 11.25 Chittali 40 30.38 99 14 346.69 8.19 16 67 2 0.96 484 225 920 8.4
79 78.79 11.18 Velur 40 48.60 150 2 323.30 12.00 106 170 4 0.52 695 300 1250 8.3
80 78.89 11.18 Ayilur 38 49.82 274 29 414.80 0.00 130 262 25 0.42 1016 300 1860 8.1
81 79.06 11.18 Kilmattur 34 27.95 41 4 216.69 8.11 26 35 2 0.36 307 200 590 8.6
82 78.92 11.58 Nainarpalayam 56 36.00 426 9 427.00 0.00 187 376 43 0.23 1494 290 2200 7.6
83 79.02 11.65 Sitheri 66 64.00 127 6 360.00 0.00 91 177 22 0.52 808 430 1280 8.0
84 78.49 12.12 K.Vetrapatti 32 35.24 58 9 118.53 1.40 55 110 8 1.2 407 225 710 8.1
85 78.22 12.13 Solaikottai 28 111.78 281 11 585.60 0.00 192 340 10 0.9 1301 530 2280 7.9
86 78.68 11.98 Kottapatti 80 60.75 76 35 628.30 0.00 5 96 9 0.43 707 450 1140 7.9
87 78.42 12.07 Beddur 112 70.47 110 29 585.60 0.00 26 241 2 0.98 891 570 1660 7.4
88 78.72 11.42 Poolambadi 60 24.30 71 2 251.18 3.74 30 71 8 0.29 421 250 810 8.2
89 78.92 11.34 Mettupalayam 100 137.30 46 5 359.90 0.00 168 220 42 0.85 898 815 1840 8.0
90 78.83 11.30 Esanai 26 51.03 320 25 463.60 0.00 134 291 31 0.2 1110 275 1980 8.1
91 78.75 11.23 Ladapuram 108 116.64 274 24 481.90 0.00 235 390 59 1.25 1447 750 2710 7.9
92 78.89 11.43 Pasumbalur 22 23.09 228 1 530.70 0.00 58 106 2 1.1 706 150 1290 8.0
93 78.78 11.34 Vengalam 36 51.03 221 1 475.80 6.00 95 177 10 0.56 835 300 1560 8.3
94 78.73 11.16 Nakkaselam 52 41.31 248 17 396.50 0.00 115 206 39 0.38 917 300 1720 7.9
95 78.76 11.10 Pirahambi 34 38.88 288 39 427.00 0.00 62 284 34 0.39 993 245 1840 8.2
96 78.79 11.08 Maniyankurichchi 10 78.98 253 3 335.50 0.00 113 301 35 0.63 962 350 1810 8.0

Annexure..
Geoinformatic Modelling for Certain Georesources and Geohazards of
Attur Valley, Tamil Nadu, India.
447
97 78.26 11.41 Kalkurichi 68 233.28 83 25 591.70 0.00 221 390 20 0.77 1414 1130 2670 7.6
98 78.22 11.35 Solaiyudaiyampatti 36 116.64 55 15 591.70 0.00 53 135 11 0.64 760 570 1520 7.7
99 78.23 11.24 Muthugapatti 56 165.24 0 322 512.40 0.00 581 215 71 0.92 2203 820 3560 7.8
100 78.19 11.46 Rasipuram 84 160.38 191 10 280.60 0.00 173 383 98 0.65 1582 870 2600 7.9
101 78.22 11.42 Singalandapuram 176 376.65 598 125 201.30 0.00 360 1730 133 0.96 4070 1990 6780 7.4
102 78.23 11.24 Muthagapatti 28 136.08 350 7 549.00 0.00 235 454 17 0.67 1565 630 2750 7.9
103 78.29 11.15 Erumaipatti 60 109.35 184 43 384.30 0.00 86 319 58 0.37 1254 600 2080 7.8
104 78.19 11.48 Pudupalayam 464 243.00 350 17 91.50 0.00 538 1347 105 0.45 3479 2160 5760 7.6
105 78.15 11.14 Aniapuram 26 53.46 99 8 439.20 0.00 15 71 11 0.48 542 285 950 7.9
106 78.24 11.30 Pattathayankuttai 28 85.05 345 16 732.00 0.00 125 312 7 0.82 1311 420 2380 8.0
107 78.05 12.14 B.S._Agraharam 60 98.42 189 47 305.00 0.00 288 340 3 0.53 1188 555 1910 7.8
108 78.16 11.30 Thalambadi 52 148.23 221 27 256.20 0.00 240 418 56 0.84 1488 740 2460 7.6
109 78.10 11.24 Ernapuram 88 189.54 244 43 176.90 0.00 182 581 119 0.52 1951 1000 3160 7.4
110 78.08 11.09 Palapatty 28 55.89 414 215 1067.50 0.00 28 390 7 0.65 1698 300 2920 7.9
111 78.01 11.11 Velur 28 106.92 221 113 335.50 0.00 202 347 56 0.53 1438 510 2240 8.0
112 78.95 11.14 Kabilarmalai 200 72.90 294 24 244.00 0.00 110 702 48 0.51 1741 800 2870 7.6
113 77.89 11.11 Ayyampalayam 20 55.89 85 11 256.20 0.00 58 135 7 0.34 526 280 940 7.8
114 78.15 11.24 Nallipalayam 68 89.91 115 28 463.60 0.00 31 191 41 0.43 940 540 1580 7.8
115 77.98 11.25 Ramadevam 36 92.34 294 14 292.80 0.00 230 362 39 0.46 1351 470 2210 7.6
116 78.05 11.11 Kilmugam 12 4.86 97 11 74.53 0.44 48 96 2 0.37 324 50 530 7.8
117 77.95 11.95 Perumbalai 52 106.92 225 7 457.50 0.00 134 248 47 0.8 1210 570 1940 7.8
118 78.86 11.48 Kaikalathur 38 25.52 85 23 256.90 3.04 22 71 12 0.56 434 200 830 8.1
119 77.75 11.56 Kalvadangam 28 42.53 173 34 475.80 0.00 38 113 5 1.12 689 245 1230 7.6
120 77.84 11.48 Chinnagoundanur 26 32.81 104 196 414.80 0.00 106 131 11 0.5 852 200 1340 7.9
121 77.85 11.66 Iruppali 32 24.30 37 30 208.40 1.56 22 35 6 0.6 335 180 520 7.9

Annexure..
Geoinformatic Modelling for Certain Georesources and Geohazards of
Attur Valley, Tamil Nadu, India.
448
122 77.99 11.54 Kunnipalayam 56 131.22 483 98 616.10 0.00 182 737 36 0.89 2154 680 3710 7.8
123 77.92 11.57 Konganapuram 76 145.80 0 87 250.10 0.00 369 29 28 0.88 1129 790 2000 7.6
124 77.84 11.59 Idappadi 60 243.00 1932 196 1250.50 0.00 480 2694 84 0.56 6603 1150 11000 7.6
125 77.91 11.62 Koranampatti 42 36.45 127 6 195.20 0.00 58 184 17 0.82 626 255 1070 7.9
126 77.87 11.50 Vadugapatti 56 136.08 449 196 915.00 0.00 62 596 73 1 2276 700 3810 7.6
127 78.41 11.69 Attanurpatty 48 102.06 133 32 292.80 0.00 86 284 36 1 991 540 1700 7.6
128 78.41 11.73 Kurichy 22 42.53 115 18 427.00 0.00 120 6 6 0.58 554 230 100 7.8
129 78.12 11.68 Suramangalam 0 52.02 161 10 372.10 0.00 120 33 28 0.7 700 215 1140 7.4
130 78.30 11.66 Karipatti 84 123.93 28 33 414.80 0.00 288 89 14 0.68 916 720 1590 7.6
131 78.36 11.22 Nirmullikuttai 90 12.15 175 29 427.00 0.00 197 64 15 0.76 847 275 1390 7.6
132 78.42 11.59 Chinnakrishnapuram 124 160.38 163 20 475.80 0.00 96 581 11 0.92 1432 970 2690 7.9
133 78.48 11.66 Ettapur 38 47.39 58 2 207.48 2.46 17 124 6 1.01 441 290 820 8.1
134 78.40 11.70 Kattur 30 66.83 60 25 372.10 0.00 110 21 17 0.75 574 350 980 7.7
135 78.07 11.93 Thoppur 28 140.94 113 13 347.70 0.00 120 262 39 1.3 1024 650 1780 7.9
136 78.28 11.49 Pudupatti 32 157.95 179 10 219.60 0.00 226 458 18 0.82 1269 730 2770 7.8
137 78.17 11.54 Pallavanaickanpattimettur 36 82.62 299 196 567.30 0.00 202 397 27 0.64 1619 430 2660 8.2
138 78.15 11.51 Ayeepalayam 80 165.24 391 12 140.30 0.00 355 695 74 0.85 2102 880 3420 7.6
139 78.09 11.48 Sowdapuram 112 102.06 363 25 140.30 0.00 302 596 70 0.68 1884 700 2960 7.7
140 78.11 11.35 Elur 104 257.58 359 133 115.90 0.00 758 822 51 0.45 2727 1320 4310 7.8
141 78.13 11.43 Pillanallur 128 131.22 580 129 323.30 0.00 365 858 119 0.99 2885 860 4480 7.6
142 78.10 11.51 Vennandur 48 75.33 202 12 414.80 0.00 230 117 42 0.64 1081 430 1770 7.8
143 78.17 11.39 Puduchatram 80 213.84 340 20 262.30 0.00 418 808 14 0.37 2081 1080 3670 7.9
144 78.16 11.67 Hastampatti 34 72.90 32 2 133.69 1.26 41 167 12 0.93 485 385 900 8.0
145 79.19 11.92 Kil_Thayanur 18 43.00 53 8 250.00 18.00 9 64 4 0.54 356 220 610 8.7
146 79.23 12.11 Esalam 32 63.00 276 7 305.00 54.00 81 333 15 0.69 1065 340 1790 8.5

Annexure..
Geoinformatic Modelling for Certain Georesources and Geohazards of
Attur Valley, Tamil Nadu, India.
449
147 79.18 11.76 Tottikunjaram 12 50.00 196 7 311.00 72.00 64 156 1 0.92 717 235 1240 8.9
148 79.16 11.79 Athaiyur 20 62.00 104 12 232.00 36.00 43 149 11 0.98 591 305 1000 8.5
149 79.22 11.76 Vadakurumbur 56 117.00 506 51 415.00 102.00 168 681 43 0.51 2079 620 3380 8.8
150 79.30 11.79 Mettathur 16 72.00 115 27 421.00 54.00 24 96 8 0.57 650 335 1090 8.4
151 79.21 11.69 P.malayanur 14 43.00 196 5 128.00 18.00 90 227 27 0.09 777 210 1340 8.4
Water Quality – Post Monsoon - 2007 Annexure –IIB
Id X Y Location Ca Mg Na K HCO3 CO3 SO4 Cl NO3 F TDS Hard EC Ph
1 78.79 11.56 Aragalur 48 68.04 207 35 451.40 0.00 86 284 10.00 0.40 998 400 1790 7.7
2 78.04 11.53 Attaiyampatti 34 44.96 202 12 414.80 0.00 17 216 17.00 0.80 809 270 1430 7.7
3 78.41 11.69 Attanurpatty 76 136.08 306 20 445.30 0.00 254 496 28.00 0.70 1635 750 2860 7.5
4 78.15 11.51 Ayeepalayam 40 170.10 610 26 530.70 0.00 922 275 101.00 0.42 2762 800 4250 7.6
5 78.84 11.98 Bommidi 4 42.53 44 5 123.09 1.83 43 50 15.00 0.90 332 185 580 8.2
6 78.45 11.98 Chettipatti 44 53.46 81 5 128.10 0.00 72 245 5.00 0.40 587 330 1040 8.0
7 78.42 11.59 Chinnakrishnapuram 60 138.51 283 7 353.80 0.00 254 553 3.00 0.65 1486 720 2630 7.8
8 78.98 11.25 Chittali 26 27.95 122 22 317.20 48.00 32 74 2.52 1.10 513 180 940 8.6
9 78.14 11.87 Danishpet 40 179.82 759 17 256.20 0.00 446 1064 91.00 1.00 3037 840 4930 8.1
10 78.88 11.27 Elambalur 40 48.60 246 63 488.00 0.00 43 213 49.00 0.26 947 300 1831 8.2
11 78.01 11.60 Elampillai 32 106.92 529 27 786.90 0.00 96 43 4.00 1.00 2109 520 3440 8.2
12 78.11 11.35 Elur 92 89.91 304 39 359.90 0.00 202 262 79.00 0.50 1522 600 2260 7.9
13 78.98 11.36 Eraiyoor 84 148.23 161 6 268.40 36.00 293 312 42.00 0.77 1216 820 2360 8.3
14 78.83 11.30 Esanai 40 97.20 246 51 408.70 18.00 115 206 93.80 0.25 1071 500 2200 8.8
15 78.48 11.66 Ettapur 54 13.37 23 8 114.44 0.54 58 46 2.00 0.30 281 190 490 7.7
16 78.65 11.50 Gangavalli 56 24.30 207 51 628.30 0.00 31 128 14.00 1.10 873 240 1530 7.6
17 78.04 11.89 Gundaakkal 12 75.33 30 20 296.43 3.51 12 64 9.00 1.10 436 340 830 8.1

Annexure..
Geoinformatic Modelling for Certain Georesources and Geohazards of
Attur Valley, Tamil Nadu, India.
450
18 78.16 11.67 Hastampatti 18 88.70 44 1 354.64 5.28 12 74 7.00 0.50 489 410 930 8.2
19 78.86 11.48 Kaikalathur 50 85.05 23 4 213.50 0.00 72 170 14.00 0.10 525 475 1060 8.2
20 78.26 11.41 Kalkurichi 92 252.72 62 27 542.90 0.00 230 397 55.00 0.70 1585 1270 2840 7.6
21 78.29 11.59 Kamalapatty 24 37.67 81 1 283.29 1.68 11 46 6.00 0.80 402 215 700 7.8
22 78.91 11.66 Kanianur 118 21.00 110 2 183.00 0.00 149 184 13.00 0.02 733 380 1270 7.8
23 78.30 11.66 Karipatti 84 82.62 110 4 274.50 0.00 96 262 28.00 1.00 901 550 1560 8.0
24 78.09 11.72 Karuppur 16 85.05 12 20 306.31 3.62 25 57 8.00 1.00 439 390 830 8.1
25 78.40 11.70 Kattur 50 52.25 115 1 439.20 0.00 62 99 7.00 1.00 630 340 1150 7.8
26 78.49 11.54 Kirippatti 24 54.68 94 1 366.00 0.00 48 85 4.00 0.40 508 285 970 8.1
27 78.33 11.82 Kombur 32 119.07 104 0 689.30 0.00 96 106 3.00 1.40 815 570 1450 8.2
28 78.68 11.98 Kottapatti 92 128.79 97 38 701.50 0.00 72 191 24.00 0.40 1076 760 1890 7.8
29 78.41 11.73 Kurichy 20 48.60 127 1 396.50 0.00 36 106 8.00 1.10 572 250 1060 7.9
30 78.50 11.57 Malliakarai 44 123.93 230 6 536.80 0.00 72 369 25.00 0.30 1224 620 2230 7.7
31 78.63 11.56 Manjani 64 68.04 175 1 323.30 0.00 120 241 18.00 1.00 910 440 1570 7.7
32 78.33 11.97 Menasi 38 8.51 46 4 178.27 1.68 29 50 17.00 0.90 361 130 630 8.0
33 78.92 11.34 Mettupalayam 48 148.23 133 5 372.10 24.00 14 269 81.20 0.10 908 730 2050 8.4
34 78.94 11.83 Murar_Palayam 72 85.00 294 4 763.00 0.00 192 191 27.00 0.45 1339 530 2040 7.8
35 78.04 11.71 Muthunaickanpatti 28 60.75 221 14 561.20 0.00 86 163 9.00 1.00 893 320 1570 8.0
36 78.48 11.33 Nagayanallur 46 82.62 179 6 475.80 0.00 192 170 10.50 1.00 924 455 1690 8.1
37 78.92 11.58 Nainarpalayam 84 33.00 191 13 470.00 0.00 97 184 9.00 0.17 877 345 1430 8.2
38 78.13 11.60 Nalikkalpatty 124 93.56 212 7 353.80 0.00 250 376 28.00 0.50 1364 695 2370 7.8
39 78.05 11.75 Omalur 24 160.38 506 14 756.40 6.00 38 610 84.00 1.00 2109 720 3610 8.3
40 78.17 11.54 Pallavanaickanpattimettur 20 85.05 414 63 530.70 0.00 490 32 105.00 0.42 1838 400 2700 7.5
41 78.39 11.91 Pappireddipatti 24 59.54 143 12 195.20 0.00 86 262 5.00 0.80 707 305 1220 8.0
42 78.89 11.43 Pasumbalur 14 34.02 198 36 298.90 66.00 72 138 15.30 0.09 723 175 1300 8.7
43 78.24 11.30 Pattathayankuttai 24 126.36 193 5 622.20 0.00 120 269 0.05 1.00 1053 580 2020 7.9

Annexure..
Geoinformatic Modelling for Certain Georesources and Geohazards of
Attur Valley, Tamil Nadu, India.
451
44 78.51 11.65 Peddanaikanpalayam 48 63.18 529 1 231.80 0.00 336 652 16.00 1.00 1860 380 3000 7.7
45 78.13 11.43 Pillanallur 56 136.08 828 48 518.50 0.00 1229 351 105.00 0.56 3378 700 5160 7.7
46 78.72 11.42 Poolambadi 40 30.38 2 47 112.78 2.12 35 96 2.94 0.10 323 225 580 8.3
47 78.17 11.39 Puduchatram 96 92.34 460 17 536.80 0.00 384 553 1.00 1.00 1879 620 3290 8.0
48 78.19 11.48 Pudupalayam 116 8.51 117 6 427.00 0.00 31 128 2.00 1.00 629 325 1120 7.5
49 78.28 11.49 Pudupatti 10 176.18 322 22 469.70 0.00 250 539 18.00 1.10 1641 750 2970 7.7
50 78.19 11.46 Rasipuram 24 148.23 267 24 433.10 0.00 470 230 32.00 1.00 1527 670 2570 7.5
51 78.92 11.89 Sankarapuram 84 54.00 313 3 445.00 0.00 182 340 22.00 0.09 1296 430 2190 7.8
52 78.53 11.45 Sendarappatti 144 29.16 437 235 439.20 0.00 154 553 119.00 0.50 2299 480 5420 7.7
53 78.22 11.42 Singalandapuram 60 388.80 897 47 640.50 0.00 2160 85 252.00 0.43 5089 1750 7310 7.6
54 78.22 11.35 Solaiyudaiyampatti 40 136.08 97 13 475.80 0.00 41 199 47.00 0.80 977 660 1750 7.8
55 78.09 11.48 Sowdapuram 28 160.38 483 38 427.00 0.00 768 195 101.00 0.35 2339 730 3510 7.6
56 78.12 11.68 Suramangalam 22 59.54 87 1 359.90 0.00 19 92 15.00 0.56 527 300 990 8.2
57 78.76 11.58 Thalaivasal 30 49.82 115 1 274.50 0.00 53 163 5.00 1.60 571 280 1030 7.8
58 78.16 11.30 Thalambadi 24 172.53 253 16 488.00 0.00 230 362 51.00 0.35 1534 770 2640 7.4
59 78.50 11.39 Thalugai 60 170.10 258 9 427.00 0.00 96 674 6.72 1.00 1487 850 2780 7.5
60 78.09 11.88 Theevattipatti 80 133.65 92 23 158.60 0.00 106 418 42.00 0.75 1119 750 1940 7.9
61 78.10 11.74 Thekkampatti 52 187.11 83 13 256.20 0.00 77 340 91.00 0.56 1283 900 2160 7.9
62 78.95 11.89 Thimmanendal 80 80.00 161 11 268.00 0.00 173 340 8.00 0.21 1014 530 1690 7.8
63 78.07 11.93 Thoppur 28 153.09 184 2 274.50 0.00 240 355 38.00 1.40 1268 700 2150 8.0
64 78.80 11.26 Tiruppayyarnattam 50 53.46 127 38 207.40 6.00 34 227 43.40 0.45 682 345 1340 8.5
65 78.51 11.26 Uppliyapuram 106 59.54 143 4 244.00 0.00 156 259 23.80 0.56 873 510 1580 8.0
66 78.94 11.51 Vallimarudham 40 45.00 161 39 543.00 0.00 48 106 8.00 0.51 746 285 1190 7.9
67 78.74 11.47 Veeraganur 12 48.60 212 215 372.10 0.00 192 269 23.00 0.50 1241 230 1920 7.8
68 78.78 11.34 Vengalam 20 88.70 94 43 201.30 30.00 86 160 40.60 0.42 663 415 1350 8.6
69 78.10 11.51 Vennandur 40 99.63 230 25 506.30 0.00 336 87 43.00 0.62 1264 510 2030 7.8

Annexure..
Geoinformatic Modelling for Certain Georesources and Geohazards of
Attur Valley, Tamil Nadu, India.
452
70 77.97 11.84 Amaram 16 64.40 81 2 280.60 18.00 15 99 18.00 0.65 515 305 900 8.4
71 78.15 11.14 Aniapuram 70 71.69 115 7 256.20 0.00 154 191 18.00 0.63 819 470 1410 7.9
72 77.75 11.56 Kalvadangam 88 128.79 94 31 183.00 0.00 48 411 60.00 0.42 1158 750 1960 7.6
73 77.84 11.48 Chinnagoundanur 72 34.02 120 196 439.20 0.00 46 213 35.00 0.30 1056 320 1600 7.4
74 77.85 11.66 Iruppali 40 97.20 598 39 793.00 0.00 106 638 55.00 0.40 2158 500 3670 7.3
75 77.99 11.54 Kunnipalayam 64 155.52 506 391 359.90 0.00 264 1177 56.00 1.00 2986 800 4840 7.2
76 77.92 11.57 Konganapuram 30 17.01 23 8 139.46 0.52 10 35 3.00 0.90 222 145 370 7.6
77 77.84 11.59 Idappadi 120 157.95 2116 469 732.00 0.00 720 3191 77.00 0.80 7481 950 10000 8.0
78 77.91 11.62 Koranampatti 56 75.33 173 1 158.60 12.00 106 319 35.00 1.00 977 450 1610 8.4
79 77.87 11.50 Vadugapatti 20 65.61 414 78 622.20 0.00 17 425 57.00 1.00 1583 320 2620 7.8
80 77.96 11.74 Tholasampati 28 60.75 253 14 610.00 0.00 44 191 10.00 0.90 940 320 1630 8.0
81 77.98 11.69 Tharamangalam 12 92.34 168 14 408.70 0.00 72 227 15.00 0.56 856 410 1560 8.0
82 78.00 11.85 Marakottai 28 133.65 230 11 512.40 0.00 192 277 25.00 0.50 1239 620 2180 8.1
83 77.96 11.77 Manathal 16 63.18 276 15 658.80 6.00 72 184 9.00 0.70 1001 300 1550 8.3
84 78.80 11.20 Velur 16 32.81 13 1 172.35 2.57 15 11 1.68 0.10 198 175 410 8.2
85 79.01 11.39 Tirumandurai 24 34.02 294 3 475.80 24.00 79 167 22.40 0.62 885 200 1690 8.6
86 79.08 11.35 Kilumattur 64 150.66 915 74 628.30 120.00 922 798 21.00 1.00 3378 780 5730 8.9
87 78.79 11.18 Velur 42 76.55 78 10 311.10 6.00 23 124 39.20 0.29 554 420 1200 8.7
88 78.89 11.18 Ayilur 60 78.98 182 43 408.70 0.00 58 294 37.80 0.32 958 475 1850 8.2
89 79.06 11.18 Kilmattur 10 17.01 32 32 158.86 5.94 8 25 1.40 0.36 228 95 410 8.6
90 78.76 11.10 Pirahambi 20 63.18 175 36 347.70 0.00 87 202 21.00 0.60 778 310 1470 8.0
91 77.99 11.77 Olaipatti 18 61.97 242 14 305.00 0.00 250 177 24.00 0.92 1022 300 1290 8.1
92 77.89 11.76 Nangavalli 20 89.91 175 35 463.60 0.00 58 241 15.00 0.90 917 420 1630 8.1
93 77.86 11.81 Kunjandiyur 14 46.17 115 18 231.80 0.00 120 82 18.00 0.62 591 225 810 8.3
94 77.89 11.69 Jalakandapuram 12 31.59 368 18 359.90 18.00 480 85 14.00 1.10 1255 160 1930 8.6
95 77.79 11.81 Mulakadu 18 75.33 81 5 280.60 12.00 53 99 25.00 0.40 594 355 1070 8.5

Annexure..
Geoinformatic Modelling for Certain Georesources and Geohazards of
Attur Valley, Tamil Nadu, India.
453
96 78.29 12.09 Kadathur 60 89.91 285 19 122.00 0.00 288 440 42.00 1.40 1429 520 2140 7.9
97 78.27 12.05 Sunkarahalli 64 179.82 265 11 237.90 0.00 336 510 70.00 1.00 1795 900 2700 7.7
98 78.23 11.24 Muthugapatti 48 116.64 322 336 518.50 0.00 206 468 119.00 1.00 2288 600 3450 7.6
99 78.29 11.15 Erumaipatti 56 92.34 179 11 488.00 0.00 77 255 22.00 0.70 1015 520 1810 7.8
100 78.23 11.24 Muthagapatti 56 335.34 230 26 256.20 0.00 653 737 36.00 0.38 2337 1520 4100 7.8
101 78.75 11.23 Ladapuram 30 12.15 78 11 168.50 6.31 22 64 5.04 1.20 329 125 620 8.6
102 78.73 11.16 Nakkaselam 24 88.70 235 43 542.90 0.00 125 280 5.88 0.34 1073 425 1980 7.9
103 78.37 11.18 Sangampatti 28 51.03 386 34 378.20 30.00 115 305 70.00 0.20 1208 280 2310 8.4
104 78.65 11.20 Sengattuppatti 32 66.83 46 2 290.59 4.33 68 60 2.10 1.00 457 355 890 8.2
105 78.79 11.08 Maniyankurichchi 16 97.20 144 10 183.00 0.00 156 199 53.20 0.40 767 440 1530 7.9
106 78.10 11.24 Ernapuram 48 150.66 414 51 274.50 0.00 230 553 139.00 0.80 1652 740 3460 7.6
107 78.08 11.09 Palapatty 40 48.60 626 78 1110.20 0.00 576 46 56.00 0.62 1219 300 3450 7.9
108 78.01 11.11 Velur 28 85.05 317 47 372.10 0.00 442 94 73.00 0.32 1525 420 2270 7.9
109 78.95 11.14 Kabilarmalai 80 65.61 258 29 317.20 0.00 240 355 15.00 0.50 1255 470 2120 7.8
110 77.89 11.11 Ayyampalayam 40 75.33 191 20 457.50 0.00 96 234 4.00 1.00 906 410 1640 7.5
111 78.15 11.24 Nallipalayam 74 59.54 104 15 457.50 0.00 31 128 25.00 0.52 754 430 1330 8.0
112 77.98 11.25 Ramadevam 56 223.56 322 12 640.50 0.00 442 496 20.00 0.65 1969 1060 3450 7.4
113 78.05 11.11 Kilmugam 26 53.46 97 11 250.10 0.00 86 152 2.00 1.00 561 285 1010 7.9
114 78.62 11.09 Nallavannipatti 66 35.24 35 5 256.11 3.82 38 28 16.10 0.51 382 310 760 8.2
115 78.40 11.16 Mahadevi 18 57.11 299 6 463.60 42.00 82 230 21.00 1.10 987 280 1820 8.3
116 78.46 11.21 Pachchiperumalpatti 24 58.32 258 14 420.90 0.00 144 241 8.40 1.00 957 300 1620 8.4
117 79.19 11.92 Kil_Thayanur 36 39.00 74 5 262.00 0.00 31 113 1.00 0.79 433 250 800 7.7
118 79.23 12.11 Esalam 106 45.00 106 6 476.00 0.00 36 177 4.00 0.71 732 450 1270 7.8
119 78.05 12.14 B.S._Agraharam 16 162.81 193 59 280.60 0.00 336 340 63.00 0.60 1527 710 2480 8.0
120 78.36 11.22 Nirmullikuttai 74 36.45 133 1 347.70 0.00 58 145 18.00 1.00 701 335 1180 7.9
121 79.09 11.50 Kaludhur 88 75.00 327 73 634.00 0.00 211 347 33.00 0.69 1584 530 2450 8.2

Annexure..
Geoinformatic Modelling for Certain Georesources and Geohazards of
Attur Valley, Tamil Nadu, India.
454
122 79.01 11.44 Eluthur 52 68.00 242 74 458.00 0.00 190 227 36.00 0.25 1241 410 2040 7.7
123 77.95 11.95 Perumbalai 28 94.77 294 10 366.00 0.00 288 284 36.00 0.90 1340 460 2020 8.1
124 78.49 12.12 K.Vetrapatti 30 36.45 53 5 177.83 2.10 29 71 11.00 0.98 383 225 670 8.1
125 79.18 11.76 Tottikunjaram 52 68.00 182 8 628.00 0.00 62 163 4.00 1.20 867 410 1510 8.0
126 79.16 11.79 Athaiyur 104 35.00 143 6 451.00 0.00 64 174 9.00 1.37 791 405 1300 7.7
127 79.22 11.76 Vadakurumbur 72 23.00 51 5 354.00 0.00 26 46 1.00 0.49 404 275 710 8.0
128 79.30 11.79 Mettathur 44 51.00 87 22 451.00 0.00 21 82 7.00 0.99 564 320 960 7.8
129 79.02 11.74 Madur 106 22.00 141 4 433.00 0.00 100 138 6.00 0.27 754 355 1200 8.1
130 79.21 11.69 P.malayanur 80 30.00 106 6 476.00 0.00 38 74 5.00 0.67 594 325 990 7.8
131 79.09 11.82 Rishivandiyam 140 27.00 152 9 409.00 0.00 88 234 16.00 0.51 925 460 1500 7.7
132 79.08 12.01 Kallippadi 160 29.00 357 55 555.00 0.00 233 432 14.00 0.03 1606 520 2420 8.2
133 79.10 11.81 Rishivandhiyam 92 36.00 207 5 250.00 0.00 149 312 12.00 0.12 979 380 1670 7.7
134 79.00 11.92 Ariyalur 336 83.00 198 8 409.00 0.00 264 617 41.00 0.04 1892 1180 3050 7.6
135 79.08 11.89 S.kolathur 80 71.00 258 215 726.00 12.00 168 298 36.00 0.04 1624 490 2500 8.3
136 79.26 11.58 M.parur 52 75.00 281 14 531.00 0.00 264 213 15.00 0.24 1231 440 1830 8.2
137 79.22 11.63 Mavadandal 46 41.00 120 4 256.00 0.00 68 156 8.00 0.99 598 285 1000 7.9
138 79.26 11.58 M.Parur 140 34.00 122 13 421.00 0.00 88 206 14.00 0.30 876 490 1400 8.1
139 79.08 11.54 Vilambavur 24 71.00 271 6 537.00 0.00 174 156 33.00 1.15 1117 350 1780 8.0
140 79.18 11.60 Erangi 68 36.00 186 25 482.00 0.00 99 135 22.00 0.90 887 320 1420 7.7
141 79.08 11.67 Vadapoondi 28 19.00 97 5 262.00 6.00 48 50 8.00 0.62 419 150 640 8.3
142 79.02 11.65 Sitheri 110 49.00 131 5 439.00 0.00 97 184 14.00 0.36 858 475 1340 8.2
143 79.03 11.70 Kurur 72 102.00 391 14 689.00 0.00 202 432 24.00 1.16 1664 600 2610 8.1
144 78.22 12.13 Solaikottai 112 126.36 281 5 500.20 0.00 312 780 39.00 0.80 1968 800 3420 8.2
145 78.32 12.20 Kambainallur 24 72.90 193 8 176.90 0.00 96 355 24.00 1.20 944 360 1530 7.5
146 78.74 12.20 Krishnapuram 132 8.51 143 13 366.00 0.00 72 482 8.00 1.00 1069 365 2070 8.2
147 78.42 12.07 Beddur 60 97.20 44 20 268.40 0.00 144 170 12.00 1.00 722 550 1320 8.1

Annexure..
Geoinformatic Modelling for Certain Georesources and Geohazards of
Attur Valley, Tamil Nadu, India.
455
148 78.11 12.23 Pulikarai 44 9.72 150 66 262.30 0.00 96 152 13.00 0.80 707 150 1100 7.9
149 78.62 12.25 Singarapettai 20 53.46 186 215 591.70 0.00 96 234 15.00 1.00 1167 270 1940 7.3
150 78.58 12.20 Pavakkal 30 48.60 87 8 146.40 0.00 62 188 7.00 0.80 528 275 950 8.1
151 78.44 12.25 Kallavi 40 77.76 205 13 366.00 0.00 120 305 8.00 0.70 979 420 1640 8.0
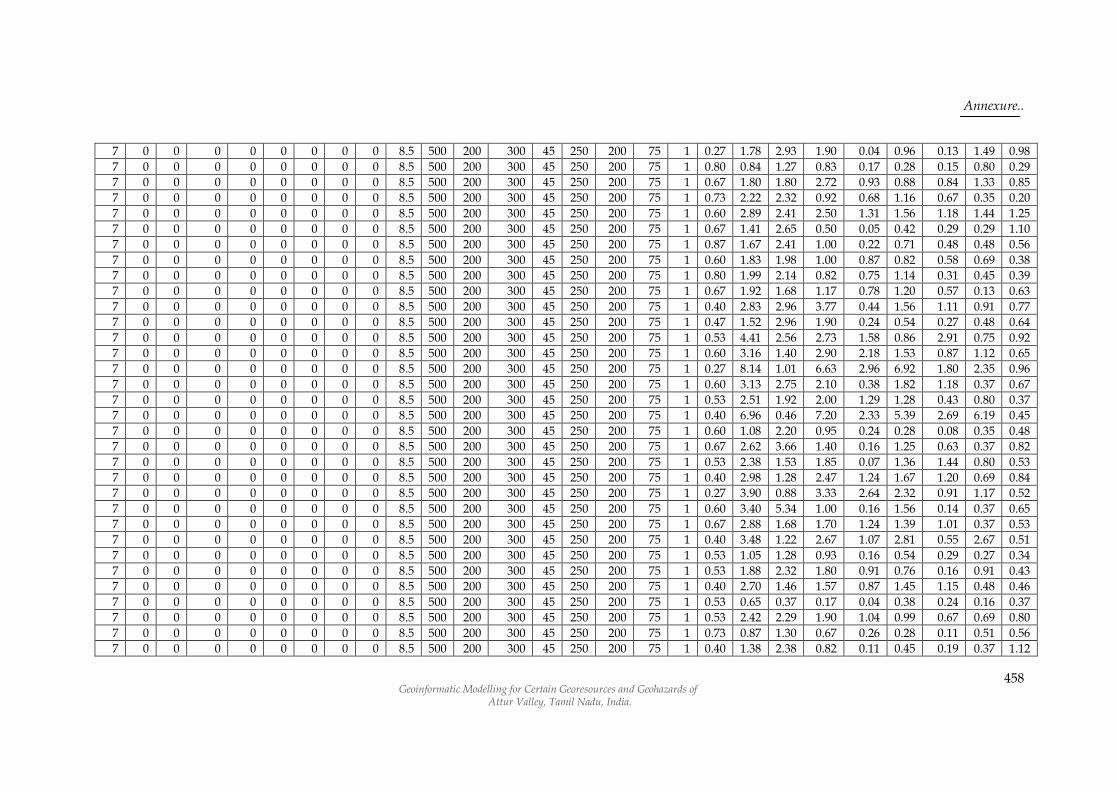
Calculation of Water Quality Index – Pre Monsoon - 2007 Annexure – IIIA
Vid Sn Qn
Ph
Td
s
To
t
alk
T
ot
ha
rdn
ess
NO
3
Cl
SO
4
Ca
F
Ph
Td
s
To
t a
lk
To
t
ha
rdn
ess
No
3
Cl
SO
4
Ca
F
Ph
Td
s
To
t a
lk
To
t
ha
rdn
ess
NO
3
Cl
SO
4
Ca F
7 0 0 0 0 0 0 0 0 8.5 500 200 300 45 250 200 75 1 0.53 3.81 4.79 4.40 0.22 2.84 0.29 0.64 0.65
7 0 0 0 0 0 0 0 0 8.5 500 200 300 45 250 200 75 1 0.53 1.20 2.41 0.67 0.22 0.09 0.36 0.27 0.53
7 0 0 0 0 0 0 0 0 8.5 500 200 300 45 250 200 75 1 0.20 1.44 1.46 1.55 0.09 0.94 0.36 1.28 1.20
7 0 0 0 0 0 0 0 0 8.5 500 200 300 45 250 200 75 1 0.40 1.36 1.01 1.23 0.40 0.89 0.31 0.40 0.93
7 0 0 0 0 0 0 0 0 8.5 500 200 300 45 250 200 75 1 0.60 1.83 1.53 1.27 0.24 1.16 0.53 0.21 0.87
7 0 0 0 0 0 0 0 0 8.5 500 200 300 45 250 200 75 1 0.67 2.16 2.81 1.30 0.29 1.08 0.36 0.43 0.95
7 0 0 0 0 0 0 0 0 8.5 500 200 300 45 250 200 75 1 0.40 2.42 0.76 2.50 0.78 1.70 1.01 0.72 0.82
7 0 0 0 0 0 0 0 0 8.5 500 200 300 45 250 200 75 1 0.73 0.33 0.67 0.42 0.02 0.07 0.03 0.21 0.84
7 0 0 0 0 0 0 0 0 8.5 500 200 300 45 250 200 75 1 0.40 4.05 1.13 2.67 0.49 3.40 1.44 1.49 0.85
7 0 0 0 0 0 0 0 0 8.5 500 200 300 45 250 200 75 1 0.53 1.10 1.53 1.23 0.02 0.48 0.48 0.75 1.60
7 0 0 0 0 0 0 0 0 8.5 500 200 300 45 250 200 75 1 0.67 1.08 1.77 1.00 0.22 0.34 0.24 0.69 1.00
7 0 0 0 0 0 0 0 0 8.5 500 200 300 45 250 200 75 1 0.47 1.61 1.37 1.50 0.18 1.11 0.28 0.75 0.90
7 0 0 0 0 0 0 0 0 8.5 500 200 300 45 250 200 75 1 0.40 2.49 1.16 2.07 0.62 2.07 0.39 0.85 1.40
7 0 0 0 0 0 0 0 0 8.5 500 200 300 45 250 200 75 1 0.53 3.38 0.98 4.07 1.22 3.01 0.43 2.03 0.53
7 0 0 0 0 0 0 0 0 8.5 500 200 300 45 250 200 75 1 0.33 3.28 2.59 1.47 0.49 1.70 1.39 0.85 0.70
7 0 0 0 0 0 0 0 0 8.5 500 200 300 45 250 200 75 1 0.27 2.73 2.53 2.17 0.49 1.67 0.67 1.49 0.83
7 0 0 0 0 0 0 0 0 8.5 500 200 300 45 250 200 75 1 0.47 2.23 2.69 1.60 0.38 1.08 0.57 0.85 0.20
7 0 0 0 0 0 0 0 0 8.5 500 200 300 45 250 200 75 1 0.27 2.11 1.38 1.83 0.53 1.33 0.63 1.76 0.20
7 0 0 0 0 0 0 0 0 8.5 500 200 300 45 250 200 75 1 0.33 1.66 1.65 0.70 0.18 0.72 0.73 0.67 0.19
7 0 0 0 0 0 0 0 0 8.5 500 200 300 45 250 200 75 1 0.33 1.39 1.83 0.78 0.24 0.54 0.42 0.32 0.04

Annexure..
Geoinformatic Modelling for Certain Georesources and Geohazards of
Attur Valley, Tamil Nadu, India.
456
7 0 0 0 0 0 0 0 0 8.5 500 200 300 45 250 200 75 1 0.60 2.37 4.06 1.63 0.49 0.54 0.67 0.91 0.08
7 0 0 0 0 0 0 0 0 8.5 500 200 300 45 250 200 75 1 0.27 1.94 1.74 1.70 0.36 1.19 0.43 1.97 0.01
7 0 0 0 0 0 0 0 0 8.5 500 200 300 45 250 200 75 1 0.53 1.83 1.71 1.50 0.02 1.28 0.43 0.53 0.98
7 0 0 0 0 0 0 0 0 8.5 500 200 300 45 250 200 75 1 0.60 0.64 1.05 0.53 0.04 0.18 0.13 0.40 0.87
7 0 0 0 0 0 0 0 0 8.5 500 200 300 45 250 200 75 1 0.53 0.78 1.15 0.97 0.24 0.24 0.09 0.53 0.73
7 0 0 0 0 0 0 0 0 8.5 500 200 300 45 250 200 75 1 0.53 3.82 2.59 2.07 1.71 1.98 0.98 0.75 0.74
7 0 0 0 0 0 0 0 0 8.5 500 200 300 45 250 200 75 1 0.67 1.97 3.08 2.33 0.13 1.25 0.10 0.43 0.84
7 0 0 0 0 0 0 0 0 8.5 500 200 300 45 250 200 75 1 0.73 0.64 0.82 0.62 0.18 0.18 0.12 0.35 0.89
7 0 0 0 0 0 0 0 0 8.5 500 200 300 45 250 200 75 1 0.40 2.87 2.81 2.27 0.16 1.70 0.99 2.03 1.40
7 0 0 0 0 0 0 0 0 8.5 500 200 300 45 250 200 75 1 0.47 1.64 1.62 1.63 0.58 0.91 0.25 0.91 0.32
7 0 0 0 0 0 0 0 0 8.5 500 200 300 45 250 200 75 1 0.53 2.70 2.96 3.33 0.36 1.62 0.81 1.49 1.20
7 0 0 0 0 0 0 0 0 8.5 500 200 300 45 250 200 75 1 0.67 3.86 3.36 1.60 0.29 2.38 1.17 0.75 0.11
7 0 0 0 0 0 0 0 0 8.5 500 200 300 45 250 200 75 1 0.67 2.31 2.02 2.20 0.18 1.53 0.75 1.28 0.02
7 0 0 0 0 0 0 0 0 8.5 500 200 300 45 250 200 75 1 0.67 2.39 2.17 2.03 0.87 1.14 0.72 1.33 0.02
7 0 0 0 0 0 0 0 0 8.5 500 200 300 45 250 200 75 1 0.73 2.09 2.81 1.77 0.40 0.88 0.53 0.80 0.02
7 0 0 0 0 0 0 0 0 8.5 500 200 300 45 250 200 75 1 0.60 0.84 1.67 0.88 0.02 0.18 0.10 0.27 0.93
7 0 0 0 0 0 0 0 0 8.5 500 200 300 45 250 200 75 1 0.60 4.78 6.10 3.00 0.02 3.40 0.24 0.75 0.78
7 0 0 0 0 0 0 0 0 8.5 500 200 300 45 250 200 75 1 0.80 1.78 3.78 1.73 0.51 0.37 0.09 0.43 0.84
7 0 0 0 0 0 0 0 0 8.5 500 200 300 45 250 200 75 1 0.40 2.91 1.62 1.83 0.09 1.11 2.64 0.80 0.67
7 0 0 0 0 0 0 0 0 8.5 500 200 300 45 250 200 75 1 0.53 1.53 1.98 0.72 0.49 0.51 0.29 0.40 0.63
7 0 0 0 0 0 0 0 0 8.5 500 200 300 45 250 200 75 1 0.60 3.97 4.09 2.40 1.27 1.98 0.72 0.53 0.92
7 0 0 0 0 0 0 0 0 8.5 500 200 300 45 250 200 75 1 0.80 2.57 4.00 0.60 0.31 1.02 0.39 0.11 0.73
7 0 0 0 0 0 0 0 0 8.5 500 200 300 45 250 200 75 1 1.07 1.30 1.89 0.90 0.29 0.55 0.14 0.35 1.10
7 0 0 0 0 0 0 0 0 8.5 500 200 300 45 250 200 75 1 0.87 0.55 1.25 0.75 0.09 0.04 0.05 0.05 0.54
7 0 0 0 0 0 0 0 0 8.5 500 200 300 45 250 200 75 1 0.53 2.32 1.43 2.17 0.38 1.19 1.44 0.75 0.78
7 0 0 0 0 0 0 0 0 8.5 500 200 300 45 250 200 75 1 0.60 1.72 3.75 0.95 0.27 0.26 0.24 0.27 0.89
7 0 0 0 0 0 0 0 0 8.5 500 200 300 45 250 200 75 1 0.87 2.90 2.69 1.43 0.24 1.50 1.02 0.80 0.51
7 0 0 0 0 0 0 0 0 8.5 500 200 300 45 250 200 75 1 0.40 1.54 1.59 1.42 0.64 0.62 0.40 1.12 0.20
7 0 0 0 0 0 0 0 0 8.5 500 200 300 45 250 200 75 1 0.80 1.74 1.80 1.67 0.48 0.99 0.59 0.80 0.66
7 0 0 0 0 0 0 0 0 8.5 500 200 300 45 250 200 75 1 0.80 1.15 2.07 1.50 0.20 0.38 0.37 0.75 0.43
7 0 0 0 0 0 0 0 0 8.5 500 200 300 45 250 200 75 1 0.87 2.48 2.38 2.83 1.56 1.42 0.72 0.69 0.69
7 0 0 0 0 0 0 0 0 8.5 500 200 300 45 250 200 75 1 0.87 1.89 1.89 1.70 0.09 0.99 0.94 1.07 0.97
7 0 0 0 0 0 0 0 0 8.5 500 200 300 45 250 200 75 1 0.40 3.84 5.34 3.20 0.40 1.96 0.72 1.23 0.92

Annexure..
Geoinformatic Modelling for Certain Georesources and Geohazards of
Attur Valley, Tamil Nadu, India.
457
7 0 0 0 0 0 0 0 0 8.5 500 200 300 45 250 200 75 1 0.40 3.15 3.05 2.13 0.38 1.42 1.32 1.23 0.69
7 0 0 0 0 0 0 0 0 8.5 500 200 300 45 250 200 75 1 0.60 0.99 1.32 1.03 0.38 0.28 0.07 0.51 0.54
7 0 0 0 0 0 0 0 0 8.5 500 200 300 45 250 200 75 1 0.40 3.31 1.74 3.07 0.53 3.01 0.24 2.72 0.82
7 0 0 0 0 0 0 0 0 8.5 500 200 300 45 250 200 75 1 0.40 1.37 1.95 1.50 0.73 0.37 0.20 0.75 0.65
7 0 0 0 0 0 0 0 0 8.5 500 200 300 45 250 200 75 1 0.60 2.58 1.40 2.00 1.64 1.45 0.41 0.32 0.64
7 0 0 0 0 0 0 0 0 8.5 500 200 300 45 250 200 75 1 0.80 3.03 2.90 1.33 0.40 1.42 1.21 1.07 0.06
7 0 0 0 0 0 0 0 0 8.5 500 200 300 45 250 200 75 1 0.93 4.21 3.51 1.27 0.73 2.04 1.13 0.75 0.88
7 0 0 0 0 0 0 0 0 8.5 500 200 300 45 250 200 75 1 0.67 1.80 2.20 1.57 0.36 0.85 0.42 1.44 0.10
7 0 0 0 0 0 0 0 0 8.5 500 200 300 45 250 200 75 1 1.00 0.90 0.85 1.17 0.48 0.58 0.12 0.59 0.33
7 0 0 0 0 0 0 0 0 8.5 500 200 300 45 250 200 75 1 1.00 1.70 2.04 0.80 0.87 0.64 0.51 0.59 0.10
7 0 0 0 0 0 0 0 0 8.5 500 200 300 45 250 200 75 1 0.93 1.31 2.01 0.88 0.36 0.42 0.35 0.21 1.52
7 0 0 0 0 0 0 0 0 8.5 500 200 300 45 250 200 75 1 0.87 1.69 1.65 0.92 0.47 0.96 0.42 0.40 0.68
7 0 0 0 0 0 0 0 0 8.5 500 200 300 45 250 200 75 1 0.73 1.55 2.23 0.85 0.64 0.41 0.29 0.19 0.24
7 0 0 0 0 0 0 0 0 8.5 500 200 300 45 250 200 75 1 0.87 0.95 1.62 0.68 0.13 0.27 0.23 0.43 0.19
7 0 0 0 0 0 0 0 0 8.5 500 200 300 45 250 200 75 1 0.87 3.18 3.20 1.80 0.56 1.64 0.94 0.64 1.02
7 0 0 0 0 0 0 0 0 8.5 500 200 300 45 250 200 75 1 0.93 1.52 2.11 0.90 0.47 0.44 0.27 0.40 0.04
7 0 0 0 0 0 0 0 0 8.5 500 200 300 45 250 200 75 1 0.87 2.10 3.23 1.00 0.47 0.45 0.67 0.37 1.19
7 0 0 0 0 0 0 0 0 8.5 500 200 300 45 250 200 75 1 0.73 1.11 0.70 1.15 0.24 0.82 0.27 0.67 0.32
7 0 0 0 0 0 0 0 0 8.5 500 200 300 45 250 200 75 1 1.07 0.69 1.42 0.33 0.03 0.07 0.09 0.27 0.37
7 0 0 0 0 0 0 0 0 8.5 500 200 300 45 250 200 75 1 1.13 1.17 2.28 0.42 0.34 0.13 0.18 0.27 1.21
7 0 0 0 0 0 0 0 0 8.5 500 200 300 45 250 200 75 1 0.80 6.47 1.53 2.80 0.09 5.78 2.50 1.07 0.87
7 0 0 0 0 0 0 0 0 8.5 500 200 300 45 250 200 75 1 0.73 2.68 2.07 1.83 0.14 1.70 1.20 0.53 0.62
7 0 0 0 0 0 0 0 0 8.5 500 200 300 45 250 200 75 1 0.73 1.11 1.83 0.98 0.05 0.45 0.29 0.35 0.38
7 0 0 0 0 0 0 0 0 8.5 500 200 300 45 250 200 75 1 0.47 1.91 2.29 0.52 0.93 0.80 0.43 0.45 0.29
7 0 0 0 0 0 0 0 0 8.5 500 200 300 45 250 200 75 1 0.93 0.97 1.77 0.75 0.04 0.27 0.08 0.53 0.96
7 0 0 0 0 0 0 0 0 8.5 500 200 300 45 250 200 75 1 0.87 1.39 1.68 1.00 0.09 0.68 0.53 0.53 0.52
7 0 0 0 0 0 0 0 0 8.5 500 200 300 45 250 200 75 1 0.73 2.03 2.07 1.00 0.56 1.05 0.65 0.51 0.42
7 0 0 0 0 0 0 0 0 8.5 500 200 300 45 250 200 75 1 1.07 0.61 1.12 0.67 0.03 0.14 0.13 0.45 0.36
7 0 0 0 0 0 0 0 0 8.5 500 200 300 45 250 200 75 1 0.40 2.99 2.14 0.97 0.96 1.50 0.94 0.75 0.23
7 0 0 0 0 0 0 0 0 8.5 500 200 300 45 250 200 75 1 0.67 1.62 1.80 1.43 0.49 0.71 0.46 0.88 0.52
7 0 0 0 0 0 0 0 0 8.5 500 200 300 45 250 200 75 1 0.73 0.81 0.60 0.75 0.18 0.44 0.28 0.43 1.20
7 0 0 0 0 0 0 0 0 8.5 500 200 300 45 250 200 75 1 0.60 2.60 2.93 1.77 0.22 1.36 0.96 0.37 0.90
7 0 0 0 0 0 0 0 0 8.5 500 200 300 45 250 200 75 1 0.60 1.41 3.14 1.50 0.20 0.38 0.03 1.07 0.43
Annexure..
Geoinformatic Modelling for Certain Georesources and Geohazards of
Attur Valley, Tamil Nadu, India.
458
7 0 0 0 0 0 0 0 0 8.5 500 200 300 45 250 200 75 1 0.27 1.78 2.93 1.90 0.04 0.96 0.13 1.49 0.98
7 0 0 0 0 0 0 0 0 8.5 500 200 300 45 250 200 75 1 0.80 0.84 1.27 0.83 0.17 0.28 0.15 0.80 0.29
7 0 0 0 0 0 0 0 0 8.5 500 200 300 45 250 200 75 1 0.67 1.80 1.80 2.72 0.93 0.88 0.84 1.33 0.85
7 0 0 0 0 0 0 0 0 8.5 500 200 300 45 250 200 75 1 0.73 2.22 2.32 0.92 0.68 1.16 0.67 0.35 0.20
7 0 0 0 0 0 0 0 0 8.5 500 200 300 45 250 200 75 1 0.60 2.89 2.41 2.50 1.31 1.56 1.18 1.44 1.25
7 0 0 0 0 0 0 0 0 8.5 500 200 300 45 250 200 75 1 0.67 1.41 2.65 0.50 0.05 0.42 0.29 0.29 1.10
7 0 0 0 0 0 0 0 0 8.5 500 200 300 45 250 200 75 1 0.87 1.67 2.41 1.00 0.22 0.71 0.48 0.48 0.56
7 0 0 0 0 0 0 0 0 8.5 500 200 300 45 250 200 75 1 0.60 1.83 1.98 1.00 0.87 0.82 0.58 0.69 0.38
7 0 0 0 0 0 0 0 0 8.5 500 200 300 45 250 200 75 1 0.80 1.99 2.14 0.82 0.75 1.14 0.31 0.45 0.39
7 0 0 0 0 0 0 0 0 8.5 500 200 300 45 250 200 75 1 0.67 1.92 1.68 1.17 0.78 1.20 0.57 0.13 0.63
7 0 0 0 0 0 0 0 0 8.5 500 200 300 45 250 200 75 1 0.40 2.83 2.96 3.77 0.44 1.56 1.11 0.91 0.77
7 0 0 0 0 0 0 0 0 8.5 500 200 300 45 250 200 75 1 0.47 1.52 2.96 1.90 0.24 0.54 0.27 0.48 0.64
7 0 0 0 0 0 0 0 0 8.5 500 200 300 45 250 200 75 1 0.53 4.41 2.56 2.73 1.58 0.86 2.91 0.75 0.92
7 0 0 0 0 0 0 0 0 8.5 500 200 300 45 250 200 75 1 0.60 3.16 1.40 2.90 2.18 1.53 0.87 1.12 0.65
7 0 0 0 0 0 0 0 0 8.5 500 200 300 45 250 200 75 1 0.27 8.14 1.01 6.63 2.96 6.92 1.80 2.35 0.96
7 0 0 0 0 0 0 0 0 8.5 500 200 300 45 250 200 75 1 0.60 3.13 2.75 2.10 0.38 1.82 1.18 0.37 0.67
7 0 0 0 0 0 0 0 0 8.5 500 200 300 45 250 200 75 1 0.53 2.51 1.92 2.00 1.29 1.28 0.43 0.80 0.37
7 0 0 0 0 0 0 0 0 8.5 500 200 300 45 250 200 75 1 0.40 6.96 0.46 7.20 2.33 5.39 2.69 6.19 0.45
7 0 0 0 0 0 0 0 0 8.5 500 200 300 45 250 200 75 1 0.60 1.08 2.20 0.95 0.24 0.28 0.08 0.35 0.48
7 0 0 0 0 0 0 0 0 8.5 500 200 300 45 250 200 75 1 0.67 2.62 3.66 1.40 0.16 1.25 0.63 0.37 0.82
7 0 0 0 0 0 0 0 0 8.5 500 200 300 45 250 200 75 1 0.53 2.38 1.53 1.85 0.07 1.36 1.44 0.80 0.53
7 0 0 0 0 0 0 0 0 8.5 500 200 300 45 250 200 75 1 0.40 2.98 1.28 2.47 1.24 1.67 1.20 0.69 0.84
7 0 0 0 0 0 0 0 0 8.5 500 200 300 45 250 200 75 1 0.27 3.90 0.88 3.33 2.64 2.32 0.91 1.17 0.52
7 0 0 0 0 0 0 0 0 8.5 500 200 300 45 250 200 75 1 0.60 3.40 5.34 1.00 0.16 1.56 0.14 0.37 0.65
7 0 0 0 0 0 0 0 0 8.5 500 200 300 45 250 200 75 1 0.67 2.88 1.68 1.70 1.24 1.39 1.01 0.37 0.53
7 0 0 0 0 0 0 0 0 8.5 500 200 300 45 250 200 75 1 0.40 3.48 1.22 2.67 1.07 2.81 0.55 2.67 0.51
7 0 0 0 0 0 0 0 0 8.5 500 200 300 45 250 200 75 1 0.53 1.05 1.28 0.93 0.16 0.54 0.29 0.27 0.34
7 0 0 0 0 0 0 0 0 8.5 500 200 300 45 250 200 75 1 0.53 1.88 2.32 1.80 0.91 0.76 0.16 0.91 0.43
7 0 0 0 0 0 0 0 0 8.5 500 200 300 45 250 200 75 1 0.40 2.70 1.46 1.57 0.87 1.45 1.15 0.48 0.46
7 0 0 0 0 0 0 0 0 8.5 500 200 300 45 250 200 75 1 0.53 0.65 0.37 0.17 0.04 0.38 0.24 0.16 0.37
7 0 0 0 0 0 0 0 0 8.5 500 200 300 45 250 200 75 1 0.53 2.42 2.29 1.90 1.04 0.99 0.67 0.69 0.80
7 0 0 0 0 0 0 0 0 8.5 500 200 300 45 250 200 75 1 0.73 0.87 1.30 0.67 0.26 0.28 0.11 0.51 0.56
7 0 0 0 0 0 0 0 0 8.5 500 200 300 45 250 200 75 1 0.40 1.38 2.38 0.82 0.11 0.45 0.19 0.37 1.12

Annexure..
Geoinformatic Modelling for Certain Georesources and Geohazards of
Attur Valley, Tamil Nadu, India.
459
7 0 0 0 0 0 0 0 0 8.5 500 200 300 45 250 200 75 1 0.60 1.70 2.07 0.67 0.24 0.52 0.53 0.35 0.50
7 0 0 0 0 0 0 0 0 8.5 500 200 300 45 250 200 75 1 0.60 0.67 1.05 0.60 0.13 0.14 0.11 0.43 0.60
7 0 0 0 0 0 0 0 0 8.5 500 200 300 45 250 200 75 1 0.53 4.31 3.08 2.27 0.80 2.95 0.91 0.75 0.89
7 0 0 0 0 0 0 0 0 8.5 500 200 300 45 250 200 75 1 0.40 2.26 1.25 2.63 0.62 0.12 1.85 1.01 0.88
7 0 0 0 0 0 0 0 0 8.5 500 200 300 45 250 200 75 1 0.40 13.2 6.25 3.83 1.87 10.8 2.40 0.80 0.56
7 0 0 0 0 0 0 0 0 8.5 500 200 300 45 250 200 75 1 0.60 1.25 0.98 0.85 0.38 0.74 0.29 0.56 0.82
7 0 0 0 0 0 0 0 0 8.5 500 200 300 45 250 200 75 1 0.40 4.55 4.58 2.33 1.62 2.38 0.31 0.75 1.00
7 0 0 0 0 0 0 0 0 8.5 500 200 300 45 250 200 75 1 0.40 1.98 1.46 1.80 0.80 1.14 0.43 0.64 1.00
7 0 0 0 0 0 0 0 0 8.5 500 200 300 45 250 200 75 1 0.53 1.11 2.14 0.77 0.13 0.02 0.60 0.29 0.58
7 0 0 0 0 0 0 0 0 8.5 500 200 300 45 250 200 75 1 0.27 1.40 1.86 0.72 0.62 0.13 0.60 0.00 0.70
7 0 0 0 0 0 0 0 0 8.5 500 200 300 45 250 200 75 1 0.40 1.83 2.07 2.40 0.31 0.36 1.44 1.12 0.68
7 0 0 0 0 0 0 0 0 8.5 500 200 300 45 250 200 75 1 0.40 1.69 2.14 0.92 0.33 0.26 0.99 1.20 0.76
7 0 0 0 0 0 0 0 0 8.5 500 200 300 45 250 200 75 1 0.60 2.86 2.38 3.23 0.24 2.32 0.48 1.65 0.92
7 0 0 0 0 0 0 0 0 8.5 500 200 300 45 250 200 75 1 0.73 0.88 1.05 0.97 0.13 0.50 0.09 0.51 1.01
7 0 0 0 0 0 0 0 0 8.5 500 200 300 45 250 200 75 1 0.47 1.15 1.86 1.17 0.38 0.08 0.55 0.40 0.75
7 0 0 0 0 0 0 0 0 8.5 500 200 300 45 250 200 75 1 0.60 2.05 1.74 2.17 0.87 1.05 0.60 0.37 1.30
7 0 0 0 0 0 0 0 0 8.5 500 200 300 45 250 200 75 1 0.53 2.54 1.10 2.43 0.40 1.83 1.13 0.43 0.82
7 0 0 0 0 0 0 0 0 8.5 500 200 300 45 250 200 75 1 0.80 3.24 2.84 1.43 0.60 1.59 1.01 0.48 0.64
7 0 0 0 0 0 0 0 0 8.5 500 200 300 45 250 200 75 1 0.40 4.20 0.70 2.93 1.64 2.78 1.78 1.07 0.85
7 0 0 0 0 0 0 0 0 8.5 500 200 300 45 250 200 75 1 0.47 3.77 0.70 2.33 1.56 2.38 1.51 1.49 0.68
7 0 0 0 0 0 0 0 0 8.5 500 200 300 45 250 200 75 1 0.53 5.45 0.58 4.40 1.13 3.29 3.79 1.39 0.45
7 0 0 0 0 0 0 0 0 8.5 500 200 300 45 250 200 75 1 0.40 5.77 1.62 2.87 2.64 3.43 1.83 1.71 0.99
7 0 0 0 0 0 0 0 0 8.5 500 200 300 45 250 200 75 1 0.53 2.16 2.07 1.43 0.93 0.47 1.15 0.64 0.64
7 0 0 0 0 0 0 0 0 8.5 500 200 300 45 250 200 75 1 0.60 4.16 1.31 3.60 0.31 3.23 2.09 1.07 0.37
7 0 0 0 0 0 0 0 0 8.5 500 200 300 45 250 200 75 1 0.67 0.97 0.67 1.28 0.27 0.67 0.21 0.45 0.93
7 0 0 0 0 0 0 0 0 8.5 500 200 300 45 250 200 75 1 1.13 0.71 1.34 0.73 0.09 0.26 0.05 0.24 0.54
7 0 0 0 0 0 0 0 0 8.5 500 200 300 45 250 200 75 1 1.00 2.13 1.80 1.13 0.33 1.33 0.41 0.43 0.69
7 0 0 0 0 0 0 0 0 8.5 500 200 300 45 250 200 75 1 1.27 1.43 1.92 0.78 0.02 0.62 0.32 0.16 0.92
7 0 0 0 0 0 0 0 0 8.5 500 200 300 45 250 200 75 1 1.00 1.18 1.34 1.02 0.24 0.60 0.22 0.27 0.98
7 0 0 0 0 0 0 0 0 8.5 500 200 300 45 250 200 75 1 1.20 4.16 2.59 2.07 0.96 2.72 0.84 0.75 0.51
7 0 0 0 0 0 0 0 0 8.5 500 200 300 45 250 200 75 1 0.93 1.30 2.38 1.12 0.18 0.38 0.12 0.21 0.57
7 0 0 0 0 0 0 0 0 8.5 500 200 300 45 250 200 75 1 0.93 1.55 0.73 0.70 0.60 0.91 0.45 0.19 0.09

Annexure..
Geoinformatic Modelling for Certain Georesources and Geohazards of
Attur Valley, Tamil Nadu, India.
460
Wn Wn*Qn100
WQ
I
Ph
Tu
rbid
ity
Td
s
To
t alk
To
t
hard
ness
NO
3
Cl
SO
4
Ca
Fe
F
Su
m o
f W
n
Ph
Td
s
To
t alk
.
To
t h
ard
ness
NO
3
Cl
SO
4
Ca
F
Su
m o
f
Wn
*Qn
100
0.0 0.0 0.0 0.0 0.0 0.0 0.0 0.0 0.0 0.7 0.2 1.0 1.4 0.2 0.5 0.3 0.1 0.2 0.0 0.2 14.3 17.3 16.7
0.0 0.0 0.0 0.0 0.0 0.0 0.0 0.0 0.0 0.7 0.2 1.0 1.4 0.1 0.3 0.0 0.1 0.0 0.0 0.1 11.7 13.7 13.2
0.0 0.0 0.0 0.0 0.0 0.0 0.0 0.0 0.0 0.7 0.2 1.0 0.5 0.1 0.2 0.1 0.0 0.1 0.0 0.4 26.4 27.8 26.8
0.0 0.0 0.0 0.0 0.0 0.0 0.0 0.0 0.0 0.7 0.2 1.0 1.0 0.1 0.1 0.1 0.2 0.1 0.0 0.1 20.5 22.2 21.4
0.0 0.0 0.0 0.0 0.0 0.0 0.0 0.0 0.0 0.7 0.2 1.0 1.6 0.1 0.2 0.1 0.1 0.1 0.1 0.1 19.2 21.4 20.6
0.0 0.0 0.0 0.0 0.0 0.0 0.0 0.0 0.0 0.7 0.2 1.0 1.7 0.1 0.3 0.1 0.1 0.1 0.0 0.1 20.9 23.5 22.7
0.0 0.0 0.0 0.0 0.0 0.0 0.0 0.0 0.0 0.7 0.2 1.0 1.0 0.1 0.1 0.2 0.4 0.1 0.1 0.2 18.1 20.3 19.6
0.0 0.0 0.0 0.0 0.0 0.0 0.0 0.0 0.0 0.7 0.2 1.0 1.9 0.0 0.1 0.0 0.0 0.0 0.0 0.1 18.5 20.6 19.9
0.0 0.0 0.0 0.0 0.0 0.0 0.0 0.0 0.0 0.7 0.2 1.0 1.0 0.2 0.1 0.2 0.2 0.3 0.2 0.4 18.7 21.4 20.6
0.0 0.0 0.0 0.0 0.0 0.0 0.0 0.0 0.0 0.7 0.2 1.0 1.4 0.0 0.2 0.1 0.0 0.0 0.1 0.2 35.2 37.2 35.9
0.0 0.0 0.0 0.0 0.0 0.0 0.0 0.0 0.0 0.7 0.2 1.0 1.7 0.0 0.2 0.1 0.1 0.0 0.0 0.2 22.0 24.4 23.6
0.0 0.0 0.0 0.0 0.0 0.0 0.0 0.0 0.0 0.7 0.2 1.0 1.2 0.1 0.2 0.1 0.1 0.1 0.0 0.2 19.8 21.8 21.0
0.0 0.0 0.0 0.0 0.0 0.0 0.0 0.0 0.0 0.7 0.2 1.0 1.0 0.1 0.1 0.2 0.3 0.2 0.0 0.3 30.8 33.0 31.9
0.0 0.0 0.0 0.0 0.0 0.0 0.0 0.0 0.0 0.7 0.2 1.0 1.4 0.1 0.1 0.3 0.6 0.3 0.0 0.6 11.7 15.1 14.6
0.0 0.0 0.0 0.0 0.0 0.0 0.0 0.0 0.0 0.7 0.2 1.0 0.9 0.1 0.3 0.1 0.2 0.1 0.2 0.3 15.4 17.6 17.0
0.0 0.0 0.0 0.0 0.0 0.0 0.0 0.0 0.0 0.7 0.2 1.0 0.7 0.1 0.3 0.2 0.2 0.1 0.1 0.4 18.3 20.4 19.7
0.0 0.0 0.0 0.0 0.0 0.0 0.0 0.0 0.0 0.7 0.2 1.0 1.2 0.1 0.3 0.1 0.2 0.1 0.1 0.3 4.4 6.7 6.5
0.0 0.0 0.0 0.0 0.0 0.0 0.0 0.0 0.0 0.7 0.2 1.0 0.7 0.1 0.2 0.1 0.3 0.1 0.1 0.5 4.4 6.4 6.2
0.0 0.0 0.0 0.0 0.0 0.0 0.0 0.0 0.0 0.7 0.2 1.0 0.9 0.1 0.2 0.1 0.1 0.1 0.1 0.2 4.2 5.8 5.6

Annexure..
Geoinformatic Modelling for Certain Georesources and Geohazards of
Attur Valley, Tamil Nadu, India.
461
0.0 0.0 0.0 0.0 0.0 0.0 0.0 0.0 0.0 0.7 0.2 1.0 0.9 0.1 0.2 0.1 0.1 0.0 0.0 0.1 0.9 2.4 2.3
0.0 0.0 0.0 0.0 0.0 0.0 0.0 0.0 0.0 0.7 0.2 1.0 1.6 0.1 0.4 0.1 0.2 0.0 0.1 0.3 1.8 4.6 4.5
0.0 0.0 0.0 0.0 0.0 0.0 0.0 0.0 0.0 0.7 0.2 1.0 0.7 0.1 0.2 0.1 0.2 0.1 0.0 0.6 0.2 2.2 2.1
0.0 0.0 0.0 0.0 0.0 0.0 0.0 0.0 0.0 0.7 0.2 1.0 1.4 0.1 0.2 0.1 0.0 0.1 0.0 0.2 21.6 23.7 22.8
0.0 0.0 0.0 0.0 0.0 0.0 0.0 0.0 0.0 0.7 0.2 1.0 1.6 0.0 0.1 0.0 0.0 0.0 0.0 0.1 19.2 21.1 20.3
0.0 0.0 0.0 0.0 0.0 0.0 0.0 0.0 0.0 0.7 0.2 1.0 1.4 0.0 0.1 0.1 0.1 0.0 0.0 0.2 16.1 18.0 17.4
0.0 0.0 0.0 0.0 0.0 0.0 0.0 0.0 0.0 0.7 0.2 1.0 1.4 0.2 0.3 0.2 0.8 0.2 0.1 0.2 16.3 19.6 18.9
0.0 0.0 0.0 0.0 0.0 0.0 0.0 0.0 0.0 0.7 0.2 1.0 1.7 0.1 0.3 0.2 0.1 0.1 0.0 0.1 18.5 21.1 20.4
0.0 0.0 0.0 0.0 0.0 0.0 0.0 0.0 0.0 0.7 0.2 1.0 1.9 0.0 0.1 0.0 0.1 0.0 0.0 0.1 19.6 21.9 21.1
0.0 0.0 0.0 0.0 0.0 0.0 0.0 0.0 0.0 0.7 0.2 1.0 1.0 0.1 0.3 0.2 0.1 0.1 0.1 0.6 30.8 33.4 32.2
0.0 0.0 0.0 0.0 0.0 0.0 0.0 0.0 0.0 0.7 0.2 1.0 1.2 0.1 0.2 0.1 0.3 0.1 0.0 0.3 7.0 9.3 9.0
0.0 0.0 0.0 0.0 0.0 0.0 0.0 0.0 0.0 0.7 0.2 1.0 1.4 0.1 0.3 0.2 0.2 0.1 0.1 0.4 26.4 29.3 28.3
0.0 0.0 0.0 0.0 0.0 0.0 0.0 0.0 0.0 0.7 0.2 1.0 1.7 0.2 0.4 0.1 0.1 0.2 0.1 0.2 2.4 5.5 5.3
0.0 0.0 0.0 0.0 0.0 0.0 0.0 0.0 0.0 0.7 0.2 1.0 1.7 0.1 0.2 0.2 0.1 0.1 0.1 0.4 0.4 3.3 3.2
0.0 0.0 0.0 0.0 0.0 0.0 0.0 0.0 0.0 0.7 0.2 1.0 1.7 0.1 0.2 0.1 0.4 0.1 0.1 0.4 0.4 3.7 3.5
0.0 0.0 0.0 0.0 0.0 0.0 0.0 0.0 0.0 0.7 0.2 1.0 1.9 0.1 0.3 0.1 0.2 0.1 0.1 0.2 0.4 3.4 3.3
0.0 0.0 0.0 0.0 0.0 0.0 0.0 0.0 0.0 0.7 0.2 1.0 1.6 0.0 0.2 0.1 0.0 0.0 0.0 0.1 20.5 22.4 21.7
0.0 0.0 0.0 0.0 0.0 0.0 0.0 0.0 0.0 0.7 0.2 1.0 1.6 0.2 0.7 0.2 0.0 0.3 0.0 0.2 17.2 20.4 19.7
0.0 0.0 0.0 0.0 0.0 0.0 0.0 0.0 0.0 0.7 0.2 1.0 2.1 0.1 0.4 0.1 0.3 0.0 0.0 0.1 18.5 21.6 20.9
0.0 0.0 0.0 0.0 0.0 0.0 0.0 0.0 0.0 0.7 0.2 1.0 1.0 0.1 0.2 0.1 0.0 0.1 0.3 0.2 14.7 16.9 16.3
0.0 0.0 0.0 0.0 0.0 0.0 0.0 0.0 0.0 0.7 0.2 1.0 1.4 0.1 0.2 0.1 0.2 0.0 0.0 0.1 13.9 16.0 15.5
0.0 0.0 0.0 0.0 0.0 0.0 0.0 0.0 0.0 0.7 0.2 1.0 1.6 0.2 0.4 0.2 0.6 0.2 0.1 0.2 20.3 23.6 22.8
0.0 0.0 0.0 0.0 0.0 0.0 0.0 0.0 0.0 0.7 0.2 1.0 2.1 0.1 0.4 0.0 0.2 0.1 0.0 0.0 16.1 19.1 18.4
0.0 0.0 0.0 0.0 0.0 0.0 0.0 0.0 0.0 0.7 0.2 1.0 2.8 0.1 0.2 0.1 0.1 0.0 0.0 0.1 24.2 27.6 26.7
0.0 0.0 0.0 0.0 0.0 0.0 0.0 0.0 0.0 0.7 0.2 1.0 2.2 0.0 0.1 0.1 0.0 0.0 0.0 0.0 11.9 14.4 13.9

Annexure..
Geoinformatic Modelling for Certain Georesources and Geohazards of
Attur Valley, Tamil Nadu, India.
462
0.0 0.0 0.0 0.0 0.0 0.0 0.0 0.0 0.0 0.7 0.2 1.0 1.4 0.1 0.2 0.2 0.2 0.1 0.2 0.2 17.2 19.6 19.0
0.0 0.0 0.0 0.0 0.0 0.0 0.0 0.0 0.0 0.7 0.2 1.0 1.6 0.1 0.4 0.1 0.1 0.0 0.0 0.1 19.6 22.0 21.2
0.0 0.0 0.0 0.0 0.0 0.0 0.0 0.0 0.0 0.7 0.2 1.0 2.2 0.1 0.3 0.1 0.1 0.1 0.1 0.2 11.2 14.6 14.1
0.0 0.0 0.0 0.0 0.0 0.0 0.0 0.0 0.0 0.7 0.2 1.0 1.0 0.1 0.2 0.1 0.3 0.1 0.0 0.3 4.4 6.5 6.3
0.0 0.0 0.0 0.0 0.0 0.0 0.0 0.0 0.0 0.7 0.2 1.0 2.1 0.1 0.2 0.1 0.2 0.1 0.1 0.2 14.5 17.6 17.0
0.0 0.0 0.0 0.0 0.0 0.0 0.0 0.0 0.0 0.7 0.2 1.0 2.1 0.1 0.2 0.1 0.1 0.0 0.0 0.2 9.5 12.3 11.9
0.0 0.0 0.0 0.0 0.0 0.0 0.0 0.0 0.0 0.7 0.2 1.0 2.2 0.1 0.3 0.2 0.8 0.1 0.1 0.2 15.2 19.2 18.5
0.0 0.0 0.0 0.0 0.0 0.0 0.0 0.0 0.0 0.7 0.2 1.0 2.2 0.1 0.2 0.1 0.0 0.1 0.1 0.3 21.4 24.6 23.7
0.0 0.0 0.0 0.0 0.0 0.0 0.0 0.0 0.0 0.7 0.2 1.0 1.0 0.2 0.6 0.2 0.2 0.2 0.1 0.4 20.3 23.1 22.3
0.0 0.0 0.0 0.0 0.0 0.0 0.0 0.0 0.0 0.7 0.2 1.0 1.0 0.1 0.3 0.2 0.2 0.1 0.1 0.4 15.2 17.7 17.1
0.0 0.0 0.0 0.0 0.0 0.0 0.0 0.0 0.0 0.7 0.2 1.0 1.6 0.0 0.1 0.1 0.2 0.0 0.0 0.1 11.9 14.1 13.6
0.0 0.0 0.0 0.0 0.0 0.0 0.0 0.0 0.0 0.7 0.2 1.0 1.0 0.1 0.2 0.2 0.3 0.3 0.0 0.8 18.1 21.0 20.3
0.0 0.0 0.0 0.0 0.0 0.0 0.0 0.0 0.0 0.7 0.2 1.0 1.0 0.1 0.2 0.1 0.4 0.0 0.0 0.2 14.3 16.4 15.8
0.0 0.0 0.0 0.0 0.0 0.0 0.0 0.0 0.0 0.7 0.2 1.0 1.6 0.1 0.2 0.1 0.8 0.1 0.0 0.1 14.1 17.1 16.5
0.0 0.0 0.0 0.0 0.0 0.0 0.0 0.0 0.0 0.7 0.2 1.0 2.1 0.1 0.3 0.1 0.2 0.1 0.1 0.3 1.3 4.7 4.5
0.0 0.0 0.0 0.0 0.0 0.0 0.0 0.0 0.0 0.7 0.2 1.0 2.4 0.2 0.4 0.1 0.4 0.2 0.1 0.2 19.4 23.3 22.5
0.0 0.0 0.0 0.0 0.0 0.0 0.0 0.0 0.0 0.7 0.2 1.0 1.7 0.1 0.2 0.1 0.2 0.1 0.0 0.4 2.2 5.1 4.9
0.0 0.0 0.0 0.0 0.0 0.0 0.0 0.0 0.0 0.7 0.2 1.0 2.6 0.0 0.1 0.1 0.2 0.1 0.0 0.2 7.3 10.5 10.2
0.0 0.0 0.0 0.0 0.0 0.0 0.0 0.0 0.0 0.7 0.2 1.0 2.6 0.1 0.2 0.1 0.4 0.1 0.1 0.2 2.2 5.9 5.7
0.0 0.0 0.0 0.0 0.0 0.0 0.0 0.0 0.0 0.7 0.2 1.0 2.4 0.1 0.2 0.1 0.2 0.0 0.0 0.1 33.5 36.5 35.3
0.0 0.0 0.0 0.0 0.0 0.0 0.0 0.0 0.0 0.7 0.2 1.0 2.2 0.1 0.2 0.1 0.2 0.1 0.0 0.1 15.0 18.0 17.4
0.0 0.0 0.0 0.0 0.0 0.0 0.0 0.0 0.0 0.7 0.2 1.0 1.9 0.1 0.2 0.1 0.3 0.0 0.0 0.1 5.3 8.0 7.7
0.0 0.0 0.0 0.0 0.0 0.0 0.0 0.0 0.0 0.7 0.2 1.0 2.2 0.0 0.2 0.1 0.1 0.0 0.0 0.1 4.2 6.9 6.7
0.0 0.0 0.0 0.0 0.0 0.0 0.0 0.0 0.0 0.7 0.2 1.0 2.2 0.1 0.4 0.1 0.3 0.1 0.1 0.2 22.5 26.0 25.1
0.0 0.0 0.0 0.0 0.0 0.0 0.0 0.0 0.0 0.7 0.2 1.0 2.4 0.1 0.2 0.1 0.2 0.0 0.0 0.1 0.9 4.1 3.9

Annexure..
Geoinformatic Modelling for Certain Georesources and Geohazards of
Attur Valley, Tamil Nadu, India.
463
0.0 0.0 0.0 0.0 0.0 0.0 0.0 0.0 0.0 0.7 0.2 1.0 2.2 0.1 0.4 0.1 0.2 0.0 0.1 0.1 26.2 29.4 28.4
0.0 0.0 0.0 0.0 0.0 0.0 0.0 0.0 0.0 0.7 0.2 1.0 1.9 0.0 0.1 0.1 0.1 0.1 0.0 0.2 7.0 9.6 9.2
0.0 0.0 0.0 0.0 0.0 0.0 0.0 0.0 0.0 0.7 0.2 1.0 2.8 0.0 0.2 0.0 0.0 0.0 0.0 0.1 8.1 11.2 10.8
0.0 0.0 0.0 0.0 0.0 0.0 0.0 0.0 0.0 0.7 0.2 1.0 2.9 0.1 0.3 0.0 0.2 0.0 0.0 0.1 26.6 30.2 29.1
0.0 0.0 0.0 0.0 0.0 0.0 0.0 0.0 0.0 0.7 0.2 1.0 2.1 0.3 0.2 0.2 0.0 0.5 0.3 0.3 19.2 23.0 22.2
0.0 0.0 0.0 0.0 0.0 0.0 0.0 0.0 0.0 0.7 0.2 1.0 1.9 0.1 0.2 0.1 0.1 0.1 0.1 0.2 13.6 16.5 16.0
0.0 0.0 0.0 0.0 0.0 0.0 0.0 0.0 0.0 0.7 0.2 1.0 1.9 0.0 0.2 0.1 0.0 0.0 0.0 0.1 8.4 10.8 10.4
0.0 0.0 0.0 0.0 0.0 0.0 0.0 0.0 0.0 0.7 0.2 1.0 1.2 0.1 0.3 0.0 0.5 0.1 0.0 0.1 6.4 8.7 8.4
0.0 0.0 0.0 0.0 0.0 0.0 0.0 0.0 0.0 0.7 0.2 1.0 2.4 0.0 0.2 0.1 0.0 0.0 0.0 0.2 21.1 24.1 23.2
0.0 0.0 0.0 0.0 0.0 0.0 0.0 0.0 0.0 0.7 0.2 1.0 2.2 0.1 0.2 0.1 0.0 0.1 0.1 0.2 11.4 14.3 13.8
0.0 0.0 0.0 0.0 0.0 0.0 0.0 0.0 0.0 0.7 0.2 1.0 1.9 0.1 0.2 0.1 0.3 0.1 0.1 0.1 9.2 12.1 11.7
0.0 0.0 0.0 0.0 0.0 0.0 0.0 0.0 0.0 0.7 0.2 1.0 2.8 0.0 0.1 0.0 0.0 0.0 0.0 0.1 7.9 11.1 10.7
0.0 0.0 0.0 0.0 0.0 0.0 0.0 0.0 0.0 0.7 0.2 1.0 1.0 0.1 0.2 0.1 0.5 0.1 0.1 0.2 5.1 7.5 7.2
0.0 0.0 0.0 0.0 0.0 0.0 0.0 0.0 0.0 0.7 0.2 1.0 1.7 0.1 0.2 0.1 0.2 0.1 0.1 0.3 11.4 14.2 13.7
0.0 0.0 0.0 0.0 0.0 0.0 0.0 0.0 0.0 0.7 0.2 1.0 1.9 0.0 0.1 0.1 0.1 0.0 0.0 0.1 26.4 28.8 27.8
0.0 0.0 0.0 0.0 0.0 0.0 0.0 0.0 0.0 0.7 0.2 1.0 1.6 0.1 0.3 0.1 0.1 0.1 0.1 0.1 19.8 22.4 21.6
0.0 0.0 0.0 0.0 0.0 0.0 0.0 0.0 0.0 0.7 0.2 1.0 1.6 0.1 0.3 0.1 0.1 0.0 0.0 0.3 9.5 12.0 11.6
0.0 0.0 0.0 0.0 0.0 0.0 0.0 0.0 0.0 0.7 0.2 1.0 0.7 0.1 0.3 0.1 0.0 0.1 0.0 0.4 21.6 23.4 22.6
0.0 0.0 0.0 0.0 0.0 0.0 0.0 0.0 0.0 0.7 0.2 1.0 2.1 0.0 0.1 0.1 0.1 0.0 0.0 0.2 6.4 9.1 8.7
0.0 0.0 0.0 0.0 0.0 0.0 0.0 0.0 0.0 0.7 0.2 1.0 1.7 0.1 0.2 0.2 0.5 0.1 0.1 0.4 18.7 21.9 21.2
0.0 0.0 0.0 0.0 0.0 0.0 0.0 0.0 0.0 0.7 0.2 1.0 1.9 0.1 0.3 0.1 0.3 0.1 0.1 0.1 4.4 7.3 7.1
0.0 0.0 0.0 0.0 0.0 0.0 0.0 0.0 0.0 0.7 0.2 1.0 1.6 0.1 0.3 0.2 0.6 0.1 0.1 0.4 27.5 31.0 29.9
0.0 0.0 0.0 0.0 0.0 0.0 0.0 0.0 0.0 0.7 0.2 1.0 1.7 0.1 0.3 0.0 0.0 0.0 0.0 0.1 24.2 26.5 25.6
0.0 0.0 0.0 0.0 0.0 0.0 0.0 0.0 0.0 0.7 0.2 1.0 2.2 0.1 0.3 0.1 0.1 0.1 0.1 0.1 12.3 15.3 14.8
0.0 0.0 0.0 0.0 0.0 0.0 0.0 0.0 0.0 0.7 0.2 1.0 1.6 0.1 0.2 0.1 0.4 0.1 0.1 0.2 8.4 11.1 10.7

Annexure..
Geoinformatic Modelling for Certain Georesources and Geohazards of
Attur Valley, Tamil Nadu, India.
464
0.0 0.0 0.0 0.0 0.0 0.0 0.0 0.0 0.0 0.7 0.2 1.0 2.1 0.1 0.2 0.1 0.4 0.1 0.0 0.1 8.6 11.7 11.3
0.0 0.0 0.0 0.0 0.0 0.0 0.0 0.0 0.0 0.7 0.2 1.0 1.7 0.1 0.2 0.1 0.4 0.1 0.1 0.0 13.9 16.5 16.0
0.0 0.0 0.0 0.0 0.0 0.0 0.0 0.0 0.0 0.7 0.2 1.0 1.0 0.1 0.3 0.3 0.2 0.1 0.1 0.3 17.0 19.5 18.8
0.0 0.0 0.0 0.0 0.0 0.0 0.0 0.0 0.0 0.7 0.2 1.0 1.2 0.1 0.3 0.1 0.1 0.0 0.0 0.1 14.1 16.2 15.6
0.0 0.0 0.0 0.0 0.0 0.0 0.0 0.0 0.0 0.7 0.2 1.0 1.4 0.2 0.3 0.2 0.8 0.1 0.3 0.2 20.3 23.7 22.9
0.0 0.0 0.0 0.0 0.0 0.0 0.0 0.0 0.0 0.7 0.2 1.0 1.6 0.1 0.2 0.2 1.1 0.1 0.1 0.3 14.3 18.0 17.4
0.0 0.0 0.0 0.0 0.0 0.0 0.0 0.0 0.0 0.7 0.2 1.0 0.7 0.4 0.1 0.5 1.4 0.6 0.2 0.7 21.1 25.7 24.8
0.0 0.0 0.0 0.0 0.0 0.0 0.0 0.0 0.0 0.7 0.2 1.0 1.6 0.1 0.3 0.2 0.2 0.2 0.1 0.1 14.7 17.5 16.9
0.0 0.0 0.0 0.0 0.0 0.0 0.0 0.0 0.0 0.7 0.2 1.0 1.4 0.1 0.2 0.1 0.6 0.1 0.0 0.2 8.1 11.0 10.6
0.0 0.0 0.0 0.0 0.0 0.0 0.0 0.0 0.0 0.7 0.2 1.0 1.0 0.3 0.1 0.5 1.1 0.5 0.3 1.8 9.9 15.6 15.0
0.0 0.0 0.0 0.0 0.0 0.0 0.0 0.0 0.0 0.7 0.2 1.0 1.6 0.0 0.2 0.1 0.1 0.0 0.0 0.1 10.6 12.7 12.3
0.0 0.0 0.0 0.0 0.0 0.0 0.0 0.0 0.0 0.7 0.2 1.0 1.7 0.1 0.4 0.1 0.1 0.1 0.1 0.1 18.1 20.8 20.0
0.0 0.0 0.0 0.0 0.0 0.0 0.0 0.0 0.0 0.7 0.2 1.0 1.4 0.1 0.2 0.1 0.0 0.1 0.2 0.2 11.7 14.0 13.5
0.0 0.0 0.0 0.0 0.0 0.0 0.0 0.0 0.0 0.7 0.2 1.0 1.0 0.1 0.1 0.2 0.6 0.1 0.1 0.2 18.5 21.1 20.3
0.0 0.0 0.0 0.0 0.0 0.0 0.0 0.0 0.0 0.7 0.2 1.0 0.7 0.2 0.1 0.2 1.3 0.2 0.1 0.3 11.4 14.6 14.1
0.0 0.0 0.0 0.0 0.0 0.0 0.0 0.0 0.0 0.7 0.2 1.0 1.6 0.1 0.6 0.1 0.1 0.1 0.0 0.1 14.3 17.0 16.4
0.0 0.0 0.0 0.0 0.0 0.0 0.0 0.0 0.0 0.7 0.2 1.0 1.7 0.1 0.2 0.1 0.6 0.1 0.1 0.1 11.7 14.8 14.3
0.0 0.0 0.0 0.0 0.0 0.0 0.0 0.0 0.0 0.7 0.2 1.0 1.0 0.2 0.1 0.2 0.5 0.2 0.1 0.8 11.2 14.4 13.9
0.0 0.0 0.0 0.0 0.0 0.0 0.0 0.0 0.0 0.7 0.2 1.0 1.4 0.0 0.1 0.1 0.1 0.0 0.0 0.1 7.5 9.4 9.0
0.0 0.0 0.0 0.0 0.0 0.0 0.0 0.0 0.0 0.7 0.2 1.0 1.4 0.1 0.3 0.1 0.4 0.1 0.0 0.3 9.5 12.1 11.7
0.0 0.0 0.0 0.0 0.0 0.0 0.0 0.0 0.0 0.7 0.2 1.0 1.0 0.1 0.2 0.1 0.4 0.1 0.1 0.1 10.1 12.4 11.9
0.0 0.0 0.0 0.0 0.0 0.0 0.0 0.0 0.0 0.7 0.2 1.0 1.4 0.0 0.0 0.0 0.0 0.0 0.0 0.0 8.1 9.7 9.4
0.0 0.0 0.0 0.0 0.0 0.0 0.0 0.0 0.0 0.7 0.2 1.0 1.4 0.1 0.3 0.1 0.5 0.1 0.1 0.2 17.6 20.4 19.7
0.0 0.0 0.0 0.0 0.0 0.0 0.0 0.0 0.0 0.7 0.2 1.0 1.9 0.0 0.1 0.0 0.1 0.0 0.0 0.1 12.3 14.8 14.3
0.0 0.0 0.0 0.0 0.0 0.0 0.0 0.0 0.0 0.7 0.2 1.0 1.0 0.1 0.3 0.1 0.1 0.0 0.0 0.1 24.7 26.3 25.4

Annexure..
Geoinformatic Modelling for Certain Georesources and Geohazards of
Attur Valley, Tamil Nadu, India.
465
0.0 0.0 0.0 0.0 0.0 0.0 0.0 0.0 0.0 0.7 0.2 1.0 1.6 0.1 0.2 0.0 0.1 0.0 0.1 0.1 11.0 13.2 12.8
0.0 0.0 0.0 0.0 0.0 0.0 0.0 0.0 0.0 0.7 0.2 1.0 1.6 0.0 0.1 0.0 0.1 0.0 0.0 0.1 13.2 15.2 14.6
0.0 0.0 0.0 0.0 0.0 0.0 0.0 0.0 0.0 0.7 0.2 1.0 1.4 0.2 0.3 0.2 0.4 0.3 0.1 0.2 19.6 22.6 21.9
0.0 0.0 0.0 0.0 0.0 0.0 0.0 0.0 0.0 0.7 0.2 1.0 1.0 0.1 0.1 0.2 0.3 0.0 0.2 0.3 19.4 21.7 20.9
0.0 0.0 0.0 0.0 0.0 0.0 0.0 0.0 0.0 0.7 0.2 1.0 1.0 0.6 0.7 0.3 0.9 0.9 0.3 0.2 12.3 17.3 16.7
0.0 0.0 0.0 0.0 0.0 0.0 0.0 0.0 0.0 0.7 0.2 1.0 1.6 0.1 0.1 0.1 0.2 0.1 0.0 0.2 18.1 20.3 19.6
0.0 0.0 0.0 0.0 0.0 0.0 0.0 0.0 0.0 0.7 0.2 1.0 1.0 0.2 0.5 0.2 0.8 0.2 0.0 0.2 22.0 25.2 24.3
0.0 0.0 0.0 0.0 0.0 0.0 0.0 0.0 0.0 0.7 0.2 1.0 1.0 0.1 0.2 0.1 0.4 0.1 0.0 0.2 22.0 24.2 23.3
0.0 0.0 0.0 0.0 0.0 0.0 0.0 0.0 0.0 0.7 0.2 1.0 1.4 0.0 0.2 0.1 0.1 0.0 0.1 0.1 12.8 14.7 14.2
0.0 0.0 0.0 0.0 0.0 0.0 0.0 0.0 0.0 0.7 0.2 1.0 0.7 0.1 0.2 0.1 0.3 0.0 0.1 0.0 15.4 16.8 16.2
0.0 0.0 0.0 0.0 0.0 0.0 0.0 0.0 0.0 0.7 0.2 1.0 1.0 0.1 0.2 0.2 0.2 0.0 0.2 0.3 15.0 17.2 16.6
0.0 0.0 0.0 0.0 0.0 0.0 0.0 0.0 0.0 0.7 0.2 1.0 1.0 0.1 0.2 0.1 0.2 0.0 0.1 0.4 16.7 18.8 18.1
0.0 0.0 0.0 0.0 0.0 0.0 0.0 0.0 0.0 0.7 0.2 1.0 1.6 0.1 0.3 0.2 0.1 0.2 0.1 0.5 20.3 23.3 22.5
0.0 0.0 0.0 0.0 0.0 0.0 0.0 0.0 0.0 0.7 0.2 1.0 1.9 0.0 0.1 0.1 0.1 0.0 0.0 0.1 22.2 24.6 23.8
0.0 0.0 0.0 0.0 0.0 0.0 0.0 0.0 0.0 0.7 0.2 1.0 1.2 0.1 0.2 0.1 0.2 0.0 0.1 0.1 16.5 18.4 17.8
0.0 0.0 0.0 0.0 0.0 0.0 0.0 0.0 0.0 0.7 0.2 1.0 1.6 0.1 0.2 0.2 0.4 0.1 0.1 0.1 28.6 31.3 30.2
0.0 0.0 0.0 0.0 0.0 0.0 0.0 0.0 0.0 0.7 0.2 1.0 1.4 0.1 0.1 0.2 0.2 0.2 0.1 0.1 18.1 20.5 19.7
0.0 0.0 0.0 0.0 0.0 0.0 0.0 0.0 0.0 0.7 0.2 1.0 2.1 0.1 0.3 0.1 0.3 0.1 0.1 0.1 14.1 17.4 16.8
0.0 0.0 0.0 0.0 0.0 0.0 0.0 0.0 0.0 0.7 0.2 1.0 1.0 0.2 0.1 0.2 0.8 0.2 0.2 0.3 18.7 21.8 21.0
0.0 0.0 0.0 0.0 0.0 0.0 0.0 0.0 0.0 0.7 0.2 1.0 1.2 0.2 0.1 0.2 0.8 0.2 0.2 0.4 15.0 18.2 17.5
0.0 0.0 0.0 0.0 0.0 0.0 0.0 0.0 0.0 0.7 0.2 1.0 1.4 0.2 0.1 0.3 0.6 0.3 0.4 0.4 9.9 13.6 13.1
0.0 0.0 0.0 0.0 0.0 0.0 0.0 0.0 0.0 0.7 0.2 1.0 1.0 0.3 0.2 0.2 1.3 0.3 0.2 0.5 21.8 25.8 24.9
0.0 0.0 0.0 0.0 0.0 0.0 0.0 0.0 0.0 0.7 0.2 1.0 1.4 0.1 0.2 0.1 0.5 0.0 0.1 0.2 14.1 16.7 16.1
0.0 0.0 0.0 0.0 0.0 0.0 0.0 0.0 0.0 0.7 0.2 1.0 1.6 0.2 0.1 0.3 0.2 0.3 0.2 0.3 8.1 11.3 10.9
0.0 0.0 0.0 0.0 0.0 0.0 0.0 0.0 0.0 0.7 0.2 1.0 1.7 0.0 0.1 0.1 0.1 0.1 0.0 0.1 20.5 22.8 22.0

Annexure..
Geoinformatic Modelling for Certain Georesources and Geohazards of
Attur Valley, Tamil Nadu, India.
466
0.0 0.0 0.0 0.0 0.0 0.0 0.0 0.0 0.0 0.7 0.2 1.0 2.9 0.0 0.1 0.1 0.0 0.0 0.0 0.1 11.9 15.2 14.7
0.0 0.0 0.0 0.0 0.0 0.0 0.0 0.0 0.0 0.7 0.2 1.0 2.6 0.1 0.2 0.1 0.2 0.1 0.0 0.1 15.2 18.6 18.0
0.0 0.0 0.0 0.0 0.0 0.0 0.0 0.0 0.0 0.7 0.2 1.0 3.3 0.1 0.2 0.1 0.0 0.1 0.0 0.0 20.3 24.0 23.2
0.0 0.0 0.0 0.0 0.0 0.0 0.0 0.0 0.0 0.7 0.2 1.0 2.6 0.1 0.1 0.1 0.1 0.1 0.0 0.1 21.6 24.7 23.9
0.0 0.0 0.0 0.0 0.0 0.0 0.0 0.0 0.0 0.7 0.2 1.0 3.1 0.2 0.3 0.2 0.5 0.2 0.1 0.2 11.2 16.0 15.4
0.0 0.0 0.0 0.0 0.0 0.0 0.0 0.0 0.0 0.7 0.2 1.0 2.4 0.1 0.3 0.1 0.1 0.0 0.0 0.1 12.5 15.6 15.0
0.0 0.0 0.0 0.0 0.0 0.0 0.0 0.0 0.0 0.7 0.2 1.0 2.4 0.1 0.1 0.1 0.3 0.1 0.0 0.1 2.0 5.1 4.9
Calculation of Water Quality Index – Post Monsoon - 2007 Annexure – IIIB
Vid Sn Qn
Ph
Td
s
To
t alk
To
t h
ard
ness
NO
3
Cl
SO
4
Ca
F
Ph
Td
s
To
t alk
To
t
hard
ness
NO
3
Cl
SO
4
Ca
F
Ph
Td
s
To
t alk
To
t
hard
ness
NO
3
Cl
SO
4
Ca
F
7 0 0 0 0 0 0 0 0 8.5 500 200 300 45 250 200 75 1 0.93 1.03 1.49 1.02 0.40 0.40 0.08 0.21 0.65
7 0 0 0 0 0 0 0 0 8.5 500 200 300 45 250 200 75 1 0.60 1.64 1.28 1.57 0.40 0.76 0.77 0.93 0.63
7 0 0 0 0 0 0 0 0 8.5 500 200 300 45 250 200 75 1 0.47 2.00 2.26 1.33 0.22 1.14 0.43 0.64 0.40
7 0 0 0 0 0 0 0 0 8.5 500 200 300 45 250 200 75 1 0.40 3.78 2.05 3.93 0.91 2.47 1.32 4.48 0.04
7 0 0 0 0 0 0 0 0 8.5 500 200 300 45 250 200 75 1 0.47 1.58 2.26 1.35 0.20 0.70 0.32 1.39 1.37
7 0 0 0 0 0 0 0 0 8.5 500 200 300 45 250 200 75 1 0.47 1.62 2.07 0.90 0.38 0.86 0.09 0.45 0.80
7 0 0 0 0 0 0 0 0 8.5 500 200 300 45 250 200 75 1 0.33 3.27 2.23 2.50 0.62 1.98 1.27 1.01 0.70
7 0 0 0 0 0 0 0 0 8.5 500 200 300 45 250 200 75 1 0.40 5.52 2.65 2.67 2.24 1.10 4.61 0.53 0.42
7 0 0 0 0 0 0 0 0 8.5 500 200 300 45 250 200 75 1 0.80 1.92 2.04 1.58 0.84 1.18 0.29 0.80 0.32
7 0 0 0 0 0 0 0 0 8.5 500 200 300 45 250 200 75 1 0.33 1.81 2.29 1.37 0.09 0.94 0.48 0.53 1.00

Annexure..
Geoinformatic Modelling for Certain Georesources and Geohazards of
Attur Valley, Tamil Nadu, India.
467
7 0 0 0 0 0 0 0 0 8.5 500 200 300 45 250 200 75 1 0.67 3.05 1.40 2.37 1.40 1.36 1.68 0.21 0.60
7 0 0 0 0 0 0 0 0 8.5 500 200 300 45 250 200 75 1 0.73 1.44 1.34 1.83 0.27 0.68 0.72 0.80 1.00
7 0 0 0 0 0 0 0 0 8.5 500 200 300 45 250 200 75 1 0.80 0.66 0.62 0.62 0.33 0.20 0.22 0.05 0.90
7 0 0 0 0 0 0 0 0 8.5 500 200 300 45 250 200 75 1 0.67 1.17 0.64 1.10 0.11 0.98 0.36 0.59 0.40
7 0 0 0 0 0 0 0 0 8.5 500 200 300 45 250 200 75 1 0.27 2.11 2.20 1.07 0.78 0.85 0.23 0.96 0.30
7 0 0 0 0 0 0 0 0 8.5 500 200 300 45 250 200 75 1 0.53 2.97 1.77 2.40 0.07 2.21 1.27 0.80 0.65
7 0 0 0 0 0 0 0 0 8.5 500 200 300 45 250 200 75 1 1.07 1.03 1.83 0.60 0.06 0.30 0.16 0.35 1.10
7 0 0 0 0 0 0 0 0 8.5 500 200 300 45 250 200 75 1 0.73 6.07 1.28 2.80 2.02 4.26 2.23 0.53 1.00
7 0 0 0 0 0 0 0 0 8.5 500 200 300 45 250 200 75 1 0.80 1.89 2.44 1.00 1.09 0.85 0.22 0.53 0.26
7 0 0 0 0 0 0 0 0 8.5 500 200 300 45 250 200 75 1 0.80 4.22 3.93 1.73 0.09 0.17 0.48 0.43 1.00
7 0 0 0 0 0 0 0 0 8.5 500 200 300 45 250 200 75 1 0.60 3.04 1.80 2.00 1.76 1.05 1.01 1.23 0.50
7 0 0 0 0 0 0 0 0 8.5 500 200 300 45 250 200 75 1 0.47 2.48 2.29 1.37 0.80 0.91 0.95 0.69 0.25
7 0 0 0 0 0 0 0 0 8.5 500 200 300 45 250 200 75 1 0.87 2.43 1.52 2.73 0.93 1.25 1.47 1.12 0.77
7 0 0 0 0 0 0 0 0 8.5 500 200 300 45 250 200 75 1 0.47 1.77 2.41 1.07 0.49 0.54 0.50 0.91 0.90
7 0 0 0 0 0 0 0 0 8.5 500 200 300 45 250 200 75 1 0.40 3.30 1.37 2.47 3.09 2.21 1.15 0.64 0.80
7 0 0 0 0 0 0 0 0 8.5 500 200 300 45 250 200 75 1 0.53 2.03 2.44 1.73 0.49 1.02 0.39 0.75 0.70
7 0 0 0 0 0 0 0 0 8.5 500 200 300 45 250 200 75 1 0.53 1.46 2.38 1.50 0.09 0.71 0.18 1.41 0.71
7 0 0 0 0 0 0 0 0 8.5 500 200 300 45 250 200 75 1 1.20 2.14 2.13 1.67 2.08 0.82 0.58 0.53 0.25
7 0 0 0 0 0 0 0 0 8.5 500 200 300 45 250 200 75 1 0.47 0.56 0.57 0.63 0.04 0.18 0.29 0.72 0.30
7 0 0 0 0 0 0 0 0 8.5 500 200 300 45 250 200 75 1 0.40 1.75 3.14 0.80 0.31 0.51 0.16 0.75 1.10
7 0 0 0 0 0 0 0 0 8.5 500 200 300 45 250 200 75 1 0.73 0.87 1.50 1.13 0.20 0.26 0.06 0.16 1.10
7 0 0 0 0 0 0 0 0 8.5 500 200 300 45 250 200 75 1 0.80 0.98 1.80 1.37 0.16 0.30 0.06 0.24 0.50
7 0 0 0 0 0 0 0 0 8.5 500 200 300 45 250 200 75 1 0.67 14.96 3.66 3.17 1.71 12.76 3.60 1.60 0.80
7 0 0 0 0 0 0 0 0 8.5 500 200 300 45 250 200 75 1 0.20 4.32 3.97 1.67 1.22 2.55 0.53 0.53 0.40
7 0 0 0 0 0 0 0 0 8.5 500 200 300 45 250 200 75 1 1.07 2.51 1.89 0.53 0.31 0.34 2.40 0.16 1.10

Annexure..
Geoinformatic Modelling for Certain Georesources and Geohazards of
Attur Valley, Tamil Nadu, India.
468
7 0 0 0 0 0 0 0 0 8.5 500 200 300 45 250 200 75 1 0.73 0.77 0.90 0.75 0.24 0.28 0.15 0.40 0.98
7 0 0 0 0 0 0 0 0 8.5 500 200 300 45 250 200 75 1 0.53 2.51 1.59 1.57 0.33 1.42 1.20 1.07 0.50
7 0 0 0 0 0 0 0 0 8.5 500 200 300 45 250 200 75 1 0.60 2.86 0.61 1.73 0.93 1.76 1.44 0.80 1.40
7 0 0 0 0 0 0 0 0 8.5 500 200 300 45 250 200 75 1 0.80 1.05 1.07 1.58 0.31 0.68 0.36 0.67 0.10
7 0 0 0 0 0 0 0 0 8.5 500 200 300 45 250 200 75 1 0.40 3.17 2.71 4.23 1.22 1.59 1.15 1.23 0.70
7 0 0 0 0 0 0 0 0 8.5 500 200 300 45 250 200 75 1 0.67 1.96 1.83 1.40 0.18 1.22 0.60 0.53 0.70
7 0 0 0 0 0 0 0 0 8.5 500 200 300 45 250 200 75 1 0.80 3.21 2.78 1.73 0.31 1.73 1.17 2.13 0.03
7 0 0 0 0 0 0 0 0 8.5 500 200 300 45 250 200 75 1 0.80 3.17 3.17 1.77 0.73 1.39 1.06 1.17 0.69
7 0 0 0 0 0 0 0 0 8.5 500 200 300 45 250 200 75 1 0.40 2.32 0.92 2.50 1.33 1.64 0.24 1.17 0.42
7 0 0 0 0 0 0 0 0 8.5 500 200 300 45 250 200 75 1 0.53 0.80 1.42 0.72 0.13 0.18 0.06 0.32 0.80
7 0 0 0 0 0 0 0 0 8.5 500 200 300 45 250 200 75 1 0.33 1.89 0.88 1.20 0.53 1.42 0.48 0.32 1.20
7 0 0 0 0 0 0 0 0 8.5 500 200 300 45 250 200 75 1 0.53 1.47 0.92 1.27 0.29 0.74 0.75 1.57 0.02
7 0 0 0 0 0 0 0 0 8.5 500 200 300 45 250 200 75 1 0.67 1.80 1.37 1.83 0.62 1.05 0.48 1.12 1.00
7 0 0 0 0 0 0 0 0 8.5 500 200 300 45 250 200 75 1 0.73 0.88 1.55 1.30 0.18 0.23 0.13 0.21 1.00
7 0 0 0 0 0 0 0 0 8.5 500 200 300 45 250 200 75 1 0.53 1.26 2.20 1.13 0.16 0.40 0.31 0.67 1.00
7 0 0 0 0 0 0 0 0 8.5 500 200 300 45 250 200 75 1 0.47 0.87 1.31 0.83 0.02 0.45 0.16 0.48 0.79
7 0 0 0 0 0 0 0 0 8.5 500 200 300 45 250 200 75 1 1.07 0.46 0.82 0.32 0.03 0.10 0.04 0.13 0.36
7 0 0 0 0 0 0 0 0 8.5 500 200 300 45 250 200 75 1 0.60 1.12 1.25 0.95 0.04 0.61 0.43 0.35 1.00
7 0 0 0 0 0 0 0 0 8.5 500 200 300 45 250 200 75 1 1.27 6.76 3.74 2.60 0.47 3.19 4.61 0.85 1.00
7 0 0 0 0 0 0 0 0 8.5 500 200 300 45 250 200 75 1 0.73 1.02 1.83 0.95 0.09 0.34 0.24 0.32 0.40
7 0 0 0 0 0 0 0 0 8.5 500 200 300 45 250 200 75 1 0.80 1.63 3.45 1.90 0.07 0.42 0.48 0.43 1.40
7 0 0 0 0 0 0 0 0 8.5 500 200 300 45 250 200 75 1 0.40 0.44 0.70 0.48 0.07 0.14 0.05 0.40 0.90
7 0 0 0 0 0 0 0 0 8.5 500 200 300 45 250 200 75 1 0.93 1.95 0.85 1.50 0.78 1.28 0.53 0.75 1.00
7 0 0 0 0 0 0 0 0 8.5 500 200 300 45 250 200 75 1 0.53 2.15 3.51 2.53 0.53 0.76 0.36 1.23 0.40
7 0 0 0 0 0 0 0 0 8.5 500 200 300 45 250 200 75 1 0.80 2.14 1.83 1.22 0.18 1.93 0.36 1.76 1.00

Annexure..
Geoinformatic Modelling for Certain Georesources and Geohazards of
Attur Valley, Tamil Nadu, India.
469
7 0 0 0 0 0 0 0 0 8.5 500 200 300 45 250 200 75 1 0.87 1.18 1.16 0.75 0.40 0.33 0.60 0.19 0.62
7 0 0 0 0 0 0 0 0 8.5 500 200 300 45 250 200 75 1 0.13 5.97 1.80 2.67 1.24 4.71 1.32 0.85 1.00
7 0 0 0 0 0 0 0 0 8.5 500 200 300 45 250 200 75 1 0.60 1.14 1.98 0.83 0.18 0.42 0.18 0.27 1.10
7 0 0 0 0 0 0 0 0 8.5 500 200 300 45 250 200 75 1 0.73 3.33 3.45 2.00 0.53 1.73 1.01 0.96 1.16
7 0 0 0 0 0 0 0 0 8.5 500 200 300 45 250 200 75 1 1.07 0.66 0.87 0.42 0.11 0.26 0.11 0.40 1.20
7 0 0 0 0 0 0 0 0 8.5 500 200 300 45 250 200 75 1 0.80 2.46 2.66 1.47 0.33 0.85 1.32 0.69 0.24
7 0 0 0 0 0 0 0 0 8.5 500 200 300 45 250 200 75 1 0.73 1.75 2.11 1.63 0.31 0.82 0.44 1.87 0.30
7 0 0 0 0 0 0 0 0 8.5 500 200 300 45 250 200 75 1 0.73 1.51 2.17 1.18 0.13 0.55 0.50 1.41 0.27
7 0 0 0 0 0 0 0 0 8.5 500 200 300 45 250 200 75 1 0.87 1.97 2.53 0.93 0.47 0.92 0.41 0.24 1.10
7 0 0 0 0 0 0 0 0 8.5 500 200 300 45 250 200 75 1 0.47 2.45 2.68 2.07 0.56 1.48 0.36 0.59 0.30
7 0 0 0 0 0 0 0 0 8.5 500 200 300 45 250 200 75 1 0.87 2.00 3.32 1.00 0.20 0.74 0.36 0.21 0.70
7 0 0 0 0 0 0 0 0 8.5 500 200 300 45 250 200 75 1 0.60 1.53 0.92 1.47 1.18 0.80 0.78 0.21 0.40
7 0 0 0 0 0 0 0 0 8.5 500 200 300 45 250 200 75 1 0.47 1.82 1.62 1.47 0.40 0.96 0.60 0.85 1.00
7 0 0 0 0 0 0 0 0 8.5 500 200 300 45 250 200 75 1 0.73 2.48 2.56 2.07 0.56 1.11 0.96 0.37 0.50
7 0 0 0 0 0 0 0 0 8.5 500 200 300 45 250 200 75 1 0.60 1.20 1.28 0.95 0.18 0.62 0.34 0.61 0.99
7 0 0 0 0 0 0 0 0 8.5 500 200 300 45 250 200 75 1 0.67 0.72 0.90 0.43 0.38 0.20 0.15 0.51 0.90
7 0 0 0 0 0 0 0 0 8.5 500 200 300 45 250 200 75 1 0.53 1.13 2.26 1.07 0.16 0.33 0.11 0.59 0.99
7 0 0 0 0 0 0 0 0 8.5 500 200 300 45 250 200 75 1 0.93 1.82 1.98 2.43 1.80 1.08 0.07 0.64 0.10
7 0 0 0 0 0 0 0 0 8.5 500 200 300 45 250 200 75 1 1.00 1.19 1.46 1.18 0.56 0.40 0.27 0.24 0.40
7 0 0 0 0 0 0 0 0 8.5 500 200 300 45 250 200 75 1 0.53 2.68 3.82 1.77 0.60 0.76 0.96 0.96 0.45
7 0 0 0 0 0 0 0 0 8.5 500 200 300 45 250 200 75 1 0.53 4.67 1.28 5.07 0.80 2.95 3.27 0.75 0.38
7 0 0 0 0 0 0 0 0 8.5 500 200 300 45 250 200 75 1 0.40 4.58 2.59 2.00 2.64 1.87 1.03 0.64 1.00
7 0 0 0 0 0 0 0 0 8.5 500 200 300 45 250 200 75 1 0.67 1.79 2.81 1.07 0.20 0.65 0.43 0.37 1.00
7 0 0 0 0 0 0 0 0 8.5 500 200 300 45 250 200 75 1 0.73 1.85 2.38 1.52 0.23 0.68 0.96 0.61 1.00
7 0 0 0 0 0 0 0 0 8.5 500 200 300 45 250 200 75 1 0.80 1.75 2.35 1.15 0.20 0.74 0.49 1.12 0.17

Annexure..
Geoinformatic Modelling for Certain Georesources and Geohazards of
Attur Valley, Tamil Nadu, India.
470
7 0 0 0 0 0 0 0 0 8.5 500 200 300 45 250 200 75 1 0.60 2.15 2.71 1.42 0.13 1.12 0.63 0.32 0.34
7 0 0 0 0 0 0 0 0 8.5 500 200 300 45 250 200 75 1 0.53 2.73 1.77 2.32 0.62 1.50 1.25 1.65 0.50
7 0 0 0 0 0 0 0 0 8.5 500 200 300 45 250 200 75 1 0.80 0.76 1.30 1.03 0.36 0.11 0.19 0.88 0.51
7 0 0 0 0 0 0 0 0 8.5 500 200 300 45 250 200 75 1 0.67 1.51 2.29 1.43 0.56 0.51 0.16 0.99 0.52
7 0 0 0 0 0 0 0 0 8.5 500 200 300 45 250 200 75 1 0.73 1.83 2.32 1.40 0.33 0.96 0.29 0.27 0.90
7 0 0 0 0 0 0 0 0 8.5 500 200 300 45 250 200 75 1 0.60 1.40 1.74 1.12 0.40 0.58 0.29 0.99 1.00
7 0 0 0 0 0 0 0 0 8.5 500 200 300 45 250 200 75 1 0.73 2.04 1.53 1.00 0.53 0.71 1.25 0.24 0.92
7 0 0 0 0 0 0 0 0 8.5 500 200 300 45 250 200 75 1 0.87 4.22 3.81 2.40 1.87 2.44 0.19 0.32 1.00
7 0 0 0 0 0 0 0 0 8.5 500 200 300 45 250 200 75 1 0.53 1.19 2.38 1.08 0.11 0.30 0.19 1.07 0.67
7 0 0 0 0 0 0 0 0 8.5 500 200 300 45 250 200 75 1 0.93 1.91 2.10 1.00 0.19 0.96 0.72 0.32 1.00
7 0 0 0 0 0 0 0 0 8.5 500 200 300 45 250 200 75 1 0.60 2.44 5.55 1.00 1.24 0.18 2.88 0.53 0.62
7 0 0 0 0 0 0 0 0 8.5 500 200 300 45 250 200 75 1 0.33 3.68 2.65 1.33 2.33 0.13 2.45 0.27 0.42
7 0 0 0 0 0 0 0 0 8.5 500 200 300 45 250 200 75 1 0.67 1.41 0.98 1.02 0.11 1.05 0.43 0.32 0.80
7 0 0 0 0 0 0 0 0 8.5 500 200 300 45 250 200 75 1 1.13 1.45 1.82 0.58 0.34 0.55 0.36 0.19 0.09
7 0 0 0 0 0 0 0 0 8.5 500 200 300 45 250 200 75 1 0.60 2.11 3.11 1.93 0.00 1.08 0.60 0.32 1.00
7 0 0 0 0 0 0 0 0 8.5 500 200 300 45 250 200 75 1 0.73 1.06 0.73 0.92 0.16 0.75 0.31 0.40 0.80
7 0 0 0 0 0 0 0 0 8.5 500 200 300 45 250 200 75 1 0.47 3.72 1.16 1.27 0.36 2.61 1.68 0.64 1.00
7 0 0 0 0 0 0 0 0 8.5 500 200 300 45 250 200 75 1 0.73 2.68 1.83 1.53 0.80 1.14 1.44 0.37 0.90
7 0 0 0 0 0 0 0 0 8.5 500 200 300 45 250 200 75 1 0.47 6.76 2.59 2.33 2.33 1.40 6.15 0.75 0.56
7 0 0 0 0 0 0 0 0 8.5 500 200 300 45 250 200 75 1 0.67 1.56 1.74 1.03 0.47 0.81 0.44 0.27 0.60
7 0 0 0 0 0 0 0 0 8.5 500 200 300 45 250 200 75 1 0.87 0.65 0.57 0.75 0.07 0.38 0.18 0.53 0.10
7 0 0 0 0 0 0 0 0 8.5 500 200 300 45 250 200 75 1 0.67 3.76 2.68 2.07 0.02 2.21 1.92 1.28 1.00
7 0 0 0 0 0 0 0 0 8.5 500 200 300 45 250 200 75 1 0.33 1.26 2.14 1.08 0.04 0.51 0.16 1.55 1.00
7 0 0 0 0 0 0 0 0 8.5 500 200 300 45 250 200 75 1 0.47 3.28 2.35 2.50 0.40 2.16 1.25 0.13 1.10
7 0 0 0 0 0 0 0 0 8.5 500 200 300 45 250 200 75 1 0.60 1.41 1.31 0.50 0.29 0.61 0.48 0.59 0.80

Annexure..
Geoinformatic Modelling for Certain Georesources and Geohazards of
Attur Valley, Tamil Nadu, India.
471
7 0 0 0 0 0 0 0 0 8.5 500 200 300 45 250 200 75 1 0.27 3.94 3.20 3.53 0.44 1.98 2.21 0.75 0.65
7 0 0 0 0 0 0 0 0 8.5 500 200 300 45 250 200 75 1 0.33 3.05 2.17 2.23 0.71 0.92 2.35 0.32 1.00
7 0 0 0 0 0 0 0 0 8.5 500 200 300 45 250 200 75 1 0.47 1.96 1.25 1.27 0.27 1.25 0.75 1.23 0.12
7 0 0 0 0 0 0 0 0 8.5 500 200 300 45 250 200 75 1 0.47 1.85 2.05 1.53 0.36 0.94 0.44 1.87 0.51
7 0 0 0 0 0 0 0 0 8.5 500 200 300 45 250 200 75 1 0.87 3.25 3.69 1.63 0.80 1.19 0.84 1.07 0.04
7 0 0 0 0 0 0 0 0 8.5 500 200 300 45 250 200 75 1 0.93 2.42 2.04 0.93 1.56 1.22 0.58 0.37 0.20
7 0 0 0 0 0 0 0 0 8.5 500 200 300 45 250 200 75 1 0.53 2.59 2.23 1.43 0.49 1.36 0.91 1.12 0.09
7 0 0 0 0 0 0 0 0 8.5 500 200 300 45 250 200 75 1 0.47 4.60 2.20 1.60 2.64 2.21 0.77 1.92 0.50
7 0 0 0 0 0 0 0 0 8.5 500 200 300 45 250 200 75 1 0.80 0.91 1.47 1.18 0.05 0.24 0.34 0.43 1.00
7 0 0 0 0 0 0 0 0 8.5 500 200 300 45 250 200 75 1 0.40 10.18 3.20 5.83 5.60 0.34 10.80 0.80 0.43
7 0 0 0 0 0 0 0 0 8.5 500 200 300 45 250 200 75 1 0.20 2.33 2.96 0.90 0.33 0.94 0.48 0.27 1.00
7 0 0 0 0 0 0 0 0 8.5 500 200 300 45 250 200 75 1 0.80 1.72 2.20 1.58 0.31 0.74 0.49 1.47 0.36
7 0 0 0 0 0 0 0 0 8.5 500 200 300 45 250 200 75 1 0.80 3.94 2.50 2.67 0.87 3.12 1.56 1.49 0.80
7 0 0 0 0 0 0 0 0 8.5 500 200 300 45 250 200 75 1 0.53 1.95 2.38 2.20 1.04 0.80 0.21 0.53 0.80
7 0 0 0 0 0 0 0 0 8.5 500 200 300 45 250 200 75 1 0.40 4.68 2.14 2.43 2.24 0.78 3.84 0.37 0.35
7 0 0 0 0 0 0 0 0 8.5 500 200 300 45 250 200 75 1 0.47 3.59 1.19 3.00 1.56 2.04 1.68 0.85 1.00
7 0 0 0 0 0 0 0 0 8.5 500 200 300 45 250 200 75 1 0.80 1.05 1.80 1.00 0.33 0.37 0.10 0.29 0.56
7 0 0 0 0 0 0 0 0 8.5 500 200 300 45 250 200 75 1 0.53 1.14 1.37 0.93 0.11 0.65 0.27 0.40 1.60
7 0 0 0 0 0 0 0 0 8.5 500 200 300 45 250 200 75 1 0.27 3.07 2.44 2.57 1.13 1.45 1.15 0.32 0.35
7 0 0 0 0 0 0 0 0 8.5 500 200 300 45 250 200 75 1 0.33 2.97 2.14 2.83 0.15 2.70 0.48 0.80 1.00
7 0 0 0 0 0 0 0 0 8.5 500 200 300 45 250 200 75 1 0.67 1.71 2.04 1.37 0.33 0.91 0.36 0.16 0.56
7 0 0 0 0 0 0 0 0 8.5 500 200 300 45 250 200 75 1 0.60 2.24 0.79 2.50 0.93 1.67 0.53 1.07 0.75
7 0 0 0 0 0 0 0 0 8.5 500 200 300 45 250 200 75 1 0.60 2.57 1.28 3.00 2.02 1.36 0.39 0.69 0.56
7 0 0 0 0 0 0 0 0 8.5 500 200 300 45 250 200 75 1 0.53 2.03 1.34 1.77 0.18 1.36 0.87 1.07 0.21
7 0 0 0 0 0 0 0 0 8.5 500 200 300 45 250 200 75 1 0.67 1.88 3.05 1.07 0.22 0.76 0.22 0.37 0.90

Annexure..
Geoinformatic Modelling for Certain Georesources and Geohazards of
Attur Valley, Tamil Nadu, India.
472
7 0 0 0 0 0 0 0 0 8.5 500 200 300 45 250 200 75 1 0.67 2.54 1.37 2.33 0.84 1.42 1.20 0.37 1.40
7 0 0 0 0 0 0 0 0 8.5 500 200 300 45 250 200 75 1 1.07 1.77 2.50 0.67 0.50 0.67 0.40 0.32 0.62
7 0 0 0 0 0 0 0 0 8.5 500 200 300 45 250 200 75 1 1.00 1.36 1.07 1.15 0.96 0.91 0.17 0.67 0.45
7 0 0 0 0 0 0 0 0 8.5 500 200 300 45 250 200 75 1 0.67 1.73 3.14 1.37 0.09 0.65 0.31 0.69 1.20
7 0 0 0 0 0 0 0 0 8.5 500 200 300 45 250 200 75 1 0.67 1.75 1.22 1.70 0.53 1.04 0.78 1.41 0.56
7 0 0 0 0 0 0 0 0 8.5 500 200 300 45 250 200 75 1 0.67 0.81 1.77 0.92 0.02 0.18 0.13 0.96 0.49
7 0 0 0 0 0 0 0 0 8.5 500 200 300 45 250 200 75 1 0.87 0.84 1.34 0.50 0.18 0.20 0.24 0.37 0.62
7 0 0 0 0 0 0 0 0 8.5 500 200 300 45 250 200 75 1 0.53 3.17 3.11 1.07 1.27 1.70 0.09 0.27 1.00
7 0 0 0 0 0 0 0 0 8.5 500 200 300 45 250 200 75 1 0.60 1.49 2.72 0.95 0.18 0.42 0.24 0.53 0.51
7 0 0 0 0 0 0 0 0 8.5 500 200 300 45 250 200 75 1 0.53 2.48 1.86 0.77 0.51 1.08 0.96 0.16 0.50
7 0 0 0 0 0 0 0 0 8.5 500 200 300 45 250 200 75 1 0.80 0.40 0.87 0.58 0.04 0.04 0.08 0.21 0.10
7 0 0 0 0 0 0 0 0 8.5 500 200 300 45 250 200 75 1 1.13 1.11 1.59 1.40 0.87 0.50 0.12 0.56 0.29
7 0 0 0 0 0 0 0 0 8.5 500 200 300 45 250 200 75 1 0.60 3.05 1.86 1.40 1.62 0.38 2.21 0.37 0.32
7 0 0 0 0 0 0 0 0 8.5 500 200 300 45 250 200 75 1 1.07 1.33 1.16 1.38 0.90 0.64 0.43 0.27 0.42
7 0 0 0 0 0 0 0 0 8.5 500 200 300 45 250 200 75 1 0.53 2.53 2.53 1.70 0.96 0.35 1.68 0.53 0.62
7 0 0 0 0 0 0 0 0 8.5 500 200 300 45 250 200 75 1 0.67 2.23 2.69 1.17 0.73 0.62 0.87 0.32 1.15

Annexure..
Geoinformatic Modelling for Certain Georesources and Geohazards of
Attur Valley, Tamil Nadu, India.
473
Wn Wn*Qn100
WQ
I
Ph
Tu
rbid
ity
Td
s
To
t alk
To
t
hard
ness
NO
3
Cl
SO
4
Ca
Fe
F
sum
of
Wn
Ph
Td
s
To
t alk
To
t h
ard
ness
NO
3
Cl
SO
4
Ca
F
sum
of
Wn
*Qn
100
0.0 0.0 0.0 0.0 0.0 0.0 0.0 0.0 0.0 0.7 0.2 1.0 2.4 0.0 0.2 0.1 0.2 0.0 0.0 0.1 14.3 17.3 16.7
0.0 0.0 0.0 0.0 0.0 0.0 0.0 0.0 0.0 0.7 0.2 1.0 1.6 0.1 0.1 0.1 0.2 0.1 0.1 0.3 13.9 16.4 15.8
0.0 0.0 0.0 0.0 0.0 0.0 0.0 0.0 0.0 0.7 0.2 1.0 1.2 0.1 0.2 0.1 0.1 0.1 0.0 0.2 8.8 10.9 10.5
0.0 0.0 0.0 0.0 0.0 0.0 0.0 0.0 0.0 0.7 0.2 1.0 1.0 0.2 0.2 0.3 0.4 0.2 0.1 1.3 0.9 4.7 4.6
0.0 0.0 0.0 0.0 0.0 0.0 0.0 0.0 0.0 0.7 0.2 1.0 1.2 0.1 0.2 0.1 0.1 0.1 0.0 0.4 30.2 32.4 31.3
0.0 0.0 0.0 0.0 0.0 0.0 0.0 0.0 0.0 0.7 0.2 1.0 1.2 0.1 0.2 0.1 0.2 0.1 0.0 0.1 17.6 19.6 18.9
0.0 0.0 0.0 0.0 0.0 0.0 0.0 0.0 0.0 0.7 0.2 1.0 0.9 0.1 0.2 0.2 0.3 0.2 0.1 0.3 15.4 17.8 17.1
0.0 0.0 0.0 0.0 0.0 0.0 0.0 0.0 0.0 0.7 0.2 1.0 1.0 0.2 0.3 0.2 1.1 0.1 0.5 0.2 9.2 12.9 12.4
0.0 0.0 0.0 0.0 0.0 0.0 0.0 0.0 0.0 0.7 0.2 1.0 2.1 0.1 0.2 0.1 0.4 0.1 0.0 0.2 7.0 10.3 10.0
0.0 0.0 0.0 0.0 0.0 0.0 0.0 0.0 0.0 0.7 0.2 1.0 0.9 0.1 0.3 0.1 0.0 0.1 0.1 0.2 22.0 23.6 22.8
0.0 0.0 0.0 0.0 0.0 0.0 0.0 0.0 0.0 0.7 0.2 1.0 1.7 0.1 0.2 0.2 0.7 0.1 0.2 0.1 13.2 16.4 15.9
0.0 0.0 0.0 0.0 0.0 0.0 0.0 0.0 0.0 0.7 0.2 1.0 1.9 0.1 0.1 0.1 0.1 0.1 0.1 0.2 22.0 24.8 23.9
0.0 0.0 0.0 0.0 0.0 0.0 0.0 0.0 0.0 0.7 0.2 1.0 2.1 0.0 0.1 0.0 0.2 0.0 0.0 0.0 19.8 22.2 21.5
0.0 0.0 0.0 0.0 0.0 0.0 0.0 0.0 0.0 0.7 0.2 1.0 1.7 0.1 0.1 0.1 0.1 0.1 0.0 0.2 8.8 11.1 10.7
0.0 0.0 0.0 0.0 0.0 0.0 0.0 0.0 0.0 0.7 0.2 1.0 0.7 0.1 0.2 0.1 0.4 0.1 0.0 0.3 6.6 8.5 8.2
0.0 0.0 0.0 0.0 0.0 0.0 0.0 0.0 0.0 0.7 0.2 1.0 1.4 0.1 0.2 0.2 0.0 0.2 0.1 0.2 14.3 16.8 16.2
0.0 0.0 0.0 0.0 0.0 0.0 0.0 0.0 0.0 0.7 0.2 1.0 2.8 0.0 0.2 0.0 0.0 0.0 0.0 0.1 24.2 27.4 26.5
0.0 0.0 0.0 0.0 0.0 0.0 0.0 0.0 0.0 0.7 0.2 1.0 1.9 0.3 0.1 0.2 1.0 0.4 0.2 0.2 22.0 26.3 25.4
0.0 0.0 0.0 0.0 0.0 0.0 0.0 0.0 0.0 0.7 0.2 1.0 2.1 0.1 0.3 0.1 0.5 0.1 0.0 0.2 5.7 9.0 8.7
0.0 0.0 0.0 0.0 0.0 0.0 0.0 0.0 0.0 0.7 0.2 1.0 2.1 0.2 0.4 0.1 0.0 0.0 0.1 0.1 22.0 25.1 24.2

Annexure..
Geoinformatic Modelling for Certain Georesources and Geohazards of
Attur Valley, Tamil Nadu, India.
474
0.0 0.0 0.0 0.0 0.0 0.0 0.0 0.0 0.0 0.7 0.2 1.0 1.6 0.1 0.2 0.1 0.9 0.1 0.1 0.4 11.0 14.5 14.0
0.0 0.0 0.0 0.0 0.0 0.0 0.0 0.0 0.0 0.7 0.2 1.0 1.2 0.1 0.3 0.1 0.4 0.1 0.1 0.2 5.5 8.0 7.7
0.0 0.0 0.0 0.0 0.0 0.0 0.0 0.0 0.0 0.7 0.2 1.0 2.2 0.1 0.2 0.2 0.5 0.1 0.2 0.3 17.0 20.7 20.0
0.0 0.0 0.0 0.0 0.0 0.0 0.0 0.0 0.0 0.7 0.2 1.0 1.2 0.1 0.3 0.1 0.2 0.0 0.1 0.3 19.8 22.1 21.3
0.0 0.0 0.0 0.0 0.0 0.0 0.0 0.0 0.0 0.7 0.2 1.0 1.0 0.1 0.2 0.2 1.5 0.2 0.1 0.2 17.6 21.1 20.4
0.0 0.0 0.0 0.0 0.0 0.0 0.0 0.0 0.0 0.7 0.2 1.0 1.4 0.1 0.3 0.1 0.2 0.1 0.0 0.2 15.4 17.9 17.2
0.0 0.0 0.0 0.0 0.0 0.0 0.0 0.0 0.0 0.7 0.2 1.0 1.4 0.1 0.3 0.1 0.0 0.1 0.0 0.4 15.6 18.0 17.4
0.0 0.0 0.0 0.0 0.0 0.0 0.0 0.0 0.0 0.7 0.2 1.0 3.1 0.1 0.2 0.1 1.0 0.1 0.1 0.2 5.5 10.4 10.0
0.0 0.0 0.0 0.0 0.0 0.0 0.0 0.0 0.0 0.7 0.2 1.0 1.2 0.0 0.1 0.0 0.0 0.0 0.0 0.2 6.6 8.2 7.9
0.0 0.0 0.0 0.0 0.0 0.0 0.0 0.0 0.0 0.7 0.2 1.0 1.0 0.1 0.3 0.1 0.2 0.0 0.0 0.2 24.2 26.2 25.3
0.0 0.0 0.0 0.0 0.0 0.0 0.0 0.0 0.0 0.7 0.2 1.0 1.9 0.0 0.2 0.1 0.1 0.0 0.0 0.0 24.2 26.6 25.7
0.0 0.0 0.0 0.0 0.0 0.0 0.0 0.0 0.0 0.7 0.2 1.0 2.1 0.0 0.2 0.1 0.1 0.0 0.0 0.1 11.0 13.6 13.1
0.0 0.0 0.0 0.0 0.0 0.0 0.0 0.0 0.0 0.7 0.2 1.0 1.7 0.7 0.4 0.2 0.8 1.1 0.4 0.5 17.6 23.5 22.6
0.0 0.0 0.0 0.0 0.0 0.0 0.0 0.0 0.0 0.7 0.2 1.0 0.5 0.2 0.4 0.1 0.6 0.2 0.1 0.2 8.8 11.1 10.7
0.0 0.0 0.0 0.0 0.0 0.0 0.0 0.0 0.0 0.7 0.2 1.0 2.8 0.1 0.2 0.0 0.2 0.0 0.3 0.0 24.2 27.8 26.9
0.0 0.0 0.0 0.0 0.0 0.0 0.0 0.0 0.0 0.7 0.2 1.0 1.9 0.0 0.1 0.1 0.1 0.0 0.0 0.1 21.6 23.9 23.1
0.0 0.0 0.0 0.0 0.0 0.0 0.0 0.0 0.0 0.7 0.2 1.0 1.4 0.1 0.2 0.1 0.2 0.1 0.1 0.3 11.0 13.5 13.1
0.0 0.0 0.0 0.0 0.0 0.0 0.0 0.0 0.0 0.7 0.2 1.0 1.6 0.1 0.1 0.1 0.5 0.2 0.2 0.2 30.8 33.7 32.5
0.0 0.0 0.0 0.0 0.0 0.0 0.0 0.0 0.0 0.7 0.2 1.0 2.1 0.0 0.1 0.1 0.2 0.1 0.0 0.2 2.2 5.0 4.8
0.0 0.0 0.0 0.0 0.0 0.0 0.0 0.0 0.0 0.7 0.2 1.0 1.0 0.1 0.3 0.3 0.6 0.1 0.1 0.4 15.4 18.4 17.8
0.0 0.0 0.0 0.0 0.0 0.0 0.0 0.0 0.0 0.7 0.2 1.0 1.7 0.1 0.2 0.1 0.1 0.1 0.1 0.2 15.4 17.9 17.3
0.0 0.0 0.0 0.0 0.0 0.0 0.0 0.0 0.0 0.7 0.2 1.0 2.1 0.1 0.3 0.1 0.2 0.2 0.1 0.6 0.7 4.4 4.2
0.0 0.0 0.0 0.0 0.0 0.0 0.0 0.0 0.0 0.7 0.2 1.0 2.1 0.1 0.3 0.1 0.4 0.1 0.1 0.3 15.2 18.8 18.2
0.0 0.0 0.0 0.0 0.0 0.0 0.0 0.0 0.0 0.7 0.2 1.0 1.0 0.1 0.1 0.2 0.7 0.1 0.0 0.3 9.2 11.8 11.4
0.0 0.0 0.0 0.0 0.0 0.0 0.0 0.0 0.0 0.7 0.2 1.0 1.4 0.0 0.2 0.1 0.1 0.0 0.0 0.1 17.6 19.4 18.7
0.0 0.0 0.0 0.0 0.0 0.0 0.0 0.0 0.0 0.7 0.2 1.0 0.9 0.1 0.1 0.1 0.3 0.1 0.1 0.1 26.4 28.1 27.1
0.0 0.0 0.0 0.0 0.0 0.0 0.0 0.0 0.0 0.7 0.2 1.0 1.4 0.1 0.1 0.1 0.1 0.1 0.1 0.5 0.4 2.8 2.7

Annexure..
Geoinformatic Modelling for Certain Georesources and Geohazards of
Attur Valley, Tamil Nadu, India.
475
0.0 0.0 0.0 0.0 0.0 0.0 0.0 0.0 0.0 0.7 0.2 1.0 1.7 0.1 0.2 0.1 0.3 0.1 0.1 0.3 22.0 24.9 24.0
0.0 0.0 0.0 0.0 0.0 0.0 0.0 0.0 0.0 0.7 0.2 1.0 1.9 0.0 0.2 0.1 0.1 0.0 0.0 0.1 22.0 24.4 23.6
0.0 0.0 0.0 0.0 0.0 0.0 0.0 0.0 0.0 0.7 0.2 1.0 1.4 0.1 0.2 0.1 0.1 0.0 0.0 0.2 22.0 24.1 23.3
0.0 0.0 0.0 0.0 0.0 0.0 0.0 0.0 0.0 0.7 0.2 1.0 1.2 0.0 0.1 0.1 0.0 0.0 0.0 0.1 17.4 19.1 18.4
0.0 0.0 0.0 0.0 0.0 0.0 0.0 0.0 0.0 0.7 0.2 1.0 2.8 0.0 0.1 0.0 0.0 0.0 0.0 0.0 7.9 10.9 10.5
0.0 0.0 0.0 0.0 0.0 0.0 0.0 0.0 0.0 0.7 0.2 1.0 1.6 0.0 0.1 0.1 0.0 0.1 0.0 0.1 22.0 24.0 23.2
0.0 0.0 0.0 0.0 0.0 0.0 0.0 0.0 0.0 0.7 0.2 1.0 3.3 0.3 0.4 0.2 0.2 0.3 0.5 0.3 22.0 27.5 26.5
0.0 0.0 0.0 0.0 0.0 0.0 0.0 0.0 0.0 0.7 0.2 1.0 1.9 0.0 0.2 0.1 0.0 0.0 0.0 0.1 8.8 11.2 10.8
0.0 0.0 0.0 0.0 0.0 0.0 0.0 0.0 0.0 0.7 0.2 1.0 2.1 0.1 0.4 0.1 0.0 0.0 0.1 0.1 30.8 33.7 32.6
0.0 0.0 0.0 0.0 0.0 0.0 0.0 0.0 0.0 0.7 0.2 1.0 1.0 0.0 0.1 0.0 0.0 0.0 0.0 0.1 19.8 21.1 20.4
0.0 0.0 0.0 0.0 0.0 0.0 0.0 0.0 0.0 0.7 0.2 1.0 2.4 0.1 0.1 0.1 0.4 0.1 0.1 0.2 22.0 25.5 24.6
0.0 0.0 0.0 0.0 0.0 0.0 0.0 0.0 0.0 0.7 0.2 1.0 1.4 0.1 0.4 0.2 0.3 0.1 0.0 0.4 8.8 11.6 11.2
0.0 0.0 0.0 0.0 0.0 0.0 0.0 0.0 0.0 0.7 0.2 1.0 2.1 0.1 0.2 0.1 0.1 0.2 0.0 0.5 22.0 25.3 24.4
0.0 0.0 0.0 0.0 0.0 0.0 0.0 0.0 0.0 0.7 0.2 1.0 2.2 0.1 0.1 0.1 0.2 0.0 0.1 0.1 13.6 16.5 15.9
0.0 0.0 0.0 0.0 0.0 0.0 0.0 0.0 0.0 0.7 0.2 1.0 0.3 0.3 0.2 0.2 0.6 0.4 0.1 0.3 22.0 24.4 23.6
0.0 0.0 0.0 0.0 0.0 0.0 0.0 0.0 0.0 0.7 0.2 1.0 1.6 0.1 0.2 0.1 0.1 0.0 0.0 0.1 24.2 26.3 25.4
0.0 0.0 0.0 0.0 0.0 0.0 0.0 0.0 0.0 0.7 0.2 1.0 1.9 0.1 0.4 0.1 0.3 0.2 0.1 0.3 25.5 28.9 27.9
0.0 0.0 0.0 0.0 0.0 0.0 0.0 0.0 0.0 0.7 0.2 1.0 2.8 0.0 0.1 0.0 0.1 0.0 0.0 0.1 26.4 29.5 28.5
0.0 0.0 0.0 0.0 0.0 0.0 0.0 0.0 0.0 0.7 0.2 1.0 2.1 0.1 0.3 0.1 0.2 0.1 0.1 0.2 5.3 8.5 8.2
0.0 0.0 0.0 0.0 0.0 0.0 0.0 0.0 0.0 0.7 0.2 1.0 1.9 0.1 0.2 0.1 0.2 0.1 0.0 0.5 6.6 9.8 9.4
0.0 0.0 0.0 0.0 0.0 0.0 0.0 0.0 0.0 0.7 0.2 1.0 1.9 0.1 0.2 0.1 0.1 0.0 0.1 0.4 5.9 8.8 8.5
0.0 0.0 0.0 0.0 0.0 0.0 0.0 0.0 0.0 0.7 0.2 1.0 2.2 0.1 0.3 0.1 0.2 0.1 0.0 0.1 24.2 27.3 26.4
0.0 0.0 0.0 0.0 0.0 0.0 0.0 0.0 0.0 0.7 0.2 1.0 1.2 0.1 0.3 0.2 0.3 0.1 0.0 0.2 6.6 9.0 8.7
0.0 0.0 0.0 0.0 0.0 0.0 0.0 0.0 0.0 0.7 0.2 1.0 2.2 0.1 0.4 0.1 0.1 0.1 0.0 0.1 15.4 18.4 17.8
0.0 0.0 0.0 0.0 0.0 0.0 0.0 0.0 0.0 0.7 0.2 1.0 1.6 0.1 0.1 0.1 0.6 0.1 0.1 0.1 8.8 11.4 11.0
0.0 0.0 0.0 0.0 0.0 0.0 0.0 0.0 0.0 0.7 0.2 1.0 1.2 0.1 0.2 0.1 0.2 0.1 0.1 0.3 22.0 24.2 23.3
0.0 0.0 0.0 0.0 0.0 0.0 0.0 0.0 0.0 0.7 0.2 1.0 1.9 0.1 0.3 0.2 0.3 0.1 0.1 0.1 11.0 14.0 13.5

Annexure..
Geoinformatic Modelling for Certain Georesources and Geohazards of
Attur Valley, Tamil Nadu, India.
476
0.0 0.0 0.0 0.0 0.0 0.0 0.0 0.0 0.0 0.7 0.2 1.0 1.6 0.1 0.1 0.1 0.1 0.1 0.0 0.2 21.8 24.0 23.1
0.0 0.0 0.0 0.0 0.0 0.0 0.0 0.0 0.0 0.7 0.2 1.0 1.7 0.0 0.1 0.0 0.2 0.0 0.0 0.1 19.8 22.1 21.3
0.0 0.0 0.0 0.0 0.0 0.0 0.0 0.0 0.0 0.7 0.2 1.0 1.4 0.0 0.2 0.1 0.1 0.0 0.0 0.2 21.8 23.8 23.0
0.0 0.0 0.0 0.0 0.0 0.0 0.0 0.0 0.0 0.7 0.2 1.0 2.4 0.1 0.2 0.2 0.9 0.1 0.0 0.2 2.2 6.3 6.1
0.0 0.0 0.0 0.0 0.0 0.0 0.0 0.0 0.0 0.7 0.2 1.0 2.6 0.1 0.2 0.1 0.3 0.0 0.0 0.1 8.8 12.1 11.7
0.0 0.0 0.0 0.0 0.0 0.0 0.0 0.0 0.0 0.7 0.2 1.0 1.4 0.1 0.4 0.1 0.3 0.1 0.1 0.3 9.9 12.7 12.3
0.0 0.0 0.0 0.0 0.0 0.0 0.0 0.0 0.0 0.7 0.2 1.0 1.4 0.2 0.1 0.4 0.4 0.3 0.4 0.2 8.4 11.7 11.3
0.0 0.0 0.0 0.0 0.0 0.0 0.0 0.0 0.0 0.7 0.2 1.0 1.0 0.2 0.3 0.1 1.3 0.2 0.1 0.2 22.0 25.4 24.6
0.0 0.0 0.0 0.0 0.0 0.0 0.0 0.0 0.0 0.7 0.2 1.0 1.7 0.1 0.3 0.1 0.1 0.1 0.0 0.1 22.0 24.5 23.7
0.0 0.0 0.0 0.0 0.0 0.0 0.0 0.0 0.0 0.7 0.2 1.0 1.9 0.1 0.3 0.1 0.1 0.1 0.1 0.2 22.0 24.8 24.0
0.0 0.0 0.0 0.0 0.0 0.0 0.0 0.0 0.0 0.7 0.2 1.0 2.1 0.1 0.3 0.1 0.1 0.1 0.1 0.3 3.7 6.8 6.5
0.0 0.0 0.0 0.0 0.0 0.0 0.0 0.0 0.0 0.7 0.2 1.0 1.6 0.1 0.3 0.1 0.1 0.1 0.1 0.1 7.5 9.9 9.5
0.0 0.0 0.0 0.0 0.0 0.0 0.0 0.0 0.0 0.7 0.2 1.0 1.4 0.1 0.2 0.2 0.3 0.1 0.1 0.5 11.0 13.9 13.4
0.0 0.0 0.0 0.0 0.0 0.0 0.0 0.0 0.0 0.7 0.2 1.0 2.1 0.0 0.1 0.1 0.2 0.0 0.0 0.3 11.2 14.0 13.5
0.0 0.0 0.0 0.0 0.0 0.0 0.0 0.0 0.0 0.7 0.2 1.0 1.7 0.1 0.3 0.1 0.3 0.0 0.0 0.3 11.4 14.2 13.7
0.0 0.0 0.0 0.0 0.0 0.0 0.0 0.0 0.0 0.7 0.2 1.0 1.9 0.1 0.3 0.1 0.2 0.1 0.0 0.1 19.8 22.5 21.7
0.0 0.0 0.0 0.0 0.0 0.0 0.0 0.0 0.0 0.7 0.2 1.0 1.6 0.1 0.2 0.1 0.2 0.1 0.0 0.3 22.0 24.5 23.6
0.0 0.0 0.0 0.0 0.0 0.0 0.0 0.0 0.0 0.7 0.2 1.0 1.9 0.1 0.2 0.1 0.3 0.1 0.1 0.1 20.3 23.0 22.2
0.0 0.0 0.0 0.0 0.0 0.0 0.0 0.0 0.0 0.7 0.2 1.0 2.2 0.2 0.4 0.2 0.9 0.2 0.0 0.1 22.0 26.3 25.4
0.0 0.0 0.0 0.0 0.0 0.0 0.0 0.0 0.0 0.7 0.2 1.0 1.4 0.1 0.3 0.1 0.1 0.0 0.0 0.3 14.7 16.9 16.4
0.0 0.0 0.0 0.0 0.0 0.0 0.0 0.0 0.0 0.7 0.2 1.0 2.4 0.1 0.2 0.1 0.1 0.1 0.1 0.1 22.0 25.2 24.3
0.0 0.0 0.0 0.0 0.0 0.0 0.0 0.0 0.0 0.7 0.2 1.0 1.6 0.1 0.6 0.1 0.6 0.0 0.3 0.2 13.6 17.1 16.5
0.0 0.0 0.0 0.0 0.0 0.0 0.0 0.0 0.0 0.7 0.2 1.0 0.9 0.2 0.3 0.1 1.1 0.0 0.3 0.1 9.2 12.2 11.7
0.0 0.0 0.0 0.0 0.0 0.0 0.0 0.0 0.0 0.7 0.2 1.0 1.7 0.1 0.1 0.1 0.1 0.1 0.0 0.1 17.6 19.9 19.2
0.0 0.0 0.0 0.0 0.0 0.0 0.0 0.0 0.0 0.7 0.2 1.0 2.9 0.1 0.2 0.0 0.2 0.0 0.0 0.1 2.0 5.5 5.3
0.0 0.0 0.0 0.0 0.0 0.0 0.0 0.0 0.0 0.7 0.2 1.0 1.6 0.1 0.3 0.1 0.0 0.1 0.1 0.1 22.0 24.4 23.6
0.0 0.0 0.0 0.0 0.0 0.0 0.0 0.0 0.0 0.7 0.2 1.0 1.9 0.0 0.1 0.1 0.1 0.1 0.0 0.1 17.6 20.0 19.3

Annexure..
Geoinformatic Modelling for Certain Georesources and Geohazards of
Attur Valley, Tamil Nadu, India.
477
0.0 0.0 0.0 0.0 0.0 0.0 0.0 0.0 0.0 0.7 0.2 1.0 1.2 0.2 0.1 0.1 0.2 0.2 0.2 0.2 22.0 24.4 23.5
0.0 0.0 0.0 0.0 0.0 0.0 0.0 0.0 0.0 0.7 0.2 1.0 1.9 0.1 0.2 0.1 0.4 0.1 0.2 0.1 19.8 22.9 22.1
0.0 0.0 0.0 0.0 0.0 0.0 0.0 0.0 0.0 0.7 0.2 1.0 1.2 0.3 0.3 0.2 1.1 0.1 0.7 0.2 12.3 16.5 15.9
0.0 0.0 0.0 0.0 0.0 0.0 0.0 0.0 0.0 0.7 0.2 1.0 1.7 0.1 0.2 0.1 0.2 0.1 0.0 0.1 13.2 15.7 15.2
0.0 0.0 0.0 0.0 0.0 0.0 0.0 0.0 0.0 0.7 0.2 1.0 2.2 0.0 0.1 0.1 0.0 0.0 0.0 0.2 2.2 4.8 4.7
0.0 0.0 0.0 0.0 0.0 0.0 0.0 0.0 0.0 0.7 0.2 1.0 1.7 0.2 0.3 0.2 0.0 0.2 0.2 0.4 22.0 25.1 24.3
0.0 0.0 0.0 0.0 0.0 0.0 0.0 0.0 0.0 0.7 0.2 1.0 0.9 0.1 0.2 0.1 0.0 0.0 0.0 0.5 22.0 23.8 23.0
0.0 0.0 0.0 0.0 0.0 0.0 0.0 0.0 0.0 0.7 0.2 1.0 1.2 0.1 0.3 0.2 0.2 0.2 0.1 0.0 24.2 26.6 25.7
0.0 0.0 0.0 0.0 0.0 0.0 0.0 0.0 0.0 0.7 0.2 1.0 1.6 0.1 0.1 0.0 0.1 0.1 0.1 0.2 17.6 19.8 19.1
0.0 0.0 0.0 0.0 0.0 0.0 0.0 0.0 0.0 0.7 0.2 1.0 0.7 0.2 0.4 0.3 0.2 0.2 0.2 0.2 14.3 16.6 16.1
0.0 0.0 0.0 0.0 0.0 0.0 0.0 0.0 0.0 0.7 0.2 1.0 0.9 0.1 0.2 0.2 0.3 0.1 0.3 0.1 22.0 24.2 23.4
0.0 0.0 0.0 0.0 0.0 0.0 0.0 0.0 0.0 0.7 0.2 1.0 1.2 0.1 0.1 0.1 0.1 0.1 0.1 0.4 2.6 4.8 4.7
0.0 0.0 0.0 0.0 0.0 0.0 0.0 0.0 0.0 0.7 0.2 1.0 1.2 0.1 0.2 0.1 0.2 0.1 0.0 0.5 11.2 13.7 13.2
0.0 0.0 0.0 0.0 0.0 0.0 0.0 0.0 0.0 0.7 0.2 1.0 2.2 0.1 0.4 0.1 0.4 0.1 0.1 0.3 0.9 4.7 4.5
0.0 0.0 0.0 0.0 0.0 0.0 0.0 0.0 0.0 0.7 0.2 1.0 2.4 0.1 0.2 0.1 0.8 0.1 0.1 0.1 4.4 8.3 8.0
0.0 0.0 0.0 0.0 0.0 0.0 0.0 0.0 0.0 0.7 0.2 1.0 1.4 0.1 0.2 0.1 0.2 0.1 0.1 0.3 2.0 4.6 4.5
0.0 0.0 0.0 0.0 0.0 0.0 0.0 0.0 0.0 0.7 0.2 1.0 1.2 0.2 0.2 0.1 1.3 0.2 0.1 0.6 11.0 14.9 14.4
0.0 0.0 0.0 0.0 0.0 0.0 0.0 0.0 0.0 0.7 0.2 1.0 2.1 0.0 0.2 0.1 0.0 0.0 0.0 0.1 22.0 24.6 23.7
0.0 0.0 0.0 0.0 0.0 0.0 0.0 0.0 0.0 0.7 0.2 1.0 1.0 0.4 0.4 0.4 2.7 0.0 1.2 0.2 9.5 15.9 15.4
0.0 0.0 0.0 0.0 0.0 0.0 0.0 0.0 0.0 0.7 0.2 1.0 0.5 0.1 0.3 0.1 0.2 0.1 0.1 0.1 22.0 23.4 22.6
0.0 0.0 0.0 0.0 0.0 0.0 0.0 0.0 0.0 0.7 0.2 1.0 2.1 0.1 0.2 0.1 0.2 0.1 0.1 0.4 7.9 11.1 10.7
0.0 0.0 0.0 0.0 0.0 0.0 0.0 0.0 0.0 0.7 0.2 1.0 2.1 0.2 0.3 0.2 0.4 0.3 0.2 0.4 17.6 21.6 20.9
0.0 0.0 0.0 0.0 0.0 0.0 0.0 0.0 0.0 0.7 0.2 1.0 1.4 0.1 0.3 0.2 0.5 0.1 0.0 0.2 17.6 20.3 19.6
0.0 0.0 0.0 0.0 0.0 0.0 0.0 0.0 0.0 0.7 0.2 1.0 1.0 0.2 0.2 0.2 1.1 0.1 0.4 0.1 7.7 11.1 10.7
0.0 0.0 0.0 0.0 0.0 0.0 0.0 0.0 0.0 0.7 0.2 1.0 1.2 0.2 0.1 0.2 0.8 0.2 0.2 0.3 22.0 25.1 24.2
0.0 0.0 0.0 0.0 0.0 0.0 0.0 0.0 0.0 0.7 0.2 1.0 2.1 0.0 0.2 0.1 0.2 0.0 0.0 0.1 12.3 15.0 14.5
0.0 0.0 0.0 0.0 0.0 0.0 0.0 0.0 0.0 0.7 0.2 1.0 1.4 0.1 0.2 0.1 0.1 0.1 0.0 0.1 35.2 37.1 35.8

Annexure..
Geoinformatic Modelling for Certain Georesources and Geohazards of
Attur Valley, Tamil Nadu, India.
478
0.0 0.0 0.0 0.0 0.0 0.0 0.0 0.0 0.0 0.7 0.2 1.0 0.7 0.1 0.3 0.2 0.6 0.1 0.1 0.1 7.7 9.9 9.5
0.0 0.0 0.0 0.0 0.0 0.0 0.0 0.0 0.0 0.7 0.2 1.0 0.9 0.1 0.2 0.2 0.1 0.2 0.1 0.2 22.0 24.0 23.2
0.0 0.0 0.0 0.0 0.0 0.0 0.0 0.0 0.0 0.7 0.2 1.0 1.7 0.1 0.2 0.1 0.2 0.1 0.0 0.0 12.3 14.8 14.3
0.0 0.0 0.0 0.0 0.0 0.0 0.0 0.0 0.0 0.7 0.2 1.0 1.6 0.1 0.1 0.2 0.5 0.1 0.1 0.3 16.5 19.4 18.7
0.0 0.0 0.0 0.0 0.0 0.0 0.0 0.0 0.0 0.7 0.2 1.0 1.6 0.1 0.1 0.2 1.0 0.1 0.0 0.2 12.3 15.7 15.2
0.0 0.0 0.0 0.0 0.0 0.0 0.0 0.0 0.0 0.7 0.2 1.0 1.4 0.1 0.1 0.1 0.1 0.1 0.1 0.3 4.6 7.0 6.7
0.0 0.0 0.0 0.0 0.0 0.0 0.0 0.0 0.0 0.7 0.2 1.0 1.7 0.1 0.3 0.1 0.1 0.1 0.0 0.1 19.8 22.3 21.6
0.0 0.0 0.0 0.0 0.0 0.0 0.0 0.0 0.0 0.7 0.2 1.0 1.7 0.1 0.2 0.2 0.4 0.1 0.1 0.1 30.8 33.8 32.6
0.0 0.0 0.0 0.0 0.0 0.0 0.0 0.0 0.0 0.7 0.2 1.0 2.8 0.1 0.3 0.0 0.2 0.1 0.0 0.1 13.6 17.3 16.7
0.0 0.0 0.0 0.0 0.0 0.0 0.0 0.0 0.0 0.7 0.2 1.0 2.6 0.1 0.1 0.1 0.5 0.1 0.0 0.2 9.9 13.5 13.1
0.0 0.0 0.0 0.0 0.0 0.0 0.0 0.0 0.0 0.7 0.2 1.0 1.7 0.1 0.3 0.1 0.0 0.1 0.0 0.2 26.4 29.0 28.0
0.0 0.0 0.0 0.0 0.0 0.0 0.0 0.0 0.0 0.7 0.2 1.0 1.7 0.1 0.1 0.1 0.3 0.1 0.1 0.4 12.3 15.2 14.7
0.0 0.0 0.0 0.0 0.0 0.0 0.0 0.0 0.0 0.7 0.2 1.0 1.7 0.0 0.2 0.1 0.0 0.0 0.0 0.3 10.8 13.1 12.7
0.0 0.0 0.0 0.0 0.0 0.0 0.0 0.0 0.0 0.7 0.2 1.0 2.2 0.0 0.1 0.0 0.1 0.0 0.0 0.1 13.6 16.4 15.8
0.0 0.0 0.0 0.0 0.0 0.0 0.0 0.0 0.0 0.7 0.2 1.0 1.4 0.1 0.3 0.1 0.6 0.1 0.0 0.1 22.0 24.8 24.0
0.0 0.0 0.0 0.0 0.0 0.0 0.0 0.0 0.0 0.7 0.2 1.0 1.6 0.1 0.3 0.1 0.1 0.0 0.0 0.2 11.2 13.5 13.1
0.0 0.0 0.0 0.0 0.0 0.0 0.0 0.0 0.0 0.7 0.2 1.0 1.4 0.1 0.2 0.1 0.3 0.1 0.1 0.0 11.0 13.3 12.8
0.0 0.0 0.0 0.0 0.0 0.0 0.0 0.0 0.0 0.7 0.2 1.0 2.1 0.0 0.1 0.0 0.0 0.0 0.0 0.1 2.2 4.5 4.4
0.0 0.0 0.0 0.0 0.0 0.0 0.0 0.0 0.0 0.7 0.2 1.0 2.9 0.0 0.2 0.1 0.4 0.0 0.0 0.2 6.4 10.3 9.9
0.0 0.0 0.0 0.0 0.0 0.0 0.0 0.0 0.0 0.7 0.2 1.0 1.6 0.1 0.2 0.1 0.8 0.0 0.2 0.1 7.0 10.2 9.9
0.0 0.0 0.0 0.0 0.0 0.0 0.0 0.0 0.0 0.7 0.2 1.0 2.8 0.1 0.1 0.1 0.4 0.1 0.0 0.1 9.2 12.9 12.5
0.0 0.0 0.0 0.0 0.0 0.0 0.0 0.0 0.0 0.7 0.2 1.0 1.4 0.1 0.3 0.1 0.5 0.0 0.2 0.2 13.6 16.4 15.8
0.0 0.0 0.0 0.0 0.0 0.0 0.0 0.0 0.0 0.7 0.2 1.0 1.7 0.1 0.3 0.1 0.4 0.1 0.1 0.1 25.3 28.1 27.1

Annexure..
Geoinformatic Modelling for Certain Georesources and Geohazards of
Attur Valley, Tamil Nadu, India.
479
Annexure – IV
lin
eam
en
ts
Ne
ote
cto
nic
lin
eam
en
ts
Se
ism
og
en
ic
cha
ract
ers
Min
era
l
De
po
sits
Co
ntr
ol
Wa
ter
con
du
ctin
g
Ch
ara
cte
rs
Dis
cha
rgin
g
Ch
ara
cte
rs
Flu
ori
de
Ca
rrie
rs
La
nd
slid
e
cau
sin
g
L1 NL1 - -
L2 NL2 - - -
L3 NL 3 - - - -
L4 - - - -
L5 - - - - - -
L6 NL4 -
L7 NL5 - - - -
L8 NL6 - -
L9 NL7 - -
L10 NL8 - -
L11 NL9 - - -
L12 NL10 -
L13 NL11 - - -
L14 - - - - -
L15 NL12 - - -
L16 NL13 - - - -
L17 NL14 - - - -
L18 - - - - -
L19 - - - - - -
L20 - - - - - -
L21 - - - - - -
L22 - - - -
L23 NL15 - - - -
L24 - - - - -
L25 - - -
L26 NL16 - - -
L27 NL17 - -
L28 NL18 - -
L29 - - - - -
L30 - - - -
L31 - - - - -

Annexure..
Geoinformatic Modelling for Certain Georesources and Geohazards of
Attur Valley, Tamil Nadu, India.
480
L32 NL19 - - - -
L33 NL20 -
L34 - - - -
L35 - - - -
L36 NL21 - -
L37 NL22 - - - -
L38 NL23 - - -
L39 NL24 -
L40 NL25 -
L41 NL26 - -
L42 NL27 - - - -
L43 NL28 -
L44 NL29 -
L45 NL30 - - - -
L46 NL31 - - -
L47 - - - - -
L48 - - - - -
L49 - - - - -
L50 NL32 - - -
L51 - - - -
L52 - - - - -
L53 NL33 - - -
L54 - - - - -
L55 - - - -
L56 - - - -
L57 - - - -
L58 - - -
L59 - - - -
L60 - - - -
L61 NL34 - - -
L62 - - - - -
L63 - - -
L64 - - -
L65 - - -
L66 - - -
L67 NL35 - -
L68 - - - - -

Annexure..
Geoinformatic Modelling for Certain Georesources and Geohazards of
Attur Valley, Tamil Nadu, India.
481
L69 NL36 -
L70 NL37 -
L71 NL38 - -
L72 - - - -
L73 NL39 - - -
L74 NL40 - -
L75 NL41 -
L76 NL42
L77 NL43 - - -
L78 NL44 - -
L79 NL45 -
L80 NL46 - -
L81 - - - -
L82 NL47 - - -
L83 - - - - -
L84 NL48 -
L85 NL49 - - -
L86 NL50 -
L87 NL51 - - -
L88 - - - - -
L89 - - - -
L90 - - - - - -
L91 - - - -
L92 - - - - - -
L93 - - - - -
L94 - - -
L95 - - - - -
L96 - - - - - -
L97 - - - - -
L98 NL52 - - - - -
L99 NL53 - -

Geoinformatic Modelling for Certain Georesources and Geohazards of Attur Valley, Tamil Nadu, India.
Appendix – Publications
The following papers have been published by the candidate in his Research field
Papers Published in International / National Journals:
1. 2011 Balamurugan, G., Rajendran, S. and Thirukumaran, V. Impacts of
Climate, Topography and Weathering profile on Hydrogeology and
Water Resources Assessment in Semi-Arid Terrain. Using Earth
Observation-1 ALI, ASTER-DEM and GIS techniques. International
Journal of Geomatics and Geosciences, Vol.1, No.2. ISSN.0976-4380.
2. 2010 Biswal, T. K., Thirukumaran, V., Kamleshwar Ratre, Krishanu
Bandyapadhaya, Sundaralingam, K. and Amit Kumar Mondal. A Study
of Mylonites from parts of the Salem - Attur Shear Zone (Tamil Nadu)
and its Tectonic Implications - Journal Geological Society of India
Vol.75, pp.128-136.
3. 2009 Biswal, T. K., Thirukumaran, V., Kamleshwar Ratre and
Sundaralingam, K. Study of the Salem–Attur shear zone, east of Salem,
Tamil Nadu: A new kinematic interpretation - Current Science, Vol. 96,
No. 10, pp.1386-1390.
Papers Published in Books / Edited / Proceeding Volumes:
1. 2009 Thirukumaran, V. and Ramkumar, Mu. Quick Sand: A lesser known
Geohazrd: But not A lesser evil – 16TH CHAPTER IN THE BOOK”
Geological Hazards Causes, Consequences And Methods Of
Containment”- Editor Mu. Ramkumar: New India Publishing Agency,
New Delhi -110088: ISBN: 978-81-90851-27-5
2. 2009 Suresh, R. and Thirukumaran, V. Glossary on Geohazards-”Geological
Hazards Causes, Consequences And Methods Of Containment”- Editor
Mu.Ramkumar: New India Publishing Agency, New Delhi -110088:
ISBN: 978-81-90851-27-5.

Appendix..
Geoinformatic Modelling for Certain Georesources and Geohazards of Attur Valley, Tamil Nadu, India.
483
Papers Published in International / National Conferences / Seminars:
1. 2011 Thirukumaran, V. and Kumanan, C.J., A study on Geomorphologic
Anomalies as Signatures of Neotectonism in Attur Valley,
TamilNadu,24th Indian Institute of Geomorphologists, National
conference & Annual convention on Coastal Dynamics &
Geomorphology, Anna University, Chennai -25.
2. 2011 Thirukumaran, V., .Biswal, T.K., Kumanan, C.J. and Sundaralingam,
K. Study On Cataclasites Of Moyar-Bhavani-Salem-Attur Shear Zone
Around Salem, Tamil Nadu, India And Its Significance In Building
Reactivation Tectonics, International conference on “Earth-Future”-
VonHumboldt Foundation and Periyar University, Salem. September
7-9, 2011.
3. 2011 Thirukumaran, V., Biswal, T.K. and Kumanan, C.J. Evidences of
alkaline magmatism in Attur valley Tamil Nadu, International
conference on “Earth-Future”- VonHumboldt Foundation and Periyar
University, Salem. September 7-9, 2011.
4. 2011 G. Balamurugan, K. Santhanam, and V.Thirukumaran Applications of
hyperspectral and radar remote sensing data and GIS integration for
terrain evaluation and natural resources assessment in Namakkal
district, Tamil Nadu, India, International conference on “Earth-Future”-
VonHumboldt Foundation and Periyar University, Salem. September
7-9, 2011.
5. 2010 Sundaralingam K., Tanushree Mahadani, Y.K. Singh, Tapas Kumar
Biswal, V. Thirukumaran, Tectonic history of South Delhi Fold Belt, a
resemblance with Southern Granulite Terrane and East African Orogen, 7th International Symposium on Gondwana to Asia: Evolution of Asian
Continent and its Continental Margins, International Association for
Gondwana Research Conference Series 9.25-29, September 2010,
Qingdao, China.

Appendix..
Geoinformatic Modelling for Certain Georesources and Geohazards of Attur Valley, Tamil Nadu, India.
484
6. 2010 Thirukumaran, V., Kumanan, C.J. and Biswal, T. K. An integrated
study of airborne magnetic and resistivity anomalies and visually
interpreted remotely sensed data of Salem region Tamil Nadu in
connection with shear zone and neotectonic zone demarcation-
National Conference on Geomatics in Disaster Management
(GEODM2010) - Organised by-Jamsetji TATA Center for Disaster
Management, TATA Institute of Social Sciences, Mumbai.
7. 2010 Thirukumaran, V., Biswal, T. K. and Sundaralingam, K. Petrography
and analytical study of cataclasites of Moyar-Bhavani-Salem-Attur
Shear Zone around Salem, Tamil Nadu -National Conference in
Geoscience Research NACGEO -2010, Dept Of Earth Sciences,
Annamalai University, Annamalai Nagar-608002, 5&6 March 2010.
8. 2010 Thirukumaran, V., Thirumuragan, V. and Satish, S. Historical
perspectives of water management system in India and neighboring
countries- One Day Regional Workshop on Artificial Recharge and
Watershed Management- UGC Sponsored, Department of Geology,
Periyar University, Salem, Tamil Nadu.
9. 2009 Thirukumaran, V., Biswal, T. K., Sundaralingam, K. and Karthikeyan,
K. Structure and petrology of western Kanjamalai Salem district and an
attempt on simulating real field condition with DEM - National
Symposium on Geological Processes, Mineral and Fossil fuel
Exploration, Golden Jubilee Celebrations of Mineralogical Society of
India & UGC National Symposium on Environmental Geology-
Organised By Department of Geology, Anna University, Chennai-
600025, 26-28, November 2009.
10. 2008 Biswal, T. K., Thirukumaran, V., Krishanu Bandyopadhyay, and Mary.
The Salem - Attur shear zone is a low angle thrust: A new kinematic
interpretation from east of Salem, Tamil Nadu - International
Conference on Texctonics of Indian Subcontinent (TOIS) – International
Association for Gondwana Research Series.5, March, 2008 at IIT
Bombay, pp.3-6.

Appendix..
Geoinformatic Modelling for Certain Georesources and Geohazards of Attur Valley, Tamil Nadu, India.
485
11. 2007 Thirumurugan, V, Rengarajan,R, Sridharan,V, Vijayakumar,N,
Thirukumaran,V and Poomathi,M. Estimation of rainfall- recharge
relationship of Attur taluk, Salem district, Tamil Nadu by curve fitting
using principles of least square method- National Seminar on
Hydrocare 2007- Sponsored by DST, UGC and CSIR, New Delhi,
Organised by Dept. of Earth Sciences, Annamalai University,
Annamalai Nagar -608002, 22 & 23 March, 2007.
12. 2007 Thirumurugan, V, Sridharan, V, Thirukumaran, V Vijayakumar, N,
Rengarajan, R and Bhuvaneshwari, M. Interactive geodynamic studies
for rainfall- recharge of Salem taluk, Salem district, and Tamil Nadu- a
geo-statistical approach - National Seminar on Hydrocare 2007-
Sponsored by DST, UGC and CSIR, New Delhi, Organised by Dept. of
Earth Sciences, Annamalai University, Annamalai Nagar - 608002, 22 &
23 March,2007.
13. 2007 Vijayakumar, N., Gurugnanam, B., Rengarajan, R., Sridharan, V.
Thirukumaran, V. Thirumurugan, V. and Nagarajan. A. Buffered and
non buffered zones groundwater quality studies in and around
Godumalai shear zone area of Salem district - National Seminar on
Hydrocare 2007- Sponsored by DST, UGC and CSIR, New Delhi,
Organised by Dept. of Earth Sciences, Annamalai University,
Annamalai Nagar -608002, 22 & 23 March,2007.
14. 2003. Thirukumaran, V. and Manivel, M. Fluoride hazard zonation mapping
of Tiruchirappalli district, Tamil Nadu using remote sensing - National
Conference on balancing competing water uses and management,
sponsored by AICTE, New Delhi, 27-29 March 2003, at Department of
Geology, Bharathidasan University, Tiruchirapalli-24.

Geoinformatic Modelling for Certain Georesources and Geohazards of Attur Valley, Tamil Nadu, India.

Appendix..
Geoinformatic Modelling for Certain Georesources and Geohazards of Attur Valley, Tamil Nadu, India.
487

Appendix..
Geoinformatic Modelling for Certain Georesources and Geohazards of Attur Valley, Tamil Nadu, India.
488

Appendix..
Geoinformatic Modelling for Certain Georesources and Geohazards of Attur Valley, Tamil Nadu, India.
489

Appendix..
Geoinformatic Modelling for Certain Georesources and Geohazards of Attur Valley, Tamil Nadu, India.
490

Appendix..
Geoinformatic Modelling for Certain Georesources and Geohazards of Attur Valley, Tamil Nadu, India.
491

Appendix..
Geoinformatic Modelling for Certain Georesources and Geohazards of Attur Valley, Tamil Nadu, India.
492
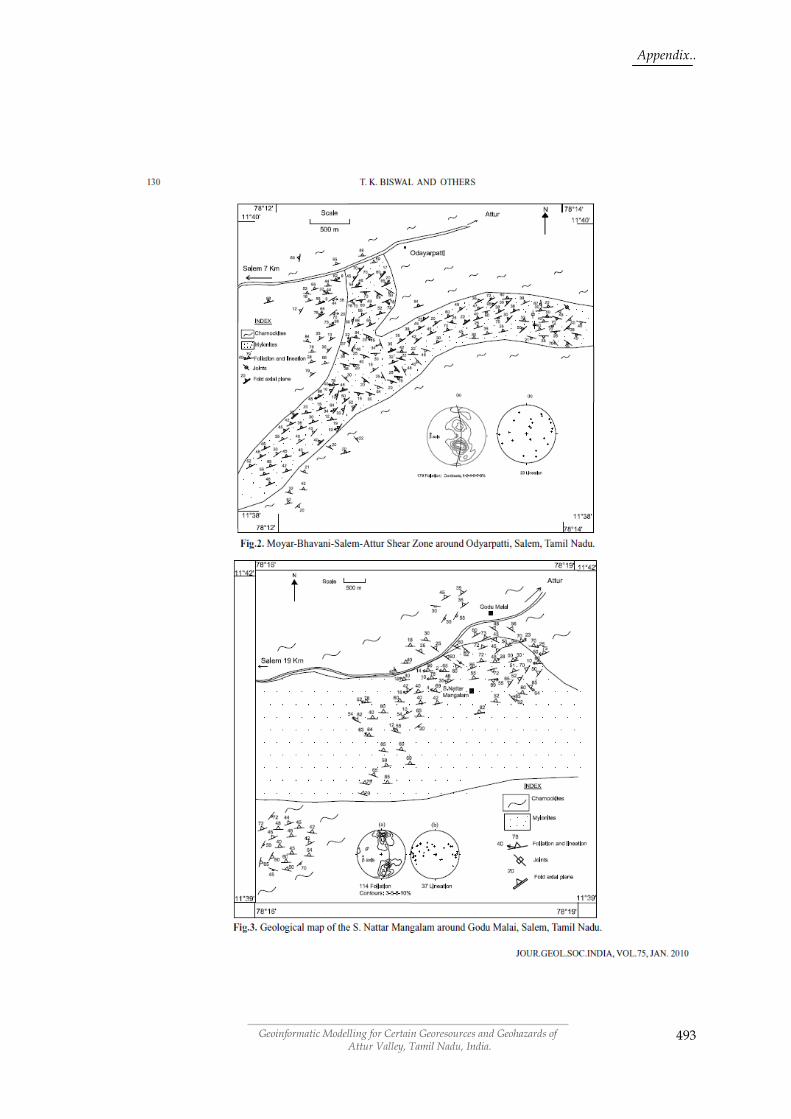
Appendix..
Geoinformatic Modelling for Certain Georesources and Geohazards of Attur Valley, Tamil Nadu, India.
493

Appendix..
Geoinformatic Modelling for Certain Georesources and Geohazards of Attur Valley, Tamil Nadu, India.
494

Appendix..
Geoinformatic Modelling for Certain Georesources and Geohazards of Attur Valley, Tamil Nadu, India.
495

Appendix..
Geoinformatic Modelling for Certain Georesources and Geohazards of Attur Valley, Tamil Nadu, India.
496

Appendix..
Geoinformatic Modelling for Certain Georesources and Geohazards of Attur Valley, Tamil Nadu, India.
497

Appendix..
Geoinformatic Modelling for Certain Georesources and Geohazards of Attur Valley, Tamil Nadu, India.
498

Appendix..
Geoinformatic Modelling for Certain Georesources and Geohazards of Attur Valley, Tamil Nadu, India.
499