spatially explicit assessment of local biomass availability for distributed biogas production via...
TRANSCRIPT

at SciVerse ScienceDirect
Renewable Energy 39 (2012) 261e270
Contents lists available
Renewable Energy
journal homepage: www.elsevier .com/locate/renene
Spatially explicit assessment of local biomass availability for distributed biogasproduction via anaerobic co-digestion e Mediterranean case study
Alyona Zubaryeva a,c,*,1, Nicola Zaccarelli a, Cecilia Del Giudice b, Giovanni Zurlini a
aDepartment of Biological and Environmental Sciences and Technologies, Ecotekne, University of Salento, Prov.le Lecce-Monteroni, 73100 Lecce, ItalybDepartment of Engineering for Innovation, University of Salento, Prov. le Lecce-Monteroni, 73100 Lecce, Italyc European Commission, Joint Research Centre, Institute for Energy, Westerduinweg 3, NL-1755 LE Petten, The Netherlands
a r t i c l e i n f o
Article history:Received 2 March 2011Accepted 11 August 2011Available online 8 September 2011
Keywords:BiogasGISAnaerobic digestionAnalytic hierarchy processDecision-support
* Corresponding author. Department of Biologicaland Technologies, Ecotekne, University of Salento, PrLecce, Italy. Tel.: þ39 3204473321.
E-mail addresses: [email protected],(A. Zubaryeva).
1 The views expressed are purely those of the acircumstances be regarded as stating an officialCommission.
0960-1481/$ e see front matter � 2011 Elsevier Ltd.doi:10.1016/j.renene.2011.08.021
a b s t r a c t
Renewable energies, especially energy from biomass, contribute to the sustainable development of theterritory. Simultaneously, by using biomass to produce bioenergy, bioreproductive land is devoted tosupply energy. As the bioreproductive land area on the European level is decreasing, bioenergy competesagainst other demands like the production of food, industrial resources or cultural goods and services,among others, thus the correct assessment of the available local potential is important for local andregional planning. Moreover, bioenergy system being a socio-ecological system requires integratedapproaches for the evaluation of the factors, components and interactions of such a system, consideringthat agriculture presents one of the major drivers of the land use change and biodiversity loss. Therefore,this work was focused on the development of the approach for and on the assessment of biogaspotentials to provide a support for decision-makers and bioenergy industry at a local scale. The approachexploits the spatial relations among territorial units (i.e., a contiguity analysis), and integrates time seriesof continuous and discrete data. It is based on the analytic hierarchy process (AHP) combined with GIS-based analysis, and permitted to develop a territorial information system in support for biogas planning,perform analysis of feedstock for biogas from different sources potential and produce plausible scenariosfor identification of biogas suitable territorial clusters; the analysis of the tradeoffs between the use ofdifferent local sources of the feedstock for biogas production are discussed as well.
� 2011 Elsevier Ltd. All rights reserved.
1. Introduction
Renewable sources of energies like biogas are considered to beone of the major climate change mitigation options [1]. Enhancedproduction of the biogas from animal manure and organic munic-ipal waste being a carbon neutral source of energy is also seen inthe context of diversion from landfills. In Europe, it is largelyencouraged by the new European directive for promotion ofrenewable energy sources [2] with the obligatory implementationacross Member States through the National Action Plans. Moreover,International Energy Agency [3] mentions these sources as thosewith the one of the highest potentials for GHG mitigation among
and Environmental Sciencesov.le Lecce-Monteroni, 73100
uthors and may not in anyposition of the European
All rights reserved.
biofuels, bioliquids and their fossil fuel comparators. In addition, EULandfill Directive has set the target of reducing the biodegradablemunicipal waste destined for land fill to 35% of the level producedin 1995 by 2016 [4]. This together with a number of benefitsassociated with the exploitation of animal manures and slurries forthe energy production purposes (i.e. decrease in water, soil and airpollution, additional soil fertilization by digestate, etc.), hasencouraged the increasing effort to raise the biogas electricityoutput of such plants in the European Union, reaching the value ofapproximately 21,356 GWh in 2008 [5]. Italy was Europe’s numberfour biogas producer in 2009 with 444.3 ktoe, as primary energyproduction increased by 8.4% over 2008 and electricity productionby 8.8%. As it stands there are about 200 installations withcombined capacity of about 200 MWe.
Biogas systems in Italy developed from predominantly farm scaleplants, using liquid manure and crop residue mixtures for feedstockwith a number of centralized plants. The introduction of incentivesfor increased utilization of renewable resources via the renewableenergy certificates system and feed-in tariffs led to proliferation ofindustrial-scale plants with elaborate logistics. Compared to (for

Abbreviations
MCA multi-criteria assessmentMSW municipal solid wasteAD anaerobic digestion/digestorGIS geographic information systemWMA waste management authorityAHP analytic hierarchy processNYMBY not-in-my-backyardRES renewable energy sourcesOFSUW organic fraction of solid urban wasteAHP-OWA analytic hierarchy process-ordered weighted
averagingCR consistency ratio
A. Zubaryeva et al. / Renewable Energy 39 (2012) 261e270262
example)wind and solar energy fewarticles address issues related tobiogas plant planning in Italy, mainly focusing on the overall struc-ture of the biogas market development (i.e. [6]).
As a result of their decentralized nature and the regionalinvestment structure, biogas installations can contribute signifi-cantly to sustainable development in rural areas and offer farmersnew income opportunities [2]. Furthermore, the use of agriculturalmaterial such asmanure, slurry and other animal and organicwastefor biogas production has, in view of the high potential to reducegreenhouse gas emissions, significant environmental advantages interms of heat and power production and its use as biofuel. Co-digestion practices are attractive for farmers who in this casehave the incentive to treat their own waste together with otherorganic substrates, obtaining a double advantage of treating wasteand selling heat and electricity [7]. Other advantages of suchsystems for energy planners are the reduction of transmissionlosses, solution of problems related to congestion in electricitydistribution system, while providing appropriate power quality fordifferent types of end-users; they also contribute to the security ofsupply and to the deferment of transmission lines upgrades andexpansions [8]. Longden et al. [9] showed that local scale distrib-uted waste-to-energy plants were the most attractive for the UK’scounties by providing greater flexibility in managing changes inresidual waste availability and demand for recycling.
In order to address the issue of the wider diffusion of biogasplants, it is also necessary to overcome the so-called Not-In-My-Back-Yard (NYMBY) effect, by which all RES technologies are char-acterized [10].
The goal of this work is to propose an integrated methodologycombining spatial relations, temporal trends and multi-criteriaevaluation for the estimation of the biogas through anaerobicco-digestion potential for distributed electricity generation tosupport the planning at the local scale, aiming at establishment ofsmall and medium anaerobic digester of overall electricity poweroutput of 500e1000 kW. It integrates the numerical and spatiallyexplicit data and contiguity analysis for further introduction ofanaerobic digester in the highly agricultural area with theelevated level of tourism, where this type of renewable energyproduction is absent. This methodology would allow furtherincorporation of stakeholder preferences and supports the deci-sion-makers.
2. Approaches for biogas potential assessment
The group of multi-criteria analysis tools (MCA) allows theintegration of multiple economic, social, environmental objectivesand driving factors [11], stakeholder opinion integration, anda detailed analysis at different spatial scales through the link with
geographic information systems (GIS). These advantages broughtthe family of GIS-multi-criteria assessment (MCA) integrated toolsto the forefront of the decision-making support. GIS-MCA has beenused in a wide array of energy-related problem analysis: i.e.energy-efficient transportation [12], energy planning or agriculture[13,14] or landscape quality evaluation [15]. More specifically, thereis a dedicated and recent literature on the estimation of thepotential of biomass using GIS multi-criteria modeling techniquesin various regions (i.e. [16,17]). In the field of the AD locationassessment, Dagnall et al. [18] and Ma et al. [19] have evaluatedpossible alternative locations based principally on the collectedanimal manure. Batias et al. [20] developed a GIS-based toolwithout multiple criteria application for the calculations of avail-able livestock manure for the estimation of the available biogas.While, Bryan et al. [21] have assessed the potential of eucalyptus-based woody biomass in Australia.
It was affirmed that the optimal location of biogas plants isaffected by both regulations covering environmental protectionand economic considerations [22]. Environmental regulationsprevent installation, for example, in nature reserves and water andbird protection areas. Economic considerations are multiple andmight include, i.e. infrastructure presence such as road infrastruc-ture, existence of gas networks for bio-methane, and transmissionefficiency limitations of district heating grids [19]. Availability ofadequate feedstock near the plant location significantly enhancesefficiency of operation [22].
In the confirmation of the above-mentioned, Angelis-Dimakiset al. [23] stated that the modeling techniques in the field of esti-mation of biogas and biomass potentials are mostly used to opti-mize the management of animal manure. Due to the fact thatpotential energy available from biogas significantly varies based onthe common agricultural practices and the legislation, its assess-ment should be performed at a local scale. Angelis-Dimakis et al.[23] also state that the new models integrating the manure withother biomasses based on the interaction between geographicaland numerical databases are needed. It was also acknowledged thattransparent methodologies to evaluate possible interactions ofinnovative practice, policies and technologies at the communitylevel are required for the correct solutions to be set up in urbanenvironment [24]. A comprehensive review of Calvert [25]concludes that there is a lack of baseline information at theagenda-setting stage of public and private energy planning such as,i.e. spatial distribution of bioenergy sources, technical potential ofthese sources; this prevents decision-makers from taking bio-energy seriously. Such baseline information needs to be site-specific in order to take seriously the spatialetemporal nuancesthat are consequential to bioenergy feasibility.
3. Study area
The study area is one of the three waste management authori-ties (WMA) of Lecce province in the Apulia Region of Italy, insti-tuted in 2002. It is composed of 24 municipalities with the area of589.7 km2 and a population of 189,105 inhabitants [26]. The climateof this region is typically Mediterranean, characterized by precipi-tations in autumn and winter seasons (max of 850 mm/year) anddry summer. In this regards, the landscape is mainly composed ofolive orchards (nearly 75% of the area), while autochthonousvegetation is represented by Mediterranean maquis. Agriculture, inparticular olives and olive oil production, viticulture, small andmedium food plants and tobacco production, and seaside tourismare the most important economic sectors of the area (Fig. 1).
The olive oil industry and the ever increasing amount of tourismpose an additional energy demand in the WMA and increase theproduction of the urbanwastes during the summer seasonwhich is

Fig. 1. Study area showing the municipalities examined in this work.
A. Zubaryeva et al. / Renewable Energy 39 (2012) 261e270 263
the Southern part of Italy covers the larger part of the year, startingin April and ending in October. Moreover, the implementation ofregional waste management plan set the objective of 60% ofdifferentiated wastes by 2015 for this WMA [27].
4. Materials and methods
4.1. Materials for feedstock assessment and evaluation of feedstockpotential
In order tomaximize the utilization of locally available feedstockfor potential production of biogas, the co-digestion practices were
chosen for assessment, using the local biomass and organic fractionof solid urban wastes (Table 1). There are several possible combi-nations of feedstock as sources for biogas production. Their maintypes are the municipal solid wastes, biomass, fruit and vegetablewastes and manures [28]. It was shown that co-digestion of sewagesludge with municipal urban waste improves the methaneproduction of AD processes [29,30]. The co-digestion of cattlemanure with municipal solid waste (MSW) also increases themethane production [31,32]. Moreover, Callaghan et al. [33]showed that co-digestion of cattle slurry with fruit and vegetablewastes gave good co-digestion in terms of methane yield. Severalstudies have demonstrated the feasibility of valorization of olive
Table 1Types of feedstock potential analyzed in the study.
Feedstock Description Source
OFSUW (organicfraction of slidurban wastes)
Annual data at municipalitylevel (2007)
[47] with the assumptionthat organic fraction is 25%of total SUW produced
Agriculturalresidues
Annual aggregated dataolives, grape and grapestalk production (2007)
[26]; CORINE landcover e2006, 1:5000 [48]
Agro-industrialsubproducts
Annual olive oil olives andwine grapes, olive cake,grape marc production(2006e2007)
[26]; CORINE landcover e2006, 1:5000 [48,49]
Zootechnicalsludge
Cattle sludge and manureon the basis of live weights(2006e2007)
National zootechnicaldatabase (NZD) for number ofcows and buffalos [50] withfixed housing on straw
Table 3List of constraints.
ExclusiveConstraints
Description Source
Environmental Regional naturalprotected areas
Apulia region administration
National naturalprotected areasNatura 2000 sites
Cultural cultural heritage sites(archeological andarchitectonic sites,historical monuments)
Lecce province administration
Geological Caves and valleys Lecce province administrationSlope inclination Inclination >20% Digital Elevation Model [48]Landscape features Landscape units Lecce province administrationHydrogeology Basins, channels,
waterbodies and coastlagoons
Lecce province administration
Infrastructure Network of roads,railways, gas pipelines,power lines
Apulia region administration
A. Zubaryeva et al. / Renewable Energy 39 (2012) 261e270264
mill wastes through AD, observing up to 90% increase in methaneproduction when co-digested with alternative residue streams[34,35]. While Palmowski [36] showed themodality for AD of grapemarc. Although the specific biogas yields of grape stalk and grapemarcs were revealed to be relatively low [37], it might be added insmall amounts (due to the lignin content) as a co-digester with theOFSUW or animal slurry [38,39].
In this work we focused on the potential for the production ofbiogas through the AD with the co-digestion of organic feedstock,the most common for Lecce province being: animal manure andslurry, agricultural residues from viticulture and olive orchards,by-products of wine and olive oil production (such as olive oilcake and grape marc), and organic fraction of solid urban waste(Table 1). Since the agricultural residues and agro-industrial byproducts of olive grows are available unevenly during the years,the reference years for those was set to 2006e2007, while for therest of the sources the reference year was 2007. The spatial unit ofreference for all datasets was the municipality, which is thelowest jurisdictional level and the finest grain of informationavailable.
Available biogas quantity was estimated according to the coef-ficients revealed from the literature (Table 2).
4.2. Land availability assessment
The following digital cartographic layers were used for theanalysis of the land availability under the exclusive constraintsimposed by the landscape and regional law restrictions (Table 3).The procedure involved the Boolean overlay of buffered layers, eachlayer and the final map together with the biogas data were insertedin the GIS database using ArcGIS 9.3� software and Spatial analystextension [41] in layers as polygons; they were converted in rasterlayers for MCA program. The final raster grid was derived with thespatial resolution of 100 per 100 m with the categorical cells of0 and 1, where under 1 were areas suitable for the biogas planconstruction.
Table 2Biogas conversion factors (compiled after [6,20,37,40]).
Feedstock Biogas yield factor for 55%of CH4 (m3/t)
OFSUW 300Cattle sludge 32Cattle (cow and buffalos) manure 70Grape stalk 110Grape marc 120Olive oil cake 125
4.3. MCA analysis e AHP structure (FLOWA)
For the multi-criteria evaluation in the GIS environment ananalytic hierarchy process-ordered weighted averaging (AHP-OWA)was used, as provided by the program FLOWA, an ArcGIS 9.3�
extension developed by Boroushaki and Malczewski [42]. Fig. 2represents the hierarchical structure of the problem studied inthis article. We identified twomain objectives described by specificsets of data (Table 4). The first objective is an economic endpoint (E)integrating distances from sources and sinks of biomass andenergy, respectively, with a total of six factors. The distance tomajor roads, gas pipelines and power lines were selected to mini-mize the energy transportation costs and environmental impact ofnew infrastructures and overall traffic reduction; factor of distanceto sewage plants was included as the potential for further inclusionof this biogas source in the analysis; while distances to industrialareas and caves would be beneficial to the goal of the reuse,recovery and requalification available degraded areas and mini-mization of the odor impact of the potential AD. The secondobjective is resource availability (R) based on amount of feasiblebiomass derived by agricultural activities and urban wastes witha total of six factors.
FLOWA allows calculating the consistency ratio (CR) asa measure of inconsistency among weight attribution. The ration iscomputed as (formula (1)):
CR ¼ CIRI
(1)
where CI is a consistency index and RI is a random index e theconsistency index of a randomly generated pairwise comparison
Fig. 2. Hierarchical structure of area potential for biogas plant problem.
Table 4GIS criteria and factors used for the analysis.
Criteria Factors Sources
Economic E1. Distance to major roads Own calculation on the basisof data from Lecce provinceadministration
E2. Distance to gas pipelines Own calculation on the basisof data from Apulia regionadministration
E3. Distance to power lines Own calculation on the basisof data from Apulia regionadministration
E4. Distance to sewage plants Own calculation on the basisof data from Lecce provinceadministration
E5. Distance to industrial areas Own calculation on the basisof data from Lecce provinceadministration
E6. Distance to caves Own calculation on the basisof data from Lecce provinceadministration
Resourceavailability
R1. Biogas potential oforganic fraction of solidurban wastes
Own calculation,see Section 4.1
R2. Biogas potential ofcattle slurry
Own calculation,see Section 4.1
R3. Biogas potential oforganic fractionof animal manure
Own calculation,see Section 4.1
R4. Biogas potential ofolive oil cake
Own calculation,see Section 4.1
R5. Biogas potential ofgrape marc
Own calculation,see Section 4.1
R6. Biogas potential ofgrape stalk
Own calculation,see Section 4.1
Table 6Pairwise comparison on the factors level of criteria resource availability. Scenario 1.
R1 R3 Relative importance(weight)
CR
R1 1 3 0.086 N/AR3 0.33 1 0.75
Table 7Pairwise comparison on the factors level of criteria resource availability. Scenario 2.
R1 R2 R4 R5 R6 Relative importance(weight)
CR
R1 1 2 6 5 5 0.483 0.058R2 0.5 1 6 4 5 0.28R4 0.167 0.167 1 0.333 0.5 0.061R5 0.2 0.25 3 1 2 0.097R6 0.2 0.2 2 0.5 1 0.079
A. Zubaryeva et al. / Renewable Energy 39 (2012) 261e270 265
matrix. If CR< 0.1 e the pairwise comparison has a reasonablevalue of consistency. We applied a pairwise comparison approachdeveloped by Saaty [43], which enables the conversion of verbalcomparative weights into numerical scales. In the pairwisecomparison matrix the respective weights of criteria were assignedaccording to the scenarios considered. While the pairwisecomparison matrix for the factors of criteria E is presented inTable 5.
The standardization for the factors in FLOWA was performed asper formula (2):
vari ¼xi �minðxiÞ
maxðxiÞ �minðxiÞ(2)
Moreover in the application of this program, which integratesthe fuzzy linguistic quantifiers between two extreme cases of the atleast one and all, in this work we used all as a goal for AHP problemsolution. This means that “all” or “at least one” of the importantfactors/objectives (according to their relative weights) must besatisfied by an acceptable solution. In Boroushaki and Malczewski[42] the full description of the program can be found. For this study
Table 5Pairwise comparison of the level of factors in the criteria economic.
E1 E2 E3 E4 E5 E6 Relative importance(weight)
CR
E1 1 4 4 8 6 9 0.086 0.089E2 0.25 1 1 5 2 7 0.148E3 0.25 1 1 5 7 7 0.148E4 0.125 0.2 0.2 1 0.5 3 0.053E5 0.166 0.5 0.5 2 1 5 0.086E6 0.11 0.143 0.143 0.33 0.2 1 0.04
the goal “many” was chosen to indicate the areas where themaximum of the chosen criteria would be met.
4.4. Contiguity analysis
A first approximation of the feedstock flows among municipal-ities has been modeled by incorporating a neighborhood relation-ship for all spatial units in the study area. A contiguity matrix wascompiled by assigning to each cell xi,j of the squared arraycomposed ofN�N elements, whereN is the number of spatial unitsconsidered, the value of (formula (3)):
xi;j ¼8<:
0 if no boundary or road connectionswi;j if present boundary or road connections1 if i ¼ j
(3)
where wi,j is the intensity of the feedstock flow express as theproportion of biomass moving directionally from unit j to unit i. Weassume that two spatial units were neighbors if they sharea common administrative boundary and were connected by a majorroad. The final amount of available resource can be computed bymultiplying the rows of the contiguity matrix by a vector of resourceamong per spatial unit. In our work we simplified the contiguitymatrix by considering wi,j to be fixed to 0.5 for all spatial units, thusassuming a symmetric flow among neighbors. Such an approachcould be further generalized in two directions: first, by consideringa higher order of spatial relations with different contributionweights, like a first and second neighbor with one half and onefourth of contribution; second, by modeling a spatially varyingbidirectional flow of available resources. It is important to note thatspatial units along the borders of the study area may receive lessimportance due to their spatial relationships with other units.
4.5. Exploratory scenarios
In order to maximize the biogas yield and considering thereported in literature (see Section 4.1) combinations of feedstock
Table 8Pairwise comparison on the factors level of criteria resource availability. Scenario 3.
R2 R4 R5 R6 Relative importance(weight)
CR
R2 1 8 5 7 0.679 0.041R4 0.125 1 0.333 0.5 0.075R5 0.2 3 1 1 0.139R6 1 2 0.143 1 0.107
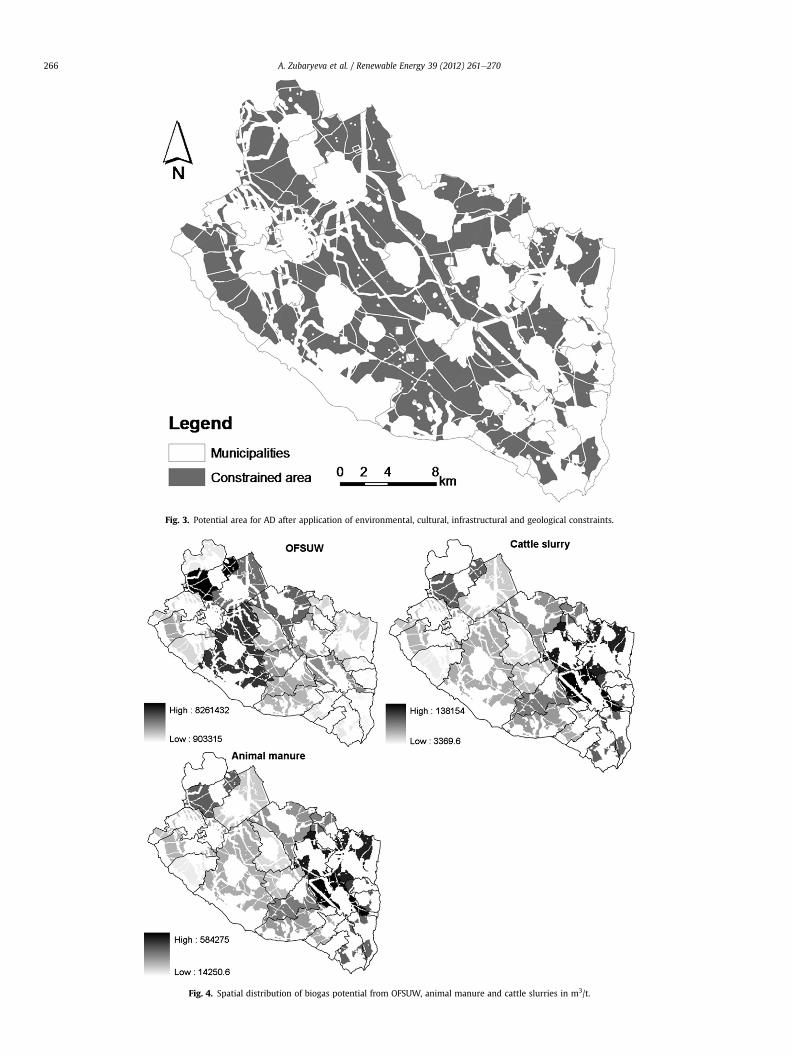
Fig. 3. Potential area for AD after application of environmental, cultural, infrastructural and geological constraints.
Fig. 4. Spatial distribution of biogas potential from OFSUW, animal manure and cattle slurries in m3/t.
A. Zubaryeva et al. / Renewable Energy 39 (2012) 261e270266

Fig. 5. Spatial distribution of biogas potential from olive oil cake, grape stalk and grape marc in m3/t.
A. Zubaryeva et al. / Renewable Energy 39 (2012) 261e270 267
for co-digestion under anaerobic conditions, in this work threescenarios were tested: (i) combination of OFSUW and animalmanurewith higher relative importance given to economic criteria;(ii) combination of OFSUW with cattle slurry, olive oil cake, grapemarc and grape stalk with higher relative importance assigned toresource availability criteria; (iii) combination OFSUW with grapemarc and stalk, with equal importance given to both criteria. Therelative importance and weights of factors in the pairwisecomparison matrix of the AHP are shown in Tables 6e8.
5. Results
5.1. Landcover characteristics due to constrains
After application of environmental, cultural, geological andother constraints, the resulting potentially available areas areapproximately 48% of the territory. High level of fragmentation isobserved in the southeastern part due to the presence of several
Table 9Energetic potential of analyzed feedstock sourcesa.
Feedstock OFSUW Cattle slurry Am
Energetic equivalent (GWh� year-1) High Low High Low H17.7 1.93 0.29 0.01 1
a Values obtained assuming the use of biogas for electricity production and considerin
protected areas such as Sites of Community Interest of Natura 2000network (up to 9% of the area).
Moreover, the coastal areas are uniformly not suitable for theconstruction projects due to the presence of natural parks bothterrestrial and marine and high concentration of cultural amenities(Fig. 3).
5.2. Areas with high theoretical biogas potential under contiguityanalysis
According to the multi-criteria GIS model, the highest theoret-ical potential for AD biogas production among the sources includedin the study belongs to olive oil cake, grape marc and OFSUW withclusters of higher availability located in the northern and north-western parts of the area (Figs. 4 and 5).
Following is the biogas potential from animal manure andcattle slurry, clusters of which are found in the eastern part. Whilethe lowest estimated biogas potential is registered for the grape
nimalanure
Olive oil cake Grape stalk Grape marc
igh Low High Low High Low High Low.25 0.03 8.47 0.78 0.13 0.0003 6.41 0.59
g an electric yield of 35%.

Fig. 6. Scenarios under different importance of criteria and feedstock combinations (Rmin¼ low importance of resource availability, Req¼ resource availability and economic criteriaobtain the same importance; Rmax¼resource availability is maximized).
A. Zubaryeva et al. / Renewable Energy 39 (2012) 261e270268
stalk, availability of which follows the pattern of grape marc(Table 9).
The reported costs of the pre-conversion of the feedstock intobiogas in the EU25 are on average 30 Euro/MWh for AD withoutfeed-in tariff and 40 Euro/MWh with feed-in [44]. Under theseassumptions and the data provided in Table 9, the highesteconomically viable potential for biogas production among theanalyzed feedstock belongs to OFSUW and olive oil cake, followingby grape marc and animal manure.
5.3. Exploratory scenarios
The common denominator for all three scenarios is that theareas in the South of WMA have the lowest or 0 potential for ADinstallations both from the point of view of resource and economicfactors availability (Fig. 6). While it results that the ideal areas forAD installations are the northerneeastern parts, repeated cluster ofwhich is observed in all three scenarios. These areas are located inthe more densely populated northern part of WMA, so the AD
instituted there may provide electricity to some major urbancenters.
The combination of the feedstock (OFSUWwith grape marc andstalk) in the third scenario results in more areas with higherpotential, slightly more clusterized towards the north when themaximum importance is given to resource availability criterion.Small clusters also appear towards the southeastern part when thefirst scenario is applied with the maximization of the economiccriteria importance (Fig. 6).
Overall, second scenario feedstock combination (OFSUW withcattle slurry, olive oil cake, grape marc and grape stalk) and weightattribution result in lowest area availability for biogas production.
6. Discussion and conclusions
The introduction of sustainable technologies is a very long-termand fragile process. New technologies often need to be supportedfor decades, before sufficient socio-technical momentum emerges.Therefore, the baseline conditions should be carefully evaluated
A. Zubaryeva et al. / Renewable Energy 39 (2012) 261e270 269
before the introduction of such technologies [45]. Biogas produc-tion through anaerobic digestion is one of those technologies. Theinitial introduction of these plants in the area at a farm scale shouldencourage further development of larger centralized biogas plantsas shown by Danish experience [45].
In this work, a rigorous approach for data collection and archi-tecture of the spatially explicit information system is proposed inorder to support the strategic planning for the introduction of ADsin the territory in the distributed electricity generation planning.The approach followed a two-step procedure: first the criteria weredeveloped based on the literature research of the key factorsinfluencing the introduction of the ADs in the given area, resultingin two criteria set described by six factors. Secondly, all factors werequantified and integrated in the geographical information systemin order to conduct further processing. The contiguity analysisassisted in the understanding of the feedstock flows between thedifferent municipalities, which in the hypothetical planningprocedure may encourage the inter-municipal collaboration tosustain the significant investments needed for the biogas plantinstallations and territorial clusters forming. Moreover, the incor-poration of multi-criteria analysis allowed a combination of themultiple factors influencing a decision-makers’ choice anda production of several scenarios instrumental when integratedwith the land use planning of the area.
It has been revealed that when it comes to the detailed analysisof the land availability at the local scale, application of multipleenvironmental and cultural constraints may reduce the physicalavailability of the area by up to a half. While the resource andinfrastructure accessibility would further constrain the examinedarea, leading to the formation of landscape clusters, which indi-cate the best suitable areas for AD development. The multi-criteriaGIS model suggests that the ADs should be located in the northernand northeastern parts of the studied area. These are the areaswhere the population density is higher and therefore the higherenergy demand could be partially addressed. Other isolatedpatches of high GIS model scores are located in the southern partof WMA, which could be ideal for the small-scale farm based ADsalimented by animal slurry and agricultural residues. The highestpotential for electric energy production was estimated for OFSUWand olive oil cake, while the lowest potential is the one for cattleslurry and grape stalk. Giving this was an indication that the lattershould be managed always together with the other types of ADfeedstock.
The additional value of this approach is that as required by thestream line research multiple sources of feedstock such as organicfraction of solid urban waste, biomass sources and animalproduction were estimated as to their potential to feed the AD. Inthis way the best waste management practices could be encour-aged for better waste recycling and waste sorting strategies at themunicipal level, since in the waste management policy hierarchy,the waste prevention, recycling and energy recovery are located athigher levels than waste disposal [4]. But also for the moresustainable and balanced planning of renewable energies at themunicipal and inter-municipal level through integration with thesimilar analysis for wind and solar energy.
It has been argued that “communicative” planning of renewableenergy is crucial for the smooth territorial integration of suchprojects at the local scale [45,46]. Meaning that participation ofdifferent stakeholders during the planning phase is fundamentalfor the maximization of renewable energy outputs. Therefore, ourapproach addresses the objective analysis of the area allowing thefirst screening for the intervention. The refining of the approachwould permit the integration of the stakeholder perceptionstowards the new technology by assigning the weights based on thepublic opinion and necessities of the constrained area.
Finally, the approach could be used for the strategic land useplanning when integrated with the current land use plans in orderto mitigate the consequences of the indirect land use change asa result of energy crop displacement.
Acknowledgements
Authors thank the anonymous reviewers for insightfulcomments on the first draft of the manuscript.
References
[1] Sims R, Schock R, Adegbululgbe A, Fenhann J, Konstantinaviciute I,Moomaw W, et al. Energy supply. In: Metz B, Davidson O, Bosch P, Dave R,Meyer L, editors. Climate change 2007: mitigation. contribution of workinggroup III to the fourth assessment report of the intergovernmental panel onclimate change. Cambridge: Cambridge University Press; 2007. p. 322.
[2] European Council. On the promotion of the use of energy from renewablesources and amending and subsequently repealing Directives 2001/77/EC and2003/30/EC. Off J Eur Union 2009;C 045E:0132e3. European Union, Brussels.
[3] I.E.A.OECD/IEA. World energy outlook. IEA; 2010. 731.[4] European Council. On the landfill waste. Off J Eur Union 1999;L82. European
Union, Brusselspp. 0001e0019.[5] Eur Obser’ER. Biogas barometer. Eur Obser’ER; 2010. 105e119.[6] Tricase C, Lombardi M. State of the art and prospects of Italian biogas
production from animal sewage: technicaleeconomic considerations. RenewEnergy 2009;34:477e85.
[7] Karellas S, Boukis I, Kontopoulos G. Development of an investment decisiontool for biogas production from agricultural waste. Renew Sustain Energy Rev2010;14:1273e82.
[8] Manfren M, Caputo P, Costa G. Paradigm shift in urban energy systemsthrough distributed generation. Appl Energy 2011;88:1032e48.
[9] Longden D, Brarnmer J, Bastin L, Cooper N. Distributed or centralised energy-from-waste policy? Implications of technology and scale at municipal level.Energy Policy 2007;35:2622e34.
[10] van der Horst D. NIMBY or not? Exploring the relevance of location and thepolitics of voiced opinions in renewable energy sitting controversies. EnergyPolicy 2007;35:2705e14.
[11] Wang JJ, Jing YY, Zhang CF, Zhao JH. Review on multi-criteria decision analysisaid in sustainable energy decision-making. Renew Sustain Energy Rev 2009;13:2263e78.
[12] Arampatzis G, Kiranoudis CT, Scaloubacas P, Assimacopoulos D. A GIS-baseddecision support system for planning urban transportation policies. Eur JOperat Res 2004;152:465e75.
[13] Janke JR. Multicriteria GIS modeling of wind and solar farms in Colorado.Renew Energy 2010;35:2228e34.
[14] Jiang H, Eastman JR. Application of fuzzy measures in multi-criteria evaluationin GIS. Int J Geogr Inform Sci 2000;14:173e84.
[15] Vizzari M. Spatial modelling of potential landscape quality. Appl Geogry 2011;31:108e18.
[16] Haddad MA, Anderson PF. A GIS methodology to identify potential corn stovercollection locations. Biomass Bioenergy 2008;32:1097e108.
[17] Fiorese G, Guariso G. A GIS-based approach to evaluate biomass potentialfrom energy crops at regional scale. Environ Model Softw 2010;25:702e11.
[18] Dagnall S, Hill J, Pegg D. Resource mapping and analysis of farm livestockmanures e assessing the opportunities for biomass-to-energy schemes. Bio-resour Technol 2000;71:225e34.
[19] Ma JG, Scott NR, DeGloria SD, Lembo AJ. Siting analysis of farm-basedcentralized anaerobic digester systems for distributed generation using GIS.Biomass Bioenergy 2005;28:591e600.
[20] Batzias FA, Sidiras DK, Spyrou EK. Evaluating livestock manures for biogasproduction: a GIS based method. Renew Energy 2005;30:1161e76.
[21] Bryan BA, Ward J, Hobbs T. An assessment of the economic and. environ-mental potential of biomass production in an agricultural region. Land UsePolicy 2008;25:533e49.
[22] Poeschl M, Ward S, Owende P. Prospects for expanded utilization of biogas inGermany. Renew Sustain Energy Rev 2010;14:1782e97.
[23] Angelis-Dimakis A, Biberacher M, Dominguez J, Fiorese G, Gadocha S,Gnansounou E, et al. Methods and tools to evaluate the availability ofrenewable energy sources. Renew Sustain Energy Rev 2011;15:1182e200.
[24] Gulli F. Small distributed generation versus centralised supply: a social cost-benefit analysis in the residential and service sectors. Energy Policy 2006;34:804e32.
[25] Calvert K. Geomatics and bioenergy feasibility assessments: taking stock andlooking forward. Renew Sustain Energy Rev 2011;15:1117e24.
[26] I.N.D.S. ISTAT, Demografia in cifre; 2009.[27] A.R.Administration. Piano regionale di gestione dei rifiuti: aggiornamento con
completamento e modifica. In: Puglia R, editor. Boll della Region Puglia; 2005.p. 15147e721. Bari.
[28] Ward AJ, Hobbs PJ, Holliman PJ, Jones DL. Optimisation of the anaerobicdigestion of agricultural resources. Bioresour Technol 2008;99:7928e40.

A. Zubaryeva et al. / Renewable Energy 39 (2012) 261e270270
[29] Bolzonella D, Battistoni P, Susini C, Cecchi F. Anaerobic codigestion of wasteactivated sludge and OFMSW: the experiences of Viareggio and Treviso plants(Italy). Water Sci Technol 2006;53:203e11.
[30] Alatriste-Mondragon F, Samar P, Cox HHJ, Ahring BK, Iranpour R. Anaerobiccodigestion of municipal, farm, and industrial organic wastes: a survey ofrecent literature. Water Environ Res 2006;78:607e36.
[31] Hartmann H, Ahring BK. Anaerobic digestion of the organic fraction ofmunicipal solid waste: influence of co-digestion with manure. Water Res2005;39:1543e52.
[32] Li RP, Chen SL, Li XJ. Biogas production from anaerobic co-digestion of foodwaste with dairy manure in a two-phase digestion system. Appl BiochemBiotechnol 2010;160:643e54.
[33] Callaghan FJ, Wase DAJ, Thayanithy K, Forster CF. Continuous co-digestion ofcattle slurry with fruit and vegetable wastes and chicken manure. BiomassBioenergy 2002;22:71e7.
[34] Azbar N, Bayram A, Filibeli A, Muezzinoglu A, Sengul F, Ozer A. A review ofwaste management options in olive oil production. Crit Rev Environ SciTechnol 2004;34:209e47.
[35] Azbar N, Keskin T, Yuruyen A. Enhancement of biogas production from olivemill effluent (OME) by co-digestion. Biomass Bioenergy 2008;32:1195e201.
[36] Palmowski L. Making energy from grape marc using anaerobic digestion,Australian and New Zealand grapegrower and winemaker. Austr New ZealandGrapegrower Winemaker 2004;491:50e2.
[37] Dinuccio E, Balsari P, Gioelli F, Menardo S. Evaluation of the biogas produc-tivity potential of some Italian agro-industrial biomasses. Bioresour Technol2010;101:3780e3.
[38] Bouallagui H, Touhami Y, Cheikh RB, Hamdi M. Bioreactor performance inanaerobic digestion of fruit and vegetable wastes. Process Biochem 2005;40:989e95.
[39] Menardo S, Gioelli F, Balsari P. The methane yield of digestate: effect oforganic loading rate, hydraulic retention time, and plant feeding. BioresourTechnol 2011;102:2348e51.
[40] CTI. Analisi technica delle potenzialità di diffusione degli impianti in provinciadi Sondrio. Valutazione delle potenzialità di diffusione di impianti di biogasaziendali e/o consortili alimentati a biomassa, residui agroalimentari e fra-zione organica dei rifiuti solidi urbani. Progetto Interreg IIIA Italia e Svizzera.Italian Termotechnical Committee (CTI); 2007.
[41] ESRI. ArcGIS spatial analyst: advanced GIS spatial analysis using raster andvector data. An ESRI white paper. Redlands: ESRI; 2001. 13.
[42] Boroushaki S, Malczewski J. Implementing an extension of the analyticalhierarchy process using ordered weighted averaging operators with fuzzyquantifiers in ArcGIS. Comput Geosci 2008;34:399e410.
[43] Saaty T. The analytic hierarchy process: planning, priority setting, resourceallocation. New York: McGraw-Hill; 1980. p. 287.
[44] EEA. Maximising the environmental benefits of Europe’s bioenergy potential.European Environmental Agency; 2008. p. 94.
[45] Raven RPJM, Gregersen KH. Biogas plants in Denmark: successes and setbacks.Renew Sustain Energy Rev 2007;11:116e32.
[46] Nadai A. “Planning”, “siting” and the local acceptance of wind power: somelessons from the French case. Energy Policy 2007;35:2715e26.
[47] Assessorato all'ecologia, Apulia Region; 2010. Database on wastes per WMAand municipality. Available at http://www.rifiutiebonifica.puglia.it/.
[48] Apulia Region Territorial Information System; 2010, Available at http://www.sit.puglia.it/.
[49] Pellerano A, Pantaleo P, Tenerelli M, Capone A. Studio per la valorizzazioneenergetica di biomasses agro-forestali nella Regione Puglia. DipartimentoPROGESA, Università di Bari; 2007, p. 211.
[50] N.Z.D. Database, Anagrafe Zootechnica. CSN di IZS Abruzzo e Molise; 2010.