spatial architecture of the immune microenvironment
TRANSCRIPT
Fu et al. J Hematol Oncol (2021) 14:98 https://doi.org/10.1186/s13045-021-01103-4
REVIEW
Spatial architecture of the immune microenvironment orchestrates tumor immunity and therapeutic responseTong Fu1,2†, Lei‑Jie Dai1,2†, Song‑Yang Wu1,2, Yi Xiao1,2, Ding Ma1,2*, Yi‑Zhou Jiang1,2* and Zhi‑Ming Shao1,2*
Abstract
Tumors are not only aggregates of malignant cells but also well‑organized complex ecosystems. The immunologi‑cal components within tumors, termed the tumor immune microenvironment (TIME), have long been shown to be strongly related to tumor development, recurrence and metastasis. However, conventional studies that underestimate the potential value of the spatial architecture of the TIME are unable to completely elucidate its complexity. As innova‑tive high‑flux and high‑dimensional technologies emerge, researchers can more feasibly and accurately detect and depict the spatial architecture of the TIME. These findings have improved our understanding of the complexity and role of the TIME in tumor biology. In this review, we first epitomized some representative emerging technologies in the study of the spatial architecture of the TIME and categorized the description methods used to characterize these structures. Then, we determined the functions of the spatial architecture of the TIME in tumor biology and the effects of the gradient of extracellular nonspecific chemicals (ENSCs) on the TIME. We also discussed the potential clinical value of our understanding of the spatial architectures of the TIME, as well as current limitations and future prospects in this novel field. This review will bring spatial architectures of the TIME, an emerging dimension of tumor ecosystem research, to the attention of more researchers and promote its application in tumor research and clinical practice.
Keywords: Tumor immunity, Tumor immune microenvironment, Spatial architecture, Immunotherapy
© The Author(s) 2021. Open Access This article is licensed under a Creative Commons Attribution 4.0 International License, which permits use, sharing, adaptation, distribution and reproduction in any medium or format, as long as you give appropriate credit to the original author(s) and the source, provide a link to the Creative Commons licence, and indicate if changes were made. The images or other third party material in this article are included in the article’s Creative Commons licence, unless indicated otherwise in a credit line to the material. If material is not included in the article’s Creative Commons licence and your intended use is not permitted by statutory regulation or exceeds the permitted use, you will need to obtain permission directly from the copyright holder. To view a copy of this licence, visit http:// creat iveco mmons. org/ licen ses/ by/4. 0/. The Creative Commons Public Domain Dedication waiver (http:// creat iveco mmons. org/ publi cdoma in/ zero/1. 0/) applies to the data made available in this article, unless otherwise stated in a credit line to the data.
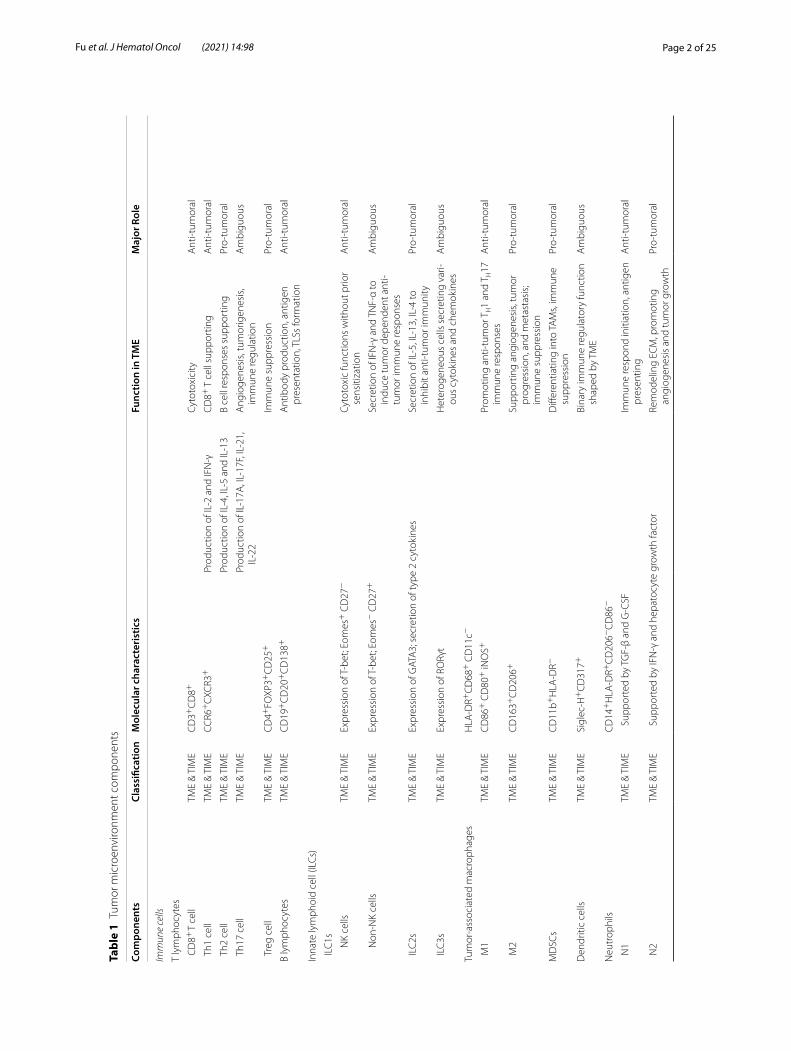
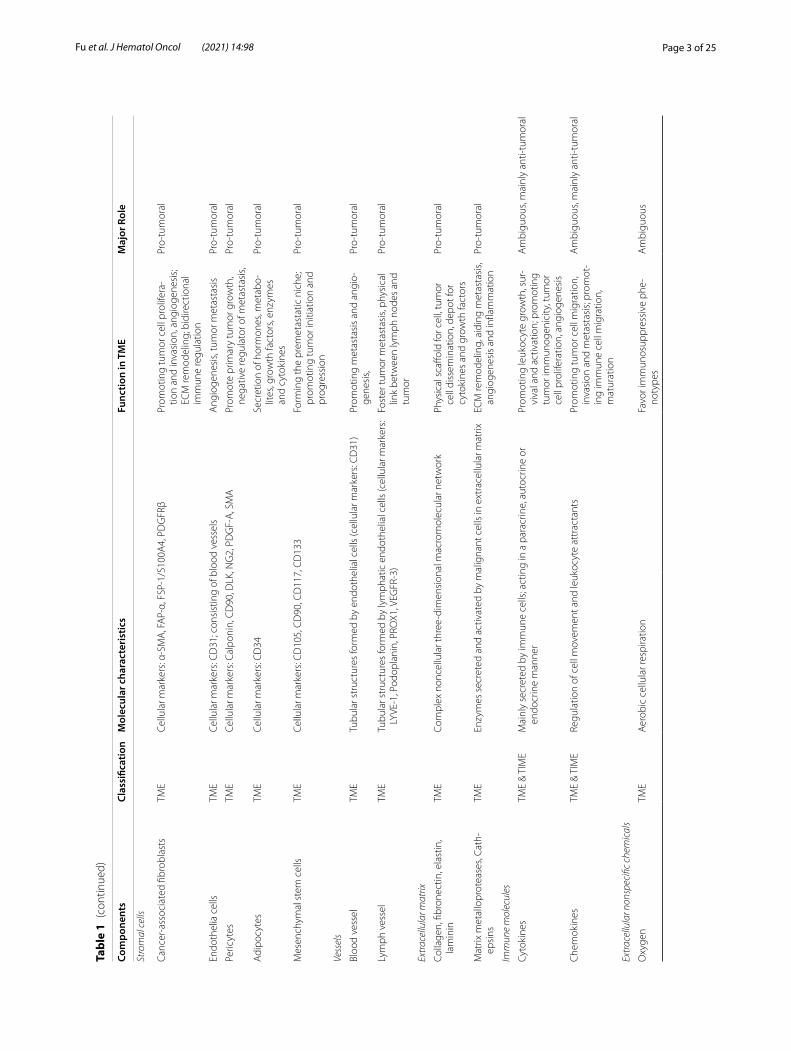
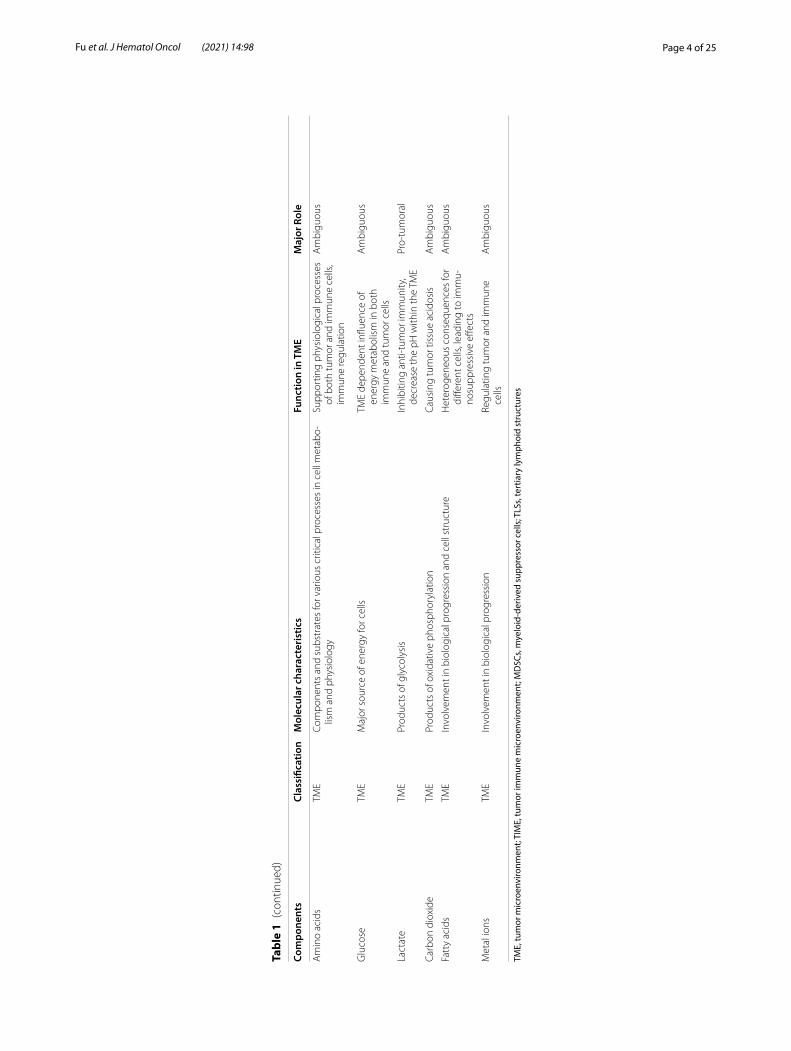
BackgroundOver the past few centuries, the concept of tumor has evolved from a simple aggregation of abnormally pro-liferating cells into a highly organized “organ”. Various components that compose tumors are termed the tumor microenvironment (TME) (1). Although the specific composition of the TME varies between tumor types, most of them share hallmark characteristics, includ-ing tumor cells, immune cells, stromal cells, extracellu-lar matrix (ECM), vessels, soluble factors, and physical
properties (Table 1) (2–5). Within the TME, all immune components are specifically defined as the tumor immune microenvironment (TIME) because of their unique internal interactions and essential roles in tumor biology, which comprises innate immune cells, adaptive immune cells, extracellular immune factors, and cell sur-face molecules (4, 6, 7). Studies have focused on the com-position of immune cells in the TIME, and established mature theories and clinical applications (4, 8). For exam-ple, triple-negative breast cancer (TNBC) with more T cell infiltration generally presents better prognosis than those with less T cell inflamed (9). However, findings that patients with similar compositions of infiltrating immune cells have different prognoses are not well explained (10, 11), suggesting further exploration is needed on the TIME.
Open Access
*Correspondence: [email protected]; [email protected]; [email protected]†Tong Fu and Lei‑Jie Dai contributed equally to this manuscript1 Department of Breast Surgery, Fudan University Shanghai Cancer Center, Shanghai 200032, ChinaFull list of author information is available at the end of the article
Page 2 of 25Fu et al. J Hematol Oncol (2021) 14:98
Tabl
e 1
Tum
or m
icro
envi
ronm
ent c
ompo
nent
s
Com
pone
nts
Clas
sific
atio
nM
olec
ular
cha
ract
eris
tics
Func
tion
in T
ME
Maj
or R
ole
Imm
une
cells
T ly
mph
ocyt
es
CD
8+ T
cell
TME
& TI
ME
CD
3+C
D8+
Cyto
toxi
city
Ant
i‑tum
oral
Th1
cel
lTM
E &
TIM
ECC
R6+
CXC
R3+
Prod
uctio
n of
IL‑2
and
IFN
‑γC
D8+
T c
ell s
uppo
rtin
gA
nti‑t
umor
al
Th2
cel
lTM
E &
TIM
EPr
oduc
tion
of IL
‑4, I
L‑5
and
IL‑1
3B
cell
resp
onse
s su
ppor
ting
Pro‑
tum
oral
Th1
7 ce
llTM
E &
TIM
EPr
oduc
tion
of IL
‑17A
, IL‑
17F,
IL‑2
1,
IL‑2
2A
ngio
gene
sis,
tum
orig
enes
is,
imm
une
regu
latio
nA
mbi
guou
s
Tre
g ce
llTM
E &
TIM
EC
D4+
FOXP
3+C
D25
+Im
mun
e su
ppre
ssio
nPr
o‑tu
mor
al
B ly
mph
ocyt
esTM
E &
TIM
EC
D19
+C
D20
+C
D13
8+
Ant
ibod
y pr
oduc
tion,
ant
igen
pr
esen
tatio
n, T
LSs
form
atio
nA
nti‑t
umor
al
Inna
te ly
mph
oid
cell
(ILC
s)
ILC
1s
NK
cells
TME
& TI
ME
Expr
essi
on o
f T‑b
et; E
omes
+ C
D27
−Cy
toto
xic
func
tions
with
out p
rior
sens
itiza
tion
Ant
i‑tum
oral
Non
‑NK
cells
TME
& TI
ME
Expr
essi
on o
f T‑b
et; E
omes
− C
D27
+Se
cret
ion
of IF
N‑γ
and
TN
F‑α
to
indu
ce tu
mor
dep
ende
nt a
nti‑
tum
or im
mun
e re
spon
ses
Am
bigu
ous
ILC
2sTM
E &
TIM
EEx
pres
sion
of G
ATA
3; s
ecre
tion
of ty
pe 2
cyt
okin
esSe
cret
ion
of IL
‑5, I
L‑13
, IL‑
4 to
in
hibi
t ant
i‑tum
or im
mun
ityPr
o‑tu
mor
al
ILC
3sTM
E &
TIM
EEx
pres
sion
of R
ORγ
tH
eter
ogen
eous
cel
ls s
ecre
ting
vari‑
ous
cyto
kine
s an
d ch
emok
ines
Am
bigu
ous
Tum
or‑a
ssoc
iate
d m
acro
phag
esH
LA‑D
R+C
D68
+ C
D11
c−
M1
TME
& TI
ME
CD
86+
CD
80+
iNO
S+Pr
omot
ing
anti‑
tum
or T
H1
and
T H17
im
mun
e re
spon
ses
Ant
i‑tum
oral
M2
TME
& TI
ME
CD
163+
CD
206+
Supp
ortin
g an
giog
enes
is, t
umor
pr
ogre
ssio
n, a
nd m
etas
tasi
s; im
mun
e su
ppre
ssio
n
Pro‑
tum
oral
MD
SCs
TME
& TI
ME
CD
11b+
HLA
‑DR−
Diff
eren
tiatin
g in
to TA
Ms,
imm
une
supp
ress
ion
Pro‑
tum
oral
Den
driti
c ce
llsTM
E &
TIM
ESi
glec
‑H+
CD
317+
Bina
ry im
mun
e re
gula
tory
func
tion
shap
ed b
y TM
EA
mbi
guou
s
Neu
trop
hils
CD
14+
HLA
‑DR+
CD
206−
CD
86−
N1
TME
& TI
ME
Sup
port
ed b
y TG
F‑β
and
G‑C
SFIm
mun
e re
spon
d in
itiat
ion,
ant
igen
pr
esen
ting
Ant
i‑tum
oral
N2
TME
& TI
ME
Sup
port
ed b
y IF
N‑γ
and
hep
atoc
yte
grow
th fa
ctor
Rem
odel
ing
ECM
, pro
mot
ing
angi
ogen
esis
and
tum
or g
row
thPr
o‑tu
mor
al
Page 3 of 25Fu et al. J Hematol Oncol (2021) 14:98
Tabl
e 1
(con
tinue
d)
Com
pone
nts
Clas
sific
atio
nM
olec
ular
cha
ract
eris
tics
Func
tion
in T
ME
Maj
or R
ole
Stro
mal
cel
ls
Canc
er‑a
ssoc
iate
d fib
robl
asts
TME
Cellu
lar m
arke
rs: α
‑SM
A, F
AP‑
α, F
SP‑1
/S10
0A4,
PD
GFR
βPr
omot
ing
tum
or c
ell p
rolif
era‑
tion
and
inva
sion
, ang
ioge
nesi
s; EC
M re
mod
elin
g; b
idire
ctio
nal
imm
une
regu
latio
n
Pro‑
tum
oral
Endo
thel
ia c
ells
TME
Cellu
lar m
arke
rs: C
D31
; con
sist
ing
of b
lood
ves
sels
Ang
ioge
nesi
s, tu
mor
met
asta
sis
Pro‑
tum
oral
Peric
ytes
TME
Cellu
lar m
arke
rs: C
alpo
nin,
CD
90, D
LK, N
G2,
PD
GF‑
A, S
MA
Prom
ote
prim
ary
tum
or g
row
th,
nega
tive
regu
lato
r of m
etas
tasi
s,Pr
o‑tu
mor
al
Adi
pocy
tes
TME
Cellu
lar m
arke
rs: C
D34
Secr
etio
n of
hor
mon
es, m
etab
o‑lit
es, g
row
th fa
ctor
s, en
zym
es
and
cyto
kine
s
Pro‑
tum
oral
Mes
ench
ymal
ste
m c
ells
TME
Cellu
lar m
arke
rs: C
D10
5, C
D90
, CD
117,
CD
133
Form
ing
the
prem
etas
tatic
nic
he;
prom
otin
g tu
mor
initi
atio
n an
d pr
ogre
ssio
n
Pro‑
tum
oral
Vess
els
Bloo
d ve
ssel
TME
Tubu
lar s
truc
ture
s fo
rmed
by
endo
thel
ial c
ells
(cel
lula
r mar
kers
: CD
31)
Prom
otin
g m
etas
tasi
s an
d an
gio‑
gene
sis,
Pro‑
tum
oral
Lym
ph v
esse
lTM
ETu
bula
r str
uctu
res
form
ed b
y ly
mph
atic
end
othe
lial c
ells
(cel
lula
r mar
kers
: LY
VE‑1
, Pod
opla
nin,
PRO
X1, V
EGFR
‑3)
Fost
er tu
mor
met
asta
sis,
phys
ical
lin
k be
twee
n ly
mph
nod
es a
nd
tum
or
Pro‑
tum
oral
Extr
acel
lula
r mat
rix
Colla
gen,
fibr
onec
tin, e
last
in,
lam
inin
TME
Com
plex
non
cellu
lar t
hree
‑dim
ensi
onal
mac
rom
olec
ular
net
wor
kPh
ysic
al s
caffo
ld fo
r cel
l, tu
mor
ce
ll di
ssem
inat
ion,
dep
ot fo
r cy
toki
nes
and
grow
th fa
ctor
s
Pro‑
tum
oral
Mat
rix m
etal
lopr
otea
ses,
Cath
‑ep
sins
TME
Enzy
mes
sec
rete
d an
d ac
tivat
ed b
y m
alig
nant
cel
ls in
ext
race
llula
r mat
rixEC
M re
mod
elin
g, a
idin
g m
etas
tasi
s, an
giog
enes
is a
nd in
flam
mat
ion
Pro‑
tum
oral
Imm
une
mol
ecul
es
Cyto
kine
sTM
E &
TIM
EM
ainl
y se
cret
ed b
y im
mun
e ce
lls; a
ctin
g in
a p
arac
rine,
aut
ocrin
e or
en
docr
ine
man
ner
Prom
otin
g le
ukoc
yte
grow
th, s
ur‑
viva
l and
act
ivat
ion;
pro
mot
ing
tum
or im
mun
ogen
icity
, tum
or
cell
prol
ifera
tion,
ang
ioge
nesi
s
Am
bigu
ous,
mai
nly
anti‑
tum
oral
Che
mok
ines
TME
& TI
ME
Regu
latio
n of
cel
l mov
emen
t and
leuk
ocyt
e at
trac
tant
sPr
omot
ing
tum
or c
ell m
igra
tion,
in
vasi
on a
nd m
etas
tasi
s; pr
omot
‑in
g im
mun
e ce
ll m
igra
tion,
m
atur
atio
n
Am
bigu
ous,
mai
nly
anti‑
tum
oral
Extr
acel
lula
r non
spec
ific
chem
ical
s
Oxy
gen
TME
Aer
obic
cel
lula
r res
pira
tion
Favo
r im
mun
osup
pres
sive
phe
‑no
type
sA
mbi
guou
s
Page 4 of 25Fu et al. J Hematol Oncol (2021) 14:98
Tabl
e 1
(con
tinue
d)
Com
pone
nts
Clas
sific
atio
nM
olec
ular
cha
ract
eris
tics
Func
tion
in T
ME
Maj
or R
ole
Am
ino
acid
sTM
ECo
mpo
nent
s an
d su
bstr
ates
for v
ario
us c
ritic
al p
roce
sses
in c
ell m
etab
o‑lis
m a
nd p
hysi
olog
ySu
ppor
ting
phys
iolo
gica
l pro
cess
es
of b
oth
tum
or a
nd im
mun
e ce
lls,
imm
une
regu
latio
n
Am
bigu
ous
Glu
cose
TME
Maj
or s
ourc
e of
ene
rgy
for c
ells
TME
depe
nden
t infl
uenc
e of
en
ergy
met
abol
ism
in b
oth
imm
une
and
tum
or c
ells
Am
bigu
ous
Lact
ate
TME
Prod
ucts
of g
lyco
lysi
sIn
hibi
ting
anti‑
tum
or im
mun
ity,
decr
ease
the
pH w
ithin
the
TME
Pro‑
tum
oral
Carb
on d
ioxi
deTM
EPr
oduc
ts o
f oxi
dativ
e ph
osph
oryl
atio
nCa
usin
g tu
mor
tiss
ue a
cido
sis
Am
bigu
ous
Fatt
y ac
ids
TME
Invo
lvem
ent i
n bi
olog
ical
pro
gres
sion
and
cel
l str
uctu
reH
eter
ogen
eous
con
sequ
ence
s fo
r di
ffere
nt c
ells
, lea
ding
to im
mu‑
nosu
ppre
ssiv
e eff
ects
Am
bigu
ous
Met
al io
nsTM
EIn
volv
emen
t in
biol
ogic
al p
rogr
essi
onRe
gula
ting
tum
or a
nd im
mun
e ce
llsA
mbi
guou
s
TME,
tum
or m
icro
envi
ronm
ent;
TIM
E, tu
mor
imm
une
mic
roen
viro
nmen
t; M
DSC
s, m
yelo
id-d
eriv
ed s
uppr
esso
r cel
ls; T
LSs,
tert
iary
lym
phoi
d st
ruct
ures
Page 5 of 25Fu et al. J Hematol Oncol (2021) 14:98
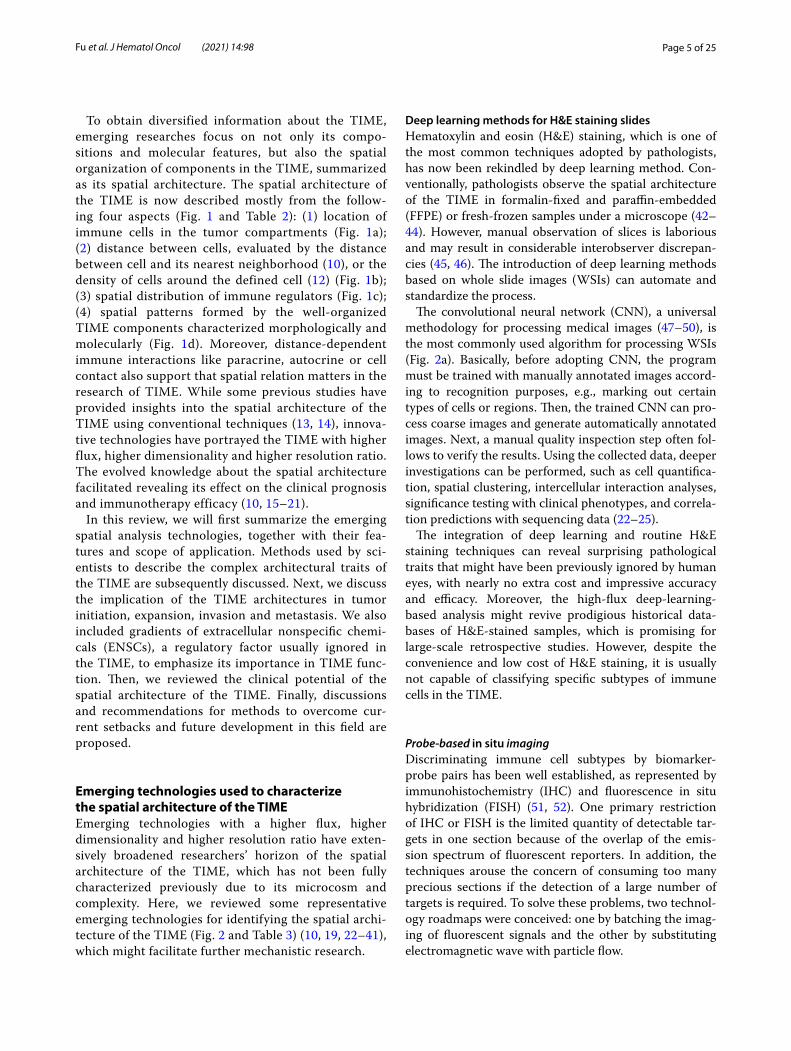
To obtain diversified information about the TIME, emerging researches focus on not only its compo-sitions and molecular features, but also the spatial organization of components in the TIME, summarized as its spatial architecture. The spatial architecture of the TIME is now described mostly from the follow-ing four aspects (Fig. 1 and Table 2): (1) location of immune cells in the tumor compartments (Fig. 1a); (2) distance between cells, evaluated by the distance between cell and its nearest neighborhood (10), or the density of cells around the defined cell (12) (Fig. 1b); (3) spatial distribution of immune regulators (Fig. 1c); (4) spatial patterns formed by the well-organized TIME components characterized morphologically and molecularly (Fig. 1d). Moreover, distance-dependent immune interactions like paracrine, autocrine or cell contact also support that spatial relation matters in the research of TIME. While some previous studies have provided insights into the spatial architecture of the TIME using conventional techniques (13, 14), innova-tive technologies have portrayed the TIME with higher flux, higher dimensionality and higher resolution ratio. The evolved knowledge about the spatial architecture facilitated revealing its effect on the clinical prognosis and immunotherapy efficacy (10, 15–21).
In this review, we will first summarize the emerging spatial analysis technologies, together with their fea-tures and scope of application. Methods used by sci-entists to describe the complex architectural traits of the TIME are subsequently discussed. Next, we discuss the implication of the TIME architectures in tumor initiation, expansion, invasion and metastasis. We also included gradients of extracellular nonspecific chemi-cals (ENSCs), a regulatory factor usually ignored in the TIME, to emphasize its importance in TIME func-tion. Then, we reviewed the clinical potential of the spatial architecture of the TIME. Finally, discussions and recommendations for methods to overcome cur-rent setbacks and future development in this field are proposed.
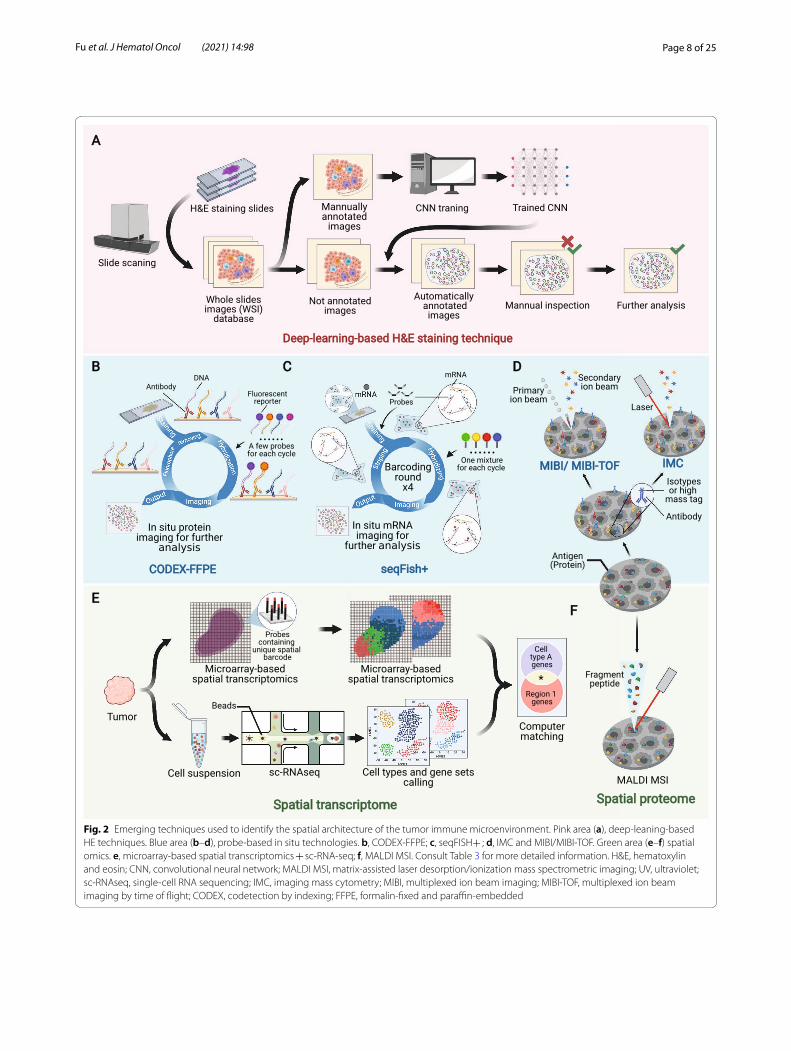
Emerging technologies used to characterize the spatial architecture of the TIMEEmerging technologies with a higher flux, higher dimensionality and higher resolution ratio have exten-sively broadened researchers’ horizon of the spatial architecture of the TIME, which has not been fully characterized previously due to its microcosm and complexity. Here, we reviewed some representative emerging technologies for identifying the spatial archi-tecture of the TIME (Fig. 2 and Table 3) (10, 19, 22–41), which might facilitate further mechanistic research.
Deep learning methods for H&E staining slidesHematoxylin and eosin (H&E) staining, which is one of the most common techniques adopted by pathologists, has now been rekindled by deep learning method. Con-ventionally, pathologists observe the spatial architecture of the TIME in formalin-fixed and paraffin-embedded (FFPE) or fresh-frozen samples under a microscope (42–44). However, manual observation of slices is laborious and may result in considerable interobserver discrepan-cies (45, 46). The introduction of deep learning methods based on whole slide images (WSIs) can automate and standardize the process.
The convolutional neural network (CNN), a universal methodology for processing medical images (47–50), is the most commonly used algorithm for processing WSIs (Fig. 2a). Basically, before adopting CNN, the program must be trained with manually annotated images accord-ing to recognition purposes, e.g., marking out certain types of cells or regions. Then, the trained CNN can pro-cess coarse images and generate automatically annotated images. Next, a manual quality inspection step often fol-lows to verify the results. Using the collected data, deeper investigations can be performed, such as cell quantifica-tion, spatial clustering, intercellular interaction analyses, significance testing with clinical phenotypes, and correla-tion predictions with sequencing data (22–25).
The integration of deep learning and routine H&E staining techniques can reveal surprising pathological traits that might have been previously ignored by human eyes, with nearly no extra cost and impressive accuracy and efficacy. Moreover, the high-flux deep-learning-based analysis might revive prodigious historical data-bases of H&E-stained samples, which is promising for large-scale retrospective studies. However, despite the convenience and low cost of H&E staining, it is usually not capable of classifying specific subtypes of immune cells in the TIME.
Probe‑based in situ imagingDiscriminating immune cell subtypes by biomarker-probe pairs has been well established, as represented by immunohistochemistry (IHC) and fluorescence in situ hybridization (FISH) (51, 52). One primary restriction of IHC or FISH is the limited quantity of detectable tar-gets in one section because of the overlap of the emis-sion spectrum of fluorescent reporters. In addition, the techniques arouse the concern of consuming too many precious sections if the detection of a large number of targets is required. To solve these problems, two technol-ogy roadmaps were conceived: one by batching the imag-ing of fluorescent signals and the other by substituting electromagnetic wave with particle flow.

Page 6 of 25Fu et al. J Hematol Oncol (2021) 14:98
For the first strategy, several methods were proposed. Adopted from Codetection by indexing (CODEX) (28), CODEX-FFPE is a system based on special antibodies conjugated with single-strand DNA, which is suitable for both FFPE samples and tissue microarrays (Fig. 2b). The target protein is detected by DNA-conjugated antibod-ies, and then, imaging cycle starts. In each imaging cycle, only a few kinds of complementary DNA chains linked with different fluorescent reporters are added to image.
Then, these complementary DNA chains are striped to undergo another cycle. And there have been commercial version of CODEX-FFPE provided (10). CorFISH (29), seqFISH + (30) and seqFISH (31) are a series of tech-nologies that exploit two classes of oligonucleotide DNA probes (Fig. 2c). Each primary probe contains 5 domains including one for binding target mRNA and 4 for bind-ing secondary probes. In each cycle of imaging, an exqui-sitely predesigned mixture of secondary probes labeled
Fig. 1 Definition and components of the spatial architecture of the tumor immune microenvironment (TIME). The spatial architecture is described according to the location of immune cells (a), distance between cells (b), distribution of immunoregulators (c), and specific spatial patterns (d)
Page 7 of 25Fu et al. J Hematol Oncol (2021) 14:98
with different fluorescence reporters is added, and thus, mRNAs will be marked with different colors. Then, these secondary probes are eluted, and a new hybridization cycle starts. The mRNAs will be hybridized with another mixture of secondary probes. After several cycles, nucle-otide sequences of mRNA molecules in situ can be deci-phered from the unique array of colors in corresponding location.
Mass spectrometry is another strategy for improv-ing IHC and FISH (53, 54). While signal of fluores-cent reporters consists of a consecutive range of light spectrum, mass spectrometric signal is discrete peaks, endowing it with higher resolution to discriminate differ-ent reporters. Besides, the cell-by-cell scanning manner used in mass-spectrometry-based techniques can also achieve a higher spatial resolution. Multiplexed ion beam imaging (MIBI) (19) and multiplexed ion beam imag-ing by time of flight (MIBI-TOF) (32, 33) take advantage of antibodies labeled with isotypes (Fig. 2d). And dur-ing scanning, these isotypes can be excited by primary oxygen ion beam to form secondary ion beam. Another technique called imaging mass cytometry (IMC) works in an analogous way but uses laser to activate isotypes (Fig. 2d). And notably, IMC does not necessarily need antibody probes to label cells, but also uses endogenous or exogenous tissue-specific chemicals, such as iodine isotopes in the thyroid, to achieve imaging (34, 35).
After the generation of raw images, pathologists can perform further processing and refinement, such as the segregation of cells, classification of immune cells and
other analyses, facilitated by bioinformatics tools. Probe-based in situ technology is characterized by its detailed preservation of spatial information and relatively low cost in large-scale applications. Nevertheless, probe-based technologies only detect known targets with existing probes. Thus, they are not suitable for detecting novel biological events, such as undefined molecules.
Spatial transcriptome and proteomeOmics techniques are ideal for conducting de novo inves-tigations or revealing the landscape of the TIME due to their probe-free traits, high flux, and large capacity. Cur-rently, the spatial transcriptome and spatial proteome are the two most commonly used spatial omics technologies.
One representative kind of spatial transcriptome is microarray-based spatial transcriptomics (Fig. 2e) (36). On the microarray chip used for the detection of his-tological sections, there are massive probes containing unique positional barcodes for locating. The barcodes can be sequenced in the subsequent sequencing, thus enabling the mapping of transcriptome information to histological sections. Microarray-based spatial tran-scriptomics combines transcriptome and histology to extend transcriptome to a 2-D dimension, and has been commercialized and adopted in the researches of several malignancies (55–58). However, the spatial resolution of microarray-based spatial transcriptomics is limited that it only has a minimal resolution power of discriminating 10–200 cells. Thus, Moncada et al. (37) combined micro-array-based spatial transcriptomics with single-cell RNA
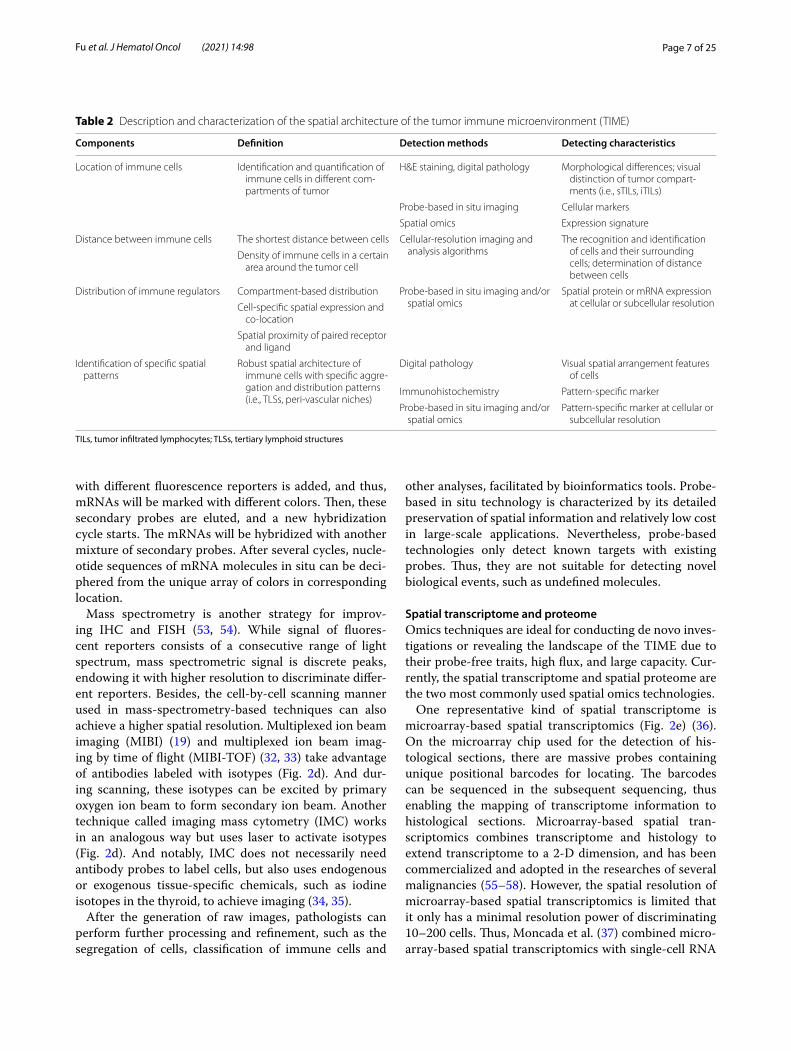
Table 2 Description and characterization of the spatial architecture of the tumor immune microenvironment (TIME)
TILs, tumor infiltrated lymphocytes; TLSs, tertiary lymphoid structures
Components Definition Detection methods Detecting characteristics
Location of immune cells Identification and quantification of immune cells in different com‑partments of tumor
H&E staining, digital pathology Morphological differences; visual distinction of tumor compart‑ments (i.e., sTILs, iTILs)
Probe‑based in situ imaging Cellular markers
Spatial omics Expression signature
Distance between immune cells The shortest distance between cells Cellular‑resolution imaging and analysis algorithms
The recognition and identification of cells and their surrounding cells; determination of distance between cells
Density of immune cells in a certain area around the tumor cell
Distribution of immune regulators Compartment‑based distribution Probe‑based in situ imaging and/or spatial omics
Spatial protein or mRNA expression at cellular or subcellular resolutionCell‑specific spatial expression and
co‑location
Spatial proximity of paired receptor and ligand
Identification of specific spatial patterns
Robust spatial architecture of immune cells with specific aggre‑gation and distribution patterns (i.e., TLSs, peri‑vascular niches)
Digital pathology Visual spatial arrangement features of cells
Immunohistochemistry Pattern‑specific marker
Probe‑based in situ imaging and/or spatial omics
Pattern‑specific marker at cellular or subcellular resolution
Page 8 of 25Fu et al. J Hematol Oncol (2021) 14:98
Fig. 2 Emerging techniques used to identify the spatial architecture of the tumor immune microenvironment. Pink area (a), deep‑leaning‑based HE techniques. Blue area (b–d), probe‑based in situ technologies. b, CODEX‑FFPE; c, seqFISH+ ; d, IMC and MIBI/MIBI‑TOF. Green area (e–f) spatial omics. e, microarray‑based spatial transcriptomics + sc‑RNA‑seq; f, MALDI MSI. Consult Table 3 for more detailed information. H&E, hematoxylin and eosin; CNN, convolutional neural network; MALDI MSI, matrix‑assisted laser desorption/ionization mass spectrometric imaging; UV, ultraviolet; sc‑RNAseq, single‑cell RNA sequencing; IMC, imaging mass cytometry; MIBI, multiplexed ion beam imaging; MIBI‑TOF, multiplexed ion beam imaging by time of flight; CODEX, codetection by indexing; FFPE, formalin‑fixed and paraffin‑embedded

Page 9 of 25Fu et al. J Hematol Oncol (2021) 14:98
Tabl
e 3
Emer
ging
tech
niqu
es to
iden
tify
spat
ial s
truc
ture
of t
he tu
mor
imm
une
mic
roen
viro
nmen
t (TI
ME)
H&
E, h
emat
oxyl
in a
nd e
osin
; FFP
E, fo
rmal
in-fi
xed
and
para
ffin-
embe
dded
; IH
C, im
mun
ohis
toch
emis
try;
FIS
H, fl
uore
scen
ce in
situ
hyb
ridiz
atio
n; D
NA
, deo
xyrib
onuc
leic
aci
d; C
OD
EX, c
o-de
tect
ion
by in
dexi
ng; M
IBI,
mul
tiple
xed
ion
beam
imag
ing;
MIB
I-TO
F, m
ultip
lexe
d io
n be
am im
agin
g by
tim
e of
flig
ht; I
MC,
imag
ing
mas
s cy
tom
etry
; sc-
RNA
seq,
sin
gle-
cell
RNA
seq
uenc
ing;
MA
LDI M
SI, m
atrix
-ass
iste
d la
ser d
esor
ptio
n/io
niza
tion
mas
s sp
ectr
omet
ric im
agin
g
Cate
gory
Nam
eLe
vel
Sam
ple
prep
arat
ion
Labe
lsVi
sual
izat
ion
Com
men
tsRe
fs.
Non
‑spe
cific
tech
niqu
eH
&E s
tain
ing
Non
spec
ific
stru
ctur
eFF
PEH
emat
oxyl
in a
nd e
osin
Visi
ble
light
Low
‑cos
t; hi
gh fl
ux
help
ed b
y de
ep le
arn‑
ing:
poo
rdis
crim
ina‑
tion
of c
ell s
ubty
pes
[22–
25]
Prob
e‑ba
sed
in s
itu
imag
ing
IHC
Pept
ide
and
prot
ein
FFPE
Ant
ibod
y‑re
port
er (u
su‑
ally
flor
esce
nt p
rote
in)
Fluo
resc
ence
, ins
olub
le
pigm
ent,
etc.
Lim
ited
dete
ctab
le ta
r‑ge
ts s
imul
tane
ousl
y[2
6]
FISH
DN
AFF
PEO
ligon
ucle
otid
es‑fl
ores
‑ce
nt re
port
erFl
uore
scen
ceLi
mite
d de
tect
able
tar‑
gets
sim
ulta
neou
sly
[27]
COD
EXPe
ptid
e an
d pr
otei
nFr
esh‑
froze
nA
ntib
ody‑
olig
onuc
le‑
otid
esFl
uore
scen
ceEx
tend
ed d
etec
tible
ta
rget
s si
mul
tane
ousl
y[2
8]
COD
EX‑F
FPE
Pept
ide
and
prot
ein
FFPE
Ant
ibod
y‑ol
igon
ucle
‑ot
ides
Fluo
resc
ence
Exte
nded
det
ectib
le
targ
ets
sim
ulta
neou
sly
[10]
seqF
ISH
, seq
FISH
+ ,
corF
ISH
mRN
A (s
ub‑t
rans
crip
‑to
me)
Live
sec
tion
Olig
onuc
leot
ides
‑flor
es‑
cent
repo
rter
Fluo
resc
ence
> 1
0,00
0 de
tect
ible
ge
nes
sim
ulta
neou
sly;
su
bcel
lula
r res
olut
ion
ratio
[29–
31]
MIB
I, M
IBI‑T
OF
Pept
ide
and
prot
ein
FFPE
, im
mob
ilize
d ce
ll su
spen
sion
Ant
ibod
ies‑
isot
ypes
Seco
ndar
y io
n be
amEx
tend
ed d
etec
tible
ta
rget
s si
mul
tane
ousl
y[1
9, 3
2, 3
3]
IMC
Prot
ein,
etc
.FF
PEA
ntib
odie
s‑hi
gh m
ass
tag
Ion
beam
Subc
ellu
lar r
esol
utio
n ra
tio; p
robe
s ar
e no
t ne
cess
arily
nee
ded
[34,
35]
Spat
ial t
rans
crip
tom
eM
icro
arra
y‑ba
sed
spat
ial
tran
scrip
tom
ics
Tran
scrip
tom
eLi
ve s
ectio
n, F
FPE
Spat
ial t
rans
crip
tom
ePa
thol
ogy +
Com
puta
‑tio
nal a
naly
sis
Rest
ricte
d ce
llula
r re
solu
tion
[36]
Mic
roar
ray‑
base
d sp
atia
l tr
ansc
ripto
mic
s + sc
‑RN
Ase
q
Tran
scrip
tom
eLi
ve s
ectio
n +
sin
gle‑
cell
susp
ensi
onSp
atia
l tra
nscr
ipto
me
Com
puta
tiona
l mat
ch‑
ing
Map
ping
is b
ased
on
regi
on‑c
lust
er m
atch
‑in
g by
mul
timod
al
inte
rsec
tion
anal
ysis
[37]
ZipS
eqTr
ansc
ripto
me
Live
sec
tion
Ant
ibod
y/lig
noce
ric‑o
li‑go
nucl
eotid
es‑z
ipco
deCo
mpu
tatio
nal m
atch
‑in
gEx
quis
ite d
esig
n in
ad
vanc
e is
requ
ired
for
accu
racy
[38]
Spat
ial p
rote
ome
MA
LDI M
SIPr
oteo
me
Fres
h fro
zen,
FFP
E–
Ion
imag
ing
Labe
l‑fre
e; d
e no
vo
inve
stig
atio
n[3
9, 4
0]
Page 10 of 25Fu et al. J Hematol Oncol (2021) 14:98
sequencing (scRNA-seq) to integrate their advantages. With reference maps generated from microarray-based spatial transcriptomic, data from the scRNA-seq of the rest of tissue can be mapped back.
There are also some other technology roadmaps in spa-tial transcriptomics, such as ZipSeq. Researchers first hybridized live tissue with cell-marker-specific antibody probes containing unique zipcode oligonucleotides that are initially blocked by photocleavable protecting group. Then, region of interest (ROI) of any shape was radiated with ultraviolet to remove blocking groups, making it possible to combine with complementary oligonucleo-tides conjugated to fluorescent reporters. Then, pro-cessed tissue was imaged to obtain reference map and digested to undergo scRNA-seq, whose outcome will be matched back to the reference map ultimately (38).
Apart from the spatial transcriptome, the spatial pro-teome represented by matrix-assisted laser desorption/ionization mass spectrometric imaging (MALDI MSI) is also capable of depicting in situ omics information (Fig. 2f ). As a label-free system, although the spatial pro-teome also takes advantage of mass spectrometry for imaging, the excitation beam in the spatial proteome is much stronger and is able to directly ionize the compo-nents of sections and preserve spatial information simul-taneously during scanning (39, 40).
Spatial omics has enabled researchers to better under-stand the actual biological events occurring in the archi-tecture of the TIME. Spatial omics not only quantifies and locates immune cells but also further reveals their functional status and potential intercellular reactions. However, concern persists about the matching accuracy and precision of spatial omics. In addition, complex pro-tocols and sizable expenses are also setbacks and chal-lenges for large-scale studies or clinical use.
Software for TIME analysisIn-depth data mining is necessary to take full advantage of massive data derived from the techniques reviewed above. Some basic functions, such as cell segregation, classification, quantification and other primary extended tools, are inlayed to the solutions mentioned above. In addition, developers have also proposed general analysis software for deeper analyses. For instance, spatial vari-ance component analysis is a computational algorithm able to analyze cell–cell communication in spatial archi-tecture of the TIME. It deconstructs overall effects that cells receive into four aspects: intrinsic effects, environ-mental effects, cell–cell interactions, and residual noise (17). In the near feature, an explosion of data is foreseea-ble as researchers increasingly focus on the spatial archi-tecture of the TIME. More useful tools will be necessary
for an in-depth analysis of these precious and complex data.
Aspects to describe the spatial architecture of the TIMESeveral strategies are proposed to profile complex TIME information generated by the innovative tools reviewed above or other conventional techniques (Table 2). Differ-ent strategies can provide us with different silhouettes to comprehend the complexity of the TIME.
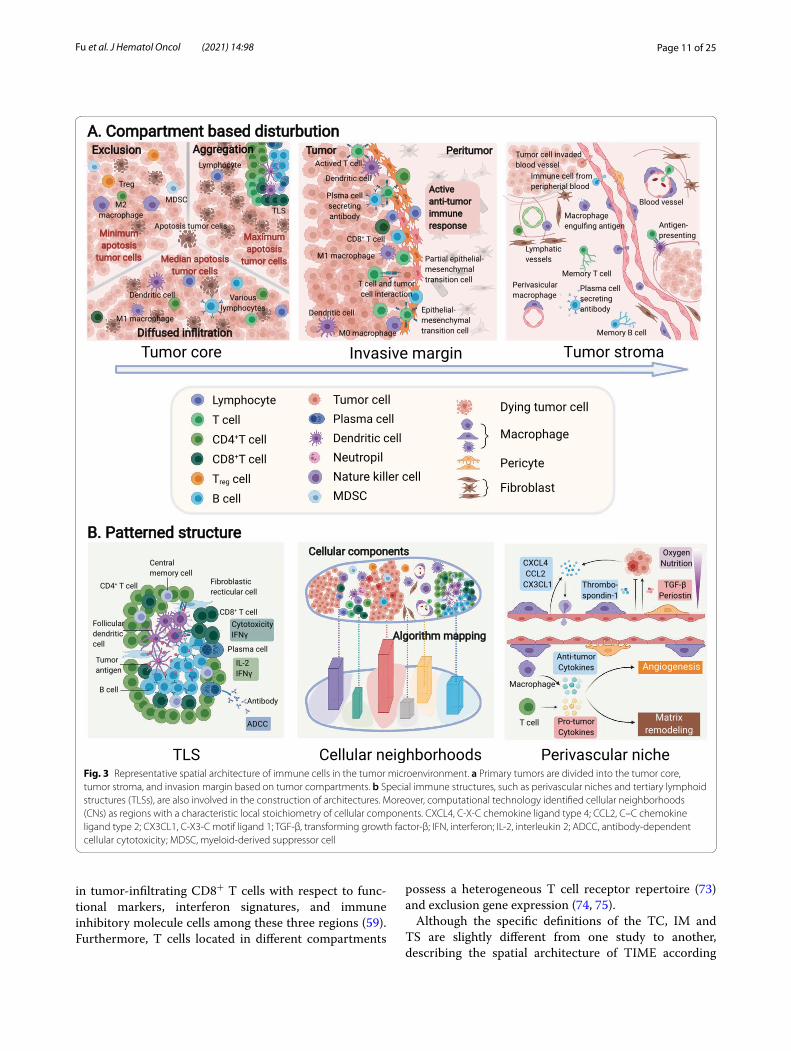
Distribution of immune cells based on tumor compartmentsThe most widely utilized mode to describe the distri-bution of immune cells is categorizing them accord-ing to the compartments in which they are located in the tumor tissue (Figs. 1a and 3a). The compartment in which immune cells reside potentially reflects their rela-tionships with tumor cells, other immune cells and other various components within the TME (59).
Typically, tumor tissue compartments consist of three parts: the tumor core (TC, also referred to as the tumor nest or tumor cluster), which accommodates the majority of tumor cells in some bordered area; the tumor stoma (TS), where abundant stromal components are situated around TC; and the invasive margin (IM), which repre-sents the transition zone of the TC and TS. These spa-tial compartments can be observed in a variety of solid tumors such as breast cancer, colorectal cancer, mela-noma and oral-tongue cancer (60–64). Thus, the location of immune cells can be described based on the specific compartment. Several papers have previously reported that the distribution of immune cells in these three regions is not significantly different (65, 66), while oth-ers found differences in the distribution and functional status of immune cells among these different locations (67, 68). For example, immune cells within TCs are uni-versally considered to have the tightest interaction with tumor cells due to their close juxtaposition to tumor cells (69). The IM is thought to be the front line of the battle between the tumor and immune system, and unsurpris-ingly, the density and function of effective immune cells at this site are higher than those in either the TC or TS (70, 71). Immune cells in the TS are involved in stromal remodeling and angiogenesis, which may exert profound effects on tumor growth and invasion (72).
Emerging imaging and analyses have further revealed intrinsic differences among specific types of immune cells within these three regions. For instance, TNBC is a highly aggressive and heterogeneous subtype of breast cancer. An analysis of spatial-based microdissection gene expression data in TNBC revealed the differences
Page 11 of 25Fu et al. J Hematol Oncol (2021) 14:98
in tumor-infiltrating CD8+ T cells with respect to func-tional markers, interferon signatures, and immune inhibitory molecule cells among these three regions (59). Furthermore, T cells located in different compartments
possess a heterogeneous T cell receptor repertoire (73) and exclusion gene expression (74, 75).
Although the specific definitions of the TC, IM and TS are slightly different from one study to another, describing the spatial architecture of TIME according
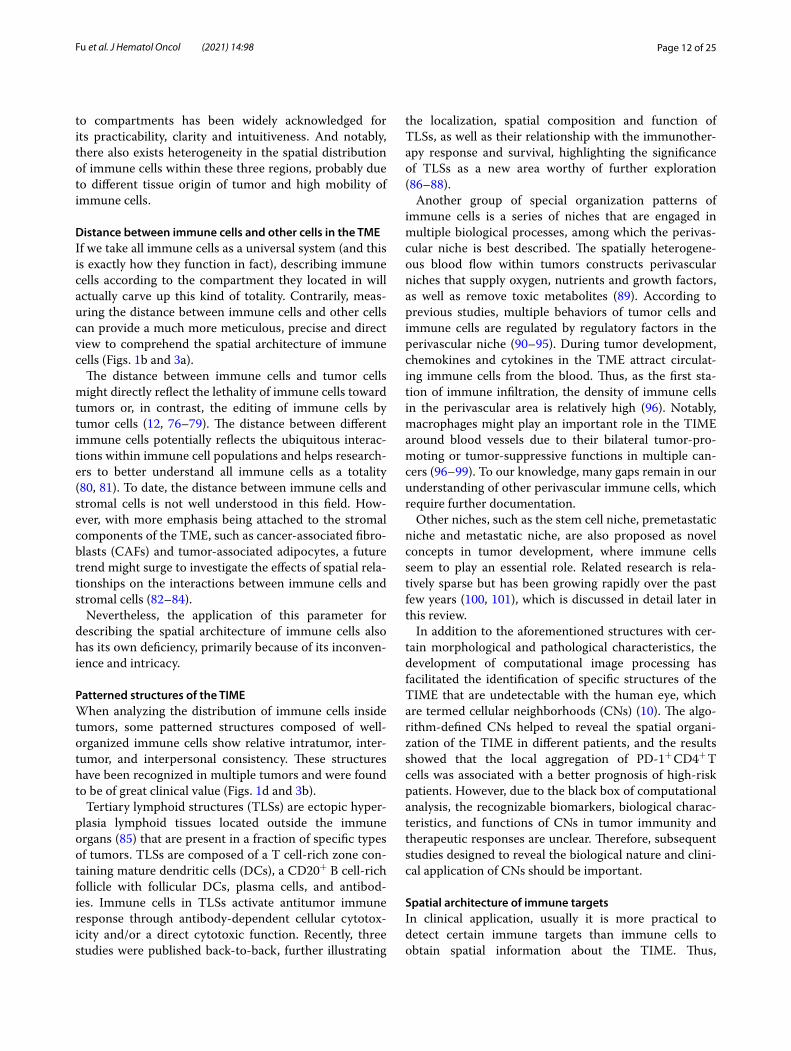
Fig. 3 Representative spatial architecture of immune cells in the tumor microenvironment. a Primary tumors are divided into the tumor core, tumor stroma, and invasion margin based on tumor compartments. b Special immune structures, such as perivascular niches and tertiary lymphoid structures (TLSs), are also involved in the construction of architectures. Moreover, computational technology identified cellular neighborhoods (CNs) as regions with a characteristic local stoichiometry of cellular components. CXCL4, C‑X‑C chemokine ligand type 4; CCL2, C–C chemokine ligand type 2; CX3CL1, C‑X3‑C motif ligand 1; TGF‑β, transforming growth factor‑β; IFN, interferon; IL‑2, interleukin 2; ADCC, antibody‑dependent cellular cytotoxicity; MDSC, myeloid‑derived suppressor cell
Page 12 of 25Fu et al. J Hematol Oncol (2021) 14:98
to compartments has been widely acknowledged for its practicability, clarity and intuitiveness. And notably, there also exists heterogeneity in the spatial distribution of immune cells within these three regions, probably due to different tissue origin of tumor and high mobility of immune cells.
Distance between immune cells and other cells in the TMEIf we take all immune cells as a universal system (and this is exactly how they function in fact), describing immune cells according to the compartment they located in will actually carve up this kind of totality. Contrarily, meas-uring the distance between immune cells and other cells can provide a much more meticulous, precise and direct view to comprehend the spatial architecture of immune cells (Figs. 1b and 3a).
The distance between immune cells and tumor cells might directly reflect the lethality of immune cells toward tumors or, in contrast, the editing of immune cells by tumor cells (12, 76–79). The distance between different immune cells potentially reflects the ubiquitous interac-tions within immune cell populations and helps research-ers to better understand all immune cells as a totality (80, 81). To date, the distance between immune cells and stromal cells is not well understood in this field. How-ever, with more emphasis being attached to the stromal components of the TME, such as cancer-associated fibro-blasts (CAFs) and tumor-associated adipocytes, a future trend might surge to investigate the effects of spatial rela-tionships on the interactions between immune cells and stromal cells (82–84).
Nevertheless, the application of this parameter for describing the spatial architecture of immune cells also has its own deficiency, primarily because of its inconven-ience and intricacy.
Patterned structures of the TIMEWhen analyzing the distribution of immune cells inside tumors, some patterned structures composed of well-organized immune cells show relative intratumor, inter-tumor, and interpersonal consistency. These structures have been recognized in multiple tumors and were found to be of great clinical value (Figs. 1d and 3b).
Tertiary lymphoid structures (TLSs) are ectopic hyper-plasia lymphoid tissues located outside the immune organs (85) that are present in a fraction of specific types of tumors. TLSs are composed of a T cell-rich zone con-taining mature dendritic cells (DCs), a CD20+ B cell-rich follicle with follicular DCs, plasma cells, and antibod-ies. Immune cells in TLSs activate antitumor immune response through antibody-dependent cellular cytotox-icity and/or a direct cytotoxic function. Recently, three studies were published back-to-back, further illustrating
the localization, spatial composition and function of TLSs, as well as their relationship with the immunother-apy response and survival, highlighting the significance of TLSs as a new area worthy of further exploration (86–88).
Another group of special organization patterns of immune cells is a series of niches that are engaged in multiple biological processes, among which the perivas-cular niche is best described. The spatially heterogene-ous blood flow within tumors constructs perivascular niches that supply oxygen, nutrients and growth factors, as well as remove toxic metabolites (89). According to previous studies, multiple behaviors of tumor cells and immune cells are regulated by regulatory factors in the perivascular niche (90–95). During tumor development, chemokines and cytokines in the TME attract circulat-ing immune cells from the blood. Thus, as the first sta-tion of immune infiltration, the density of immune cells in the perivascular area is relatively high (96). Notably, macrophages might play an important role in the TIME around blood vessels due to their bilateral tumor-pro-moting or tumor-suppressive functions in multiple can-cers (96–99). To our knowledge, many gaps remain in our understanding of other perivascular immune cells, which require further documentation.
Other niches, such as the stem cell niche, premetastatic niche and metastatic niche, are also proposed as novel concepts in tumor development, where immune cells seem to play an essential role. Related research is rela-tively sparse but has been growing rapidly over the past few years (100, 101), which is discussed in detail later in this review.
In addition to the aforementioned structures with cer-tain morphological and pathological characteristics, the development of computational image processing has facilitated the identification of specific structures of the TIME that are undetectable with the human eye, which are termed cellular neighborhoods (CNs) (10). The algo-rithm-defined CNs helped to reveal the spatial organi-zation of the TIME in different patients, and the results showed that the local aggregation of PD-1+ CD4+ T cells was associated with a better prognosis of high-risk patients. However, due to the black box of computational analysis, the recognizable biomarkers, biological charac-teristics, and functions of CNs in tumor immunity and therapeutic responses are unclear. Therefore, subsequent studies designed to reveal the biological nature and clini-cal application of CNs should be important.
Spatial architecture of immune targetsIn clinical application, usually it is more practical to detect certain immune targets than immune cells to obtain spatial information about the TIME. Thus,
Page 13 of 25Fu et al. J Hematol Oncol (2021) 14:98
research in the spatial distribution of immune targets in the TIME has also attracted great attention (Fig. 1c).
Given the emerging prevalence of immunotherapies that modify antitumor immunity, a variety of immu-nomodulatory molecules, represented by immune check-points, are favorable immune targets (102). For example, antibodies targeting the T cell inhibitory checkpoint proteins programmed cell death 1 (PD-1), its ligand PD-L1, and cytotoxic T-lymphocyte-associated antigen 4 (CTLA-4) can enhance antitumor immunity. These antibodies have achieved durable clinical efficacy in some patients with various tumor types and have been approved by the U.S. Food and Drug Administration. The spatial localization of these immune targets has been measured in various cancers, including breast cancer (19, 59), non-small cell lung cancer (NSCLC) (103, 104), mel-anoma (105), colon cancer (106), and craniopharyngioma (107). Given the cell-specific expression of immune tar-gets and well-organized spatial architecture of cells in the TME, the spatial distribution of these immune targets also showed a certain pattern (Fig. 1c). Taking the PD-1/PD-L1 axis as an example, PD-1 is mainly expressed on the surface of CD8+ T cells, while its ligand PD-L1 is expressed on multiple cells, including tumor cells, B lym-phocytes, and tumor-associated macrophages (TAMs) (108–110). The results showed that the overall spatial distribution of immune targets is highly correlated with cells, although the levels of these targets vary among the same type of cells in different spatial locations (107).
Moreover, since most immunoregulators depend on ligand-receptor binding, the distance between two tar-gets is crucial for the immune response. Studies have assessed the spatial interaction based on the distance between immune target positive cells, the spatial prox-imity of targets, or their colocalization in one cell (103, 105, 111). Additionally, taking PD-1/PD-L1 as an exam-ple, the PD-1/PD-L1 interaction score, an indicator of the spatial ligand-receptor relationship, was evaluated in patients treated with anti-PD-1. Patients with high inter-action scores were more likely to respond, although indi-vidual biomarkers were not associated with the response or survival (110). Other tumor-related pathways, such as
Notch, interleukin 6 (IL-6)/JAK/STAT, Toll-like recep-tor, C-X-C chemokine ligand type 12 (CXCL12)/C-X-C chemokine receptor type 4 (CXCR4), Wnt-β-catenin, and transforming growth factor (TGF-β), are also activated by a distance-dependent interaction between immune cells and their environment (112–116). Extracellular paracrine and juxtacrine signaling molecules also act in this man-ner (117). Furthermore, the relationship between spatial proximity and the functional statue of these signal path-ways is awaited to be investigated.
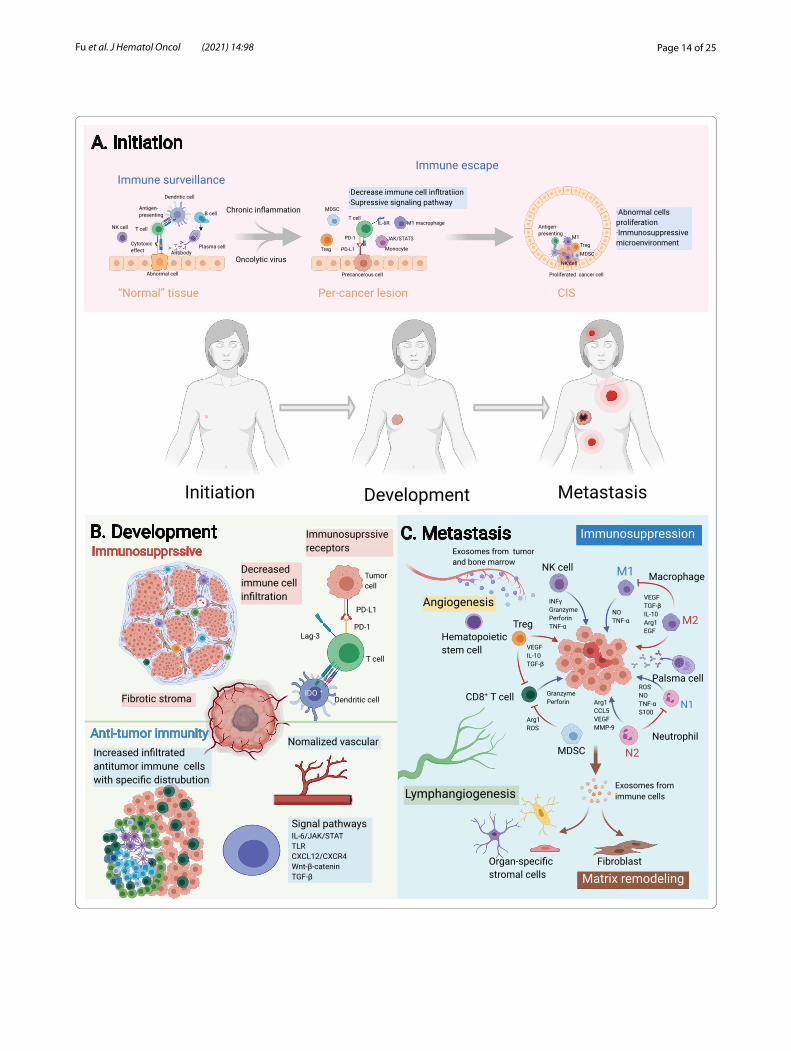
Spatial architecture of the TIME and tumor biologyThe spatial architecture of the TIME is closely related to tumor biology, which coordinates with the development of tumors and simultaneously, exerts effects on tumors. Here, we reviewed the current knowledge of the spatial architecture and function of the TIME in tumor initia-tion, expansion and metastasis, to discuss the potential mechanism of the evolution of TIME’s spatial architec-ture and its implications for clinical outcomes (Fig. 4).
Construction of the TIME at tumor initiationThe spatial distribution of immune components dur-ing tumor initiation has been described by some studies (Fig. 4a). Studies of the somatic mutation burden in mor-phologically normal precancerous tissues have revealed that “normal” cells accumulate a series of mutations prior to pathologically observable morphological changes (118, 119). Mutations within cells can be detected by the immune surveillance and initiate the immune response to eliminate “nonself” cells in the localized region where precancerous transformation occurs. In most cases, these cells are cleared by immune surveillance sys-tem. However, in immunosuppressive microenviron-ment where immune surveillance is diminished due to chronic inflammation or oncolytic virus, the infiltration of immune cells will decrease, and the cytokine interleu-kin-6 (IL-6) will activate the JAK/STAT3 signaling path-way in monocytes (120), which ultimately contributes to abnormal cells escaping immune elimination and pro-liferating into carcinoma in situ (CIS). The landscape of the TIME of CIS has been profiled, and the distribution
(See figure on next page.)Fig. 4 Spatial evolution of the tumor immune microenvironment (TIME) structure during tumor progression. The process of tumor initiation, expansion, and metastases is accompanied by a gamble between the tumor and the TIME, where antitumor immune and immunosuppressive factors coexist and interact with each other. a In the initiation stage, the immune components around the lesion evolve from immune surveillance to immune escape during the evolution of "normal tissue", precancerous lesions, and carcinoma in situ (CIS). b In the expansion phase, the TIME functions in a contact‑dependent or distance‑dependent manner. c In the metastatic phase, the specific arrangement of immune cells in the metastatic niche establishes a favorable environment for the formation and growth of metastases. PD‑1, programmed cell death 1; PD‑L1, programmed cell death ligand 1; Lag‑3, lymphocyte‑activation gene 3; TLSs, tertiary lymphoid structures; TLR, Toll‑like receptor; CXCL12, C‑X‑C chemokine ligand type 12; CXCR4, C‑X‑C chemokine receptor type 4; TGF‑β, transforming growth factor‑β; IL, interleukin; VEGF, vascular endothelial growth factor; ROS, reactive oxygen species; NO, nitric oxide; EGF, endothelial growth factor; Arg1, Arginase‑1; CCL5, C–C chemokine ligand type 5; TNF‑α, tumor necrosis factor α
Page 14 of 25Fu et al. J Hematol Oncol (2021) 14:98
Page 15 of 25Fu et al. J Hematol Oncol (2021) 14:98
and immune pattern of tumor-infiltrating immune cells are affected by the heterogeneity of tumor cells (121, 122). Therefore, the spatial distribution of immune com-ponents is involved in the transition of “normal” cells to tumor cells and CIS.
Knowledge about the spatial architecture of the TIME in the tumor initiation helps to reveal the evolutionary trajectory of premalignancy toward malignancy. How-ever, conventional technologies have difficulties in detect-ing occult lesions, limiting the conduct of research (123, 124). It is believed that the availability of spatial informa-tion about the TIME expands the information dimension of precancer lesions, which can help researchers under-stand tumor initiation and guide clinical practice.
Spatial architecture of the TIME in tumor expansion and invasionDeveloping tumors are primary targets for research in spatial architecture of the TIME because of their appropriate size, enrichment in immune components, and the bidirectional roles of spatial architecture of the TIME within these tissues (Fig. 4b). Tumor expansion is accompanied by physiological processes, such as tumor cell proliferation, angiogenesis and immune cell infiltra-tion. Description of the immune cell infiltration patterns based on spatial information provides additional insights into the tumor invasion. In some samples, immune cells are distributed diffusely, while in others, they tend to aggregate to form CNs, which are considered able to enhance immune cell function. In most cases, tumor-infiltrating immune cells are tumor-killing cells, and thus CN formation can fortify antitumor immunity. Neverthe-less, some other CNs may consist of immunosuppressive cells, which reversely attenuate antitumor immunity (10, 19). The formation and impacts of those known struc-tures on antitumor immunity are underexplored, and will probably be the focus of subsequent study.
Invasion, which is necessary for tumors to metastasize, occurs on the border of the tumor and is regulated by the frontier of the TIME. One of the most crucial events in tumor invasion is the epithelial–mesenchymal transition (EMT) (125). Studies of head and neck tumors identi-fied a fraction of cells that were spatially located close to CAFs and immune cells in the leading edge of the tumor, expressing a signature related to a partial EMT program. This study reflected the relationship between the active immune response at the invasion margin and the occur-rence of metastasis (126).
Except for EMT and partial EMT cells, previous studies have reported a higher abundance of immune cells and a stronger antitumor immune effect of the IM than the TC at metastatic lesions of gastroesophageal adenocarci-nomas (127), hepatocellular carcinoma (128), melanoma
(12), and colorectal cancer (129–131). This phenom-enon may be driven by the intense struggle in the eco-logical niche between marginal tumor cells and immune cells, which is similar to that at the invading edge during ecological species invasion. Based on this analogy, the Darwinian dynamics model in ecology has been used to model the spatiotemporal distribution and evolutionary shifts of immune components at the invasion edge of the TIME in silico (132, 133).
Spatial architecture of the TIME and metastasesAfter invasion, tumor cells traverse the stroma, enter the vascular system and colonize a secondary site, namely metastasis occurs. Current studies about the TIME’s spa-tial architecture in metastases mainly focus on specific spatial patterns (Fig. 4c).
As mentioned above, spatial patterns indicated the structure formed by well-organized TIME components. Representative spatial patterns in metastasis is the niche induced by exosomes and/or factors from the primary site (134). Before the seeding of circulating tumor cells (CTCs), the primary tumor-derived components facili-tate the recruitment of immune cells into the niche, while immune cells subsequently, modify the local microenvi-ronment of niches to form a feedback loop that ultimately promotes the formation of premetastatic niche (100, 135, 136). Specifically, premetastatic niches construct an immunosuppressive microenvironment composed of myeloid-derived suppressor cells (137), regulatory T cells (Tregs) (138), TAMs (139, 140), and tumor-associ-ated neutrophils (141) to abolish local antitumor immu-nity that is more conducive to CTC colonization. The immunoregulatory components and their functions within niches have been thoroughly studied and recently reviewed (100, 142). Several studies have progressively revealed the spatial distribution of immune and host stromal components within niches (143–145).
After the seeding of CTCs, a premetastatic niche becomes a metastatic niche, which inherits the spatial architecture and functional status of the premetastatic niche, including emerging vessels, vascular leakiness and an immunosuppressive TIME. Moreover, immune com-ponents regulate spatiotemporal tumor cell stemness and plasticity (146, 147). Tumor cells also exert a spatially dependent effect on their surrounding cells (148). The formation and development of premetastatic niches and metastatic niches are still complex, and the evolution of these processes should be further explored.
Tumor cells in niches proliferate and ultimately grow into metastasis. Current investigations about the spatial heterogeneity of metastases tend to explore differences among primary sites and metastases in different sites, which expands the conception of spatial heterogeneity

Page 16 of 25Fu et al. J Hematol Oncol (2021) 14:98
to a more macro level with greater clinical value. In addi-tion to heterogeneity, studies have identified some con-sistencies between the spatial arrangement of immune cells in the TIME of metastatic and primary foci (149). For instance, in ovarian cancer, researchers found that subpopulations of T cells in primary tumors or differ-ent metastatic sites are relatively consistent, indicating their ability to track disseminated tumor cells through space (56, 106, 150–152). Meanwhile, no difference was observed in the distance between CD8+ T cells and tumor cells in primary and metastatic melanoma foci (12). The heterogeneity and consistency discussed above highlight the complexity of TIME’s spatial architecture, and more researches are required for clear elucidation.
Spatially‑based extracellular nonspecific chemical (ENSC) gradients orchestrate immune cell functionIn addition to “tangible” structures in the TME, “intangi-ble” extracellular nonspecific chemicals (ENSCs) are also critical components of the TME. In contrast to immune molecules, such as diverse interleukins (ILs), ENSCs refer to extracellular molecules participating in the metabo-lism of almost all cells and exerting extensive effects on them, including immune cells in the TIME. ENSCs manifest spatial heterogeneity in the form of “gradient”. And though ENSCs are not components of TIME, their unignorable role in the regulation of the spatial archi-tecture of TIME emphasizes their importance in the research of TIME. In this section, we will discuss the cur-rent knowledge of the distribution of ENSCs in the TME and briefly review the effects of the ENSC distribution on immune cells.
Basic principle of the distribution of ENSCsSome basic physical and biological principles can help us to understand the distribution of ENSCs. ENSCs include a variety of chemicals, whose distribution is complex and interdependent. Depicting a general map of all ENSCs in the TME is infeasible and unnecessary because they vary among different species, tissue origins, patients, lesion locations, stages, and systemic conditions (28, 52). Nev-ertheless, the distribution of ENSCs is also spatially reg-ulated due to some basic principles it must obey, which can help us grasp the outline of its landscape.
These basic principles are described below, and most of them are self-evident but essential.
1. The appearance and disappearance of ENSCs are in partial hemostasis and depend on two mechanisms, blood circulation and in situ metabolism, which are tightly interlaced.
2. Powered by the concentration gradient, ENSCs pas-sively diffuse from areas of high density toward those of low density.
3. Competition exists between tumor cells and immune cells for most ENSCs, and tumor cells typically have an advantage (153, 154).
4. The distribution of ENSCs observed at a specific time point is a cross section of consecutive biological processes.
Oxygen is pivotal for ENSCsOxygen is capable of being the hallmark molecule among all ENSCs. Various types of ENSCs are present in the TME, i.e., oxygen, glucose, carbon dioxide, lactate, amino acids, metal ions, lipids, etc. Considering the high hetero-geneity and intricacy of ENSCs in the TME, a judicious approach is to select some representative ENSCs to bet-ter understand their distribution and biological effects. As far as we are concerned, oxygen should be critical for several reasons.
First, cellular respiration is the basis of cell metabo-lism and survival, in which oxygen is irreplaceable in the long term. The transportation and utilization of oxygen among most types of tumors are highly homogeneous, which dramatically facilitates associated studies. Mean-while, the oxygen gradient serves as an ideal marker for the distance from vessels, and is closely related to other ENSCs by metabolism directly or indirectly. In addition, alterations in oxygenation and its subsequent outcomes are deeply incorporated into the biological transforma-tion of tumors, such as angiogenesis, progression, and necrosis. Taken together, we choose oxygen as a repre-sentative ENSC when studying the spatial architecture of the TIME.
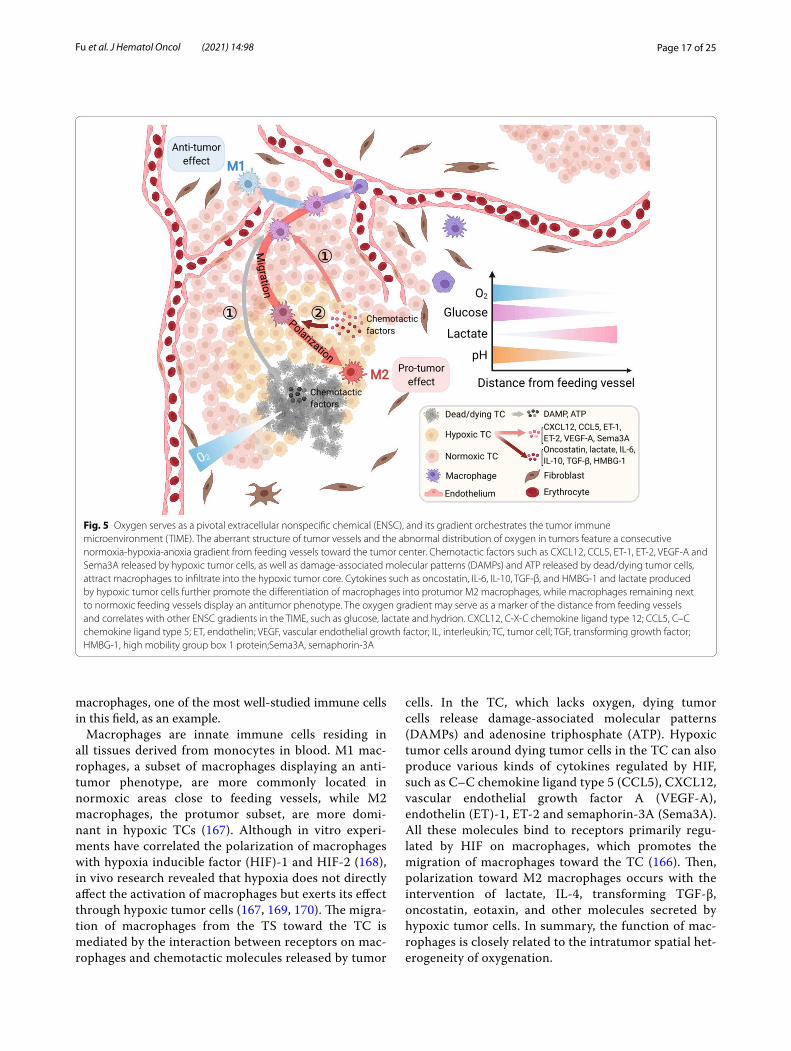
The oxygen distribution in normal tissue is regulated by an exquisite mechanism to form balanced dynamic homeostasis, but processes occurring in tumors are aber-rant (155–157). The rapid proliferation of tumor cells exceeds the oxygen and nutrient supply and subsequently leads to angiogenesis. Neovascularization, characterized by an abnormal vessel wall structure with unbalanced distribution and immature function, causes an insuffi-cient and unbalanced oxygen supply (158–160). These factors all contribute to the abnormal distribution of oxy-gen, featuring a consecutive normoxia-hypoxia-anoxia gradient from feeding vessels toward the tumor center, which has been certified in vivo, in vitro and in silico (159, 161–165) (Fig. 5).
The gradient of oxygen in the TME exerts compre-hensive effects on the biological performance of diverse immune cells, including infiltration, migration, polari-zation, function, and metabolism (166). Here, we use
Page 17 of 25Fu et al. J Hematol Oncol (2021) 14:98
macrophages, one of the most well-studied immune cells in this field, as an example.
Macrophages are innate immune cells residing in all tissues derived from monocytes in blood. M1 mac-rophages, a subset of macrophages displaying an anti-tumor phenotype, are more commonly located in normoxic areas close to feeding vessels, while M2 macrophages, the protumor subset, are more domi-nant in hypoxic TCs (167). Although in vitro experi-ments have correlated the polarization of macrophages with hypoxia inducible factor (HIF)-1 and HIF-2 (168), in vivo research revealed that hypoxia does not directly affect the activation of macrophages but exerts its effect through hypoxic tumor cells (167, 169, 170). The migra-tion of macrophages from the TS toward the TC is mediated by the interaction between receptors on mac-rophages and chemotactic molecules released by tumor
cells. In the TC, which lacks oxygen, dying tumor cells release damage-associated molecular patterns (DAMPs) and adenosine triphosphate (ATP). Hypoxic tumor cells around dying tumor cells in the TC can also produce various kinds of cytokines regulated by HIF, such as C–C chemokine ligand type 5 (CCL5), CXCL12, vascular endothelial growth factor A (VEGF-A), endothelin (ET)-1, ET-2 and semaphorin-3A (Sema3A). All these molecules bind to receptors primarily regu-lated by HIF on macrophages, which promotes the migration of macrophages toward the TC (166). Then, polarization toward M2 macrophages occurs with the intervention of lactate, IL-4, transforming TGF-β, oncostatin, eotaxin, and other molecules secreted by hypoxic tumor cells. In summary, the function of mac-rophages is closely related to the intratumor spatial het-erogeneity of oxygenation.
Fig. 5 Oxygen serves as a pivotal extracellular nonspecific chemical (ENSC), and its gradient orchestrates the tumor immune microenvironment (TIME). The aberrant structure of tumor vessels and the abnormal distribution of oxygen in tumors feature a consecutive normoxia‑hypoxia‑anoxia gradient from feeding vessels toward the tumor center. Chemotactic factors such as CXCL12, CCL5, ET‑1, ET‑2, VEGF‑A and Sema3A released by hypoxic tumor cells, as well as damage‑associated molecular patterns (DAMPs) and ATP released by dead/dying tumor cells, attract macrophages to infiltrate into the hypoxic tumor core. Cytokines such as oncostatin, IL‑6, IL‑10, TGF‑β, and HMBG‑1 and lactate produced by hypoxic tumor cells further promote the differentiation of macrophages into protumor M2 macrophages, while macrophages remaining next to normoxic feeding vessels display an antitumor phenotype. The oxygen gradient may serve as a marker of the distance from feeding vessels and correlates with other ENSC gradients in the TIME, such as glucose, lactate and hydrion. CXCL12, C‑X‑C chemokine ligand type 12; CCL5, C–C chemokine ligand type 5; ET, endothelin; VEGF, vascular endothelial growth factor; IL, interleukin; TC, tumor cell; TGF, transforming growth factor; HMBG‑1, high mobility group box 1 protein;Sema3A, semaphorin‑3A
Page 18 of 25Fu et al. J Hematol Oncol (2021) 14:98
The functions of other immune cells are also corre-lated with the oxygen gradient, such as the migration of neutrophils, natural killer (NK) cells, and Tregs toward hypoxic regions and the stagnancy of CD4+ T cells and CD8+ T cells in normoxic areas. The correspond-ing retention or alteration of their functions has been elaborated previously (166, 171–173). Nevertheless, the relations of various immune cells with the oxygenation spatial gradient still need further exploration.
The distribution of other ENSCs in the TME and their effect on immune cellsThe distributions of other ENSCs (or their uptake) have also been partially revealed in vivo or in vitro to vary-ing degrees, such as glutamine, amino acids, and metal ions (165, 174–177). The distributions of some of these molecules are correlated with the function of immune cells. For instance, the altered gradient of Na+ is corre-lated with the polarization of macrophages, probably in a tissue-specific manner (176), and increased K+ levels in tumors can suppress effector T cell function and prevent immune cells from maturing (177). However, researchers still do not comprehensively understand the significance of their effects on immune cells in a complex real TME, which must be further established.
Recently, tumor metabolomics has attracted increasing interest from researchers. Using high-flux tools to reveal the metabolism of tissue and cells, a series of metabolites were found to play an important role in the interaction between tumor cells and immune cells (178, 179). With further investigations of their spatial distribution, addi-tional mechanisms and potential therapeutic targets might be proposed.
Spatial architecture of the TIME in clinical applicationThe clinical application of spatial architecture of the TIME can be roughly divided into two aspects, prognosis prediction and clinical treatment.
Spatial architecture of the TIME in prognosis predictionMany prognostic implications of compartment-based features have been described. The Immunoscore is a sim-plified tool based on the immune context that is used to evaluate the abundance of T cell populations in the TC or IM jointly and shows great clinical potential in colorectal cancer (180–183). Apart from the Immunoscore, other researchers also examined the distribution of some spe-cific subtypes of immune cells in different compartments within the TME. The specific distributions of CD8+ T cells and CD163+ macrophages in breast cancer (184), cytotoxic T cells (CTLs) and memory T cells in colorec-tal cancer (185), CD8+ T cells and Tregs in NSCLC (186),
and CTLs in primary melanoma (81) residing in different compartments were found to be significantly related to clinical outcomes, improving our knowledge of a precise diagnosis.
Diverse parameters focusing on the distances of dif-ferent cell–cell pairs are also well established. In breast cancer, patients with a mixed distribution of tumor and immune cells experienced prolonged survival com-pared with those whose tumor cells and immune cells were segregated from each other, even if the latter may have more abundant immune cells (19). Quanti-tative research found that enriched CD8+ cells within distant stroma (farther than one tumor cell diameter away from the TC) rather than adjacent stroma (within one tumor cell diameter) were related to prolonged disease-specific survival in patients with breast car-cinoma (187). Mezheyeuski et al. (188) calculated the shortest distance from each immune cell to the nearest neighboring cancer cell and discovered that the spatial proximity of Tregs and tumor cells was correlated with a significantly unfavorable survival in patients with NSCLC. Nearchou et al. (79) analyzed the number of CD8+ T cells within 100 μm radii from tumor buds and found that their totality and distance were significantly associated with disease-specific survival. Enfield et al. (189) discovered that the frequencies of CD3+CD8+ T cells around tumor cells were a more powerful marker to predict low recurrence than their density in lung adenocarcinoma. For spatial architecture of the TIME based on immune targets, researches are relatively limited. Lazarus et al. revealed that CTLs were more abundant around PD-L1− epithelial cells than PD-L1+ epithelial cells, and the engagement between CTLs and epithelial cells was correlated with favorable overall survival (106).
As for patterned structures of the TIME, clinical data showed that the existence of TLSs is significantly related to improved overall survival (OS), disease-spe-cific survival (DSS) and disease-free survival (DFS) in patients with early stage NSCLC (190). Further stud-ies found that TLSs are associated with increased lym-phocyte infiltration into tumors with extended DFS in breast cancer and colorectal cancer (191). However, the role of TLSs in predicting the prognosis is still under debate because another study of breast can-cer showed that patients with abundant TLSs exhib-ited worse DFS and OS than those lacking TLSs (192). The cellular component in TLSs has also aroused the interest of scientists. One study found that TLSs in patients with spontaneous prostate tumor regression contain fewer Tregs and more T-helper 1 (Th1) and CD8+ T cells, which are commonly considered antitu-mor components (193). The detection of premetastatic
Page 19 of 25Fu et al. J Hematol Oncol (2021) 14:98
and metastatic niches in the early stage of metastasis may facilitate effective treatment shortly after or even before the seeding of CTCs. Their existence can be determined by changes in the histological tissue density of potential metastatic sites (194, 195) or biochemical/cellular biomarkers in circulation (137, 196, 197). These discoveries might indicate unfavorable events prior to clinical manifestation and help clinicians provide early treatment.
Spatial architecture of the TIME in clinical treatmentTo remodeling the spatial architecture of the TIME, diverse therapeutic strategies have also been proposed, including those that promote (116, 198) or prevent (199) immune cells from infiltrating into designated areas of the TIME, modify angiogenesis or oxygenation of the TIME (200–202), induce the formation of TLSs (85, 86) or modulate members of TLSs (87), regulate stro-mal components in the TIME (203, 204), and transform ENSCs in the TIME (178, 205). Regretfully, there are few researches focusing on the value of the spatial architec-ture of the TIME in treatment response prediction.
Profound mechanisms likely underlie the correlation between spatial features and clinical outcomes, which remain to be fully revealed for researchers to design more feasible therapies that will become available for patients in the future.
Conclusions and perspectivesIn this article, we provide a systematic summary of tech-nological advances and related researches on the spa-tial architecture of the TIME. Recently, an explosion of researches witnessed profound advances in high-dimen-sional techniques that preserve the spatial information, which has revolutionized our understanding about the spatial architecture of the TIME.
Despite the recent rapid development, there are still many unresolved issues in the study of TIME’s spatial architecture. First of all, spatial proximity between cells does not necessarily mean that actual interactions are occurring. Current analyses assume that cells in close proximity have a higher probability of potential inter-action, but whether an interaction exists and its extent must be further verified. The in vitro study of cell-to-cell interactions is feasibly facilitated by cell culture tech-niques, such as coculture and organoids (206). However, these models do not fully reflect the situation in vivo. The mCherry niche labeling strategy devised by Ombrato et al. showed the in vivo intercellular material flow of tumor cells and their neighborhood in metastatic niches through the secretion and uptake of marker proteins. However, due to the disparity in the phagocytic capacity
of different neighboring immune cells themselves, the simple secretion-uptake model does not fully reflect interactions within the TIME (148). Therefore, future in-depth studies of in situ spatial interactions and space-dependent functions will depend on the further devel-opment of in vivo and in vitro models. Moreover, only limited studies have revealed mechanisms underlying the formation, development and regulation of spatial archi-tecture of the TIME, partially due to the lack of suitable experimental models.
Conventionally, in vitro experiments are widely favored because of their controllability and ease of use. Experi-mental techniques, such as extracellular matrix cultur-ing cancer cells in biomimetic scaffolds (207), reproduce the spatial distribution of tumor cells in artificially con-structed meshwork in vitro to some extent. However currently, immune cells cannot be cultured in scaffolds due to the difficulty in culturing immune cells and their short survival time in vitro. Organoids and spheroids are popular platforms adopted in the investigation of tumors recently, which can partially preserve the spatial infor-mation of original malignancies. Typically, immune cells are not included in organoids or spheroids. Novel strate-gies such as the air–liquid interface have been proposed to introduce immune cells into these structures, and their clinical potential has been approved (208–210). The technological modification for the culturing and editing of organoids and spheroids might bring us to a new era of the investigation of the TIME. Recent studies about the TIME rely more on transplanted tumors as well as patient-derived xenograft. Although in vivo models can relatively better reflect the real situation, the uncontrol-lability of animals increases the technical difficulty and confounding of the experiment (211). We hope that in the future, the complex structural networks of the TIME will be constructed in robust experimental models.
In addition, the majority of existing studies on spa-tial architecture of the TIME are descriptive, with most samples obtained from retrospective cross-sectional studies. We suggest analyzing the spatial architecture of the TIME in terms of temporal dynamics. For example, with superresolution intravital fluorescence microscopy, a prospective study can be carried out to investigate T cell behavior within specimens collected before and after immunotherapy to identify spatial structural changes (212). The description and tracking of the spatiotempo-ral heterogeneity and evolution of the TIME will provide additional insights into tumor diagnosis and treatment.
In summary, we consider the spatial architecture of the TIME a promising direction for academic research and clinical application in this field (Fig. 6). As an emerg-ing field, the spatial architecture of the TIME has a large
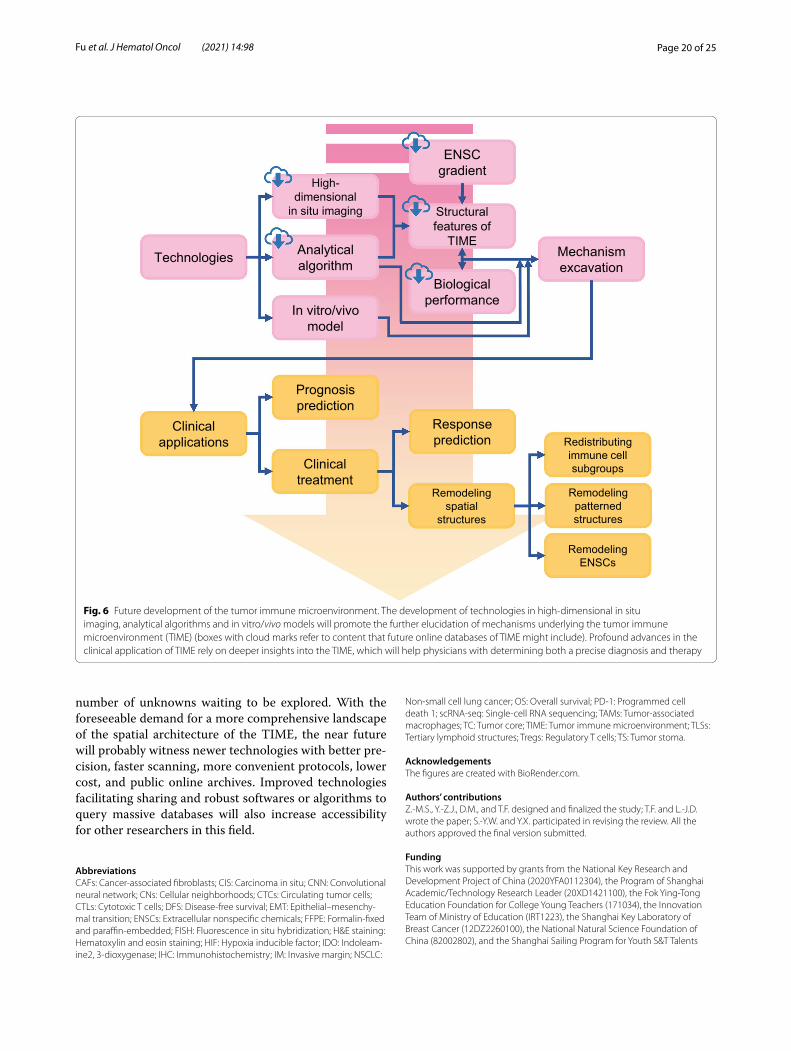
Page 20 of 25Fu et al. J Hematol Oncol (2021) 14:98
number of unknowns waiting to be explored. With the foreseeable demand for a more comprehensive landscape of the spatial architecture of the TIME, the near future will probably witness newer technologies with better pre-cision, faster scanning, more convenient protocols, lower cost, and public online archives. Improved technologies facilitating sharing and robust softwares or algorithms to query massive databases will also increase accessibility for other researchers in this field.
AbbreviationsCAFs: Cancer‑associated fibroblasts; CIS: Carcinoma in situ; CNN: Convolutional neural network; CNs: Cellular neighborhoods; CTCs: Circulating tumor cells; CTLs: Cytotoxic T cells; DFS: Disease‑free survival; EMT: Epithelial–mesenchy‑mal transition; ENSCs: Extracellular nonspecific chemicals; FFPE: Formalin‑fixed and paraffin‑embedded; FISH: Fluorescence in situ hybridization; H&E staining: Hematoxylin and eosin staining; HIF: Hypoxia inducible factor; IDO: Indoleam‑ine2, 3‑dioxygenase; IHC: Immunohistochemistry; IM: Invasive margin; NSCLC:
Non‑small cell lung cancer; OS: Overall survival; PD‑1: Programmed cell death 1; scRNA‑seq: Single‑cell RNA sequencing; TAMs: Tumor‑associated macrophages; TC: Tumor core; TIME: Tumor immune microenvironment; TLSs: Tertiary lymphoid structures; Tregs: Regulatory T cells; TS: Tumor stoma.
AcknowledgementsThe figures are created with BioRender.com.
Authors’ contributionsZ.‑M.S., Y.‑Z.J., D.M., and T.F. designed and finalized the study; T.F. and L.‑J.D. wrote the paper; S.‑Y.W. and Y.X. participated in revising the review. All the authors approved the final version submitted.
FundingThis work was supported by grants from the National Key Research and Development Project of China (2020YFA0112304), the Program of Shanghai Academic/Technology Research Leader (20XD1421100), the Fok Ying‑Tong Education Foundation for College Young Teachers (171034), the Innovation Team of Ministry of Education (IRT1223), the Shanghai Key Laboratory of Breast Cancer (12DZ2260100), the National Natural Science Foundation of China (82002802), and the Shanghai Sailing Program for Youth S&T Talents
Technologies Analytical algorithm
High-dimensional
in situ imaging
In vitro/vivomodel
ENSCgradient
Structural features of
TIME
Biological performance
Mechanism excavation
Clinical applications
Prognosis prediction
Clinical treatment
Response prediction
Remodeling spatial
structures
Redistributing immune cell subgroups
Remodeling ENSCs
Remodeling patterned structures
Fig. 6 Future development of the tumor immune microenvironment. The development of technologies in high‑dimensional in situ imaging, analytical algorithms and in vitro/vivo models will promote the further elucidation of mechanisms underlying the tumor immune microenvironment (TIME) (boxes with cloud marks refer to content that future online databases of TIME might include). Profound advances in the clinical application of TIME rely on deeper insights into the TIME, which will help physicians with determining both a precise diagnosis and therapy
Page 21 of 25Fu et al. J Hematol Oncol (2021) 14:98
(20YF1408700). The funders had no role in the study design, data collection and analysis, decision to publish, or preparation of the manuscript.
Availability of data and materialsNot applicable.
Declarations
Competing interestsThe authors declare that they have no competing interests.
Ethics approval and consent to participateNot applicable.
Consent for publicationThe content of this manuscript has not been previously published and is not under consideration for publication elsewhere. All of the authors are aware of and agree to the content of the paper and their being listed as a co‑author of the paper.
Author details1 Department of Breast Surgery, Fudan University Shanghai Cancer Center, Shanghai 200032, China. 2 Key Laboratory of Breast Cancer in Shanghai, Department of Oncology, Shanghai Medical College, Fudan University, Shang‑hai 200032, China.
Received: 14 March 2021 Accepted: 3 June 2021
References 1. Hanahan D, Weinberg RA. Hallmarks of cancer: the next generation.
Cell. 2011;144(5):646–74. 2. Anderson NM, Simon MC. The tumor microenvironment. Curr Biol.
2020;30(16):R921–5. 3. Riera‑Domingo C, Audige A, Granja S, Cheng WC, Ho PC, Baltazar F,
et al. Immunity, hypoxia, and metabolism‑the menage a trois of cancer: implications for immunotherapy. Physiol Rev. 2020;100(1):1–102.
4. Gajewski TF, Schreiber H, Fu YX. Innate and adaptive immune cells in the tumor microenvironment. Nat Immunol. 2013;14(10):1014–22.
5. Bader JE, Voss K, Rathmell JC. Targeting metabolism to improve the tumor microenvironment for cancer immunotherapy. Mol Cell. 2020;78(6):1019–33.
6. Binnewies M, Roberts EW, Kersten K, Chan V, Fearon DF, Merad M, et al. Understanding the tumor immune microenvironment (TIME) for effec‑tive therapy. Nat Med. 2018;24(5):541–50.
7. Greten FR, Grivennikov SI. Inflammation and cancer: triggers, mecha‑nisms, and consequences. Immunity. 2019;51(1):27–41.
8. Pitt JM, Marabelle A, Eggermont A, Soria JC, Kroemer G, Zitvogel L. Targeting the tumor microenvironment: removing obstruction to anticancer immune responses and immunotherapy. Ann Oncol. 2016;27(8):1482–92.
9. Zemek RM, De Jong E, Chin WL, Schuster IS, Fear VS, Casey TH, et al. Sensitization to immune checkpoint blockade through activation of a STAT1/NK axis in the tumor microenvironment. Sci Transl Med. 2019;11(501).
10. Schürch C, Bhate S, Barlow G, Phillips D, Noti L, Zlobec I, et al. Coordi‑nated cellular neighborhoods orchestrate antitumoral immunity at the colorectal cancer invasive front. Cell. 2020.
11. Casasent AK, Schalck A, Gao R, Sei E, Long A, Pangburn W, et al. Multi‑clonal invasion in breast tumors identified by topographic single cell sequencing. Cell. 2018;172(1–2):205‑17.e12.
12. Gide TN, Silva IP, Quek C, Ahmed T, Menzies AM, Carlino MS, et al. Close proximity of immune and tumor cells underlies response to anti‑PD‑1 based therapies in metastatic melanoma patients. Oncoimmunology. 2020;9(1):1659093.
13. Zhang L, Conejo‑Garcia JR, Katsaros D, Gimotty PA, Massobrio M, Reg‑nani G, et al. Intratumoral T cells, recurrence, and survival in epithelial ovarian cancer. N Engl J Med. 2003;348(3):203–13.
14. Fridman WH, Galon J, Pagès F, Tartour E, Sautès‑Fridman C, Kroemer G. Prognostic and predictive impact of intra‑ and peritumoral immune infiltrates. Cancer Res. 2011;71(17):5601–5.
15. Ali HR, Jackson HW, Zanotelli VRT, Danenberg E, Fischer JR, Bard‑well H, et al. Imaging mass cytometry and multiplatform genomics define the phenogenomic landscape of breast cancer. Nat Cancer. 2020;1(2):163–75.
16. Jackson HW, Fischer JR, Zanotelli VRT, Ali HR, Mechera R, Soysal SD, et al. The single‑cell pathology landscape of breast cancer. Nature. 2020;578(7796):615–20.
17. Arnol D, Schapiro D, Bodenmiller B, Saez‑Rodriguez J, Stegle O. Mod‑eling cell‑cell interactions from spatial molecular data with spatial variance component analysis. Cell Rep. 2019;29(1):202‑11.e6.
18. Stoltzfus CR, Filipek J, Gern BH, Olin BE, Leal JM, Wu Y, et al. CytoMAP: a spatial analysis toolbox reveals features of myeloid cell organization in lymphoid tissues. Cell Rep. 2020;31(3):107523.
19. Keren L, Bosse M, Marquez D, Angoshtari R, Jain S, Varma S, et al. A structured tumor‑immune microenvironment in triple negative breast cancer revealed by multiplexed ion beam imaging. Cell. 2018;174(6):1373‑87.e19.
20. Zhu Q, Shah S, Dries R, Cai L, Yuan G‑C. Identification of spa‑tially associated subpopulations by combining scRNAseq and sequential fluorescence in situ hybridization data. Nat Biotechnol. 2018;36(12):1183–90.
21. Schapiro D, Jackson HW, Raghuraman S, Fischer JR, Zanotelli VRT, Schulz D, et al. histoCAT: analysis of cell phenotypes and interactions in multiplex image cytometry data. Nat Methods. 2017;14(9):873–6.
22. Turkki R, Linder N, Kovanen PE, Pellinen T, Lundin J. Antibody‑super‑vised deep learning for quantification of tumor‑infiltrating immune cells in hematoxylin and eosin stained breast cancer samples. J Pathol Inform. 2016;7:38.
23. Saltz J, Gupta R, Hou L, Kurc T, Singh P, Nguyen V, et al. Spatial organi‑zation and molecular correlation of tumor‑infiltrating lymphocytes using deep learning on pathology images. Cell Rep. 2018;23(1):181‑93.e7.
24. Linder N, Taylor JC, Colling R, Pell R, Alveyn E, Joseph J, et al. Deep learn‑ing for detecting tumour‑infiltrating lymphocytes in testicular germ cell tumours. J Clin Pathol. 2019;72(2):157–64.
25. Fu Y, Jung AW, Torne RV, Gonzalez S, Vöhringer H, Shmatko A, et al. Pan‑cancer computational histopathology reveals mutations, tumor composition and prognosis. Nat Cancer. 2020;1(8):800–10.
26. Liu Y, Li X, Zheng A, Zhu X, Liu S, Hu M, et al. Predict Ki‑67 positive cells in H&E‑stained images using deep learning independently from IHC‑stained images. Front Mol Biosci. 2020;7:183.
27. Levsky JM, Singer RH. Fluorescence in situ hybridization: past, present and future. J Cell Sci. 2003;116(Pt 14):2833–8.
28. Goltsev Y, Samusik N, Kennedy‑Darling J, Bhate S, Hale M, Vazquez G, et al. Deep profiling of mouse splenic architecture with CODEX multi‑plexed imaging. Cell. 2018;174(4):968‑81 e15.
29. Coskun AF, Cai L. Dense transcript profiling in single cells by image cor‑relation decoding. Nat Methods. 2016;13(8):657–60.
30. Eng CL, Lawson M, Zhu Q, Dries R, Koulena N, Takei Y, et al. Transcrip‑tome‑scale super‑resolved imaging in tissues by RNA seqFISH. Nature. 2019;568(7751):235–9.
31. Lubeck E, Coskun AF, Zhiyentayev T, Ahmad M, Cai L. Single‑cell in situ RNA profiling by sequential hybridization. Nat Methods. 2014;11(4):360–1.
32. Keren L, Bosse M, Thompson S, Risom T, Vijayaragavan K, McCaffrey E, et al. MIBI‑TOF: A multiplexed imaging platform relates cellular pheno‑types and tissue structure. Sci Adv. 2019;5(10):eaax5851.
33. Angelo M, Bendall SC, Finck R, Hale MB, Hitzman C, Borowsky AD, et al. Multiplexed ion beam imaging of human breast tumors. Nat Med. 2014;20(4):436–42.
34. Giesen C, Wang HA, Schapiro D, Zivanovic N, Jacobs A, Hattendorf B, et al. Highly multiplexed imaging of tumor tissues with subcellular resolution by mass cytometry. Nat Methods. 2014;11(4):417–22.
35. Chang Q, Ornatsky OI, Siddiqui I, Loboda A, Baranov VI, Hedley DW. Imaging mass cytometry. Cytometry A J Int Soc Anal Cytol. 2017;91(2):160–9.
36. Satija R, Farrell JA, Gennert D, Schier AF, Regev A. Spatial reconstruction of single‑cell gene expression data. Nat Biotechnol. 2015;33(5):495–502.
Page 22 of 25Fu et al. J Hematol Oncol (2021) 14:98
37. Moncada R, Barkley D, Wagner F, Chiodin M, Devlin JC, Baron M, et al. Integrating microarray‑based spatial transcriptomics and single‑cell RNA‑seq reveals tissue architecture in pancreatic ductal adenocarcino‑mas. Nat Biotechnol. 2020;38(3):333–42.
38. Hu KH, Eichorst JP, McGinnis CS, Patterson DM, Chow ED, Kersten K, et al. ZipSeq: barcoding for real‑time mapping of single cell transcrip‑tomes. Nat Methods. 2020;17(8):833–43.
39. Crecelius AC, Schubert US, von Eggeling F. MALDI mass spectrometric imaging meets “omics”: recent advances in the fruitful marriage. Ana‑lyst. 2015;140(17):5806–20.
40. Ryan DJ, Spraggins JM, Caprioli RM. Protein identification strategies in MALDI imaging mass spectrometry: a brief review. Curr Opin Chem Biol. 2019;48:64–72.
41. xxx 42. Andrés‑Manzano MJ, Andrés V, Dorado B. Oil red O and hematoxy‑
lin and eosin staining for quantification of atherosclerosis burden in mouse aorta and aortic root. Methods Mol Biol (Clifton, NJ). 2015;1339:85–99.
43. Cardiff RD, Miller CH, Munn RJ. Manual hematoxylin and eosin staining of mouse tissue sections. Cold Spring Harb Protoc. 2014;2014(6):655–8.
44. Cottrell TR, Thompson ED, Forde PM, Stein JE, Duffield AS, Anagnostou V, et al. Pathologic features of response to neoadjuvant anti‑PD‑1 in resected non‑small‑cell lung carcinoma: a proposal for quantitative immune‑related pathologic response criteria (irPRC). Ann Oncol. 2018;29(8):1853–60.
45. Komura D, Ishikawa S. Machine learning approaches for pathologic diagnosis. Virchows Archiv Int J Pathol. 2019;475(2):131–8.
46. De Logu F, Ugolini F, Maio V, Simi S, Cossu A, Massi D, et al. Recogni‑tion of cutaneous melanoma on digitized histopathological slides via artificial intelligence algorithm. Front Oncol. 2020;10:1559.
47. Ha EJ, Baek JH, Na DG. Deep convolutional neural network models for the diagnosis of thyroid cancer. Lancet Oncol. 2019;20(3):1130.
48. Wollmann T, Gunkel M, Chung I, Erfle H, Rippe K, Rohr K. GRUU‑Net: integrated convolutional and gated recurrent neural network for cell segmentation. Med Image Anal. 2019;56:68–79.
49. Sim Y, Chung MJ, Kotter E, Yune S, Kim M, Do S, et al. Deep convolu‑tional neural network‑based software improves radiologist detec‑tion of malignant lung nodules on chest radiographs. Radiology. 2020;294(1):199–209.
50. Lian C, Liu M, Zhang J, Shen D. Hierarchical fully convolutional network for joint atrophy localization and Alzheimer’s disease diagnosis using structural MRI. IEEE Trans Pattern Anal Mach Intell. 2020;42(4):880–93.
51. Wood KJ, Bushell A, Hester J. Regulatory immune cells in transplanta‑tion. Nat Rev Immunol. 2012;12(6):417–30.
52. Faget J, Groeneveld S, Boivin G, Sankar M, Zangger N, Garcia M, et al. Neutrophils and snail orchestrate the establishment of a pro‑tumor microenvironment in lung cancer. Cell Rep. 2017;21(11):3190–204.
53. Domon B, Aebersold R. Mass spectrometry and protein analysis. Sci‑ence. 2006;312(5771):212–7.
54. The path of biomolecular mass spectrometry into open research. Nat Commun. 2019;10(1):4029.
55. Ståhl PL, Salmén F, Vickovic S, Lundmark A, Navarro JF, Magnusson J, et al. Visualization and analysis of gene expression in tissue sections by spatial transcriptomics. Science. 2016;353(6294):78–82.
56. Thrane K, Eriksson H, Maaskola J, Hansson J, Lundeberg J. Spatially resolved transcriptomics enables dissection of genetic hetero‑geneity in stage III cutaneous malignant melanoma. Cancer Res. 2018;78(20):5970–9.
57. Berglund E, Maaskola J, Schultz N, Friedrich S, Marklund M, Bergen‑strahle J, et al. Spatial maps of prostate cancer transcriptomes reveal an unexplored landscape of heterogeneity. Nat Commun. 2018;9(1):2419.
58. Villacampa EG, Larsson L, Kvastad L, Andersson A, Carlson J, Lundeberg J. Genome‑wide Spatial Expression Profiling in FFPE Tissues. BioRxiv. 2020.
59. Gruosso T, Gigoux M, Manem VSK, Bertos N, Zuo D, Perlitch I, et al. Spa‑tially distinct tumor immune microenvironments stratify triple‑negative breast cancers. J Clin Invest. 2019;129(4):1785–800.
60. Halama N, Michel S, Kloor M, Zoernig I, Benner A, Spille A, et al. Localiza‑tion and density of immune cells in the invasive margin of human colorectal cancer liver metastases are prognostic for response to chemotherapy. Cancer Res. 2011;71(17):5670–7.
61. Laghi L, Bianchi P, Miranda E, Balladore E, Pacetti V, Grizzi F, et al. CD3+ cells at the invasive margin of deeply invading (pT3‑T4) colorectal cancer and risk of post‑surgical metastasis: a longitudinal study. Lancet Oncol. 2009;10(9):877–84.
62. Roesch A, Vogt T, Stolz W, Dugas M, Landthaler M, Becker B. Discrimi‑nation between gene expression patterns in the invasive margin and the tumour core of malignant melanomas. Melanoma Res. 2003;13(5):503–9.
63. Phanthunane C, Wijers R, de Herdt M, Langeveld TPM, Koljenovic S, Dasgupta S, et al. B‑cell clusters at the invasive margin associate with longer survival in early‑stage oral‑tongue cancer patients. Oncoimmu‑nology. 2021;10(1):1882743.
64. Glajcar A, Szpor J, Pacek A, Tyrak KE, Chan F, Streb J, et al. The rela‑tionship between breast cancer molecular subtypes and mast cell populations in tumor microenvironment. Virchows Archiv Int J Pathol. 2017;470(5):505–15.
65. Lara OD, Krishnan S, Wang Z, Corvigno S, Zhong Y, Lyons Y, et al. Tumor core biopsies adequately represent immune microenvironment of high‑grade serous carcinoma. Sci Rep. 2019;9(1):17589.
66. Liu F, Liu W, Zhou S, Yang C, Tian M, Jia G, et al. Identification of FABP5 as an immunometabolic marker in human hepatocellular carcinoma. J Immunother Cancer. 2020;8(2).
67. Galon J, Costes A, Sanchez‑Cabo F, Kirilovsky A, Mlecnik B, Lagorce‑Pagès C, et al. Type, density, and location of immune cells within human colorectal tumors predict clinical outcome. Science. 2006;313(5795):1960–4.
68. Zeiner PS, Preusse C, Golebiewska A, Zinke J, Iriondo A, Muller A, et al. Distribution and prognostic impact of microglia/macrophage subpopulations in gliomas. Brain Pathol (Zurich, Switzerland). 2019;29(4):513–29.
69. Halle S, Halle O, Förster R. Mechanisms and dynamics of T cell‑mediated cytotoxicity in vivo. Trends Immunol. 2017;38(6):432–43.
70. de la Iglesia JV, Slebos RJC, Martin‑Gomez L, Wang X, Teer JK, Tan AC, et al. Effects of tobacco smoking on the tumor immune microenviron‑ment in head and neck squamous cell carcinoma. Clin Cancer Res. 2020;26(6):1474–85.
71. Kim HD, Kim JH, Ryu YM, Kim D, Lee S, Shin J, et al. Spatial distribution and prognostic implications of tumor‑infiltrating FoxP3‑ CD4+ T cells in biliary tract cancer. Cancer Res Treat. 2020.
72. Liu M, Kuo F, Capistrano KJ, Kang D, Nixon BG, Shi W, et al. TGF‑β sup‑presses type 2 immunity to cancer. Nature. 2020;587(7832):115–20.
73. Joshi K, de Massy MR, Ismail M, Reading JL, Uddin I, Woolston A, et al. Spatial heterogeneity of the T cell receptor repertoire reflects the muta‑tional landscape in lung cancer. Nat Med. 2019;25(10):1549–59.
74. Okrah K, Tarighat S, Liu B, Koeppen H, Wagle MC, Cheng G, et al. Transcriptomic analysis of hepatocellular carcinoma reveals molecular features of disease progression and tumor immune biology. NPJ Precis Oncol. 2018;2:25.
75. Zheng B, Wang D, Qiu X, Luo G, Wu T, Yang S, et al. Trajectory and func‑tional analysis of PD‑1(high) CD4(+)CD8(+) T cells in hepatocellular carcinoma by single‑cell cytometry and transcriptome sequencing. Adv Sci (Weinheim, Baden‑Wurttemberg, Germany). 2020;7(13):2000224.
76. Schwen LO, Andersson E, Korski K, Weiss N, Haase S, Gaire F, et al. Data‑driven discovery of immune contexture biomarkers. Front Oncol. 2018;8:627.
77. Lundgren S, Elebro J, Heby M, Nodin B, Leandersson K, Micke P, et al. Quantitative, qualitative and spatial analysis of lymphocyte infiltra‑tion in periampullary and pancreatic adenocarcinoma. Int J Cancer. 2020;146(12):3461–73.
78. Berthel A, Zoernig I, Valous NA, Kahlert C, Klupp F, Ulrich A, et al. Detailed resolution analysis reveals spatial T cell heterogeneity in the invasive margin of colorectal cancer liver metastases associated with improved survival. Oncoimmunology. 2017;6(3):e1286436‑e.
79. Nearchou IP, Lillard K, Gavriel CG, Ueno H, Harrison DJ, Caie PD. Auto‑mated analysis of lymphocytic infiltration, tumor budding, and their spatial relationship improves prognostic accuracy in colorectal cancer. Cancer Immunol Res. 2019;7(4):609–20.
80. Nagl S, Haas M, Lahmer G, Büttner‑Herold M, Grabenbauer GG, Fietkau R, et al. Cell‑to‑cell distances between tumor‑infiltrating inflammatory cells have the potential to distinguish functionally active from sup‑pressed inflammatory cells. Oncoimmunology. 2016;5(5):e1127494.
Page 23 of 25Fu et al. J Hematol Oncol (2021) 14:98
81. Gartrell RD, Marks DK, Hart TD, Li G, Davari DR, Wu A, et al. Quantitative analysis of immune infiltrates in primary melanoma. Cancer Immunol Res. 2018;6(4):481–93.
82. Rasmusson A, Zilenaite D, Nestarenkaite A, Augulis R, Laurinaviciene A, Ostapenko V, et al. Immunogradient indicators for antitumor response assessment by automated tumor‑stroma interface zone detection. Am J Pathol. 2020;190(6):1309–22.
83. Feichtenbeiner A, Haas M, Büttner M, Grabenbauer GG, Fietkau R, Distel LV. Critical role of spatial interaction between CD8+ and Foxp3+ cells in human gastric cancer: the distance matters. Cancer Immunol Immu‑nother. 2014;63(2):111–9.
84. Halse H, Colebatch AJ, Petrone P, Henderson MA, Mills JK, Snow H, et al. Multiplex immunohistochemistry accurately defines the immune context of metastatic melanoma. Sci Rep. 2018;8(1):11158.
85. Sautès‑Fridman C, Petitprez F, Calderaro J, Fridman WH. Tertiary lym‑phoid structures in the era of cancer immunotherapy. Nat Rev Cancer. 2019;19(6):307–25.
86. Cabrita R, Lauss M, Sanna A, Donia M, Skaarup Larsen M, Mitra S, et al. Tertiary lymphoid structures improve immunotherapy and survival in melanoma. Nature. 2020;577(7791):561–5.
87. Helmink BA, Reddy SM, Gao J, Zhang S, Basar R, Thakur R, et al. B cells and tertiary lymphoid structures promote immunotherapy response. Nature. 2020;577(7791):549–55.
88. Petitprez F, de Reyniès A, Keung EZ, Chen TW, Sun CM, Calderaro J, et al. B cells are associated with survival and immunotherapy response in sarcoma. Nature. 2020;577(7791):556–60.
89. Munn LL, Jain RK. Vascular regulation of antitumor immunity. Science. 2019;365(6453):544–5.
90. Beck B, Driessens G, Goossens S, Youssef KK, Kuchnio A, Caauwe A, et al. A vascular niche and a VEGF‑Nrp1 loop regulate the initiation and stemness of skin tumours. Nature. 2011;478(7369):399–403.
91. Pietras A, Katz AM, Ekström EJ, Wee B, Halliday JJ, Pitter KL, et al. Osteopontin‑CD44 signaling in the glioma perivascular niche enhances cancer stem cell phenotypes and promotes aggressive tumor growth. Cell Stem Cell. 2014;14(3):357–69.
92. Hayakawa Y, Ariyama H, Stancikova J, Sakitani K, Asfaha S, Renz BW, et al. Mist1 expressing gastric stem cells maintain the normal and neoplastic gastric epithelium and are supported by a perivascular stem cell niche. Cancer Cell. 2015;28(6):800–14.
93. Ghajar CM, Peinado H, Mori H, Matei IR, Evason KJ, Brazier H, et al. The perivascular niche regulates breast tumour dormancy. Nat Cell Biol. 2013;15(7):807–17.
94. Murgai M, Ju W, Eason M, Kline J, Beury DW, Kaczanowska S, et al. KLF4‑dependent perivascular cell plasticity mediates pre‑metastatic niche formation and metastasis. Nat Med. 2017;23(10):1176–90.
95. Carlson P, Dasgupta A, Grzelak CA, Kim J, Barrett A, Coleman IM, et al. Targeting the perivascular niche sensitizes disseminated tumour cells to chemotherapy. Nat Cell Biol. 2019;21(2):238–50.
96. Chen L, Oke T, Siegel N, Cojocaru G, Tam AJ, Blosser RL, et al. The immu‑nosuppressive niche of soft‑tissue sarcomas is sustained by tumor‑associated macrophages and characterized by intratumoral tertiary lymphoid structures. Clin Cancer Res. 2020;26(15):4018–30.
97. Wang Q, He Z, Huang M, Liu T, Wang Y, Xu H, et al. Vascular niche IL‑6 induces alternative macrophage activation in glioblastoma through HIF‑2α. Nat Commun. 2018;9(1):559.
98. Hughes R, Qian BZ, Rowan C, Muthana M, Keklikoglou I, Olson OC, et al. Perivascular M2 macrophages stimulate tumor relapse after chemo‑therapy. Cancer Res. 2015;75(17):3479–91.
99. Chen Z, Feng X, Herting CJ, Garcia VA, Nie K, Pong WW, et al. Cellular and molecular identity of tumor‑associated macrophages in glioblas‑toma. Cancer Res. 2017;77(9):2266–78.
100. Liu Y, Cao X. Characteristics and significance of the pre‑metastatic niche. Cancer Cell. 2016;30(5):668–81.
101. Prager BC, Xie Q, Bao S, Rich JN. Cancer stem cells: the architects of the tumor ecosystem. Cell Stem Cell. 2019;24(1):41–53.
102. Egen JG, Ouyang W, Wu LC. Human anti‑tumor immunity: insights from immunotherapy clinical trials. Immunity. 2020;52(1):36–54.
103. Datar I, Sanmamed MF, Wang J, Henick BS, Choi J, Badri T, et al. Expres‑sion analysis and significance of PD‑1, LAG‑3, and TIM‑3 in human non‑small cell lung cancer using spatially resolved and multiparametric single‑cell analysis. Clin Cancer Res. 2019;25(15):4663–73.
104. Villarroel‑Espindola F, Yu X, Datar I, Mani N, Sanmamed M, Velcheti V, et al. Spatially resolved and quantitative analysis of VISTA/PD‑1H as a novel immunotherapy target in human non‑small cell lung cancer. Clin Cancer Res. 2018;24(7):1562–73.
105. Johnson DB, Bordeaux J, Kim JY, Vaupel C, Rimm DL, Ho TH, et al. Quantitative spatial profiling of PD‑1/PD‑L1 interaction and HLA‑DR/IDO‑1 predicts improved outcomes of anti‑PD‑1 therapies in metastatic melanoma. Clin Cancer Res. 2018;24(21):5250–60.
106. Lazarus J, Maj T, Smith JJ, Perusina Lanfranca M, Rao A, D’Angelica MI, et al. Spatial and phenotypic immune profiling of metastatic colon cancer. JCI Insight. 2018;3(22).
107. Coy S, Rashid R, Lin JR, Du Z, Donson AM, Hankinson TC, et al. Multi‑plexed immunofluorescence reveals potential PD‑1/PD‑L1 pathway vulnerabilities in craniopharyngioma. Neuro Oncol. 2018;20(8):1101–12.
108. Mansfield AS, Aubry MC, Moser JC, Harrington SM, Dronca RS, Park SS, et al. Temporal and spatial discordance of programmed cell death‑ligand 1 expression and lymphocyte tumor infiltration between paired primary lesions and brain metastases in lung cancer. Ann Oncol. 2016;27(10):1953–8.
109. Zhang X, Cheng C, Hou J, Qi X, Wang X, Han P, et al. Distinct contribu‑tion of PD‑L1 suppression by spatial expression of PD‑L1 on tumor and non‑tumor cells. Cell Mol Immunol. 2019;16(4):392–400.
110. Giraldo NA, Nguyen P, Engle EL, Kaunitz GJ, Cottrell TR, Berry S, et al. Multidimensional, quantitative assessment of PD‑1/PD‑L1 expression in patients with Merkel cell carcinoma and association with response to pembrolizumab. J Immunother Cancer. 2018;6(1):99.
111. Tsakiroglou AM, Fergie M, Oguejiofor K, Linton K, Thomson D, Stern PL, et al. Spatial proximity between T and PD‑L1 expressing cells as a prognostic biomarker for oropharyngeal squamous cell carcinoma. Br J Cancer. 2020;122(4):539–44.
112. Meurette O, Mehlen P. Notch signaling in the tumor microenvironment. Cancer Cell. 2018;34(4):536–48.
113. Fu Y, Liu S, Zeng S, Shen H. The critical roles of activated stellate cells‑mediated paracrine signaling, metabolism and onco‑immunology in pancreatic ductal adenocarcinoma. Mol Cancer. 2018;17(1):62.
114. Froeling FE, Feig C, Chelala C, Dobson R, Mein CE, Tuveson DA, et al. Retinoic acid‑induced pancreatic stellate cell quiescence reduces paracrine Wnt‑beta‑catenin signaling to slow tumor progression. Gastroenterology. 2011;141(4):1486–97, 97 e1‑14.
115. Johnson DE, O’Keefe RA, Grandis JR. Targeting the IL‑6/JAK/STAT3 signalling axis in cancer. Nat Rev Clin Oncol. 2018;15(4):234–48.
116. Mariathasan S, Turley SJ, Nickles D, Castiglioni A, Yuen K, Wang Y, et al. TGFβ attenuates tumour response to PD‑L1 blockade by contributing to exclusion of T cells. Nature. 2018;554(7693):544–8.
117. Lin JX, Leonard WJ. Fine‑tuning cytokine signals. Annu Rev Immunol. 2019;37:295–324.
118. Li R, Du Y, Chen Z, Xu D, Lin T, Jin S, et al. Macroscopic somatic clonal expansion in morphologically normal human urothelium. Science. 2020;370(6512):82–9.
119. Yoshida K, Gowers KHC, Lee‑Six H, Chandrasekharan DP, Coorens T, Maughan EF, et al. Tobacco smoking and somatic mutations in human bronchial epithelium. Nature. 2020;578(7794):266–72.
120. Smola S. Immune deviation and cervical carcinogenesis. Papillomavirus Res (Amsterdam, Netherlands). 2019;7:164–7.
121. Gerdes MJ, Gökmen‑Polar Y, Sui Y, Pang AS, LaPlante N, Harris AL, et al. Single‑cell heterogeneity in ductal carcinoma in situ of breast. Mod Pathol. 2018;31(3):406–17.
122. Thompson E, Taube JM, Elwood H, Sharma R, Meeker A, Warzecha HN, et al. The immune microenvironment of breast ductal carcinoma in situ. Mod Pathol. 2016;29(3):249–58.
123. Srivastava S, Ghosh S, Kagan J, Mazurchuk R, Boja E, Chuaqui R, et al. The making of a precancer atlas: promises, challenges, and opportunities. Trends Cancer. 2018;4(8):523–36.
124. Rozenblatt‑Rosen O, Regev A, Oberdoerffer P, Nawy T, Hupalowska A, Rood JE, et al. The human tumor atlas network: charting tumor transitions across space and time at single‑cell resolution. Cell. 2020;181(2):236–49.
125. Pastushenko I, Blanpain C. EMT transition states during tumor progres‑sion and metastasis. Trends Cell Biol. 2019;29(3):212–26.
Page 24 of 25Fu et al. J Hematol Oncol (2021) 14:98
126. Puram SV, Tirosh I, Parikh AS, Patel AP, Yizhak K, Gillespie S, et al. Single‑cell transcriptomic analysis of primary and metastatic tumor ecosystems in head and neck cancer. Cell. 2017;171(7):1611‑24 e24.
127. Derks S, de Klerk LK, Xu X, Fleitas T, Liu KX, Liu Y, et al. Characterizing diversity in the tumor‑immune microenvironment of distinct subclasses of gastroesophageal adenocarcinomas. Ann Oncol. 2020;31(8):1011–20.
128. Liu LZ, Zhang Z, Zheng BH, Shi Y, Duan M, Ma LJ, et al. CCL15 recruits sup‑pressive monocytes to facilitate immune escape and disease progression in hepatocellular carcinoma. Hepatology. 2019;69(1):143–59.
129. Berthel A, Zoernig I, Valous NA, Kahlert C, Klupp F, Ulrich A, et al. Detailed resolution analysis reveals spatial T cell heterogeneity in the invasive margin of colorectal cancer liver metastases associated with improved survival. Oncoimmunology. 2017;6(3):e1286436.
130. Marliot F, Chen X, Kirilovsky A, Sbarrato T, El Sissy C, Batista L, et al. Analyti‑cal validation of the Immunoscore and its associated prognostic value in patients with colon cancer. J Immunother Cancer. 2020;8(1).
131. Pagès F, André T, Taieb J, Vernerey D, Henriques J, Borg C, et al. Prognostic and predictive value of the Immunoscore in stage III colon cancer patients treated with oxaliplatin in the prospective IDEA France PRODIGE‑GERCOR cohort study. Ann Oncol. 2020;31(7):921–9.
132. Kather JN, Poleszczuk J, Suarez‑Carmona M, Krisam J, Charoen‑tong P, Valous NA, et al. In silico modeling of immunotherapy and stroma‑targeting therapies in human colorectal cancer. Cancer Res. 2017;77(22):6442–52.
133. Gallaher JA, Enriquez‑Navas PM, Luddy KA, Gatenby RA, Anderson ARA. Spatial heterogeneity and evolutionary dynamics modulate time to recurrence in continuous and adaptive cancer therapies. Cancer Res. 2018;78(8):2127–39.
134. Kaplan RN, Riba RD, Zacharoulis S, Bramley AH, Vincent L, Costa C, et al. VEGFR1‑positive haematopoietic bone marrow progenitors initiate the pre‑metastatic niche. Nature. 2005;438(7069):820–7.
135. Chin AR, Wang SE. Cancer tills the premetastatic field: mechanistic basis and clinical implications. Clin Cancer Res. 2016;22(15):3725–33.
136. Sceneay J, Smyth MJ, Möller A. The pre‑metastatic niche: finding com‑mon ground. Cancer Metastasis Rev. 2013;32(3):449–64.
137. Giles AJ, Reid CM, Evans JD, Murgai M, Vicioso Y, Highfill SL, et al. Activa‑tion of hematopoietic stem/progenitor cells promotes immunosuppres‑sion within the pre‑metastatic niche. Cancer Res. 2016;76(6):1335–47.
138. Clever D, Roychoudhuri R, Constantinides MG, Askenase MH, Sukumar M, Klebanoff CA, et al. Oxygen sensing by T cells establishes an immunologi‑cally tolerant metastatic niche. Cell. 2016;166(5):1117‑31.e14.
139. Costa‑Silva B, Aiello NM, Ocean AJ, Singh S, Zhang H, Thakur BK, et al. Pancreatic cancer exosomes initiate pre‑metastatic niche formation in the liver. Nat Cell Biol. 2015;17(6):816–26.
140. Chen XW, Yu TJ, Zhang J, Li Y, Chen HL, Yang GF, et al. CYP4A in tumor‑associated macrophages promotes pre‑metastatic niche formation and metastasis. Oncogene. 2017;36(35):5045–57.
141. Liu Y, Gu Y, Han Y, Zhang Q, Jiang Z, Zhang X, et al. Tumor exosomal RNAs promote lung pre‑metastatic niche formation by activating alveolar epithelial TLR3 to recruit neutrophils. Cancer Cell. 2016;30(2):243–56.
142. Peinado H, Zhang H, Matei IR, Costa‑Silva B, Hoshino A, Rodrigues G, et al. Pre‑metastatic niches: organ‑specific homes for metastases. Nat Rev Cancer. 2017;17(5):302–17.
143. Lin D, Chen X, Lin Z, Lin J, Liu Y, Liu D. Paper‑supported co‑culture system for dynamic investigating the lung‑tropic migration of breast cancer cells. Biomed Mater (Bristol, England). 2020.
144. Roblek M, Calin M, Schlesinger M, Stan D, Zeisig R, Simionescu M, et al. Targeted delivery of CCR2 antagonist to activated pulmonary endothe‑lium prevents metastasis. J Control Release. 2015;220(Pt A):341–7.
145. García‑Caballero M, Van de Velde M, Blacher S, Lambert V, Balsat C, Erpi‑cum C, et al. Modeling pre‑metastatic lymphvascular niche in the mouse ear sponge assay. Sci Rep. 2017;7:41494.
146. Ouzounova M, Lee E, Piranlioglu R, El Andaloussi A, Kolhe R, Demirci MF, et al. Monocytic and granulocytic myeloid derived suppressor cells differentially regulate spatiotemporal tumour plasticity during metastatic cascade. Nat Commun. 2017;8:14979.
147. Tsai JH, Donaher JL, Murphy DA, Chau S, Yang J. Spatiotemporal regula‑tion of epithelial‑mesenchymal transition is essential for squamous cell carcinoma metastasis. Cancer Cell. 2012;22(6):725–36.
148. Ombrato L, Nolan E, Kurelac I, Mavousian A, Bridgeman VL, Heinze I, et al. Metastatic‑niche labelling reveals parenchymal cells with stem features. Nature. 2019;572(7771):603–8.
149. Massagué J, Obenauf AC. Metastatic colonization by circulating tumour cells. Nature. 2016;529(7586):298–306.
150. Zhang AW, McPherson A, Milne K, Kroeger DR, Hamilton PT, Miranda A, et al. Interfaces of malignant and immunologic clonal dynamics in ovar‑ian cancer. Cell. 2018;173(7):1755‑69 e22.
151. Angelova M, Mlecnik B, Vasaturo A, Bindea G, Fredriksen T, Lafontaine L, et al. Evolution of metastases in space and time under immune selection. Cell. 2018;175(3):751‑65.e16.
152. Kim TM, Jung SH, An CH, Lee SH, Baek IP, Kim MS, et al. Subclonal genomic architectures of primary and metastatic colorectal can‑cer based on intratumoral genetic heterogeneity. Clin Cancer Res. 2015;21(19):4461–72.
153. Chang CH, Qiu J, O’Sullivan D, Buck MD, Noguchi T, Curtis JD, et al. Meta‑bolic competition in the tumor microenvironment is a driver of cancer progression. Cell. 2015;162(6):1229–41.
154. Lyssiotis CA, Kimmelman AC. Metabolic interactions in the tumor micro‑environment. Trends Cell Biol. 2017;27(11):863–75.
155. Vaupel P, Kallinowski F, Okunieff P. Blood flow, oxygen and nutrient sup‑ply, and metabolic microenvironment of human tumors: a review. Cancer Res. 1989;49(23):6449–65.
156. Vaupel P, Harrison L. Tumor hypoxia: causative factors, compensatory mechanisms, and cellular response. Oncologist. 2004;9(Suppl 5):4–9.
157. Viallard C, Larrivée B. Tumor angiogenesis and vascular normalization: alternative therapeutic targets. Angiogenesis. 2017;20(4):409–26.
158. Dewhirst MW, Ong ET, Klitzman B, Secomb TW, Vinuya RZ, Dodge R, et al. Perivascular oxygen tensions in a transplantable mammary tumor grow‑ing in a dorsal flap window chamber. Radiat Res. 1992;130(2):171–82.
159. Lyng H, Sundfør K, Tropé C, Rofstad EK. Oxygen tension and vascular density in human cervix carcinoma. Br J Cancer. 1996;74(10):1559–63.
160. Yeom CJ, Goto Y, Zhu Y, Hiraoka M, Harada H. Microenvironments and cel‑lular characteristics in the micro tumor cords of malignant solid tumors. Int J Mol Sci. 2012;13(11):13949–65.
161. Helmlinger G, Yuan F, Dellian M, Jain RK. Interstitial pH and pO2 gradients in solid tumors in vivo: high‑resolution measurements reveal a lack of correlation. Nat Med. 1997;3(2):177–82.
162. Vaupel P, Fortmeyer HP, Runkel S, Kallinowski F. Blood flow, oxygen con‑sumption, and tissue oxygenation of human breast cancer xenografts in nude rats. Cancer Res. 1987;47(13):3496–503.
163. Milotti E, Fredrich T, Chignola R, Rieger H. Oxygen in the tumor microen‑vironment: mathematical and numerical modeling. Adv Exp Med Biol. 2020;1259:53–76.
164. Cao X, Allu SR, Jiang S, Gunn Bs JR, Yao Ph DC, Xin Ph DJ, et al. High‑resolution pO2 imaging improves quantification of the hypoxic fraction in tumors during radiation therapy. Int J Radiat Oncol Biol Phys. 2021;109(2):603–13.
165. Kasinskas RW, Venkatasubramanian R, Forbes NS. Rapid uptake of glucose and lactate, and not hypoxia, induces apoptosis in three‑dimensional tumor tissue culture. Integr Biol Quant Biosci Nano Macro. 2014;6(4):399–410.
166. Riera‑Domingo C, Audigé A, Granja S, Cheng WC, Ho PC, Baltazar F, et al. Immunity, hypoxia, and metabolism‑the ménage à trois of cancer: impli‑cations for immunotherapy. Physiol Rev. 2020;100(1):1–102.
167. Laoui D, Van Overmeire E, Di Conza G, Aldeni C, Keirsse J, Morias Y, et al. Tumor hypoxia does not drive differentiation of tumor‑associated macrophages but rather fine‑tunes the M2‑like macrophage population. Cancer Res. 2014;74(1):24–30.
168. Takeda N, O’Dea EL, Doedens A, Kim JW, Weidemann A, Stockmann C, et al. Differential activation and antagonistic function of HIF‑{alpha} isoforms in macrophages are essential for NO homeostasis. Genes Dev. 2010;24(5):491–501.
169. Henze AT, Mazzone M. The impact of hypoxia on tumor‑associated macrophages. J Clin Invest. 2016;126(10):3672–9.
170. Franklin RA, Liao W, Sarkar A, Kim MV, Bivona MR, Liu K, et al. The cel‑lular and molecular origin of tumor‑associated macrophages. Science. 2014;344(6186):921–5.
171. Taylor CT, Colgan SP. Regulation of immunity and inflammation by hypoxia in immunological niches. Nat Rev Immunol. 2017;17(12):774–85.
Page 25 of 25Fu et al. J Hematol Oncol (2021) 14:98
172. Dehne N, Mora J, Namgaladze D, Weigert A, Brüne B. Cancer cell and macrophage cross‑talk in the tumor microenvironment. Curr Opin Phar‑macol. 2017;35:12–9.
173. Kumar V, Gabrilovich DI. Hypoxia‑inducible factors in regulation of immune responses in tumour microenvironment. Immunology. 2014;143(4):512–9.
174. Kim BJ, Forbes NS. Single‑cell analysis demonstrates how nutrient deprivation creates apoptotic and quiescent cell populations in tumor cylindroids. Biotechnol Bioeng. 2008;101(4):797–810.
175. Wyss MT, Hofer S, Hefti M, Bärtschi E, Uhlmann C, Treyer V, et al. Spatial heterogeneity of low‑grade gliomas at the capillary level: a PET study on tumor blood flow and amino acid uptake. J Nucl Med. 2007;48(7):1047–52.
176. Leslie TK, James AD, Zaccagna F, Grist JT, Deen S, Kennerley A, et al. Sodium homeostasis in the tumour microenvironment. Biochim Biophys Acta. 2019;1872(2):188304.
177. Tan JWY, Folz J, Kopelman R, Wang X. In vivo photoacoustic potas‑sium imaging of the tumor microenvironment. Biomed Opt Express. 2020;11(7):3507–22.
178. Bian Y, Li W, Kremer DM, Sajjakulnukit P, Li S, Crespo J, et al. Cancer SLC43A2 alters T cell methionine metabolism and histone methylation. Nature. 2020;585(7824):277–82.
179. Cascone T, McKenzie JA, Mbofung RM, Punt S, Wang Z, Xu C, et al. Increased tumor glycolysis characterizes immune resistance to adoptive T cell therapy. Cell Metab. 2018;27(5):977‑87.e4.
180. Galon J, Fridman WH, Pages F. The adaptive immunologic micro‑environment in colorectal cancer: a novel perspective. Cancer Res. 2007;67(5):1883–6.
181. Angell H, Galon J. From the immune contexture to the Immunoscore: the role of prognostic and predictive immune markers in cancer. Curr Opin Immunol. 2013;25(2):261–7.
182. Pagès F, Mlecnik B, Marliot F, Bindea G, Ou FS, Bifulco C, et al. Inter‑national validation of the consensus Immunoscore for the clas‑sification of colon cancer: a prognostic and accuracy study. Lancet. 2018;391(10135):2128–39.
183. Van den Eynde M, Mlecnik B, Bindea G, Fredriksen T, Church SE, Lafontaine L, et al. The link between the multiverse of immune microenvironments in metastases and the survival of colorectal cancer patients. Cancer Cell. 2018;34(6):1012‑26.e3.
184. Fortis SP, Sofopoulos M, Sotiriadou NN, Haritos C, Vaxevanis CK, Anastaso‑poulou EA, et al. Differential intratumoral distributions of CD8 and CD163 immune cells as prognostic biomarkers in breast cancer. J Immunother Cancer. 2017;5:39.
185. Pagès F, Kirilovsky A, Mlecnik B, Asslaber M, Tosolini M, Bindea G, et al. In situ cytotoxic and memory T cells predict outcome in patients with early‑stage colorectal cancer. J Clin Oncol. 2009;27(35):5944–51.
186. Barua S, Fang P, Sharma A, Fujimoto J, Wistuba I, Rao AUK, et al. Spatial interaction of tumor cells and regulatory T cells correlates with survival in non‑small cell lung cancer. Lung Cancer (Amsterdam, Netherlands). 2018;117:73–9.
187. Mahmoud SM, Paish EC, Powe DG, Macmillan RD, Grainge MJ, Lee AH, et al. Tumor‑infiltrating CD8+ lymphocytes predict clinical outcome in breast cancer. J Clin Oncol. 2011;29(15):1949–55.
188. Mezheyeuski A, Bergsland CH, Backman M, Djureinovic D, Sjöblom T, Bruun J, et al. Multispectral imaging for quantitative and compartment‑specific immune infiltrates reveals distinct immune profiles that classify lung cancer patients. J Pathol. 2018;244(4):421–31.
189. Enfield KSS, Martin SD, Marshall EA, Kung SHY, Gallagher P, Milne K, et al. Hyperspectral cell sociology reveals spatial tumor‑immune cell interac‑tions associated with lung cancer recurrence. J Immunother Cancer. 2019;7(1):13.
190. Dieu‑Nosjean MC, Antoine M, Danel C, Heudes D, Wislez M, Poulot V, et al. Long‑term survival for patients with non‑small‑cell lung cancer with intratumoral lymphoid structures. J Clin Oncol. 2008;26(27):4410–7.
191. Dieu‑Nosjean MC, Goc J, Giraldo NA, Sautès‑Fridman C, Fridman WH. Tertiary lymphoid structures in cancer and beyond. Trends Immunol. 2014;35(11):571–80.
192. Sofopoulos M, Fortis SP, Vaxevanis CK, Sotiriadou NN, Arnogiannaki N, Ardavanis A, et al. The prognostic significance of peritumoral tertiary
lymphoid structures in breast cancer. Cancer Immunol Immunother. 2019;68(11):1733–45.
193. García‑Hernández ML, Uribe‑Uribe NO, Espinosa‑González R, Kast WM, Khader SA, Rangel‑Moreno J. A unique cellular and molecular microenvironment is present in tertiary lymphoid organs of patients with spontaneous prostate cancer regression. Front Immunol. 2017;8:563.
194. Doherty ML. Laminitis in beef bulls. Vet Rec. 1987;121(6):134. 195. Kagen LJ, Gurevich R. Precipitin reactions of anti‑human myoglobin
serum with several human and animal muscle extracts. Immunology. 1967;12(6):667–73.
196. Karaca Z, Tanriverdi F, Unluhizarci K, Ozturk F, Gokahmetoglu S, Elbuken G, et al. VEGFR1 expression is related to lymph node metastasis and serum VEGF may be a marker of progression in the follow‑up of patients with differentiated thyroid carcinoma. Eur J Endocrinol. 2011;164(2):277–84.
197. Xu WW, Li B, Lam AK, Tsao SW, Law SY, Chan KW, et al. Targeting VEGFR1‑ and VEGFR2‑expressing non‑tumor cells is essential for esophageal cancer therapy. Oncotarget. 2015;6(3):1790–805.
198. Liu X, Bao X, Hu M, Chang H, Jiao M, Cheng J, et al. Inhibition of PCSK9 potentiates immune checkpoint therapy for cancer. Nature. 2020.
199. Imtiyaz HZ, Williams EP, Hickey MM, Patel SA, Durham AC, Yuan LJ, et al. Hypoxia‑inducible factor 2alpha regulates macrophage func‑tion in mouse models of acute and tumor inflammation. J Clin Invest. 2010;120(8):2699–714.
200. Chen J, Luo H, Liu Y, Zhang W, Li H, Luo T, et al. Oxygen‑self‑produced nanoplatform for relieving hypoxia and breaking resistance to sonody‑namic treatment of pancreatic cancer. ACS Nano. 2017;11(12):12849–62.
201. Liu H, Jiang W, Wang Q, Hang L, Wang Y, Wang Y. ROS‑sensitive biomi‑metic nanocarriers modulate tumor hypoxia for synergistic photody‑namic chemotherapy. Biomater Sci. 2019;7(9):3706–16.
202. Fukumura D, Kloepper J, Amoozgar Z, Duda DG, Jain RK. Enhancing cancer immunotherapy using antiangiogenics: opportunities and chal‑lenges. Nat Rev Clin Oncol. 2018;15(5):325–40.
203. Alonso‑Nocelo M, Raimondo TM, Vining KH, López‑López R, de la Fuente M, Mooney DJ. Matrix stiffness and tumor‑associated macrophages modulate epithelial to mesenchymal transition of human adenocarci‑noma cells. Biofabrication. 2018;10(3):035004.
204. Najafi M, Farhood B, Mortezaee K. Extracellular matrix (ECM) stiffness and degradation as cancer drivers. J Cell Biochem. 2019;120(3):2782–90.
205. Zhong W, Weiss HL, Jayswal RD, Hensley PJ, Downes LM, St Clair DK, et al. Extracellular redox state shift: a novel approach to target prostate cancer invasion. Free Radical Biol Med. 2018;117:99–109.
206. Marusyk A, Tabassum DP, Janiszewska M, Place AE, Trinh A, Rozhok AI, et al. Spatial proximity to fibroblasts impacts molecular features and therapeutic sensitivity of breast cancer cells influencing clinical out‑comes. Can Res. 2016;76(22):6495–506.
207. Kook YM, Jeong Y, Lee K, Koh WG. Design of biomimetic cellular scaffolds for co‑culture system and their application. J Tissue Eng. 2017;8:2041731417724640.
208. Tuveson D, Clevers H. Cancer modeling meets human organoid technol‑ogy. Science. 2019;364(6444):952–5.
209. Neal JT, Li X, Zhu J, Giangarra V, Grzeskowiak CL, Ju J, et al. Organoid mod‑eling of the tumor immune microenvironment. Cell. 2018;175(7):1972‑88.e16.
210. Yuki K, Cheng N, Nakano M, Kuo CJ. Organoid models of tumor immunol‑ogy. Trends Immunol. 2020;41(8):652–64.
211. Bedognetti D, Ceccarelli M, Galluzzi L, Lu R, Palucka K, Samayoa J, et al. Toward a comprehensive view of cancer immune responsiveness: a synopsis from the SITC workshop. J Immunother Cancer. 2019;7(1):131.
212. Lau D, Garçon F, Chandra A, Lechermann L, Aloj L, Chilvers E, et al. Intravital imaging of adoptive t‑cell morphology, mobility and trafficking following immune checkpoint inhibition in a mouse melanoma model. Front Immunol. 2020;11:1514.
Publisher’s NoteSpringer Nature remains neutral with regard to jurisdictional claims in pub‑lished maps and institutional affiliations.