spatial and temporal characterization of soft bottom polychaetes in a shallow tropical bay (lattig...
TRANSCRIPT

8/4/2019 Spatial and Temporal Characterization of Soft Bottom Polychaetes in a Shallow Tropical Bay (Lattig Et Al, 2005)
http://slidepdf.com/reader/full/spatial-and-temporal-characterization-of-soft-bottom-polychaetes-in-a-shallow 1/18
Bol. Invest. Mar. Cost. 35 19-36 ISSN 0122-9761 Santa Marta, Colombia, 2006
19 Instituto de Investigaciones Marinas y Costeras - INVEMAR
SPATIAL AND TEMPORAL CHARACTERIZATION OF SOFT
BOTTOM POLYCHAETES IN A SHALLOW TROPICAL BAY
(COLOMBIAN CARIBBEAN)
Angela I. Guzmán-Alvis1 , Patricia Lattig2 and José A. Ruiz2
1 Universidad Nacional de Colombia (sede Palmira), Carrera 32 vía La Candelaria, Palmira, Colombia.
E-mail: [email protected]
2 Instituto de Investigaciones Marinas y Costeras (INVEMAR), Cerro Punta Betín, Santa Marta, Colombia.
E-mail: [email protected] (PLM); [email protected] (JAR)
ABSTRACT
The spatial and temporal variations of the polychaete assemblages were studied within and off a
shallow (10-25 m) tropical bay (Bahía de Portete). The polychaete abundances at family level and their trophic
mechanisms were used for this purpose. Sediment samples were collected at six stations in this bay during
the wet and dry seasons. Multivariate analysis indicated that off- Bay polychaete assemblages were different
from the bay ones; this spatial variation was related to sedimentary characteristics, depth and turbid-water
conditions. On the other hand, these assemblages did not show significant differences between the dry and wet
seasons. The differences between these two assemblages were given specially by the Syllidae, Gonidadidae,
Nephtyidae, Dorvilleidae, Ampharetidae, Sabellidae, Glyceridae, Lumbrineridae, Opheliidae and Maldanidae
families, being more abundant and frequent off the bay, while Magelonidae, Cirratulidae, Cossuridae and
Eulephetidae were more abundant and frequent within the bay. The first ten families were related to a higher
sand content, lower organic matter content and lower turbid-water conditions; while the last four were related to
higher mud percentages, higher organic matter content and higher turbid-water conditions. Trophic guilds data
showed similar assemblages as described above, which differ in their feeding mechanisms; the bay stations were
dominated by surface and subsurface deposit feeders showing the importance of detritus; while off-bay stations
the carnivores were the dominant organisms, reflecting the high predation. In these assemblages, the trophic and
taxonomic structure is more affected by the spatial variation in the physical characteristics of the water column
and sediment than by the seasonal variation.
KEY WORDS: Tropic, Polychaetes, Trophic groups, Taxonomic structure, Bahía de Portete.
RESUMEN
Caracterización espacial y temporal de los poliquetos de fondos blandos en una Bahía tropical
(Caribe colombiano). Las variaciones espaciales y temporales de las asociaciones de poliquetos fueron
Contribución No. 955 del Instituto de Investigaciones Marinas y Costeras – INVEMAR

8/4/2019 Spatial and Temporal Characterization of Soft Bottom Polychaetes in a Shallow Tropical Bay (Lattig Et Al, 2005)
http://slidepdf.com/reader/full/spatial-and-temporal-characterization-of-soft-bottom-polychaetes-in-a-shallow 2/18
20 Boletín de Investigaciones Marinas y Costeras - Vol. 35-2006
estudiadas dentro y fuera de una bahía somera (10-25m) tropical (Bahía de Portete). Para este propósito se usó
la abundancia de poliquetos a nivel de familia y sus mecanismos tróficos. Las muestras de sedimentos fueron
colectadas en seis estaciones de ésta Bahía durante la época húmeda y seca. Los análisis multivariados indicaron
que las asociaciones de poliquetos fuera de la bahía fueron diferentes de las del interior; esta variación espacial
estuvo relacionada con las características sedimentarias, la profundidad y las condiciones de turbidez del agua.
Por otro lado, estas asociaciones no mostraron diferencias significativas entre la época seca y húmeda. Las
diferencias entre estas dos asociaciones estuvieron dadas especialmente por las familias Syllidae, Gonidadidae,Nephtyidae, Dorvilleidae, Ampharetidae, Sabellidae, Glyceridae, Lumbrineridae, Opheliidae y Maldanidae,
que fueron más abundantes y frecuentes fuera de la bahía; mientras que Magelonidae, Cirratulidae, Cossuridae
y Eulephetidae fueron más abundantes y frecuentes dentro de la bahía. Las primeras diez familias estuvieron
relacionadas con altos contenidos de arenas, bajos contenidos de materia orgánica en el sedimento y baja
turbidez en la columna de agua; mientras que las cuatro últimas estuvieron relacionadas con altos porcentajes
de cienos y materia orgánica en los sedimentos y alta turbidez. Los datos de los gremios tróficos mostraron
asociaciones similares a los descritos anteriormente, los que se diferencian en sus mecanismos de alimentación;
en las estaciones de la bahía dominaron los alimentadores de depósito de superficie y sub-superficie mostrando la
importancia del detritus; mientras que en las estaciones afuera de la bahía dominaron los carnívoros, reflejando
una alta depredación. En estas asociaciones, la estructura taxonómica y trófica está más afectada por la variación
espacial de las características físicas de la columna de agua y sedimento que por la variación estacional.
PALABRAS CLAVE: Trópico, Poliquetos, Grupos tróficos, Estructura taxonómica, Bahía de Portete.
INTRODUCTION
There are many studies about the structure of sedimentary soft-bottom
communities of coastal areas in temperate zones. Thus the theory related with assemblagestructure is based mainly on these studies; by contrast, quantitative data from tropical
areas are quite scarce (Alongi, 1990; Gray, 2002). The lack of information and the fast
deterioration of tropical coastal zones make it difficult to understand and evaluate the
natural - and anthropogenic- originated impact on the structure and function of these
ecosystems.
The distribution of benthic fauna widely varies over time and space due to the
heterogeneous distributions of benthic habitats (Mistri et al ., 2000). Studies carried out
in temperate zone at a small scale (1º latitude) have shown that the assemblage structure
varies with small depth changes (Gray, 2002); and the distribution and abundance of
benthic organisms are affected by spatial variations in salinity and sediment composition
(Zajac and Whitlatch, 1982; Mannino and Montagna, 1997; Gray, 2002). At an annual
scale, the climate in temperate regions is markedly seasonal and hydrodynamic conditions
affect the patterns of organic matter sedimentation and benthic community.
There exists information favoring seasonal variations in the benthic communities
in the tropics, as well as, evidence to the contrary. Parsons et al ., (1995) show that
the seasonal variations are small because of the relative homogeneous conditions in

8/4/2019 Spatial and Temporal Characterization of Soft Bottom Polychaetes in a Shallow Tropical Bay (Lattig Et Al, 2005)
http://slidepdf.com/reader/full/spatial-and-temporal-characterization-of-soft-bottom-polychaetes-in-a-shallow 3/18
21 Instituto de Investigaciones Marinas y Costeras - INVEMAR
temperature and salinity, and that the changes occurring in benthic communities may be
due to predation preventing space monopolization by one single species. On the other
hand, Alongi (1989) shows that the climate and its effect on shallow benthos vary greatly
within the tropics. The magnitude of seasonal fluctuations depends upon the distance
from the equator; the habitats near equator show less seasonal variability than the tropical
assemblages that are closer to the poles. For instance, in India the richness of tropicalassemblages and benthic density is heavily influenced by seasonal changes in rainfall
and run-off (Longhurst and Pauly, 1987; Alongi, 1990). In some Caribbean areas as
Jamaica, Venezuela, Colombia, the richness and density do not change significantly with
the season (Jackson, 1972; Bone and Klein, 2000; Guzmán-Alvis et al ., 2001; Guzmán-
Alvis and Carrasco, 2005b). However apparently there is no enough evidence describing
the patterns in the tropics.
The benthic infaunal communities are organized structurally, numerically and
functionally in relation to gradients of resource availability, modified by interactions withother environmental factors (Pearson and Rosenberg, 1987; Wieking and Kröncke, 2005).
Since the primary food source for benthos originates, with a few localized exceptions,
in euphotic surface waters, food availability decreases with depth and declining current
speed. Water movement driven by currents, tides, strong wind and other forces transports
food particles in the water mass and causes resuspension of bottom sediments (Pearson
and Rosenberg, 1987). This transport is of significant importance for the distribution of
food to benthic animals. Species distribution may be seen as a response to the varying
effects of these modified gradients. Such distributions are further affected, by other
factors. These are, in general, physical factors contributing to the relative environmental
harshness imposed on each species, e.g. sedimentary fluctuations in stability and in
turbidity, salinity, oxygen, temperature and pressure. Other factors which exert effects
independently of the primary gradients can be summarized as stochastic events and
biotic interactions. These factors influence community distributions (Pearson and
Rosenberg, 1987).
We hypothesized that the structural variability of these polychaete assemblages
is more affected by the spatial pattern than by the seasonal one, because the spatial
heterogeneity (the coastal shape determines the hydrodynamic conditions affecting thewater column characteristics and the sediment) is stronger than the seasonal variations.
The purpose of this study is to determine the spatial and temporal variations in
the polychaete assemblages in relation to sediment (grain size and organic matter) and
water column (salinity, transparency, dissolved oxygen content, temperature) variables,
measured in both seasons (dry and wet) and two different places (within and off the
bay). The structural changes were evaluated according to taxa composition and trophic
groups.

8/4/2019 Spatial and Temporal Characterization of Soft Bottom Polychaetes in a Shallow Tropical Bay (Lattig Et Al, 2005)
http://slidepdf.com/reader/full/spatial-and-temporal-characterization-of-soft-bottom-polychaetes-in-a-shallow 4/18
22 Boletín de Investigaciones Marinas y Costeras - Vol. 35-2006
STUDY AREA
Bahía de Portete is located in the northeastern part of Colombia (12º07ʼN and
72º02ʼW). It has an approximate area of 125 km2 with an average depth of 9 m and a
maximum of 20 m. The Bayʼs only connection with the Caribbean Sea is a 2 km inlet
(Solano, 1994). The climate of the region is regulated by the NE trade winds; duringthe dry season the trade winds are strong and continuous and the precipitation and
temperatures are low (Dec-Apr) (Figure 1). During the wet season the winds are weak,
the precipitation is high and the temperature increases (May-Nov) (Andrade, 2000).
Bahía de Portete shows high salinity values (34-37), high temperatures (25-
30oC), and high turbidity in the water column (1-4 m). There is no oxygen deficiency (5-8
mg*l-1) (Solano, 1994); whereas water temperatures and salinities are the highest during
the dry season.
A coastal upwelling occurs in this area especially during the dry season (Andrade,2000); providing a high amount of nutrients to the bay ecosystems. The bay is a diverse
Figure 1. Annual rainfall (a) and air temperature (b). Dry season (Dec-Apr) and wet season (May-Nov). Thevalues correspond to the annual media of the last 16 years. Data were taken from Instituto de HidrologíaMeteorología y Estudios ambientales IDEAM (Colombia).
a)
b)

8/4/2019 Spatial and Temporal Characterization of Soft Bottom Polychaetes in a Shallow Tropical Bay (Lattig Et Al, 2005)
http://slidepdf.com/reader/full/spatial-and-temporal-characterization-of-soft-bottom-polychaetes-in-a-shallow 5/18
23 Instituto de Investigaciones Marinas y Costeras - INVEMAR
ecosystem comprised by a mangrove forest dominated by Rhizophora mangle andAvicennia
germinans; seagrass meadows of Thalassia testudinum and Syringodium filiforme; and
poorly developed fringing reefs at the east and south of the bay (Solano, 1994). The soft
bottoms are basically mud covering a high proportion of the bay (Figure 2).
Figure 2. Bahía de Portete ecosystem (Southern Caribbean). The numbers represent the stations in whichsamples were taken.
MATERIALS AND METHODS
Two replicate samples of sediment were taken from each of six stations using a
van Veen grab (0.08 m2). Four stations were located within the bay and two off the bay. The
samples were taken at the end of the wet season (December 2003) and during the dry season
(January 2004) (Figure 2). The effect of rain and drought on the benthos is not considered
immediate; this effect may lag at least one month (Zajac and Whitlatch, 1982; Krönckeet al ., 1998; Guzmán-Alvis, 2004). In spite of the fact that the sampled months were
consecutive, the lag effect allows to assess temporal differences. The sediment was sieved
through a 0.5 mm mesh screen. The polychaetes were identified at family level because
of the scarce taxonomic description to species level available for the area. According to
different authors, the identification of organisms to species level is not always necessary to
describe spatial patterns; indeed data at higher taxonomic levels assess much of community
structure variations (Guzmán and García, 1996; Olsgard et al., 1998; Guzmán-Alvis and
Carrasco, 2005a). Abundance was obtained as number of individuals per 0.08 m -2.
8/4/2019 Spatial and Temporal Characterization of Soft Bottom Polychaetes in a Shallow Tropical Bay (Lattig Et Al, 2005)
http://slidepdf.com/reader/full/spatial-and-temporal-characterization-of-soft-bottom-polychaetes-in-a-shallow 6/18
24 Boletín de Investigaciones Marinas y Costeras - Vol. 35-2006
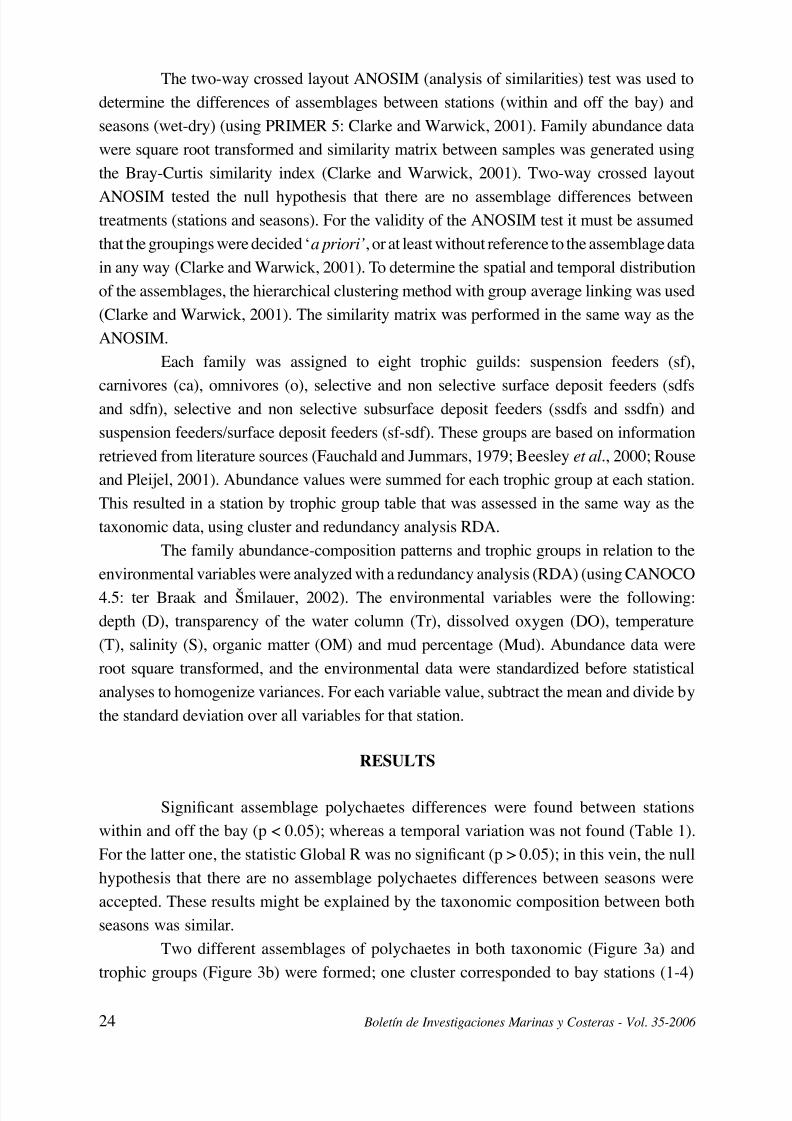
The two-way crossed layout ANOSIM (analysis of similarities) test was used to
determine the differences of assemblages between stations (within and off the bay) and
seasons (wet-dry) (using PRIMER 5: Clarke and Warwick, 2001). Family abundance data
were square root transformed and similarity matrix between samples was generated using
the Bray-Curtis similarity index (Clarke and Warwick, 2001). Two-way crossed layout
ANOSIM tested the null hypothesis that there are no assemblage differences betweentreatments (stations and seasons). For the validity of the ANOSIM test it must be assumed
that the groupings were decided ̒ a prioriʼ, or at least without reference to the assemblage data
in any way (Clarke and Warwick, 2001). To determine the spatial and temporal distribution
of the assemblages, the hierarchical clustering method with group average linking was used
(Clarke and Warwick, 2001). The similarity matrix was performed in the same way as the
ANOSIM.
Each family was assigned to eight trophic guilds: suspension feeders (sf),
carnivores (ca), omnivores (o), selective and non selective surface deposit feeders (sdfsand sdfn), selective and non selective subsurface deposit feeders (ssdfs and ssdfn) and
suspension feeders/surface deposit feeders (sf-sdf). These groups are based on information
retrieved from literature sources (Fauchald and Jummars, 1979; Beesley et al ., 2000; Rouse
and Pleijel, 2001). Abundance values were summed for each trophic group at each station.
This resulted in a station by trophic group table that was assessed in the same way as the
taxonomic data, using cluster and redundancy analysis RDA.
The family abundance-composition patterns and trophic groups in relation to the
environmental variables were analyzed with a redundancy analysis (RDA) (using CANOCO
4.5: ter Braak and Šmilauer, 2002). The environmental variables were the following:depth (D), transparency of the water column (Tr), dissolved oxygen (DO), temperature
(T), salinity (S), organic matter (OM) and mud percentage (Mud). Abundance data were
root square transformed, and the environmental data were standardized before statistical
analyses to homogenize variances. For each variable value, subtract the mean and divide by
the standard deviation over all variables for that station.
RESULTS
Significant assemblage polychaetes differences were found between stations
within and off the bay (p < 0.05); whereas a temporal variation was not found (Table 1).
For the latter one, the statistic Global R was no significant (p > 0.05); in this vein, the null
hypothesis that there are no assemblage polychaetes differences between seasons were
accepted. These results might be explained by the taxonomic composition between both
seasons was similar.
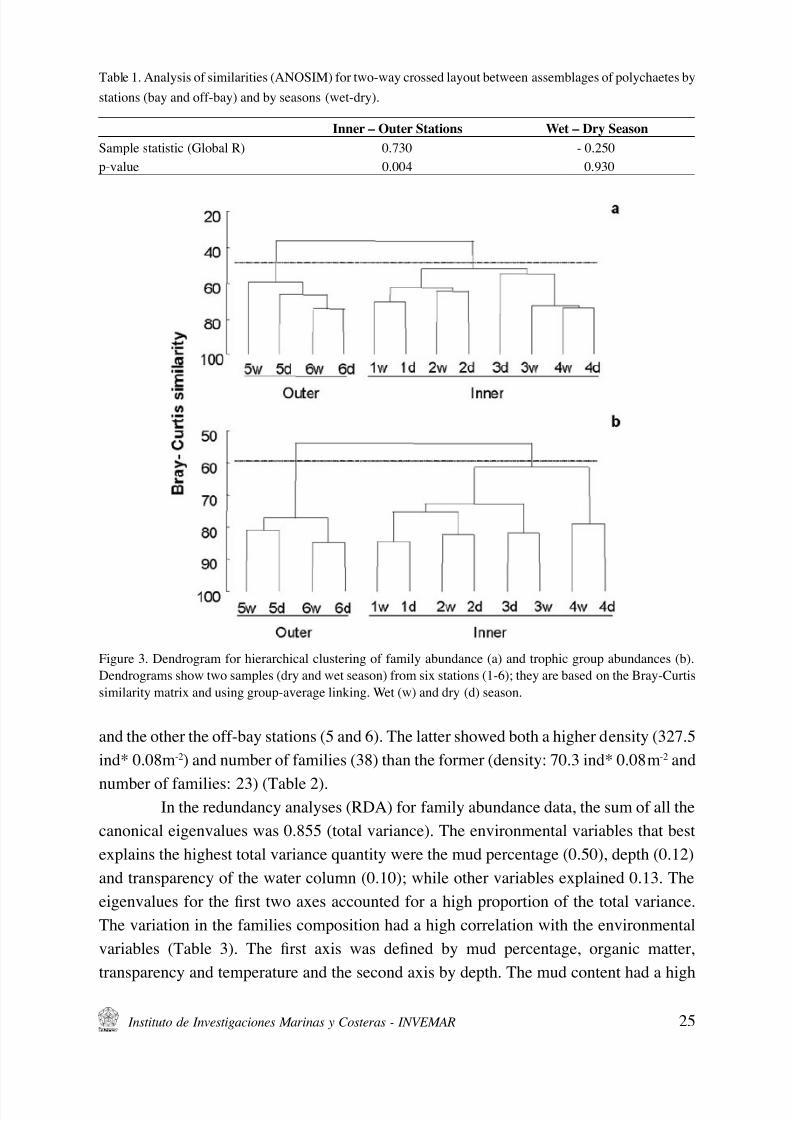
Two different assemblages of polychaetes in both taxonomic (Figure 3a) and
trophic groups (Figure 3b) were formed; one cluster corresponded to bay stations (1-4)
8/4/2019 Spatial and Temporal Characterization of Soft Bottom Polychaetes in a Shallow Tropical Bay (Lattig Et Al, 2005)
http://slidepdf.com/reader/full/spatial-and-temporal-characterization-of-soft-bottom-polychaetes-in-a-shallow 7/18
25 Instituto de Investigaciones Marinas y Costeras - INVEMAR
and the other the off-bay stations (5 and 6). The latter showed both a higher density (327.5
ind* 0.08m-2) and number of families (38) than the former (density: 70.3 ind* 0.08m-2 and
number of families: 23) (Table 2).In the redundancy analyses (RDA) for family abundance data, the sum of all the
canonical eigenvalues was 0.855 (total variance). The environmental variables that best
explains the highest total variance quantity were the mud percentage (0.50), depth (0.12)
and transparency of the water column (0.10); while other variables explained 0.13. The
eigenvalues for the first two axes accounted for a high proportion of the total variance.
The variation in the families composition had a high correlation with the environmental
variables (Table 3). The first axis was defined by mud percentage, organic matter,
transparency and temperature and the second axis by depth. The mud content had a high
Figure 3. Dendrogram for hierarchical clustering of family abundance (a) and trophic group abundances (b).Dendrograms show two samples (dry and wet season) from six stations (1-6); they are based on the Bray-Curtissimilarity matrix and using group-average linking. Wet (w) and dry (d) season.
Table 1. Analysis of similarities (ANOSIM) for two-way crossed layout between assemblages of polychaetes by
stations (bay and off-bay) and by seasons (wet-dry).
Inner – Outer Stations Wet – Dry Season
Sample statistic (Global R) 0.730 - 0.250p-value 0.004 0.930

8/4/2019 Spatial and Temporal Characterization of Soft Bottom Polychaetes in a Shallow Tropical Bay (Lattig Et Al, 2005)
http://slidepdf.com/reader/full/spatial-and-temporal-characterization-of-soft-bottom-polychaetes-in-a-shallow 8/18
26 Boletín de Investigaciones Marinas y Costeras - Vol. 35-2006
positive correlation with the organic matter in the sediment (arrows pointing in roughly
with the same direction) (Figure 4a). The RDA also showed that the dry and wet season
samples group together in each station (Figure 4ab).
Table 2. Comparison of mean abundance of the families (ind*0.08m-2) found in both assemblages of polychaetesformed in the clusters of Figure 3a. Standard error in parenthesis.
FAMILYAssemblages
inner outer
Spionidae Spi 18.6 (13.1) 52.2 (30.6)Paraonidae Par 19.5 (26.9) 41.2 (37.7)Syllidae Syl 0.1 (0.4) 53.3 (54.3)Capitellidae Cap 12.4 (8.5) 19.3 (8.7)Goniadidae Gon 0.1 (0.4) 25.3 (38.7)Cirratulidae Cir 6.4 (6.6) 7.3 (4.5)Nephtyidae Nep 0.0 16.5 (20.3)Ampharetidae Amph 0.3 (0.5) 12.2 (7.8)
Dorvilleidae Dor 0.5 (1.1) 11.0 (7.3)Sabellidae Sab 0.0 10.7 (9.0)Pilargiidae Pil 2.5 (2.7) 5.0 (4.2)Nereididae Ner 2.3 (2.4) 5.2 (3.2)Hesionidae Hes 0.5 (0.8) 7.8 (9.9)Magelonidae Mag 2.9 (2.6) 2.2 (1.8)Glyceridae Gly 0.0 7.5 (8.2)Opheliidae Oph 0.8 (0.7) 5.8 (9.5)Maldanidae Mal 0.1 (0.4) 6.8 (3.8)Lumbrineridae Lum 0.5 (0.8) 5.8 (2.8)
Phyllodocidae Phy 0.0 5.8 (7.7)Terebellidae Ter 0.3 (0.5) 4.0 (2.7)Sigalionidae Sig 0.3 (0.5) 3.3 (2.8)Eunicidae Eun 0.1 (0.4) 3.3 (2.4)Orbiniidae Orb 0.8 (1.2) 1.7 (2.0)Amphinomidae Amp 0.5 (0.8) 1.5 (2.2)Oweniidae Owe 0.0 2.5 (1.5)Poecilochaetidae Poe 0.0 1.5 (1.9)Chrysopetallidae Chr 0.0 1.5 (1.9)Flabelligeridae Fla 0.3 (0.7) 0.8 (1.3)Trichobranchidae Tri 0.0 1.2 (1.9)
Chaetopteridae Cha 0.0 1.0 (1.2)Eulephetidae Eul 0.4 (0.7) 0.2 (0.3)Pisionidae Pis 0.0 0.8 (1.7)Oenonidae Oen 0.0 0.8 (0.6)Onuphidae Onu 0.0 0.8 (0.6)Cossuridae Cos 0.4 (0.7) 0.0Protodilidae Pro 0.0 0.5 (1.0)Sabellaridae Sab 0.0 0.5 (0.6)Polynoidae Pol 0.0 0.3 (0.4)Pectinariidae Pec 0.0 0.2 (0.3)TOTAL 70.3 327.5

8/4/2019 Spatial and Temporal Characterization of Soft Bottom Polychaetes in a Shallow Tropical Bay (Lattig Et Al, 2005)
http://slidepdf.com/reader/full/spatial-and-temporal-characterization-of-soft-bottom-polychaetes-in-a-shallow 9/18
27 Instituto de Investigaciones Marinas y Costeras - INVEMAR
In the RDA plots, the family abundances and the environmental variables
indicated with long arrows were the most important for the analyses. In the off-bay
stations, the families Opheliidae, Poecilochaetidae, Sabellidae, Nephtyidae, Ampharetidae
and Lumbrineridae showed the highest abundances in deeper places with fine sand and
low organic matter contents (Figures 4b and 5a), while Hesionidae, Syllidae, Goniadidae,Dorvilleidae, Glyceridae, Maldanidae and Eunicidae were found in deeper stations with
coarse sand. In the bay stations Cossuridae and Eulepethidae were exclusive and presented
low abundances; while Magelonidae, Cirratulidae showed high abundance and frequency
in fine sediments (Figures 4b and 5a). The families with short arrows as Orbiniidae,
Nereidae, Flabelligeridae, Amphinomidae and Paraonidae, and the families Capitellidae
and Spionidae showed similar abundances and high frequency in both assemblages.
Protodrilidae, Pisionidae, Sabellaridae, Oenonidae and Pectinaridae were rare families
and were located only off-bay.To summarize, the assessed physical and chemical variables that best explained
the biological pattern were the mud percentages and water transparency. According to this,
the families located to the right of Figure 5 preferred sediments with low mud contents
and high transparency, while the families located in the center of the same figure preferred
places with higher mud contents and a low transparency (Figure 5ab).
In the trophic structure RDA, the sum of all the canonical eigenvalues was
0.878 (total variance). The environmental variables that best explained the highest total
variance quantity were the mud percentage (0.62), transparency (0.09) and depth (0.06);
Table 3. Redundancy analysis (RDA) of families and trophic groups abundance data. Eigenvalues, cumulativepercentage variance and correlations coefficients for the first two axes are shown. The Sum of all canonicaleigenvalues was 0.85 and 0.88 (total variance) for families and trophic groups abundance, respectively.Bold characters are the highest correlations coefficients for the first two axes. p-value for Monte Carlo testfor significance of all canonical axes was < 0.004 for families abundance data and < 0.01 for trophic groupsabundance data.
FAMILIES TROPHICGROUPS
Axis 1 2 1 2
Eigenvalues 0.56 0.15 0.70 0.09
Families/Trophic groups - environmental correlations 0.99 0.95 0.99 0.92
Cumulative percentage variance of Families/Tropic groups 56.4 71.9 70.2 78.7
Cum % var. of Families/Trophic groups - environment relation 66.1 84.3 79.9 89.7
Correlation Coefficients
Organic Matter (OM) -0.671 -0.007 -0.654 -0.130
Depth (D) 0.295 0.655 0.298 0.563
Mud percentage (Mud) -0.932 -0.056 -0.925 -0.007
Temperature (T) -0.542 -0.410 -0.561 -0.357Salinity (S) -0.219 -0.086 -0.245 0.035
Dissolved oxygen (DO) -0.008 0.160 -0.119 0.154
Transparency-water conditions (Tr) 0.582 -0.038 0.537 -0.027

8/4/2019 Spatial and Temporal Characterization of Soft Bottom Polychaetes in a Shallow Tropical Bay (Lattig Et Al, 2005)
http://slidepdf.com/reader/full/spatial-and-temporal-characterization-of-soft-bottom-polychaetes-in-a-shallow 10/18
28 Boletín de Investigaciones Marinas y Costeras - Vol. 35-2006
the other variables accounted for 0.11. The eigenvalues for the first two axes showed a
high proportion of the total variance, and the variation on the trophic groups presented a
high correlation with the environmental variables (Table 3). The best correlated variable
on the first axis was the mud content, followed by organic matter and transparency; and
Figure 4. Ordination plots based on the RDA of abundance data for 39 macrobenthic fauna families. a) RDAplotting environmental variables (arrows) and samples (full circles); b) the same RDA plotting families (arrows)and samples (full circles). For labeled names see Table 2 and Table 3.

8/4/2019 Spatial and Temporal Characterization of Soft Bottom Polychaetes in a Shallow Tropical Bay (Lattig Et Al, 2005)
http://slidepdf.com/reader/full/spatial-and-temporal-characterization-of-soft-bottom-polychaetes-in-a-shallow 11/18
29 Instituto de Investigaciones Marinas y Costeras - INVEMAR
the second axis was defined by depth (Table 3). Figure 6a shows that the spatial and
temporal distribution of the stations between the trophic groups and the environmental
variables was similar to the distribution in Figure 4a.
The abundances of the different trophic groups increases from left to right in
Figure 6b, showing a higher abundance in the assemblage of the off-bay. The carnivores
(ca) presented the greatest abundances of this assemblage (the arrow is longer) and theywere positively correlated with others trophic groups (arrows pointing in roughly with
the same direction). The non selective subsurface deposit feeders (ssdfn), were highly
Figure 5. Pie symbols plot showing distribution of family abundances over classes of samples with different mudpercentage (a) and transparency of the water column (b). Mud class units are in percentage and transparency(Tr) ones in meters.

8/4/2019 Spatial and Temporal Characterization of Soft Bottom Polychaetes in a Shallow Tropical Bay (Lattig Et Al, 2005)
http://slidepdf.com/reader/full/spatial-and-temporal-characterization-of-soft-bottom-polychaetes-in-a-shallow 12/18
30 Boletín de Investigaciones Marinas y Costeras - Vol. 35-2006
correlated with the selective surface deposit feeders (sdfs). The suspension feeders/surface
deposit feeders (sf-sdf) were correlated with the suspension feeders (sf) and omnivores
and selective subsurface deposit feeders (ssdfs). The trophic groups found in the bay, the
subsurface and surface deposit feeders were more abundant than other trophic groups.
Figure 6. RDA plot for trophic group abundances. (a) RDA plot for environmental variables (arrows) andsamples (circles); (b) the same RDA plot for trophic groups (arrows) and samples (circles). Suspension feeders(sf), carnivores (ca), omnivores (o), selective and non selective surface deposit feeders (sdfs and sdfn), selectiveand non selective subsurface deposit feeders (ssdfs and ssdfn) and suspension feeders/surface deposit feeders(sf-sdf).
8/4/2019 Spatial and Temporal Characterization of Soft Bottom Polychaetes in a Shallow Tropical Bay (Lattig Et Al, 2005)
http://slidepdf.com/reader/full/spatial-and-temporal-characterization-of-soft-bottom-polychaetes-in-a-shallow 13/18
31 Instituto de Investigaciones Marinas y Costeras - INVEMAR
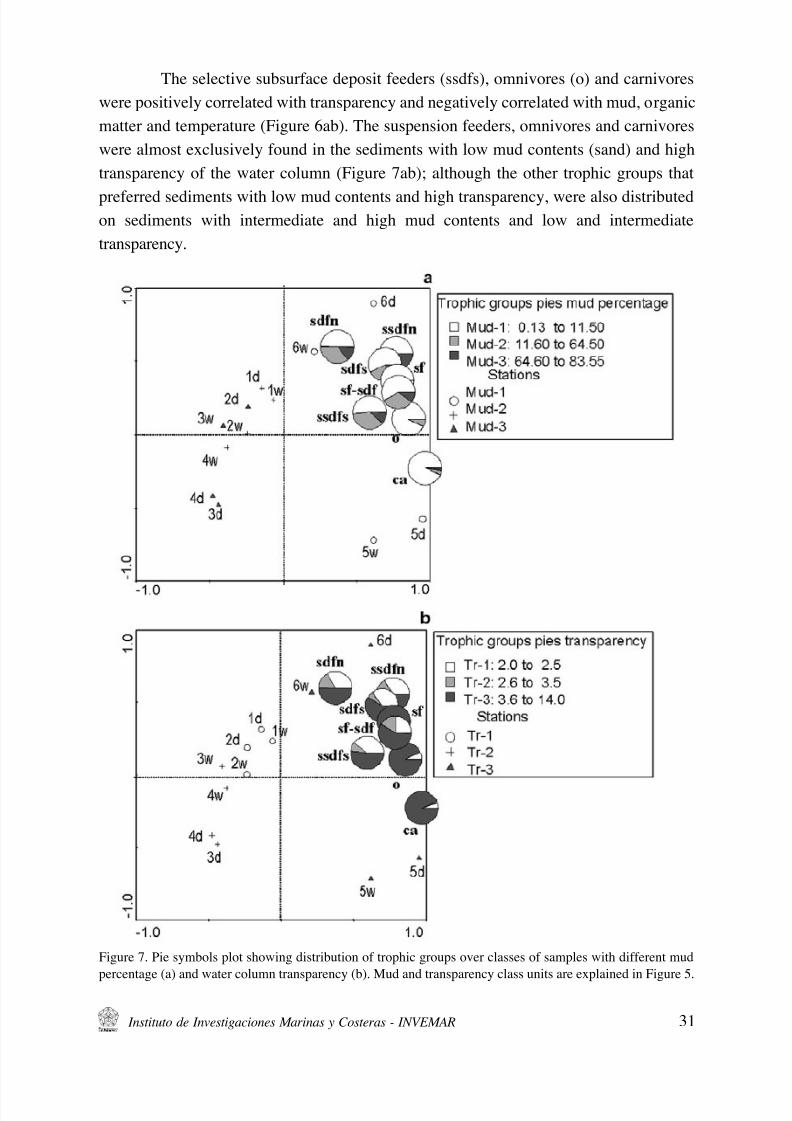
The selective subsurface deposit feeders (ssdfs), omnivores (o) and carnivores
were positively correlated with transparency and negatively correlated with mud, organic
matter and temperature (Figure 6ab). The suspension feeders, omnivores and carnivores
were almost exclusively found in the sediments with low mud contents (sand) and high
transparency of the water column (Figure 7ab); although the other trophic groups that
preferred sediments with low mud contents and high transparency, were also distributedon sediments with intermediate and high mud contents and low and intermediate
transparency.
Figure 7. Pie symbols plot showing distribution of trophic groups over classes of samples with different mudpercentage (a) and water column transparency (b). Mud and transparency class units are explained in Figure 5.

8/4/2019 Spatial and Temporal Characterization of Soft Bottom Polychaetes in a Shallow Tropical Bay (Lattig Et Al, 2005)
http://slidepdf.com/reader/full/spatial-and-temporal-characterization-of-soft-bottom-polychaetes-in-a-shallow 14/18
32 Boletín de Investigaciones Marinas y Costeras - Vol. 35-2006
DISCUSSION AND CONCLUSIONS
In ecological terms, it is important to identify the proportion of variance in
biological data which may be attributed to environmental variability (Kröncke et al .,
1998). The results of the relationship between spatial and temporal patterns of the
organisms and environmental variables showed that, a higher percentage of the totalvariance was explained by variables measured in the water column and the sediment.
The mud percentage and depth variables were those that best explained the variability
in family and trophic abundances of soft bottom polychaetes in the bay and off-bay
stations.
Most of the observed biological variability was spatial rather than temporal,
and was determined by sediment heterogeneity. The mud content was the most important
variable used to explain the variations in the trophic and taxonomic structures. The
transparency and depth were also important in explaining the distribution of the families.
These results can be compared to studies performed by Gray (2002) in temperate zones
and small spatial scales, whereby species richness changes with sediment grain size and
small depth changes.
Taxonomic and trophic structure of assemblages did not change seasonally.
This result follows the temporal pattern seen in other soft bottom communities of the
Colombian Caribbean. For example, the shallow water assemblages of Morrosquillo Gulf,
Punta Canoas and Pozos Colorados were analyzed with a higher temporal frequency than
the present study (3 and 4 times per year), showed no important changes between the dry
and wet periods indicating no seasonal variability (Guzmán-Alvis and Carrasco, 2005b;Guzmán-Alvis, 2004; INVEMAR, 2004; Guzmán-Alvis and Solano, 2001). These results
are in agreement with several studies in tropical soft-bottom and rocky shore communities,
where neither number of taxa nor their abundances significantly changed during the year
(Jackson, 1972; McCarthy et al., 2000). Alongi (1990) suggested that in dry tropics where
rainfall is sporadic, there are high temperatures and desiccation (as in the study area),
densities of most groups fluctuated over time without following seasons. The infaunal
assemblages are characterized by displaying small, opportunistic and surface deposit
feeder organisms.The water movement and sediment structure affected the structure and function
of polychaete assemblages. In exposed sandy areas (off-bay), suspension feeders were
present. Their food mainly phytoplankton, may be produced in waters far away from their
locations and transported to them by currents (Pearson and Rosenberg, 1987). The trophic
group mutual exclusion hypothesis postulates that current speed controls community
composition, through its effects on food supply and sedimentary composition; suspension
feeders are abundant in areas of strong water movement (off-bay) and deposit feeders in
low flow areas (bay).
8/4/2019 Spatial and Temporal Characterization of Soft Bottom Polychaetes in a Shallow Tropical Bay (Lattig Et Al, 2005)
http://slidepdf.com/reader/full/spatial-and-temporal-characterization-of-soft-bottom-polychaetes-in-a-shallow 15/18
33 Instituto de Investigaciones Marinas y Costeras - INVEMAR
In this study, the deposit feeders (surface and subsurface) make up 39.0 % of
all the polychaetes; these trophic groups accounted for 65.6% of the bay assemblages
showing the importance of detritus within the bay. Furthermore, obligate deposit feeders
(surface and subsurface) which are generally semi-mobile or sessile, partition food and
space resources through a variety of tube building and burrowing habitats. Such organisms
are restricted to soft substrata and their predominance increase with decreasing particlesize (Pearson and Rosenberg, 1987). Characteristic families inside the bay (defined as the
families with abundance ≥ 60% and frequency ≥ 70% within the bay group), included
burrowers such as Magelonidae, Cirratulidae and Cossuridae and predominated in the
bay mud substrata.
In the off-bay assemblages the carnivores dominated with a 42%; characteristic
families off-bay (defined as before), included active burrowers carnivores as Goniadidae,
Nephtyidae and Glyceridae. The sands have greater spaces among the grains than the
mud, making it easier for the carnivores in their search for and capture of potentialpreys. Furthermore, the distribution of the carnivores was more closely related to the
abundance of their potential preys; the densities of these preys were higher in the off-bay.
Predation can enhance coexistence between species of benthic organisms by preventing
monopolization of space (Parsons et al ., 1995).
The dominance of surface deposit feeders as consumers of newly sedimented
food is related to the production in the water column (Gaston, 1987; Gaston et al., 1988;
Josefson and Rasmussen, 2000). The present study does not present information on the
biological productivity in the area. However, the region of the Guajira is characterized by
a coastal upwelling that increases the productivity in the water column, and part of thisproduction settles forming available food for the benthic community. Also, the benthic
community receives food from the dissolved and particulate matter from the sea grass
and mangroves in the bay. The deposit feeders (surface and subsurface) make up the 39
% of the total assemblages, showing the importance of the detritus and benthic-pelagic
coupling in these ecosystems.
The assemblage organization may be assessed by considering any convenient
component unit, e.g. taxa and trophic groups; as assemblage structure change along any
environment gradient so does its organization (Pearson and Rosenberg, 1978). Trophicrelationships are particularly influenced by the gradient of organic input, and changes
in trophic structure may, therefore, be considered as fundamental to any analysis of
community change in relation to such inputs to the benthos.
Food supply is a key factor structuring marine benthic communities (Pearson
and Rosenberg, 1978, 1987; Wieking and Kröncke, 2005). Dauwe et al., (1998) as with
contrasting quantity and quality of organic matter and with different hydrodynamic
environments. According to their results trophic structure reflects differences in the
relative quality of organic matter.

8/4/2019 Spatial and Temporal Characterization of Soft Bottom Polychaetes in a Shallow Tropical Bay (Lattig Et Al, 2005)
http://slidepdf.com/reader/full/spatial-and-temporal-characterization-of-soft-bottom-polychaetes-in-a-shallow 16/18
34 Boletín de Investigaciones Marinas y Costeras - Vol. 35-2006
The two assemblages found are associated with the areaʼs hydrodinamics as
follows: the off-bay area is exposed to strong currents, characterized by low contents of
organic matter and coarse sediments indicating dynamic environments. On the other hand,
the area within the bay (a protected area) is characterized by high contents of organic
matter and very fine sediments, typical of calm places.
ACKNOWLEDGEMENTS
The Instituto de Investigaciones Marinas y Costeras INVEMAR gave logistic
support for the development of this study, which was carried within the project “Monitoring
of the representative ecosystems in Bahia de Portete”, requested and fully funded by the
company Carbones del Cerrejón, LLC, as part of its environment protection programs.
LITERATURE CITED
Alongi, D. 1989. Ecology of tropical soft-bottom benthos: a review with emphasis on emerging concepts. Rev.
Biol. Trop., 37: 85-100.
Alongi, D. 1990. The ecology of tropical soft-bottom benthic ecosystems. Oceanogr. Mar. Biol. Ann. Rev., 28:
381-496.
Andrade, C. 2000. The circulation and variability of the Colombian Basin in the Caribbean Sea. Thesis PhD
School of Ocean Sciences. University of Wales. UK, 223 p.
Beesley, P. L., G. J. Ross and C. J. Glasby (eds). 2000. Polychaetes & Allies: The Southern synthesis. Fauna of
Australia. Vol 4A Polychaeta, Myzostomida, Pogonophora, Echiura, Sipuncula. CSIRO Publishing.Melbourne, 465 p.
Bone, D. and E. Klein. 2000. Temporal variations in a tropical Soft-Bottom community, Venezuela. J. Coast.
Res., 16: 278-286.
Clarke, K. R. and R. M. Warwick. 2001. Change in marine communities: an approach to statistical analysis and
interpretation. PRIMER-E: Plymouth, UK.
Dauwe, B., P. M. J. Herman, C. H. R. Heip. 1998. Community structure and bioturbation potential of macrofauna
at four North Sea stations with contrasting food supply. Mar. Ecol. Prog. Ser., 173: 67-83.
Fauchald, K. and P. Jumars. 1979. The diet of worms: a study of polychaete feeding guilds. Oceanogr. Mar. Biol.
Ann. Rev., 17, 193-284.
Gaston, G. R. 1987. Benthic polychaete of the middle Atlantic Bight: feeding and distribution. Mar. Ecol. Progr.
Ser., 36: 251-262.
Gaston, G. R., D. A. Lee and J. C. Nasci. 1988. Estuarine macrobenthos in Calcasieu Lake, Louisiana:
community and trophic structure. Estuaries, 11: 192-200.
Gray, J. S. 2002. Species richness of marine soft sediments. Mar. Ecol. Prog. Ser., 244: 285-297.
Guzmán-Alvis, A. 2004. Variaciones temporales de la macroinfauna sublitoral en la plataforma colombiana
aledaña al río Magdalena asociadas con cambios climáticos. Tesis doctoral de Oceanografía.
Universidad de Concepción. Chile, 103 p.
Guzmán-Alvis, A. and C. B. García. 1996. Taxonomic aggregation and the detection of patterns in a tropical
marine benthos data set. Rev. Biol. Trop., 44: 907-910.

8/4/2019 Spatial and Temporal Characterization of Soft Bottom Polychaetes in a Shallow Tropical Bay (Lattig Et Al, 2005)
http://slidepdf.com/reader/full/spatial-and-temporal-characterization-of-soft-bottom-polychaetes-in-a-shallow 17/18
35 Instituto de Investigaciones Marinas y Costeras - INVEMAR
Guzmán-Alvis, A. y O. D. Solano. 2001. Cambios temporales en la estructura comunitaria de la macroinfauna
y su relación con la precipitación (Caribe colombiano). Resúmenes IX Congreso Latinoamericano
sobre Ciencias del Mar. San Andrés Isla, p 493.
Guzmán-Alvis, A., O. D. Solano, M. Córdoba-Tejada y A. López-Rodríguez. 2001. Comunidad macroinfaunal
de fondos blandos someros tropicales (Caribe colombiano). Bol. Invest. Mar. Cost., 30: 39-65.
Guzmán-Alvis, A. and F. Carrasco. 2005a. Taxonomic aggregation and redundancy in a tropical macroinfaunal
assemblage of the Southern Caribbean in the detection of temporal patterns. Sci. Mar., 69: 133-141.
Guzmán-Alvis, A. and F. Carrasco. 2005b. Influence of a tropical coastal lagoon discharge and depth on the
structure of adjacent shelf macroinfauna (Southern Caribbean). Cahiers Biol. Mar., 46: 81-93.
INVEMAR. 2004. Establecimiento de la línea base primera fase del plan de monitoreo ambiental del proyecto
para el tratamiento y disposición final de las aguas residuales de Cartagena de Indias. Aguas de
Cartagena S.A. E.S.P. Santa Marta, 366 p.
Jackson, J. B. 1972. The ecology of the molluscs of Thalassia communities, Jamaica, West Indies. II. Molluscan
population variability along an environmental stress gradient. Mar. Biol., 14: 304-337.
Josefson, A. B. and B. Rasmussen. 2000. Nutrient retention by benthic macrofaunal biomass of Danish estuaries:
importance of nutrient load and residence time. Estuar. Coast. Shelf Sci., 50: 205-216.
Kröncke, I., J. Dippner, J. Heyen and B. Zeiss. 1998. Long-term changes in macrofaunal communities off
Norderney (East Frisia, Germany) in relation to climate variability. Mar. Ecol. Prog. Ser., 167: 25-
36.
Longhurst, A. R. and D. Pauly. 1987. Ecology of tropical oceans. Academic Press: San Diego. 407 pp.
Mannino, A. and P. A. Montagna. 1997. Small-scale spatial variation of macrobenthic community structure.
Estuaries, 20: 159-173.
McCarthy, S.A., E.A. Laws, W. A. Estabrooks, J. H. Bailey-Brock and E. A. Kay. 2000. Intra-annual variability
in Hawaiian shallow-water, soft-bottom macrobenthic communities adjacent to a eutrophic estuary.
Estuar. Coast. Shelf Sci., 50: 245-285.Mistri, M., E. A. Fano, G. Rossi, K. Caselli and R. Ross. 2000. Variability in macrobenthos communities in the
Velli di Comacchio, Northern Italy, a Hypereutrophized Lagoonal Ecosystem. Estuar. Coast. Shelf
Sci., 51: 599-611.
Olsgard, F., P. J. Somerfield and M. R. Carr. 1998. Relationships between taxonomic resolution, macrobenthic
community patterns and disturbance. Mar. Ecol. Prog. Ser., 172: 25-36.
Parsons, T. R., M. Takahashi and B. Hargrave. 1995. Biological Oceanographic processes. Butterworth
Heinemann Ltd. Oxford. 330 p.
Pearson, T. H. and R. Rosenberg. 1978. Macrobenthic succession in relation to organic enrichment and pollution
of the marine environment. Oceanogr. Mar. Biol. Ann. Rev., 16: 229-311.
Pearson, T. H. and R. Rosenberg. 1987. Feast and fanime: structuring factors in marine benthic communities:373-395. In: Gee J. and P. Giller (eds). Organization of communities: past and present. The 27th
Symposium of the British Ecological Society Aberystwyth. Blackwell Scientific Publications.
Oxford.
Rouse, G. W. and F. Pleijel. 2001. Polychaetes. Oxford University Press. N. Y. 354 p.
Solano, O. D. 1994. Corales, formaciones arrecifales y blanqueamiento coralino de 1987 en bahía Portete. An.
Inst. Invest. Mar. Punta de Betín, 23:149-163.
ter Braak, C. J. and Šmilauer P. 2002. Canoco reference manual and CanocoDraw for Windows Userʼs guide:
Software for Canonical Community Ordination (version 4.5). Microcomputer Power (Ithaca, NY,
USA), 500 pp.

8/4/2019 Spatial and Temporal Characterization of Soft Bottom Polychaetes in a Shallow Tropical Bay (Lattig Et Al, 2005)
http://slidepdf.com/reader/full/spatial-and-temporal-characterization-of-soft-bottom-polychaetes-in-a-shallow 18/18
36 Boletín de Investigaciones Marinas y Costeras - Vol. 35-2006
Wieking, G. and I. Kröncke. 2005. Is benthic trophic structure affected by food quality? The Dogger Bank
example. Mar. Biol., 146: 387-400.
Zajac, R. N. and R. B. Whitlatch. 1982. Responses of estuarine infauna to disturbance. I. Spatial and temporal
variation of initial recolonization. Mar. Ecol. Prog. Ser., 10: 1-14.
DATE RECEIVED: 14/09/04 DATE ACCEPTED: 23/01/06