temporal variation of phytoplankton in two shallow lakes ... · temporal variation of phytoplankton...
TRANSCRIPT

Limnetica, 29 (2): x-xx (2011)Limnetica, 31 (2): 289-304 (2012)c© Asociación Ibérica de Limnología, Madrid. Spain. ISSN: 0213-8409
Temporal variation of phytoplankton in two neighbouringMediterranean shallow lakes in Doñana National Park (Spain)
Ana Isabel López-Archilla1,∗, MaCarmen Coleto2, Carlos Montes1, Ignacio Peñín1 andMa Carmen Guerrero1
1 Departamento de Ecología. Universidad Autónoma de Madrid. Cantoblanco. 28049 Madrid. Spain.2 Área de Control y Vigilancia de la Calidad de las Aguas. Dirección General del Agua. Ministerio de MedioAmbiente y Medio Rural y Marino. 28071 Madrid.
∗ Corresponding author: [email protected]
Received: 28/7/11 Accepted: 17/5/12
ABSTRACT
Temporal variation of phytoplankton in two neighbouring Mediterranean shallow lakes in Doñana National Park(Spain)
This study was aimed at describing the phytoplankton dynamics and structure of two eutrophic to hypereutrophic Mediter-ranean shallow lakes (Santa Olalla and Dulce). The two systems are close together and can function as one water body attimes of heavy rainfall, but once separated, they evolve differently. The Shannon diversity index was low for both shallowlakes (average values of 1.11 in Santa Olalla and 1.79 in Dulce). The average phytoplankton Chl a concentrations and primaryproduction rates were very high, although slightly higher in Santa Olalla (365.2 mg m–3 and 1.29 g C m–3 h–1, respectively)than in Dulce (230 mg m–3 and 0.88 g C m–3 h–1). Phytoplankton variation in the lakes was related to shifts in the physicaland chemical features of lake water as well as hydrological conditions, a finding that is corroborated by the canonical corre-spondence analysis results, which showed a different pattern of evolution in each system. Eight functional groups were foundin Santa Olalla (D, H1, J, K, M, S1, W2 and Y), although the D, W2 and Y groups were only predominant during the firstfour months of the study. For the rest of the period, the system was particularly dominated by the H1, K and S1 groups. Dulceexhibited a more complex distribution of phytoplankton functional groups over time. Ten functional groups were observed inthis system (D, H1, J, K, M, P, S1, S2, W2 and Y). Some characteristics of these systems, such as rapid water volume fluctu-ations, low light penetration and low concentration of inorganic nutrients, are stressful conditions for phytoplankton, whichmay account for the low phytoplankton diversity and the equilibrium phases recorded for many months in both wetlands.
Key words: Phytoplankton dynamics, hypereutrophic shallow Mediterranean lakes, phytoplankton diversity, functionalgroups.
RESUMEN
Variación temporal del fitoplancton de dos lagunas someras mediterráneas contiguas del Parque Nacional de Doñana(España)
El presente estudio tiene como objetivo describir la dinámica y estructura del fitoplancton en dos lagunas eutróficas ahipereutróficas Mediterráneas (Santa Olalla y Dulce, España). Ambos sistemas están muy próximos y se unen superficialmenteen periodos de fuertes lluvias, sin embargo, cuando el nivel desciende, evolucionan de forma separada. El índice de diversidadde Shannon fue bajo para ambos sistemas (valores promedio de 1.11 en Santa Olalla y 1.79 en Dulce). La concentraciónmedia de Chl a y las tasas de producción primaria del fitoplancton fueron muy altas, aunque ligeramente superior en SantaOlalla (365.2 mg m–3 y 1.29 g C m–3 h–1, respectivamente) con respecto a Dulce (230 mg m–3 y 0.88 g C m–3 h–1). Lasvariaciones del fitoplancton están relacionadas con cambios en las características físicas y químicas del agua, así como conlas condiciones hidrológicas, lo que es corroborado por el Análisis de Correspondencia Canónica (CCA), que muestra unpatrón de evolución diferente en ambos sistemas. En Santa Olalla fueron observados ocho grupos funcionales (D, H1, J, K,M, S1, W2 y Y), si bien los grupos D, W2 y Y sólo predominaron en los primeros cuatro meses de estudio. El resto del tiempo,el sistema estuvo dominado sobre todo por los grupos H1, K y S1. Dulce mostró una distribución más compleja de grupos
14320 Limnetica 31(2), pàgina 289, 04/11/2012
290 López-Archilla et al.
funcionales a lo largo del tiempo, observándose diez grupos (D, H1, J, K, M, P, S1, S2, W2 y Y). Algunas de las característicasde ambos sistemas, como la rápida fluctuación en el volumen de agua, la baja penetración de la luz o la escasa concentraciónde nutrientes inorgánicos, son condiciones de estrés para el fitoplancton, lo que puede explicar su baja diversidad y las fasesde equilibrio registradas durante muchos meses en ambos humedales.
Palabras clave: Dinámica fitoplanctónica, lagunas hipertróficas mediterráneas, diversidad del fitoplancton, grupos fun-cionales.
INTRODUCTION
Very shallow lakes (Zmax < 5 m) are commonwetland types in the Mediterranean region,particularly in Spain. Most of these shallow lakesare small (usually less than 10 ha) (Casado &Montes, 1995), isolated and highly interesting,both ecologically and in terms of biodiversity(Beklioglu et al., 2007). During the last threedecades, most of these small aquatic systemshave been damaged due to human pressure.The deterioration of many northern temper-ate shallow lakes has been the focus of manystudies, which have contributed greatly to ageneral understanding of the functioning of theseecosystems and the restoration of some of them(Perrow et al., 1997; Jeppesen et al., 2007;Søndergaard et al., 2008). Comparable informa-tion for Mediterranean shallow lakes is limited(Beklioglu et al., 2007), and the establishment ofreference sites becomes necessary, although diffi-cult given the intensive anthropogenic alterationof water bodies (Moss, 2007). Nevertheless,some Mediterranean shallow lakes located inprotected areas appear to have remained un-changed. This is the case for Santa Olalla andDulce, both located in Doñana National Park(Spain). Both wetlands are natural eutrophic tohypereutrophic systems, and their study couldcontribute to a better understanding of the be-haviour of Mediterranean shallow lakes.
Phytoplankton, like other major componentsof aquatic systems, has been a preferred target fortaxonomic study in shallow lakes, but despite thegrowing number of recent works on the forcesthat drive special and temporal phytoplanktonpatterns, our knowledge of phytoplankton ecol-
ogy comes primarily from moderate-sized orlarge lakes (Padisák et al., 2003).
This work examines the monthly successionof phytoplankton during a two years studyconducted in two mixed hypereutrophic shallowlakes in a south temperate area based on theiralgal functional groups (Reynolds et al., 2002;Padisák et al., 2003; Padisák et al., 2009),which are related to multidimensional featuresof the environment. A canonical correspondenceanalysis was used to ascertain the primaryenvironmental variables driving phytoplanktoncommunity dynamics. This study was intendedto contribute to the knowledge of phytoplanktondynamics in two unmodified shallow lakesfrom the Mediterranean region and evaluate thepossibility of considering Santa Olalla and Dulceas reference systems in the area.
MATERIALS AND METHODS
Study Sites
The study was conducted in two shallow lakes,Santa Olalla and Dulce, over a period of 2 years,during which monthly measurements were takenfrom February 1998 to February 2000. Bothwetlands are located on the south-western At-lantic coast of Spain (Fig. 1) in Doñana NationalPark. The climate of the area is predominantlyMediterranean, with dry and hot summers andlittle rainfall in the winters. Santa Olalla andDulce are hypogenic shallow lakes where themain input into the systems is superficial watersfrom regional and local discharge flows (Man-zano, 2001). Santa Olalla is larger than Dulce
14320 Limnetica 31(2), pàgina 290, 04/11/2012

Temporal variation of phytoplankton in two Mediterranean shallow lakes 291
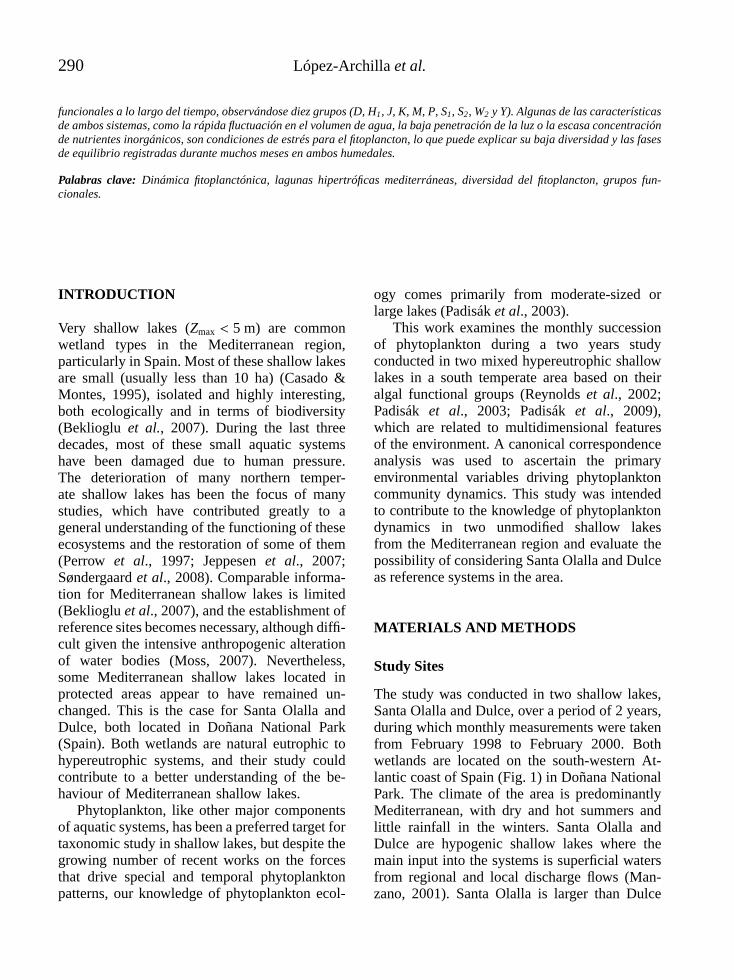
Figure 1. Location of the Santa Olalla and Dulce shallow lakes on the southwest coast of Spain. Shape and orientation of the lakebasins. Bar 100 m. Situación de las lagunas de Santa Olalla y Dulce en la costa suroeste de España. Orientación y forma de lascubetas de las lagunas. Barra 100 m.
(Table 1), and both lakes are shallow systemswith gentle slopes. The wind is strong over bothshallow lakes, and vertical water mixing wasobserved during sampling. Santa Olalla andDulce are only a few metres apart, and duringseasons of high precipitation, they work as asingle system (Toja et al., 1991, Álvarez et al.,2001). This behaviour was confirmed duringthe first months of the study, as there was veryabundant precipitation early in the 1997-1998hydrological cycle. The maximum values ofwater volume were registered during the initialpart of the study period in both shallow lakes.
Physical and chemical parameters
Water conductivity and temperature weremeasured in situ using a WTW-LF 330/SET
conductivimeter; pH and redox potential weredetermined using a 323 A WTW pH-meter,whereas dissolved oxygen (DO) concentrationswere estimated with a WTW 340-B oxymeter.Measurements were taken 5-10 cm below thewater surface at a location where the depth of thewater column was approximately 0.5 m. Nutrientconcentrations (NO3, NO2, NH+4 , total N (TN),total P (TP) and soluble reactive phosphorus,SRP) were determined in the laboratory follow-ing standard methods (APHA 1989). Organic Nwas estimated by subtracting inorganic nitrogen(IN) from TN (IN= sum of NO3, NO2 and NH+4 )and organic P by subtracting SRP from TP.The concentration of polyphenolic compoundswas estimated according to Box’s procedure(1983). The euphotic zone (Zeu) was calculatedas 2.7 times the Secchi depth (Cole, 1983).
14320 Limnetica 31(2), pàgina 291, 15/11/2012
292 López-Archilla et al.
Table 1. Physical and chemical variables and morphological features of the water columns of Santa Olalla (SO) and Dulce (D).(PAR) photosynthetically active radiation; (Water transp.) water transparency; (TA) total alkalinity; (PC) polyphenolic compounds;(TP) total phosphorous; (SRP) soluble reactive phosphorous; (TN) total nitrogen; (IN) inorganic nitrogen. Características morfológi-cas y variables físico-químicas de la columna de agua en Santa Olalla (SO) y Dulce (D). (PAR) Radiación fotosintéticamente activa;(Water transp.) Transparencia del agua; (TA) Alcalinidad total; (PC) Compuestos polifenólicos; (TP) Fósforo total; (SRP) Fósfororeactivo soluble; (TN) Nitrógeno total; (IN) Nitrógeno inorgánico.
Volume
(m3)Depth(m)
Water T(mean of 24 h) (◦C)
PAR
(µE m−2 s−1)pH
Watertransp. (m)
O2 midday(%)
SO D SO D SO D SO D SO D SO D SO D
Mean 165315 34867 1.28 0.93 18.68 16.01 522.3 549.7 9.52 8.76 0.14 0.24 156.7 131.6SD 253650 39885 0.52 0.42 4.96 5.47 142.5 287.1 0.88 0.93 0.08 0.22 65.7 47.5Max 796776 141497 2.34 1.77 25.7 25.7 737 942.5 10.77 10.2 0.33 0.90 331 217Min 290 3 0.44 0.0 10.8 8.39 315 65.9 7.33 6.77 0.05 0.04 28.5 45n 23 23 23 23 15 11 15 11 24 23 24 23 24 23
Conductivity
(µS cm−1)
TA
(meq L−1)
PC
(meq L−1 Tanic acid)
TP
(mg L−1)
SRP
(µg-at P L−1)
TN
(mg L−1)
IN
(µg-at N L−1)
SO D SO D SO D SO D SO D SO D SO D
Mean 2692 1997 2.89 1.79 2.21 4.32 0.664 0.567 3.10 17.29 13.34 11.26 110.1 318.48SD 2573 3373 1.28 0.79 1.93 5.56 0.367 0.521 5.00 24.54 20.72 20.67 49.1 571.01Max 11600 16580 6.18 4.11 8.13 22.87 1.450 1.830 18.5 82.28 80.89 100.8 228.0 2445.0Min 532 312 0.87 0.69 0.28 0.45 0.110 0.050 0.00 0.00 1.98 0.9 40.0 5.00n 24 23 22 22 24 23 24 23 21 22 24 23 21 22
IN/SRPNO−2
(µg-at N L−1)
NH4
(µg-at N L−1)
Chl a
(mg m−3)Rate of PP14C
(g C m−3 h−1)
DiversityIndex (H′)
Total algae
(cells ml−1)
SO D SO D SO D SO D SO D SO D SO D
Mean 51.98 68.92 1.2 108.43 108.9 210.04 365.18 230.00 1.29 0.88 1.11 1.79 2.29·107 4.64·106
SD 58.52 77.43 3.6 337.77 50.2 286.02 304.86 284.38 1.11 2.92 0.91 0.79 4.69·107 7.61·106
Max 215.71 307.27 13.0 1318.0 228.0 1427.0 1094.40 1324.0 3.61 2.92 3.16 3.67 2.03·108 2.28·107
Min 71 8.7 0.0 0.00 40.0 5.00 24.40 4.01 0.098 bdl1 0.04 0.12 1382 171
n 21 22 21 22 21 22 24 23 24 23 24 23 24 23
1 Bellow the detection limit.1 Por debajo del límite de detección.
Carlson’s index (TSI) (Carlson, 1977) was usedto determine the trophic status of the lakesusing Secchi depth, Chl a and TP.
Biological parameters
Phytoplanktonic chlorophyll-a (Chl a) concen-trations were estimated monthly from triplicatesamples. Water samples were filtered throughWhatman GF/F glass microfibre filters (0.7 µm)in situ and placed in 5 ml of a 90 % acetone solu-
tion for extraction over 24 h at 4o C in darkness.Chl a was measured using a spectrophotometer(Cary/1C/ UV-Visible spectrophotometer Var-ian), and its concentration was calculated usingthe Jeffrey & Humphrey (1975) trichromaticmethod. The primary productivity of phyto-plankton (PP14C) was determined using the 14Cmethod according to Goldman et al. (1974).Photosynthesis was measured in situ by suspend-ing one dark and two light polycarbonate bottles( R©Nunclon, InterMed) 15 cm below the surface
14320 Limnetica 31(2), pàgina 292, 04/11/2012

Temporal variation of phytoplankton in two Mediterranean shallow lakes 293
for an incubation period of 2.5 h at midday. Theoptimal incubation time was determined in a pre-liminary experiment in which 10 light bottles and5 dark bottles were incubated simultaneously.After the first hour, 2 light bottles and a dark onewere removed every 30 min. The production ratewas the highest 2.5 hours from the beginning ofthe experiment and then declined.
Samples collected to estimate phytoplank-ton abundance, biovolume and diversity werefixed with formaldehyde (4 % V/V) in situ.Species identifications as well as phytoplanktonabundance and biovolume estimations wereperformed with an inverted optical microscopewith epifluorescence (Olympus IX50). Individualphytoplankton cells were counted after filtering0.1 ml (or different dilutions, depending on thesamples) through black Isopore membrane filtersGTBP with a 0.2µm pore size and washing thecells with citrate buffer (pH 6). Each filter wasexamined for the autofluorescence of cell pigmentsat 1000X. The measurements were made undermicroscope according to the method describedby Fry (1990). Biomass was calculated by mea-suring at least 30 individuals of each species andusing simple geometric approximations (Rott,1981). Species abundance was then convertedinto biovolume. The dominant phytoplanktonspecies were considered to be those representing10 % or more of the total sample biovolume.Dominant taxa were classified into functionalgroups according to Reynolds et al. (2002),Padisák et al. (2003) and Padisák et al. (2009).
Numerical analyses
The diversity of each sample was based on theShannon index: H′ = −Σ pi · log2 pi where pi isthe proportion of the biovolume represented byspecies i in the sample. The Bray-Curtis dissim-ilarity, calculated from biovolume data betweenpairs of chronologically contiguous samples,was used as an estimate of the differentiation ofthe community along the complex environmentalgradient (Bloom, 1981; Salmaso, 1996).
The relationships among the measuredvariables were explored using correlation coeffi-cients (Pearson for parametric and Spearman for
non-parametric variables). Normality was exam-ined by means of the Kolmogorov-Smirnov test.Canonical correspondence analysis (CCA) wasperformed using XLSTAT version 3.01 (Addin-soft 1995-2008) to elucidate the relationshipsbetween the phytoplankton and the environ-mental variables over the study period, usingall data from both shallow lakes. To satisfy theassumptions of normality and homogeneity ofvariance of the data, all data were logarithmicallytransformed before the analyses.
RESULTS
Evolution of physical and chemicalparameters
The mean values of the physical, chemical andmorphological variables of Santa Olalla and Dul-ce are summarised in Table 1. Both systemsexhibited large variations in water volume. Max-imum values were recorded in the beginning ofthe investigation period (February 1998). SantaOlalla had a maximum depth of 2.34 m andDulce 1.77 m. In September 1999, both shallowlakes reached their lowest water volume for thestudy period (0.44 m for Santa Olalla, dry forDulce), with a gradual increase in volume duringthe following months. Santa Olalla exhibitedhigher average pH, water temperature, oxygenconcentration, conductivity, total alkalinity, totalP and total N values, whereas Dulce exhibitedhigher values for water transparency, polyphe-nolic compounds, SRP and inorganic N. N-NO−3was not found in Santa Olalla during the studyperiod and N-NO−2 was measurable in only 4months (March, April, October and November1999). In Dulce Lake, the measured value forN-NO−3 was 0 in most months except for June1999 and February 2000, whereas N-NO−2 waspresent from March–May and July–August. In-organic nitrogen in both systems is mainly in thereduced form of ammonia. The variations in SRPand IN over the months of the study period areillustrated in Figure 2A. It should be noted thatno stratification of the water column occurred ineither of the two systems. The euphotic zone was
14320 Limnetica 31(2), pàgina 293, 04/11/2012
294 López-Archilla et al.
0
200
400
600
800
1000
1200
1400
III-9
8
V-9
8
VII-
98
IX-9
8
XII-
98
II-99
IV-9
9
VI-
99
VIII
-99
X-9
9
XII-
99
II-00
Date of sampling
Chl a
(mg
L-1)
0
0.2
0.4
0.6
0.8
1
1.2
Eufo
tic Z
one
(m)
Zeu SO
Zeu D
Chl a SO
Chl a D
0
10
20
30
40
50
60
70
80
90
SRP
(µg-
at L
-1)
0
500
1000
1500
2000
2500
3000
IN (
µg-a
t L-1
)
IN SO
IN D
SRP SO
SRP D
pH; T
A (m
eq L
-1)
0,0
2,0
4,0
6,0
8,0
10,0
12,0
pH SO
pH D
TA SO
TA D
III-
98
V-9
8
VII
-98
IX-9
8
XII
-98
II-9
9
IV-9
9
VI-
99
VII
I-9
9
X-9
9
XII
-99
II-0
0
Date of sampling
Car
lson
´s In
dex
(TSI
)
0
20
40
60
80
100
120
TSI CHLa D
TSI SECCHI SO
TSI CHLa SO
TSI PT SO
TSI SECCHI D
TSI PT D
A
B
C
D
0
200
400
600
800
1000
1200
1400
III-9
8
V-9
8
VII-
98
IX-9
8
XII-
98
II-99
IV-9
9
VI-
99
VIII
-99
X-9
9
XII-
99
II-00
Date of sampling
Chl a
(mg
L-1)
0
0.2
0.4
0.6
0.8
1
1.2
Eufo
tic Z
one
(m)
Zeu SO
Zeu D
Chl a SO
Chl a D
0
10
20
30
40
50
60
70
80
90
SRP
(µg-
at L
-1)
0
500
1000
1500
2000
2500
3000
IN (
µg-a
t L-1
)
IN SO
IN D
SRP SO
SRP D
A
B
C
D
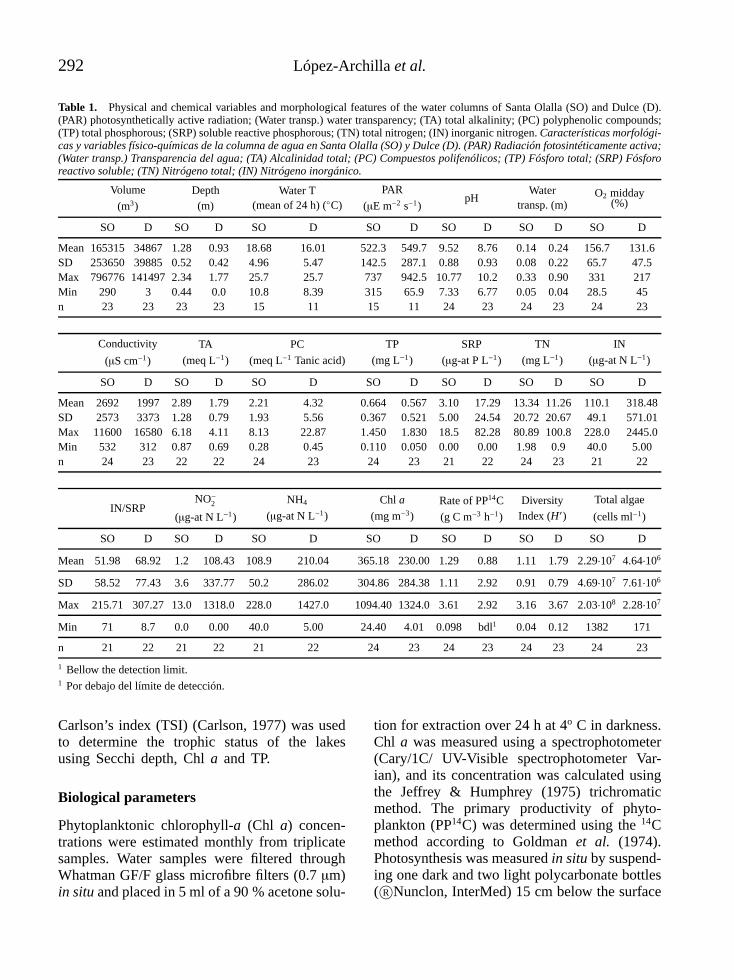
Figure 2. Changes over time in Santa Olalla and Dulce in the following variables: values of SRP and inorganic nitrogen (IN) (2A);concentration of Chl a and depth of the euphotic zone (2B); pH and total alkalinity (TA) (2C); Carlson’s index values (calculatedbased on Secchi depth, TP and the concentration of Chl a) showing the trophic status in both systems (2D). Cambios a lo largo deltiempo en Santa Olalla y Dulce en: los valores de SRP y nitrógeno inorgánico (IN) (2A); concentración de Chl a y profundidad de lazona eufótica (2B); pH y alcalinidad total (2C); valores del índice de Carlson (calculados a partir de los valores del disco de Secchi,fósforo total y concentración de Chl a) mostrando el estado trófico de ambos sistemas (2D).
shallow in both wetlands (Fig. 2B), primarilydue to the abundance of phytoplankton and theconcentration of polyphenolic compounds.
The Carlson’s index values based on Sec-chi depth, TP and the concentration of Chl a(Fig. 2D) were higher than 60 for both lakes,except for Chl a in September 1999 when Dulcedried up. The index tends to increase towards thehypereutrophic condition in both lakes over time.Only Dulce, after drying, showed lower indexvalues, but in general these values remainedwithin the range of eutrophy (Fig. 2D).
Chl a, primary production rates andphytoplankton abundance, biovolumeand diversity
The average phytoplankton Chl a concentra-tion was higher in Santa Olalla than in Dulce
(Table 1). Maximum and minimum values wereobserved in Dulce in June 1999 (1324 mg Chl am−3) and in December 1999 (4 mg Chl a m−3),respectively (Fig. 2B). In Santa Olalla, maximumphytoplankton production (PP14C) was recordedin September 1999 (3.61 g C m−3 h−1) and theminimum in May 1998 (0.098 g C m−3 h−1). InDulce, the highest primary production rate wasrecorded in August 1998 (2.92 g C m−3 h−1),whereas the lowest value (below the detectionlimit of the scintillation counter apparatus) wasrecorded between October 1999 and February2000, just after Dulce’s dry period.
Eight functional groups were recorded inSanta Olalla: D, H1, J, K, M, S1, W2 and Ycodons (Table 2). The D (represented by Cy-clotella spp. of small-cell size), W2 (representedby Trachelomonas volvocina) and Y (Cryp-tomonas phaseolus) groups only appeared during
14320 Limnetica 31(2), pàgina 294, 04/11/2012
Temporal variation of phytoplankton in two Mediterranean shallow lakes 295
the first study period (February to May 1998),followed by S1 (represented by Planktothrixagardhii) and H1 (represented by nitrogen-fixingcyanobacteria species like Anabaena spiroidesand Anabaenopsis circularis) groups in June andJuly of 1998. In July, H1 was accompanied by theM (Microcystis aeruginosa) group. From August1998 to January 1999, the system was dominatedby the K group of small-celled non-vacuolatecyanobacteria types (Aphanothece clathrata andChroococcus dispersus, which represented morethan 80 % of the total phytoplankton biovolumein those months). From February to April 1999,the K group appeared together with the H1
group (A. circularis) and, to a lesser extent,non-gelatinous and non-motile Chlorococcales(J group–Tetraedron minimum). From May 1999
until October of the same year, the S1 group(this time with Leptolyngbya sp. and Limnothrixamphigranulata) predominated again, but the Jcodon (Pediastrum boryanum and Tetraedronminimum) was also present from August on-wards. From November to December, the Kgroup, accompanied by the S1 codon, dominatedonce again. From January to February 2000, theK group appeared together with the H1 group.
Dulce Lake exhibited a more complex dis-tribution of phytoplankton functional groupsover time. Ten functional groups were observedduring the study period (Table 3). During the firstfour months (February to May 1998), the J group(Pediastrum boryanum, Scenedesmus opoliensisand S. ovalternus) appeared together with theW2 (Trachelomonas volvocina), D (Cyclotella
Table 2. Dominant phytoplankton species in Santa Olalla. In parentheses: % of the biomass of species in each month. Only takesinto account the % of species with a biomass equal to or greater than 10 %. The durations of the phases are taken in accordancewith the results of the correspondence analysis (Fig. 4). Especies fitoplanctónicas dominantes en Santa Olalla. En paréntesis % debiomasa de cada especie. Sólo se ha tenido en cuenta aquellas especies con un % de biomasa igual o superior al 10 %. La duraciónde cada fase es establecida de acuerdo con los resultados del Análisis de Correspondencia (Fig. 4).
SantaOlalla
1st dominant specie 2nd dominant specie 3rd dominant specie Functionalgroups Phases H′
February 98 Trachelomonas volvocina (35 %) Cryptomonas phaseolus (28 %) Cyclotella sp. (13 %) W2-Y-D P1SO 2.96March 98 Trachelomonas volvocina (81 %) Cryptomonas phaseolus (10 %) W2-Y 3.16April 98 Cyclotella sp. (74 %) Trachelomonas volvocina (20 %) D- W2 1.62May 98 Cyclotella sp. (52 %) Trachelomonas volvocina (11 %) D- W2 1.12June 98 Anabaena spiroides (28 %) Planktothrix agardhii (28 %) Cryptomonas phaseolus (28.3 %)
Trachelomonas volvocina (13 %)H1-S1-Y- W2 0.93
July 98 Anabaenopsis circularis (77 %) Microcystis aeruginosa (12 %) H1-M P2SO 2.37August 98 Chroococcus dispersus (86 %) Aphanothece clathrata (10 %) K 0.44September 98 Aphanothece clathrata (84 %) Chroococcus dispersus (15 %) K 0.04October 98 Chroococcus dispersus (86 %) Aphanothece clathrata (12 %) K 0.41December 98 Chroococcus dispersus (60 %) Aphanothece clathrata (39 %) K 0.1January 99 Chroococcus dispersus (79 %) Anabaenopsis circularis (11 %) K- H1 0.71February 99 Anabaenopsis circularis (55 %) Pediastrum boryanum (25 %) Chroococcus dispersus (10 %) H1-J-K 0.59March 99 Anabaenopsis circularis (55 %) Chroococcus dispersus (20 %) H1-K 0.51April 99 Chroococcus dispersus (20 %) Aphanothece clathrata (18 %)
Tetraedron minimum (18 %)Chlorella sp. (17 %)Microcystis aeruginosa (11 %)
K-J-M 0.91
May 99 Leptolyngbya sp. (44 %) Microcystis aeruginosa (17 %) S1-M P3SO 2.53June 99 Leptolyngbya sp. (89 %) S1 1.53July 99 Limnothrix amphigranulata (70 %) Microcystis aeruginosa (10 %) S1-M 1.63August 99 Limnothrix amphigranulata (58 %) Monoraphidium griffithii (18 %) S1-J 2.1September 99 Limnothrix amphigranulata (44 %) Leptolyngbya sp. (20 %)
Pediastrum boryanum (20 %)S1-J 1.8
October 99 Leptolyngbya sp. (34 %) Limnothrix amphigranulata (27 %) Tetraedron minimum (18 %) S1-J 2.38
November 99 Aphanothece clathrata (34 %) Limnothrix amphigranulata (28 %) Scenedesmus acuminatus (21 %) K- S1-J P2SO 0.32December 99 Aphanothece clathrata (39 %) Scenedesmus acuminatus (22 %) Limnothrix amphigranulata (18 %) K-J- S1 0.29January 00 Anabaenopsis circularis (47 %) Aphanothece clathrata (28 %) Scenedesmus acuminatus (23 %) H1-K 0.42February 00 Anabaenopsis circularis (49 %) Aphanothece clathrata (32 %) Scenedesmus acuminatus (13 %) H1-K 0.26
14320 Limnetica 31(2), pàgina 295, 04/11/2012

296 López-Archilla et al.
0,0
0,2
0,4
0,6
0,8
1,0
1,2
III-9
8
IV-9
8
V-9
8
VI-
-8
VII-
98
VIII
-98
IX-9
8
X-9
8
XII-
98
I-9
9
II-9
9
III-9
9
IV-9
9
V-9
9
VI-
99
VII-
99
VIII
-99
IX-9
9
X-9
9
XI-
99
XII-
99
I-0
0
II-0
0
Date of sampling
Bra
y-C
urtis
Inde
x
B-C Index SO
B-C Index D
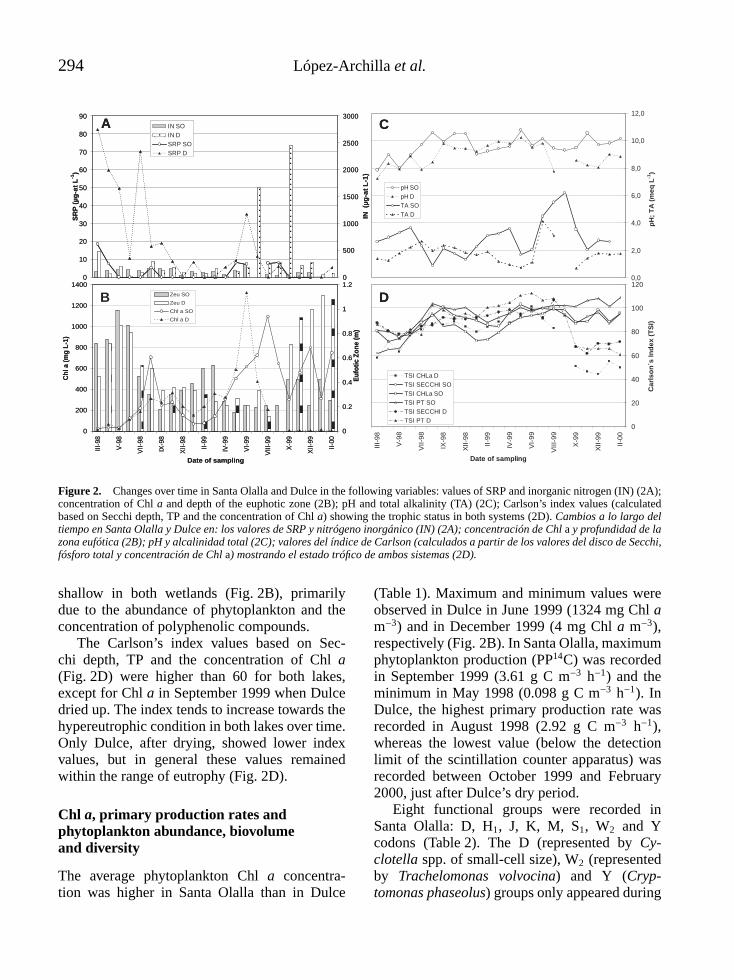
Figure 3. Rates of community change in Santa Olalla and Dulce estimated by the Bray-Curtis index, calculated from biovolumedata for the chronologically contiguous phytoplankton samples. Tasa de cambio de la comunidad fitoplanctónica en Santa Olalla yDulce estimada mediante el cálculo del índice de Bray-Curtis a partir de los datos del biovolumen en muestras cronológicamenteconsecutivas.
sp.) or P (Aulacoseria sp.) groups, dependingon the month. From June to September 1998,the P-M groups (Microcystis aeruginosa) co-dominated with W2 or several groups belongingto cyanobacteria (H1 –Anabaena spiroides,S1–Planktothrix agardhii, S2–Arthrospira platensisor K–Chroococcus dispersus). In October1998, the Y group (Cryptomonas phaseolus)co-dominated with the J group. From December1998 to May 1999, the H1 group appearedtogether with the J codon almost every month.In June 1999, the J and M groups predominated,whereas the Y group did so in July. In August,before its dry period, Dulce was strongly domi-nated by Arthrospira platensis (group S2). Afterdrying up (October 1999 to February 2000),Dulce was dominated by Cyclotella sp. and othersmall-sized diatoms (D group) except in January,where the predominant group was Y.
Figure 3 illustrates an estimate of the com-munity change rate (Bray-Curtis Index) (Bloom,1981). The values are normally very dependenton the time interval used. Values tend to be lowfor samples collected during short time inter-vals and show maximum values for samples col-lected in different seasons (Salmaso, 2003). In
this study, four week intervals were used to ob-serve the variation of the phytoplankton commu-nity. The community change rate for Santa Olallaincreases gradually in the first study period (fromMarch to August 1998), after which changes aresmaller, except in July 1999, where the changerate once again had a high value. The Bray-Curtisindex exhibited low values during Dulce’s firsthydrological cycle and increased during the sec-ond cycle, between May and June 1999, and es-pecially just after Dulce’s dry period, betweenNovember 1999 and February 2000.
Low Shannon index values (H′) were ob-tained for both shallow lakes, with an averageof 1.11 for Santa Olalla and 1.79 for Dulce(Table 1). In Santa Olalla, the highest biodiver-sity (H′ = 3.16) was observed at the beginningof the study (February and March 1998). Af-terwards, biodiversity decreased continuouslyuntil the winter of 1998 (though it had a peakin July 1998), when it recovered slightly only todecrease once again in the winter of 1999-2000.It is interesting to note that in September 1998 SantaOlalla was completely dominated by cyanobacteriaand had a very low H′ value (0.04) (Table 2). Dulcehad greater biodiversity than Santa Olalla most
14320 Limnetica 31(2), pàgina 296, 04/11/2012

Temporal variation of phytoplankton in two Mediterranean shallow lakes 297
Table 3. Dominant phytoplankton species in Dulce. In parentheses: % of the biomass of species in each month. Only takes intoaccount the % of species with a biomass equal to or greater than 10 %. The duration of the phases are taken in accordance with theresults of the correspondence analysis (Fig. 4). Especies fitoplanctónicas dominantes en Dulce. En paréntesis % de biomasa de cadaespecie. Sólo se ha tenido en cuenta aquellas especies con un % de biomasa igual o superior al 10 %. La duración de cada fase esestablecida de acuerdo con los resultados del Análisis de Correspondencia (Fig. 4).
Dulce 1st dominant specie 2nd dominant specie 3rd dominant specie Functionalgroups Phases H′
February 98 Scenedesmus ovalternus (44 %) Scenedesmus opoliensis (12 %) Cryptomonas phaseolus (10 %)Trachelomonas volvocina (10 %)
J-Y- W2 P1D 1.46
March 98 Trachelomonas volvocina (62 %) Scenedesmus opoliensis (22 %)Pediastrum boryanum (22 %)
W2-J 1.07
April 98 Cyclotella sp. (47 %) Pediastrum boryanum (15 %) Trachelomonas volvocina (13 %)Scenedesmus opoliensis (12 %)
D-J- W2 2.3
May 98 Trachelomonas volvocina (29 %) Scenedesmus opoliensis (21 %) Aulacoseira sp. (13 %) W2-J-P 1.64June 98 Microcystis aeruginosa (23 %) Aulacoseira sp. (20 %) Anabaena spiroides (15 %)
Trachelomonas volvocina (11 %)M-P-H1-W2 2.25
July 98 Planktothrix agardhii (40 %) Microcystis aeruginosa (21 %) Aulacoseira sp. (17 %) S1-M-P 1.64August 98 Aulacoseira sp. (25 %) Arthrospira platensis (23 %) Microcystis aeruginosa (10 %) P-S2-M 1.61
September 98 Arthrospira platensis (23 %) Chroococcus dispersus (19 %) Aulacoseira sp. (16 %)Anabaena spiroides (15 %)
S2-K-P- H1 P2D 1.82
October 98 Scenedesmus quadricauda (22 %) Cryptomonas phaseolus (18 %) J-Y 3.67December 98 Anabaena spiroides (47 %) Pediastrum boryanum (13 %) H1-J 1.92
January 99 Anabaena spiroides (53 %) Monoraphidium contortum (15 %) H1-J P3D 1.195February 99 Anabaena spiroides (48 %) Pediastrum boryanum (42 %) H1-J 1.13March 99 Anabaenopsis circularis (44 %) Pediastrum boryanum (20 %) Anabaena spiroides (17 %) H1-J 1.99April 99 Anabaena spiroides (36 %) Anabaenopsis circularis (23 %) Microcystis aeruginosa (12 %) H1-M 2.17May 99 Anabaenopsis circularis (25 %) Scenedesmus quadricauda (23 %) Scenedesmus opoliensis (17 %)
Anabaena spiroides (15 %)H1-J 1.95
June 99 Microcystis aeruginosa (47 %) Scenedesmus quadricauda (37 %) M-J P2D 0.55
July 99 Cryptomonas phaseolus (81 %) Y P4D 3.06August 99 Arthrospira platensis (83 %) Cyclotella sp. (13 %) S2-D 0.12September 99*October 99 Others small-cell diatoms (89 %) D 2.39
November 99 Others small-cell diatoms (69 %) D P2D 2.5December 99 Others small-cell diatoms (69 %) Euglena gracilis (20 %) D- W2 2.47January 00 Cryptomonas phaseolus (81 %) Monoraphidium contortum (10 %) Y-J 1.17February 00 Others small-cell diatoms (71 %) Monoraphidium arcuatum (15 %) D-J 0.85
* Dulce remained dry during September 1999.
of the time. The H′ values for Dulce exhibitedtwo peaks: October 1998 (H′ = 3.67, maximumvalue) and July 1999 (H′ = 3.06). The minim-um value was observed in August 1999 (H′ = 0.12)shortly before Dulce dried up (Table 3).
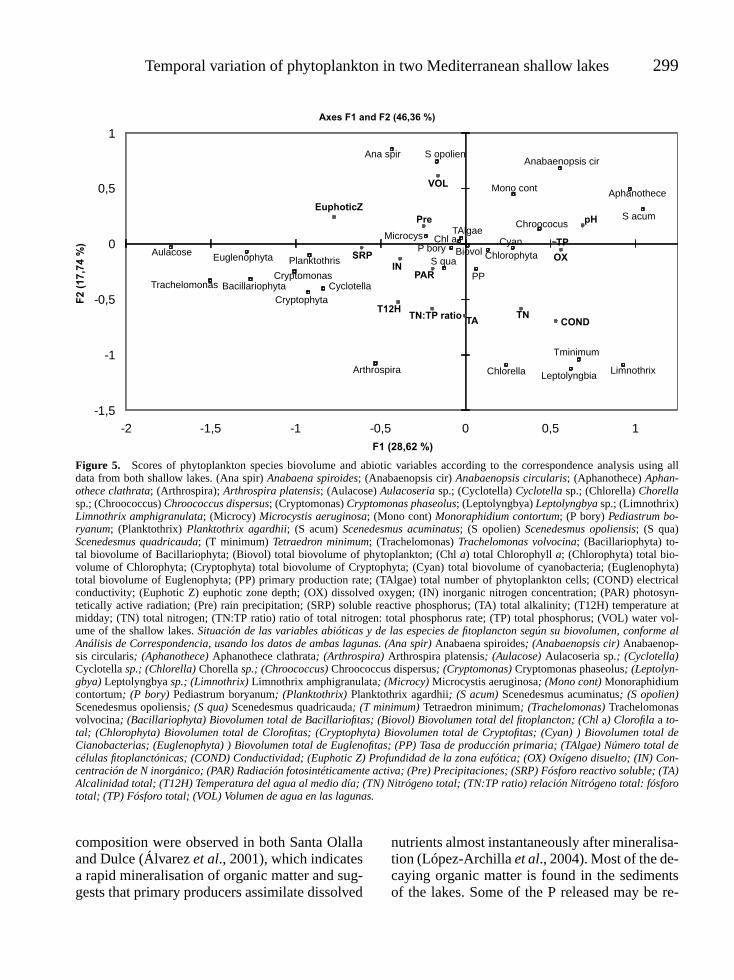
The canonical correspondence analysis (CCA)showed a significant value ( p < 0.0001) for thepermutation probe. The first two axes togetherexplained 46.36 % of the total variability inthe data. The first CCA axis separated the twoshallow lakes except for the first four months ofthe study in Santa Olalla, which are placed nextto Dulce’s months (Fig. 4) since both lakes werein superficial contact over that period. Santa
Olalla appears to the right, influenced by higherTN and TP concentrations, pH, conductivity andhigher biovolumes of cyanobacteria (particularlyAphanothece clathrata, Limnothrix amphigran-ulata and Leptolyngbya sp.) and chlorophytes(Scenedesmus acuminata and Tetraedron min-imum) (Fig. 5). Dulce is located on the left ofthe diagram, influenced by higher values forinorganic nitrogen (IN), phosphorous (SRP),the depth of the euphotic zone and higher totalbiovolumes of Bacillariophyta (Aulacoseriasp.), Euglenophyta (especially Trachelomonasvolvocina) and Cryptophyta (Cryptomonas pha-seolus). The second CCA axis indicated a grad-
14320 Limnetica 31(2), pàgina 297, 04/11/2012

298 López-Archilla et al.
Months
Axes F1 and F2 (46,36 %)
SOMz98
SOAp98SOMy98
SOJn98
SOJl98
SOAg98
SOSt98
SOOc98
SODc98
SOJan99
SOFb99
SOMz99SOAp99
SOMy99
SOJn99
SOJl99SOAg99
SOSt99
SOOc99
SONv99
SODc99
SOJan00
SOFb00
DMz98DAp98DMy98
DJn98
DJl98
DAg98
DSt98
DOc98
DDc98
DJan99
DFb99DMz99
DAp99
DMy99
DJn99
DJl99
DAg99
DOc99
DNv99DDc99
DJan00
DFb00
-0,75
-0,25
0,25
-1 -0,5 0 0,5
F1 (28,62 %)
F2
(1
7,7
4 %
)
P1D
P2D
P1SO
P2SO
P3SOP4D
P3D
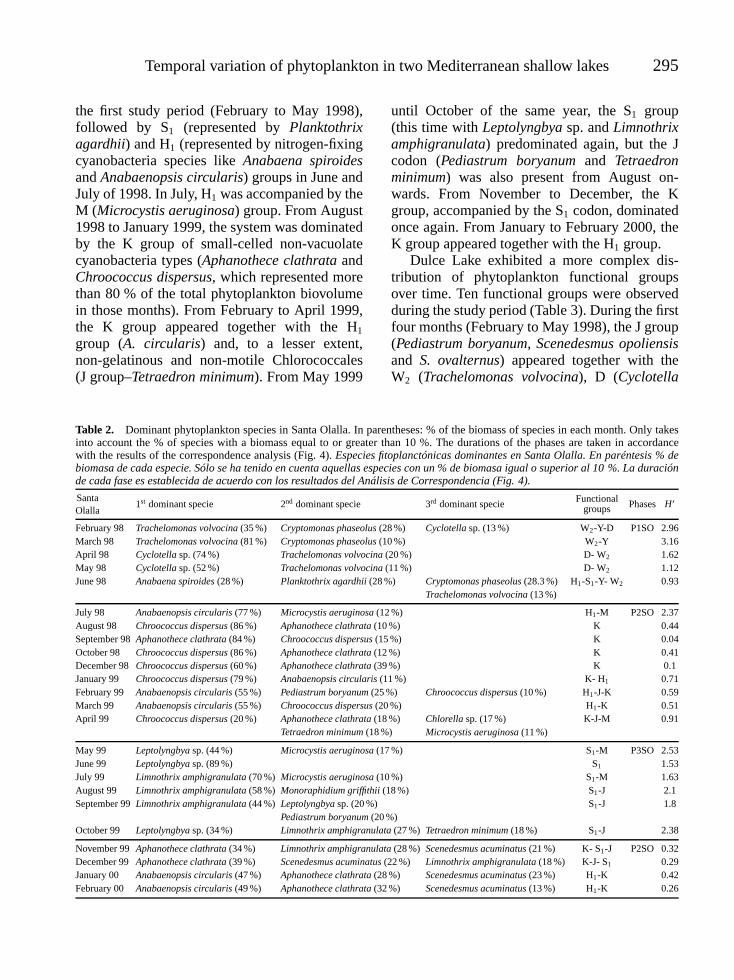
Figure 4. Score dispersion of samples along the first two CCA axes. Samples were grouped into phases over time. P1SO, P2SOand P3SO: different phases in Santa Olalla. P1D, P2D, P3D and P4D: different phases in Dulce. Dispersión de las muestras en losdos primeros ejes del CCA. Las muestras se agrupan en fases a lo largo del tiempo. P1SO, P2SO y P3SO: Diferentes fases de SantaOlalla. P1D, P2D, P3D y P4D: Diferentes fases de Dulce.
ual move towards hypereutrophication in bothsystems over the study period. There is a max-imum in summer 1999 (Fig. 4), determined byhigh values of TN, the TN:TP ratio, conductivity,total alkalinity and temperature and low watervolumes in the lakes (Fig. 5). The lakes revert toa more moderate eutrophic state in the autumnand winter of 1999-2000.
DISCUSSION
Santa Olalla and Dulce are two natural eu-trophic/hypereutrophic shallow lakes with veryhigh TN, TP and Chl a concentrations, phytoplank-
tonic biomass and, especially, primary production,along with low diversity (Table 1). Cyanobacteriadominated most of the study period in both shal-low lakes , particularly in Santa Olalla, whichexhibited a more eutrophic state, especiallyduring the final months of the study (Fig. 2D).
In both Santa Olalla and Dulce, N and P arepredominantly in organic form, inorganic nutri-ents are in very low concentrations most of thetime (Fig. 2A), and the N/P ratio (Table 1) indi-cates a deficiency in P for most of the monthsin both shallow lakes (Coleto, 2003). Given thehigh primary production in both systems, this de-ficiency does not appear to be limiting phyto-plankton growth. In addition, high rates of de-
14320 Limnetica 31(2), pàgina 298, 04/11/2012
Temporal variation of phytoplankton in two Mediterranean shallow lakes 299
Limnothrix
Anabaenopsis cir
Leptolyngbia
Aphanothece
Chroococus
Ana spir
Arthrospira
Microcys
Planktothris
Chlorella
Mono cont
P boryS qua
S acum
S opolien
Tminimum
CryptomonasCyclotella
Aulacose
TrachelomonasPP
Chl aBiovol
TAlgaeCyan
Chlorophyta
Cryptophyta
Bacillariophyta
Euglenophyta
T12H
COND
VOL
EuphoticZ
pH
OX
TATN
IN
TP
SRP
TN:TP ratio
Pre
PAR
-1,5
-1
-0,5
0
0,5
1
-2 -1,5 -1 -0,5 0 0,5 1
F1 (28,62 %)
F2 (
17,7
4 %
)
Axes F1 and F2 (46,36 %)
Figure 5. Scores of phytoplankton species biovolume and abiotic variables according to the correspondence analysis using alldata from both shallow lakes. (Ana spir) Anabaena spiroides; (Anabaenopsis cir) Anabaenopsis circularis; (Aphanothece) Aphan-othece clathrata; (Arthrospira); Arthrospira platensis; (Aulacose) Aulacoseria sp.; (Cyclotella) Cyclotella sp.; (Chlorella) Chorellasp.; (Chroococcus) Chroococcus dispersus; (Cryptomonas) Cryptomonas phaseolus; (Leptolyngbya) Leptolyngbya sp.; (Limnothrix)Limnothrix amphigranulata; (Microcy) Microcystis aeruginosa; (Mono cont) Monoraphidium contortum; (P bory) Pediastrum bo-ryanum; (Planktothrix) Planktothrix agardhii; (S acum) Scenedesmus acuminatus; (S opolien) Scenedesmus opoliensis; (S qua)Scenedesmus quadricauda; (T minimum) Tetraedron minimum; (Trachelomonas) Trachelomonas volvocina; (Bacillariophyta) to-tal biovolume of Bacillariophyta; (Biovol) total biovolume of phytoplankton; (Chl a) total Chlorophyll a; (Chlorophyta) total bio-volume of Chlorophyta; (Cryptophyta) total biovolume of Cryptophyta; (Cyan) total biovolume of cyanobacteria; (Euglenophyta)total biovolume of Euglenophyta; (PP) primary production rate; (TAlgae) total number of phytoplankton cells; (COND) electricalconductivity; (Euphotic Z) euphotic zone depth; (OX) dissolved oxygen; (IN) inorganic nitrogen concentration; (PAR) photosyn-tetically active radiation; (Pre) rain precipitation; (SRP) soluble reactive phosphorus; (TA) total alkalinity; (T12H) temperature atmidday; (TN) total nitrogen; (TN:TP ratio) ratio of total nitrogen: total phosphorus rate; (TP) total phosphorus; (VOL) water vol-ume of the shallow lakes. Situación de las variables abióticas y de las especies de fitoplancton según su biovolumen, conforme alAnálisis de Correspondencia, usando los datos de ambas lagunas. (Ana spir) Anabaena spiroides; (Anabaenopsis cir) Anabaenop-sis circularis; (Aphanothece) Aphanothece clathrata; (Arthrospira) Arthrospira platensis; (Aulacose) Aulacoseria sp.; (Cyclotella)Cyclotella sp.; (Chlorella) Chorella sp.; (Chroococcus) Chroococcus dispersus; (Cryptomonas) Cryptomonas phaseolus; (Leptolyn-gbya) Leptolyngbya sp.; (Limnothrix) Limnothrix amphigranulata; (Microcy) Microcystis aeruginosa; (Mono cont) Monoraphidiumcontortum; (P bory) Pediastrum boryanum; (Planktothrix) Planktothrix agardhii; (S acum) Scenedesmus acuminatus; (S opolien)Scenedesmus opoliensis; (S qua) Scenedesmus quadricauda; (T minimum) Tetraedron minimum; (Trachelomonas) Trachelomonasvolvocina; (Bacillariophyta) Biovolumen total de Bacillariofitas; (Biovol) Biovolumen total del fitoplancton; (Chl a) Clorofila a to-tal; (Chlorophyta) Biovolumen total de Clorofitas; (Cryptophyta) Biovolumen total de Cryptofitas; (Cyan) ) Biovolumen total deCianobacterias; (Euglenophyta) ) Biovolumen total de Euglenofitas; (PP) Tasa de producción primaria; (TAlgae) Número total decélulas fitoplanctónicas; (COND) Conductividad; (Euphotic Z) Profundidad de la zona eufótica; (OX) Oxígeno disuelto; (IN) Con-centración de N inorgánico; (PAR) Radiación fotosintéticamente activa; (Pre) Precipitaciones; (SRP) Fósforo reactivo soluble; (TA)Alcalinidad total; (T12H) Temperatura del agua al medio día; (TN) Nitrógeno total; (TN:TP ratio) relación Nitrógeno total: fósforototal; (TP) Fósforo total; (VOL) Volumen de agua en las lagunas.
composition were observed in both Santa Olallaand Dulce (Álvarez et al., 2001), which indicatesa rapid mineralisation of organic matter and sug-gests that primary producers assimilate dissolved
nutrients almost instantaneously after mineralisa-tion (López-Archilla et al., 2004). Most of the de-caying organic matter is found in the sedimentsof the lakes. Some of the P released may be re-
14320 Limnetica 31(2), pàgina 299, 04/11/2012

300 López-Archilla et al.
tained in the sediments, to be adsorbed primar-ily by Fe in these systems (Coleto, 2003). How-ever, this fraction is readily bio-available to or-ganisms depending on the pH and redox state ofthe sediment-water interface (Scheffer, 1998), es-pecially when these areas become anoxic, whichoccurs in several months during the study pe-riod (data not shown). The low values of oxy-gen in the water column in Santa Olalla andDulce appear to be linked to a slightly higherconcentration of SRP and IN (Fig. 5), favour-ing the presence of a higher number of species(particularly bacillariophytes, cryptophytes, eu-glenophytes and some species of chlorophytes).However, these species appear for short periodsbefore being replaced by species of cyanobac-teria and chlorophytes when the inorganic nu-trient concentrations became even lower. Thesespecies are strongly dominant in the phytoplank-tonic community, and their presence suggests thatthey have the ability to rapidly capture the in-organic nutrients released through decomposi-tion and that they compete more successfullyfor such inorganic nutrients than cryptophytes,bacillariophytes or euglenophytes. This capacitymay be related to their relatively smaller cell size(Aphanothece clathrata, C. dispersus, T. mini-mum) or their filamentous shape with small diam-eter (Limnothrix amphigranulata and Leptolyn-gbya sp.) and the consequent increase in theirsurface area/volume ratio.
Despite the facts that Santa Olalla and Dulcehave similar physical and chemical features,are in close proximity to each other and arehydrologically connected, their phytoplanktondynamics are markedly different, which appearsto be due to small environmental differencesbetween the lakes and especially the differenthydrological regimes, as shown by the CCAanalysis (Figures 4 and 5). This analysis dis-criminates between the Santa Olalla and Dulcesamples and shows a different evolution patternin each shallow lake. Three different phasesrelated to the increase of the trophic level couldbe observed in Santa Olalla (phase 1 from March1998 to June 1998; phase 2 from July 1998 toApril 1999, phase 3 from May 1999 to October1999 and phase 2 again from November 1999
to February 2000) (Fig. 4), whereas Dulce pre-sented a more complex pattern of four differentphases: phase 1 from March 1998 to August1998; phase 2 from September 1998 to December1998 and phase 3 from January to May 1999; inJune 1999, Dulce returned to phase 2 and enteredinto phase 4 from July 1999 until October 1999.From November 1999 to February 2000, thesystem returned to phase 2 once again (Fig. 4).
Phase 1 in Santa Olalla (Fig. 4), at the begin-ning of the study, is located between phases 1and 2 of Dulce. In this period, both lakes werevery similar and the phytoplankton assemblagewas dominated by the D, Y and W2 functionalgroups in both lakes, although the J group wasalso important in Dulce during this period. TheD-Y-J groups are a common element in shallowenriched systems (Reynolds et al., 2002; Romoand Villena, 2005), whereas the W2 group (repre-sented by Trachelomonas volvocina) is found inaerated lakes (Reynolds et al., 2002). Accordingto Padisák et al. (2003), the relationships of thisfunctional codon with other groups and with en-vironmental patterns that enhance its occurrencehave remained rather unclear. In this study, allof those functional groups are related to lowconductivity, greater depth of the euphotic zone,maximum water volume of the lakes and thepresence of inorganic nutrients, especially SRP(Fig. 5). Cyanobacteria appeared in Santa Olallafor the first time during the last month of phase 1(June 1998). A. spiroides (H1 group) and Plank-tothrix agardhii (S1 group) jointly accountedfor 56 % of the total biomass, but Cryptomonasphaseolus (Y) and Trachelomonas volvocina(W2) together represented 27 % (Table 2). June1998, together with the first month of phase 2(July 1998), appeared to be a period of transitionto a different state, where the predominance ofcyanobacteria is practically absolute.
Functional group K appeared during the firstappearance of phase 2 in Santa Olalla (Fig. 4and Table 2) and was present almost every monthduring this phase. Reynolds et al. (2002) foundthat this group of small-celled colonial and non-vacuolate cyanobacteria survives well at a highpH, and Padisák et al. (2003) observed its pres-ence in shallow, nutrient rich, turbid lakes. In
14320 Limnetica 31(2), pàgina 300, 04/11/2012

Temporal variation of phytoplankton in two Mediterranean shallow lakes 301
Santa Olalla, the appearance of this group is re-lated to high conductivity and pH, low depth ofthe euphotic zone, low SRP concentration and alow TN:TP ratio (Fig. 5), a feature that is sharedwith Anabaenopsis circularis (H1), which occursduring several months in this phase.
Phase 3 (Fig. 4) corresponds to higher tem-peratures, conductivity and total alkalinity, lowwater volume in the lake and a shallow depthof the euphotic zone (all features from latespring and early summer) (Fig. 5) and the ap-pearance of the S1 (Limnothrix amphigranulataand Leptolyngbya sp.) functional group, whichmay be accompanied by the M (Microcystisaeruginosa) or J (P. boryanum or T. minimum)codons. Reynolds et al. (2002) related groupS1 to shallow enriched lakes where light isincreasingly the limiting constraint, as is thecase here. In contrast with L. amphigranulata,another species of the same genus, L. redekei, isa typical phytoplankton species of turbid mixedlayers of the lakes and lowland rivers of CentralEurope (Meffert, 1988). Limnothrix redekei hasalso been observed, but in winter/spring, in someshallow lakes such as Lake Melangee (Germany)(Mischke, 2003) or Lake Kastoria (Greece), ashallow Mediterranean lake where this speciesmade up 99 % of the phytoplankton biomass inthe winter (Moustaka-Gouni et al., 2007). In San-ta Olalla, L. amphigranulata appears in monthswhen the water reaches its most turbid andhottest state, which might suggest that thisspecies has requirements similar to those of L.redekei but prefers a higher temperature. Plank-tothrix agardhii, which appeared during the lastmonth of phase 1 (June 1998), is another memberof the S1 functional group. Wiedner (1999) inves-tigated the influence of mixing on the proportionof Planktothrix vs. Limnothrix and showed thatPlanktothrix exhibits faster uptake kineticsthat Limnothrix when P is provided in pulses andat low concentration. This may be the reason whyPlanktothrix only appears in June 1998, whenthe turbidity of the water is high but there is stillsome SRP in the lake, whereas inorganic P ispractically non-existent during phase 3.
After phase 3, the system returned to phase2 (Fig. 4). The depth of the euphotic zone in-
creased slightly, as did the water volume of thelake. There was a decrease in water temperature,but the rest of the environmental conditions weresimilar to those found during the first occurrenceof phase 2. The K and H1 functional groups werepresent again in this period. Villena & Romo(2003) found that small colonies of chroococcoidcyanobacteria replaced filamentous cyanobacte-ria, primarily in the summer, in Lake Albufera(Spain), a shallow Mediterranean lake similar toSanta Olalla in terms of the persistent dominanceof cyanobacteria and shallow water (Romo &Miracle, 1994). In Santa Olalla, there is also aco-existence or alternation between chroococ-coid and filamentous cyanobacteria. Villena &Romo (2003) found experimental evidence thatunder conditions of TP levels lower than 0.3 mgl−1, water quiescence and low rates of zooplanktongrazing, filamentous cyanobacteria were replacedby chroococcoid cyanobacteria in Lake Albufera.However, in Santa Olalla, the TP level was alwaysgreater than 0.8 mg l−1 during this second phase2 in which such cyanobacteria were registered.The filamentous cyanobacterium Anabaenopsiscircularis (H1 group) was only negatively corre-lated with water temperature (P = 0.008), whereasthe chroococcoid Aphanothece (K group) wasnegatively correlated with the number of hours oflight ( p = 0.001) and light intensity ( p = 0.019).This suggests that in Santa Olalla, the predomi-nance of one group over another is more relatedto day length than it is to TP concentration.
As before, Dulce exhibited a more complexpattern than Santa Olalla, and the stages are notrelated as clearly to the functional groups. The J,Y, W2, D, P, M, H1 and S1 functional codons al-ternated randomly during phase 1 (Table 3 andFig. 4). In the last three months of this period(June to August 1998), different cyanobacteriaappeared and co-dominated with Aulacoseria sp.(P group). Reynolds et al. (2002) associated the Pgroup with lakes of lower latitudes or temperatelakes in the summer when the epilimnion is con-tinuously mixed, although this can also happen inshallow non-stratified lakes such as Dulce, whichhas a water column that is completely mixeddue to wind and its gentle slopes (Álvarez et al.,2001). The P group is characteristically associated
14320 Limnetica 31(2), pàgina 301, 04/11/2012
302 López-Archilla et al.
with desmids (Reynolds et al., 2002). However,these kinds of associations with cyanobacteriaare not often found in the literature. Phase 1 wascharacterised by a high depth of the euphotic zone,high precipitation, higher SRP and inorganic Nconcentrations and moderate pH values (Fig. 5).
Phase 2 was characterised by lower valuesfor the euphotic zone depth, precipitation andSRP concentration compared to those of phase 1,whereas phase 3 appeared to be marked primar-ily by the volume of the water body and lowTA, TN:TP ratio, temperature, TN and con-ductivity values (Fig. 4 and 5). Both phaseswere defined by the dominance of filamentouscyanobacteria with heterocytes (H1 functionalgroup: A. spiroides and Anabaenopsis circularis)accompanied by several chlorophytes of the Jfunctional group (P. boryanum, Monoraphidiumcontortum or Scenedesmus quadricauda) exceptin October, when S. quadricauda together withCryptomonas phaseolus dominated. Anabaenop-sis circularis also appeared in phase 2 of SantaOlalla, but A. spiroides, which exhibited a par-ticular predominance in phase 3 of Dulce, wasunimportant in Santa Olalla during the studyperiod. It is possible that A. spiroides is not ableto withstand the high pH values that Anabaenop-sis circularis can, which would explain why A.spiroides is not significant in Santa Olalla wherepH values are very high.
Phase 4 integrated the months before andafter Dulce dried up in September (Fig. 4). Inthis phase, the Y, S2 (Arthrospira platensis)and D functional groups alternated (Table 3).Arthrospira platensis was the dominant speciesbefore Dulce dried up. This is the first time thatthis species has been described in Dulce. Its dom-inance appears to be associated with a high ev-aporation rate (rapid loss of water), very highconductivity and a high temperature (Fig. 5). Afterphase 4, the system returned to phase 2 (Fig. 4).The abiotic conditions were similar to those of theprevious phase 2; however, the biological variableswere very different (low phytoplankton biomass,number of cells and concentration of chlorophylla and a predominance of small bacillariophytesof the D group: Nitzschia spp. and Synedra sp.or Cryptomonas phaseolus, Y group).
Sommer et al. (1993) defined three criteria forthe identification of equilibrium states in phy-toplankton seasonal succession: (i) a maximumof three species of algae contribute more than80 % of the total biomass, (ii) their dominancepersists for more than 1-2 weeks and (iii) duringthat period, the total biomass does not increasesignificantly. Because this study is based on onesampling per month, that duration of equilibriumcannot be considered. In addition, both of thestudied shallow lakes have, like many Mediter-ranean aquatic systems, rapid loss of water byevaporation, which increases the number ofcells per volume of water and, therefore, theconcentration of algal biomass. Having takenthese considerations into account, we can af-firm that equilibrium phases in phytoplanktonassemblages are relatively frequent in Dulceand especially in Santa Olalla (Tables 2 and3). Padisák et al. (2003) found that equilibriumphases are rare in 80 studied Hungarian lakes.However, lakes that experience stress condi-tions such as salinity or nutrient deficienciesare more likely to support phytoplankton com-munities in equilibrium. According to Padisáket al. (2003), competitive interactions are ofsecondary importance in stressed systems suchas the above, and the primary factor of se-lection is the evolutionary adaptation to suchstress conditions. In Santa Olalla and Dulce,high water level fluctuations, low inorganicnutrient concentrations and the low light penetra-tion can be considered permanent stress factorsfor phytoplankton, and only a few species areadapted to these conditions. This could explainthe low diversity and number of species found inboth shallow lakes as well as the high frequencyof recorded equilibrium phases.
In conclusion, Santa Olalla and Dulce aretwo Mediterranean shallow lakes with a naturaltendency towards hypereutrophy. Cyanobacteriadominate the phytoplankton most of the timein Santa Olalla, whereas in Dulce they canco-dominate with small bacillariophytes andchlorophytes. Small differences in environmen-tal and hydrological features between the twolakes produce differences in the characteristicsand dynamics of their respective phytoplankton.
14320 Limnetica 31(2), pàgina 302, 04/11/2012

Temporal variation of phytoplankton in two Mediterranean shallow lakes 303
The stress that the phytoplankton in these lakesis subject to could explain the existence of asteady-state for many months. The study of theseanthropologically unchanged systems can allowus a deeper understanding of the dynamics ofMediterranean shallow lakes.
ACKNOWLEDGEMENTS
We would like to thank Sergio Álvarez, FernandoBarajas and Raquel Jimenez for their field andlaboratory assistance, and especially the DoñanaBiological Station team. This work was sup-ported by Comisión Interministerial de Ciencia yTecnología project CICYT HID 97-0321-CO2.
REFERENCES
ÁLVAREZ, S., E. RICO, E., M. C. GUERRERO, M.C. & C. C. MONTES. 2001. Decomposition ofJuncus maritimus in two shallow lakes of DoñanaNational Park. VII. Decomposition Organic Mat-ter in Standing Waters. International Review of Hy-drobiology, 86: 541–554.
APHA-AWWA-WPCF (1989). Standard Methods forthe Examination of Water and Wastewater. S.Clesceri, A. E. Greenberg & R. Trussell (eds).17th Edn. L. American Public Health Association:Washington, USA.
BEKLIOGLU, M., S. ROMO, I. KAGALOU, X.QUINTANA & E. BECARES. 2007. State of theart in the functioning of shallow Mediterraneanlakes: workshop conclusions. Hydrobiologia, 584:317–326.
BLOOM, S. A. 1981. Similarity Indices in commu-nity studies: Potential pitfalls. Marine Ecology, 5:125-128.
BOX, J. D. 1983. Investigation of the Folin-Ciocal-teau phenol reagent for the determination ofpolyphenolic substrates in natural waters. WaterResearch, 17: 511–525.
CARLSON, E. 1977. A trophic index for lakes. Lim-nology and Oceanography, 22: 361–369.
CASADO, S. & C. MONTES, 1995. Guía de los la-gos y humedales de España. Reyero, J.M. (Ed.)Madrid. 154 pp.
COLE, G. 1983. Textbook of Limnology, 3rd edn. Lon-don: The C.V. Mosby Co. 256 pp.
COLETO, M. C. 2003. Funciones hidrológicas y bio-geoquímicas e las formaciones palustres hipogéni-cas de los Mantos Eólicos de El Abalario-Doñana(Huelva). PhD. Thesis. Autónoma de Madrid Uni-versity. 461 pp.
FRY, J. C. 1990. Direct methods and biomass estima-tion. Methods in Microbiology, 122: 41–85.
GOLDMAN, C. R., E. STEEMANN-NIELSEN, R.A. VOLLENWEIDER, & R. G. AND WELTZEL,1974. Methods for measuring production rates:measurements (in situ) on isolated samples ofnatural comnmunities. The 14C light and darkbottle technique. In: A Manual on Methods forMeasuring Primary Production in Aquatic Envi-ronments: 88–92. IBP Handbook No 12. Black-well Scientific Publications.
JEFFREY, S., W. & G. F. HUMPHREY, 1975. Newspectrophotometric equations for determiningchlorophylls a, b, c1 and c2 in higher plants,algae and natural phytoplankton. Biochemie undPhysiologie der Pflanzen, 167: 191–194.
JEPPESEN, E., M. SØNDERGAARD, M. MEER-HOFF, T. L. LAURIDSEN & J. P. JENSEN.2007. Shallow lake restoration by nutrient loadingreduction-some recent findings and challengesahead. Hydrobiologia, 584: 239–252.
LÓPEZ-ARCHILLA, A.I, S. MOLLA, MaC. CO-LETO, MaC. GUERRERO & C. MONTES. 2004.Microbial Ecosystem metabolism in a eutrophicMediterranean dune wetland (The Santa OlallaShallow lake, Doñana National Park, SW Spain).Wetlands, 24: 848–858.
MANZANO, M. 2001. Clasificación de los hume-dales de Doñana atendiendo a su funcionamientohidrológico. Hidrogeología y Recursos Hidráuli-cos XXIV, 24: 57–75.
MEFFERT, M. E. 1988. Planktic unshealthed fil-aments (Cyanophyceae) with polar and centralgas-vacuoles. II Biology, population dynamicsand biotopes of Limnothrix redekei (Van Goor)Meffert. Archiv für Hydrobiolgie, 116: 257–282.
MISCHKE, U. 2003. Cyanobacteria associations inshallow polytrophic lakes: influence of environ-mental factors. Acta Oecologica, 24: S11–S23.
MOSS, B. 2007. Shallow lakes, the water frameworkdirective and life: What should it all be about?Hydrobiologia, 584: 381–394.
MOUSTAKA-GOUNI, M., E. VARDAKA & E. TRY-FON, 2007. Phytoplankton species successionin a shallow lakes (L. Kastoria. Greece): steady-
14320 Limnetica 31(2), pàgina 303, 04/11/2012

304 López-Archilla et al.
state dominance of Limnothrix redekei, Microcys-tis aeruginosa and Cylindrospermosis raciboskii.Hydrobiologia, 575: 129–140.
PADISÁK, J., G. BORICS, G. FEHÉR, I. GRIG-ORSZKY, I. OLDAL, A. SCHMIDT, & Z. ZÁM-BÓNÉ-DOMA. 2003. Dominant species, func-tional assemblages and frequency of equilibriumphases in later summer phytoplankton assembla-ges in Hungarian small shallow lakes. Hydrobiolo-gia, 502: 157–168.
PADISÁK, J., L. O. CROSSETTI & L. NASELLI-FLORES. 2009. Use and misuse in the applicationof the phytoplankton functional classification: acritical review with updates. Hydrobiologia, 621:1–19.
PERROW, M. R., M. L. MEIJER, P. DAWIDOWICZ& H. COOPS. 1997. Biomanipulation in shallowlakes: state of the art. Hydrobiologia, 342/343:355–365.
REYNOLDS, C. S., V. L. M. HUSZAR, C. KRUK, L.NASELLI-FLORES & S. MELO. 2002. Towardsa functional classification of the freshwater phyto-plankton. Journal of Plankton Research, 24: 417–428.
ROMO, S. & R. MIRACLE. 1994. Long-term phy-toplankton changes in a shallow hypertrophiclake, Albufera of Valencia (Spain). Hydrobiologia,275/276: 153–164.
ROMO, S. & M. J. VILLENA. 2005. Phytoplank-ton strategies and diversity under different nutri-ent levels and planktivorous fish densities in a shal-low lake. Journal of Phytoplankton Research, 27:1273–1286.
ROTT, E., 1981. Some results from phytoplanktoncounting intercalibrations. Schweizerische Zeitsch-rift für Hydrologie, 43: 35.
SALMASO, N. 1996. Factors affecting the seasonal-ity and distribution of cyanobacteria and chloro-phytes: a case study from the large lakes south ofthe Alps, with special reference to Lake Garda. Hy-drobiologia, 438: 43–63.
SALMASO, N. 2003. Life strategies, dominance pat-terns and mechanisms promoting species coexis-tence in phytoplankton communities along com-plex environmental gradients. Hydrobiologia, 502:13–36.
SCHEFFER, M. 1998. Ecology of shallow lakes. Ed.Chapman & Hall. Population and Biology Series22. 357 pp.
SOMMER, U., J. PADISÁK, C. S. REYNOLDS & P.JUHÁSZ-NAGY. 1993. Hutchinson’s heritage: thediversity-disturbance relationship in phytoplank-ton. Hydrobiologia, 249: 1–7.
SØNDERGAARD, M., L. LIBORIUSSEN, A. R. PE-DERSEN & E. JEPPENSEN. 2008. Lake restora-tion by fish removal: Short- and long-term effectsin 36 Danish lakes. Ecosystems, 11: 1291–1305.
TOJA, J., T. LÓPEZ, & N. GABELLONE. 1991. Suc-cessional changes in two dune ponds (Doñana Na-tional Park). Verhandlungen der InternationalenVereinigung für Limnologie, 24: 1556–1559.
VILLENA, M. J. & S. ROMO. 2003. Phytoplanktonchanges in a shallow Mediterranean lake (Albuferaof Valencia, Spain) after sewage diversion. Hydro-biologia, 506/509: 281–287.
WIEDNER, C. 1999. Toxische und nicht-toxischeCyanobakterien in Gewässern der Scharmützel-seeregion: ihr Vorkommen in Gewässern un-terschiedlicher Trophie und Morphometrie undSteuermechanismen ihrer Dynamik in polymiktis-chen Flachseen. Diss., BTU Cottbus, Fakultät fürUmwelt und Verfahenswissenschaten. 131 pp.
14320 Limnetica 31(2), pàgina 304, 04/11/2012