spatial analysis of lyme disease in howard county, … analysis of lyme disease in howard county,...
TRANSCRIPT
Spatial Analysis of Lyme Disease in Howard County,
MarylandMethods and Public Health Significance
Presented by Stacy WoodsPHASE intern, Howard County Health Department
May 14, 2010

Lyme Disease
Bacteria Borrelia burgdorferi causes Lyme disease
Transmitted to humans through infected ticks during bloodfeeding
Ixodes scapularis (deer tick)
Image by Dr. Jantin M. Vyas (2009)
Lyme Disease: Transmission Cycle
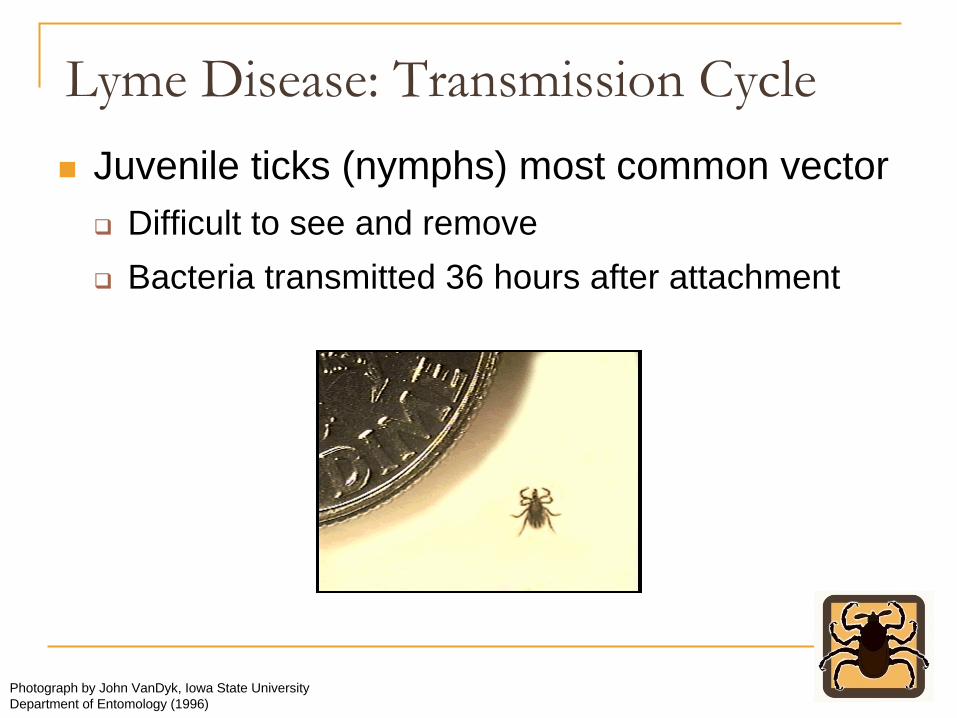
Juvenile ticks (nymphs) most common vector
Difficult to see and remove
Bacteria transmitted 36 hours after attachment
Photograph by John VanDyk, Iowa State University Department of Entomology (1996)

Lyme Disease: Clinical Manifestations
Characteristic bulls-eye rash (erythema migrans, EM)
Only 70 – 80% patients manifest EM
Flu-like symptoms
Muscle involvement
Severe headaches, neck stiffness
Cardiac involvement
Joint pain
CDC (2007)

Lyme Disease: Public Health Impact
Most common arthropod-borne disease in the United States
Maryland: 9th highest incidence rate in United States, 2008
Howard County: Highest number cases and 3rd highest incidence rate in Maryland, 2008
CDC (2009)Maryland Department of Health and Mental Hygiene (2009)
2008 Case Count*
2008 Incidence per 100,000
United States 35195 9.4Maryland 2216 31Howard County 369 133.8
*Confirmed and probable case diagnoses per CDC guidelines

Study Site: Howard County, MD
Study Methods
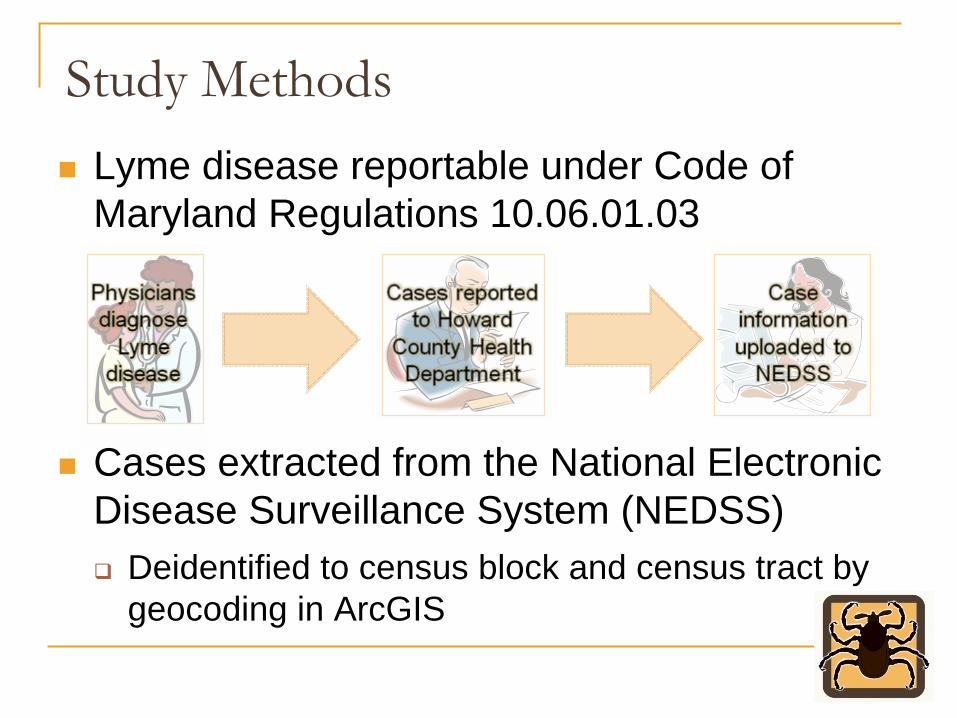
Lyme disease reportable under Code of Maryland Regulations 10.06.01.03
Cases extracted from the National Electronic Disease Surveillance System (NEDSS)
Deidentified to census block and census tract by geocoding in ArcGIS
Analysis: Cluster Detection
To determine if certain areas show higher than expected case counts (clusters) while accounting for variations in population density
Kulldorff’s spatial scan statistic
Adjusts for uneven population distribution across study area
Identifies the existence of disease clusters and their approximate locations
Provides single p-value to test null hypothesis of no clusters
Kulldorff et al. (1997)

Cluster Analysis: 2005 -
2007
Doll (2008)

Analysis: Assessing Risk
Relative Risk
Number of cases observed divided by expected number of cases for a given area
Choropleth map to show changes in relative risk across Howard County
Differs from 2007 risk analysis
2007 used ordinary kriging to approximate risk
Relative risk method expected to produce similar risk maps
Dr. Frank Curriero, personal communication, May 6, 2010
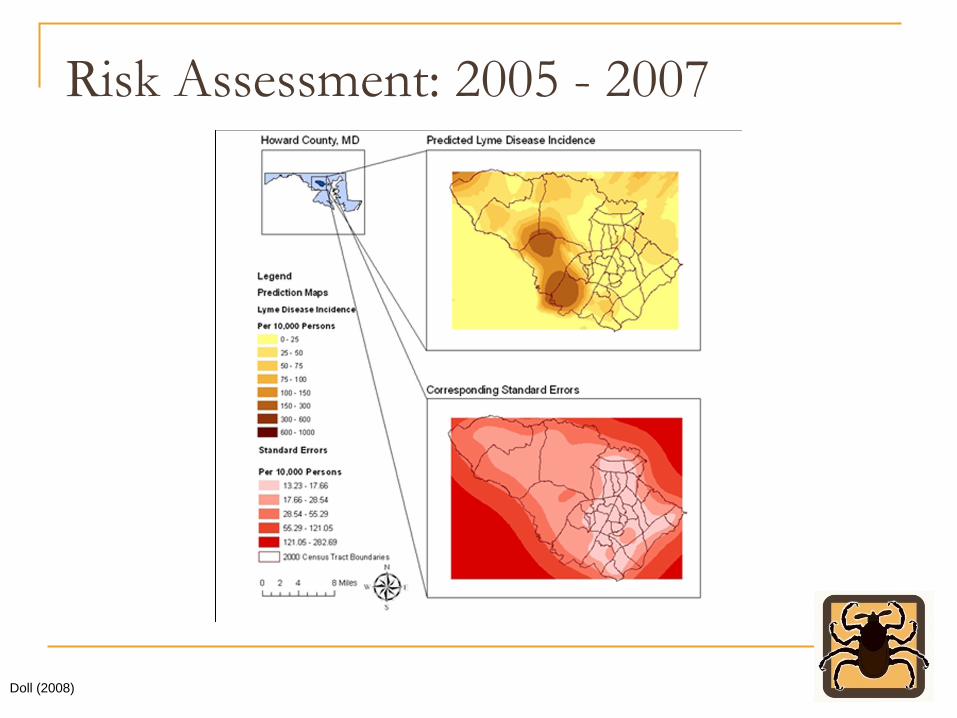
Risk Assessment: 2005 -
2007
Doll (2008)

Utilizing the Maps
Result: Multiple maps to help characterize geographic distribution of Lyme disease in Howard County
Guide governmental agencies in Lyme prevention activities
Education campaigns
Pesticide application
Environment modification

Geographic Information Systems (GIS) in Public Health
Computer-based procedures that allow users to input, manipulate, analyze, and output data to investigate spatial patterns and trends
Output often in map format
Spatial component of infectious disease transmission
Tick vector distribution for Lyme disease
Place of residence as approximation for place of exposure
Glass et al. (1995)

Geographic Information Systems (GIS) in Public Health
To identify potential risk factors for disease
Overlay maps of disease risk with maps of environment to visualize correlations
Potential environmental covariates for Lyme disease study:
Proximity to forest
Soil type
Urbanicity
Landuse
Glass et al. (1995)

Acknowledgements
Howard County Health Department
Elizabeth Bohle and Andrea Raid
Johns Hopkins Bloomberg School of Public Health
Dr. Greg Glass and Dr. Frank Curriero
PHASE Directors and Staff
Dr. Frangiscos Sifakis, Dipti Shah, James Kucik, and Beth Resnick

Works Cited
CDC (2007). “Lyme Disease Symptoms.” Division of Vector Borne Infectious Diseases. Accessed 5/5/2010 from http://www.cdc.gov/ncidod/dvbid/lyme/ld_humandisease_symptoms.htm.
The Centers for Disease Control (2009). Reported Lyme disease cases by state, 1999-2008. Retrieved 5/4/10 from http://www.cdc.gov/ncidod/dvbid/lyme/ld_rptdLymeCasesbyState.htm
Kulldorff, Martin, Feuer, Eric J., Miller, Barry A., and Freedman, Laurence S. (1997). “Breast Cancer Clusters in the Northeast United States: A Geographic Analysis.” American Journal of Epidemiology 146(2): 161 – 170.
Doll, Margaret (2008). “Spatial Analysis of Lyme Disease in Howard County, Maryland.” PHASE student final presentation, Maryland Department of Health and Mental Hygiene 5/16/2008. Retrieved 5/7/2010 from http://cha.maryland.gov/phase/ppt/2007/MargaretDoll.pdf.
Glass, Gregory E., Schwartz, Brian S., Morgan, John M., Johnson, Dale T., Noy, Peter M., and Israel, Ebenezer (1995). “Environmental Risk Factors for Lyme Disease Identified with Geographic Information Systems.” American Journal of Public Health 85(97): 944 – 948.