space transition corridors in the national airspace system · space transition corridors in the...
TRANSCRIPT

American Institute of Aeronautics and Astronautics
1
Space Transition Corridors in the National Airspace System
Karl D. Bilimoria* and Michael Jastrzebski† NASA Ames Research Center, Moffett Field, CA 94035
The importance of managing air and space traffic interactions will increase as the frequency of commercial space operations increases in the future. It is desirable that commercial operators of both aircraft and spacecraft receive equitable access to the shared resource of the National Airspace System while maintaining a high level of safety by protecting air traffic from possible spacecraft malfunctions. Current operational practice is conservative, reserving large volumes of airspace over a substantial time window. Space transition corridors are 4-dimensional envelopes, tailored to the trajectories of spacecraft during their launch and reentry flight phases, that provide a safety buffer without imposing excessive re-routing/delay costs on air traffic. Corridors with various spatial and temporal parameters were modeled in a simulation study, using air traffic re-routing distance as a performance metric. It was found that distance penalty contours can provide a basis for conducting tradeoffs within a corridor’s temporal design space (time window duration vs. window midpoint time). A tool based on these contours could be useful for launch and reentry planning to reduce re-routing/delay costs for aircraft flying in the vicinity of spaceports while maintaining safety.
Introduction he national airspace system (NAS) is a resource shared by operators of spacecraft as well as aircraft. Spacecraft typically spend a very short time in the NAS (at altitudes below 60,000 ft) during the ascent phase after launch
or the descent phase prior to landing. However, in current operations, a large block of airspace around the spacecraft’s nominal ascent/descent trajectory is reserved for a substantial amount of time in order protect air traffic from off-nominal conditions such as debris from explosion/disintegration events during launch/reentry or contingency trajectories for landing following a launch abort. This conservative approach assures a high level of safety, while imposing a cost on affected aircraft flights that must absorb re-routes and/or delays. This cost penalty may be tolerable when space missions are infrequent and conducted in the national interest (e.g., military missions).
It is anticipated that the number of commercial spacecraft operations will increase in the future. There will likely be more commercial orbital flights launched from coastal spaceports (e.g., Cape Canaveral in Florida), as well as commercial suborbital flights launched from interior spaceports (e.g., Spaceport America in New Mexico) that will return to their spaceport for landing after a short time. Continuing to use a conservative approach for assuring safety of air traffic and/or providing unrestricted NAS access to commercial spacecraft operators would likely impose an unfair economic burden on commercial aircraft operators. Both entities are businesses that conduct flight operations in the NAS, hence it is desirable that both classes of vehicles receive equitable access to this common resource while ensuring a high level of safety.
Integrated air and space traffic management will be needed to support efficient NAS operations in the future. Among other features, this future NAS may utilize space transition corridors1 which are four-dimensional envelopes tailored to the trajectory of spacecraft launch/reentry flight. Some prior work on air/space traffic integration is reported in Refs. 2–7. This paper presents a methodology for conducting tradeoffs among some key design parameters of space transition corridors, with the goal of meeting space mission requirements while attenuating re-route/delay penalties on air traffic.
The next section describes current operational practice as well as possible future practice for spaceflight-related airspace reservations. The following section discusses spatial and temporal parameters pertaining to the design of space transition corridors. The results of a simulation study on air/space traffic interaction are then presented, followed by conclusions. * Research Aerospace Engineer, Flight Trajectory Dynamics & Controls Branch, Mail Stop 210-10; [email protected]. Associate Fellow, AIAA. † Senior Programmer/Analyst, University of California – Santa Cruz, Systems Modeling and Optimization Branch.
T
Dow
nloa
ded
by N
ASA
AM
ES
RE
SEA
RC
H C
EN
TE
R o
n A
ugus
t 14,
201
3 | h
ttp://
arc.
aiaa
.org
| D
OI:
10.
2514
/6.2
013-
4248
2013 Aviation Technology, Integration, and Operations Conference
August 12-14, 2013, Los Angeles, CA
AIAA 2013-4248
This material is declared a work of the U.S. Government and is not subject to copyright protection in the United States.
American Institute of Aeronautics and Astronautics
2
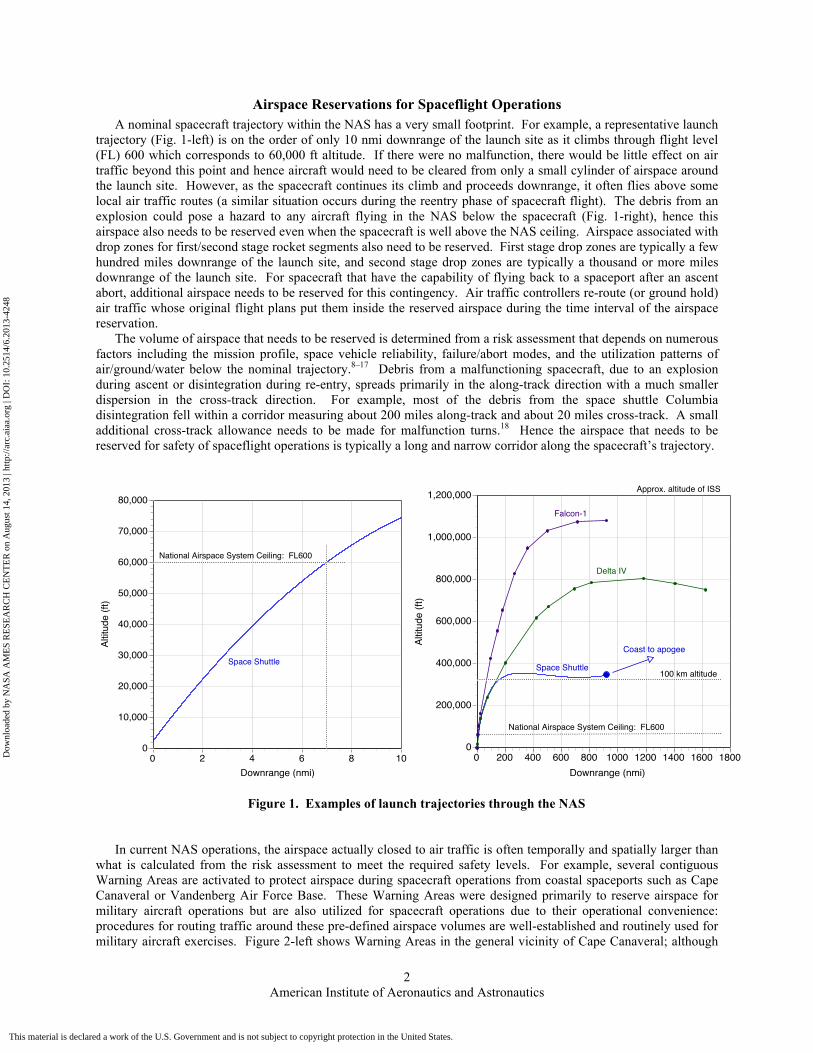
Airspace Reservations for Spaceflight Operations A nominal spacecraft trajectory within the NAS has a very small footprint. For example, a representative launch
trajectory (Fig. 1-left) is on the order of only 10 nmi downrange of the launch site as it climbs through flight level (FL) 600 which corresponds to 60,000 ft altitude. If there were no malfunction, there would be little effect on air traffic beyond this point and hence aircraft would need to be cleared from only a small cylinder of airspace around the launch site. However, as the spacecraft continues its climb and proceeds downrange, it often flies above some local air traffic routes (a similar situation occurs during the reentry phase of spacecraft flight). The debris from an explosion could pose a hazard to any aircraft flying in the NAS below the spacecraft (Fig. 1-right), hence this airspace also needs to be reserved even when the spacecraft is well above the NAS ceiling. Airspace associated with drop zones for first/second stage rocket segments also need to be reserved. First stage drop zones are typically a few hundred miles downrange of the launch site, and second stage drop zones are typically a thousand or more miles downrange of the launch site. For spacecraft that have the capability of flying back to a spaceport after an ascent abort, additional airspace needs to be reserved for this contingency. Air traffic controllers re-route (or ground hold) air traffic whose original flight plans put them inside the reserved airspace during the time interval of the airspace reservation.
The volume of airspace that needs to be reserved is determined from a risk assessment that depends on numerous factors including the mission profile, space vehicle reliability, failure/abort modes, and the utilization patterns of air/ground/water below the nominal trajectory.8–17 Debris from a malfunctioning spacecraft, due to an explosion during ascent or disintegration during re-entry, spreads primarily in the along-track direction with a much smaller dispersion in the cross-track direction. For example, most of the debris from the space shuttle Columbia disintegration fell within a corridor measuring about 200 miles along-track and about 20 miles cross-track. A small additional cross-track allowance needs to be made for malfunction turns.18 Hence the airspace that needs to be reserved for safety of spaceflight operations is typically a long and narrow corridor along the spacecraft’s trajectory.
Figure 1. Examples of launch trajectories through the NAS
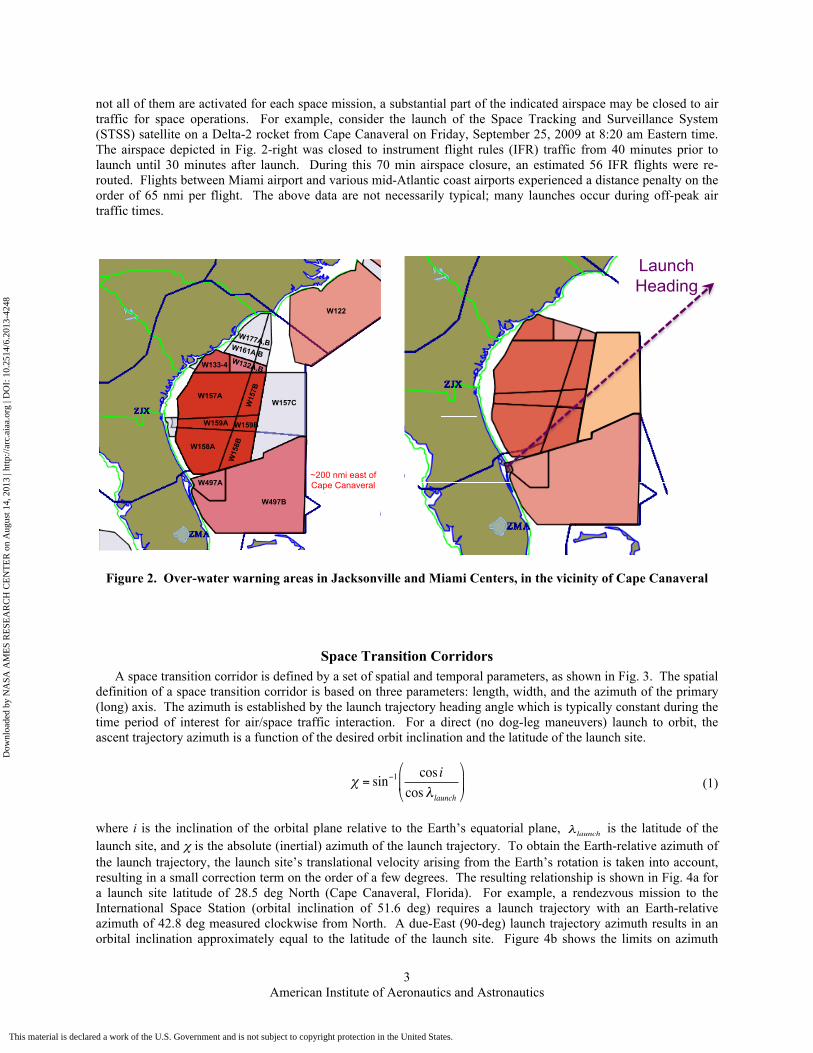
In current NAS operations, the airspace actually closed to air traffic is often temporally and spatially larger than what is calculated from the risk assessment to meet the required safety levels. For example, several contiguous Warning Areas are activated to protect airspace during spacecraft operations from coastal spaceports such as Cape Canaveral or Vandenberg Air Force Base. These Warning Areas were designed primarily to reserve airspace for military aircraft operations but are also utilized for spacecraft operations due to their operational convenience: procedures for routing traffic around these pre-defined airspace volumes are well-established and routinely used for military aircraft exercises. Figure 2-left shows Warning Areas in the general vicinity of Cape Canaveral; although
0
10,000
20,000
30,000
40,000
50,000
60,000
70,000
80,000
0 2 4 6 8 10
Altit
ude
(ft)
Downrange (nmi)
National Airspace System Ceiling: FL600
Space Shuttle
0
200,000
400,000
600,000
800,000
1,000,000
1,200,000
0 200 400 600 800 1000 1200 1400 1600 1800
Altit
ude
(ft)
Downrange (nmi)
Space Shuttle
National Airspace System Ceiling: FL600
100 km altitude
Coast to apogee
Falcon-1
Delta IV
Approx. altitude of ISS
Dow
nloa
ded
by N
ASA
AM
ES
RE
SEA
RC
H C
EN
TE
R o
n A
ugus
t 14,
201
3 | h
ttp://
arc.
aiaa
.org
| D
OI:
10.
2514
/6.2
013-
4248
This material is declared a work of the U.S. Government and is not subject to copyright protection in the United States.
American Institute of Aeronautics and Astronautics
3
not all of them are activated for each space mission, a substantial part of the indicated airspace may be closed to air traffic for space operations. For example, consider the launch of the Space Tracking and Surveillance System (STSS) satellite on a Delta-2 rocket from Cape Canaveral on Friday, September 25, 2009 at 8:20 am Eastern time. The airspace depicted in Fig. 2-right was closed to instrument flight rules (IFR) traffic from 40 minutes prior to launch until 30 minutes after launch. During this 70 min airspace closure, an estimated 56 IFR flights were re-routed. Flights between Miami airport and various mid-Atlantic coast airports experienced a distance penalty on the order of 65 nmi per flight. The above data are not necessarily typical; many launches occur during off-peak air traffic times.
Figure 2. Over-water warning areas in Jacksonville and Miami Centers, in the vicinity of Cape Canaveral
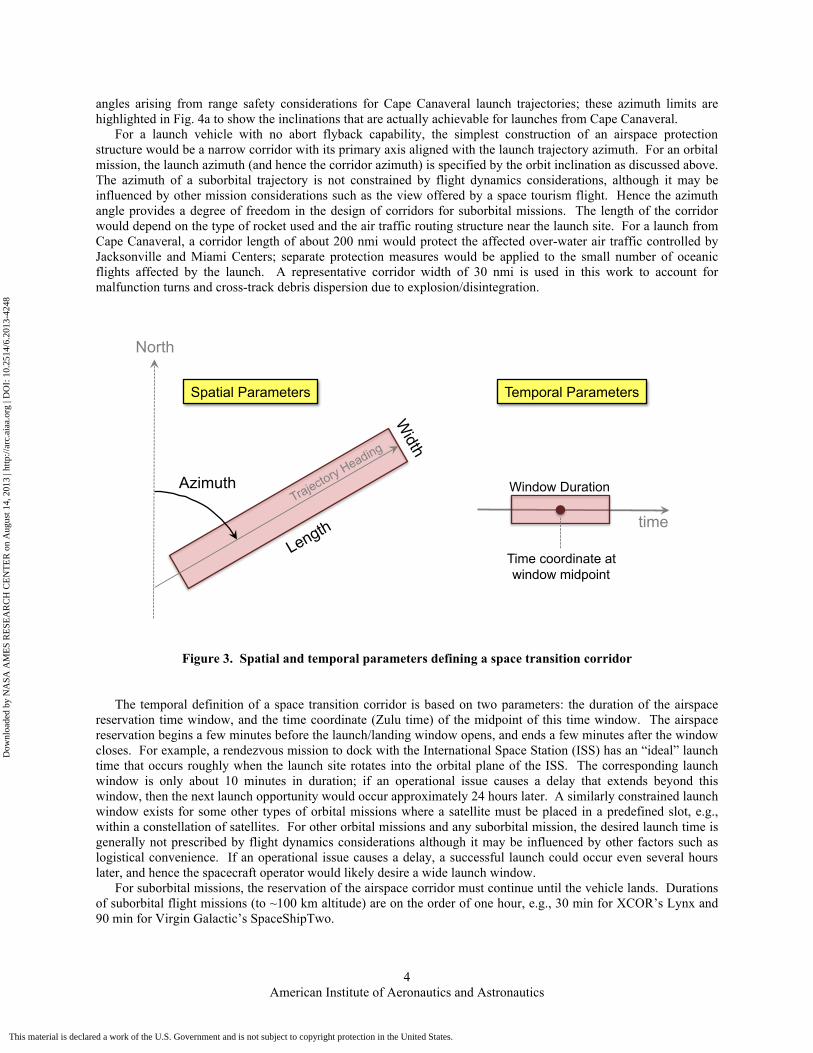
Space Transition Corridors A space transition corridor is defined by a set of spatial and temporal parameters, as shown in Fig. 3. The spatial
definition of a space transition corridor is based on three parameters: length, width, and the azimuth of the primary (long) axis. The azimuth is established by the launch trajectory heading angle which is typically constant during the time period of interest for air/space traffic interaction. For a direct (no dog-leg maneuvers) launch to orbit, the ascent trajectory azimuth is a function of the desired orbit inclination and the latitude of the launch site.
€
χ = sin−1 cos icos λ launch
⎛
⎝ ⎜
⎞
⎠ ⎟ (1)
where i is the inclination of the orbital plane relative to the Earth’s equatorial plane,
€
λ launch is the latitude of the launch site, and χ is the absolute (inertial) azimuth of the launch trajectory. To obtain the Earth-relative azimuth of the launch trajectory, the launch site’s translational velocity arising from the Earth’s rotation is taken into account, resulting in a small correction term on the order of a few degrees. The resulting relationship is shown in Fig. 4a for a launch site latitude of 28.5 deg North (Cape Canaveral, Florida). For example, a rendezvous mission to the International Space Station (orbital inclination of 51.6 deg) requires a launch trajectory with an Earth-relative azimuth of 42.8 deg measured clockwise from North. A due-East (90-deg) launch trajectory azimuth results in an orbital inclination approximately equal to the latitude of the launch site. Figure 4b shows the limits on azimuth
4/2/12 6:49 PM
Page 1 of 2
W497A
W497B
W158A
W15
8B
W159A W159B
W157A
W15
7B
W132A,B W133-4
W157C
W161A,B
W177A,B
W122
~200 nmi east of Cape Canaveral
4/3/12 7:55 PM
Page 1 of 2
4/3/12 7:55 PM
Page 1 of 2
4/3/12 7:55 PM
Page 1 of 2
4/3/12 7:55 PM
Page 1 of 2
Launch Heading
Dow
nloa
ded
by N
ASA
AM
ES
RE
SEA
RC
H C
EN
TE
R o
n A
ugus
t 14,
201
3 | h
ttp://
arc.
aiaa
.org
| D
OI:
10.
2514
/6.2
013-
4248
This material is declared a work of the U.S. Government and is not subject to copyright protection in the United States.
American Institute of Aeronautics and Astronautics
4
angles arising from range safety considerations for Cape Canaveral launch trajectories; these azimuth limits are highlighted in Fig. 4a to show the inclinations that are actually achievable for launches from Cape Canaveral.
For a launch vehicle with no abort flyback capability, the simplest construction of an airspace protection structure would be a narrow corridor with its primary axis aligned with the launch trajectory azimuth. For an orbital mission, the launch azimuth (and hence the corridor azimuth) is specified by the orbit inclination as discussed above. The azimuth of a suborbital trajectory is not constrained by flight dynamics considerations, although it may be influenced by other mission considerations such as the view offered by a space tourism flight. Hence the azimuth angle provides a degree of freedom in the design of corridors for suborbital missions. The length of the corridor would depend on the type of rocket used and the air traffic routing structure near the launch site. For a launch from Cape Canaveral, a corridor length of about 200 nmi would protect the affected over-water air traffic controlled by Jacksonville and Miami Centers; separate protection measures would be applied to the small number of oceanic flights affected by the launch. A representative corridor width of 30 nmi is used in this work to account for malfunction turns and cross-track debris dispersion due to explosion/disintegration.
Figure 3. Spatial and temporal parameters defining a space transition corridor
The temporal definition of a space transition corridor is based on two parameters: the duration of the airspace reservation time window, and the time coordinate (Zulu time) of the midpoint of this time window. The airspace reservation begins a few minutes before the launch/landing window opens, and ends a few minutes after the window closes. For example, a rendezvous mission to dock with the International Space Station (ISS) has an “ideal” launch time that occurs roughly when the launch site rotates into the orbital plane of the ISS. The corresponding launch window is only about 10 minutes in duration; if an operational issue causes a delay that extends beyond this window, then the next launch opportunity would occur approximately 24 hours later. A similarly constrained launch window exists for some other types of orbital missions where a satellite must be placed in a predefined slot, e.g., within a constellation of satellites. For other orbital missions and any suborbital mission, the desired launch time is generally not prescribed by flight dynamics considerations although it may be influenced by other factors such as logistical convenience. If an operational issue causes a delay, a successful launch could occur even several hours later, and hence the spacecraft operator would likely desire a wide launch window.
For suborbital missions, the reservation of the airspace corridor must continue until the vehicle lands. Durations of suborbital flight missions (to ~100 km altitude) are on the order of one hour, e.g., 30 min for XCOR’s Lynx and 90 min for Virgin Galactic’s SpaceShipTwo.
North
Length
Width
Azimuth
Spatial Parameters
time
Window Duration
Time coordinate at window midpoint
Temporal Parameters
Trajectory Heading
Dow
nloa
ded
by N
ASA
AM
ES
RE
SEA
RC
H C
EN
TE
R o
n A
ugus
t 14,
201
3 | h
ttp://
arc.
aiaa
.org
| D
OI:
10.
2514
/6.2
013-
4248
This material is declared a work of the U.S. Government and is not subject to copyright protection in the United States.

American Institute of Aeronautics and Astronautics
5
Figure 4a. Orbit inclination vs. Earth-relative launch azimuth
Figure 4b. Range safety limits for Cape Canaveral launches
0
15
30
45
60
75
90
105
120
135
150
165
180
0 30 60 90 120 150 180 210 240 270 300 330 360
Orb
it In
clina
tion
(deg
)
Launch Azimuth (deg)
Cape CanaveralLaunch Azimuth Limits
(35 – 120 deg)
ISS Orbit Inclination
Launch site latitude = 28.5 deg North
35 deg heading to
58 deg inclination
120 deg heading to
40 deg inclination
90 deg heading to 28.5 deg inclination
Dow
nloa
ded
by N
ASA
AM
ES
RE
SEA
RC
H C
EN
TE
R o
n A
ugus
t 14,
201
3 | h
ttp://
arc.
aiaa
.org
| D
OI:
10.
2514
/6.2
013-
4248
This material is declared a work of the U.S. Government and is not subject to copyright protection in the United States.
American Institute of Aeronautics and Astronautics
6
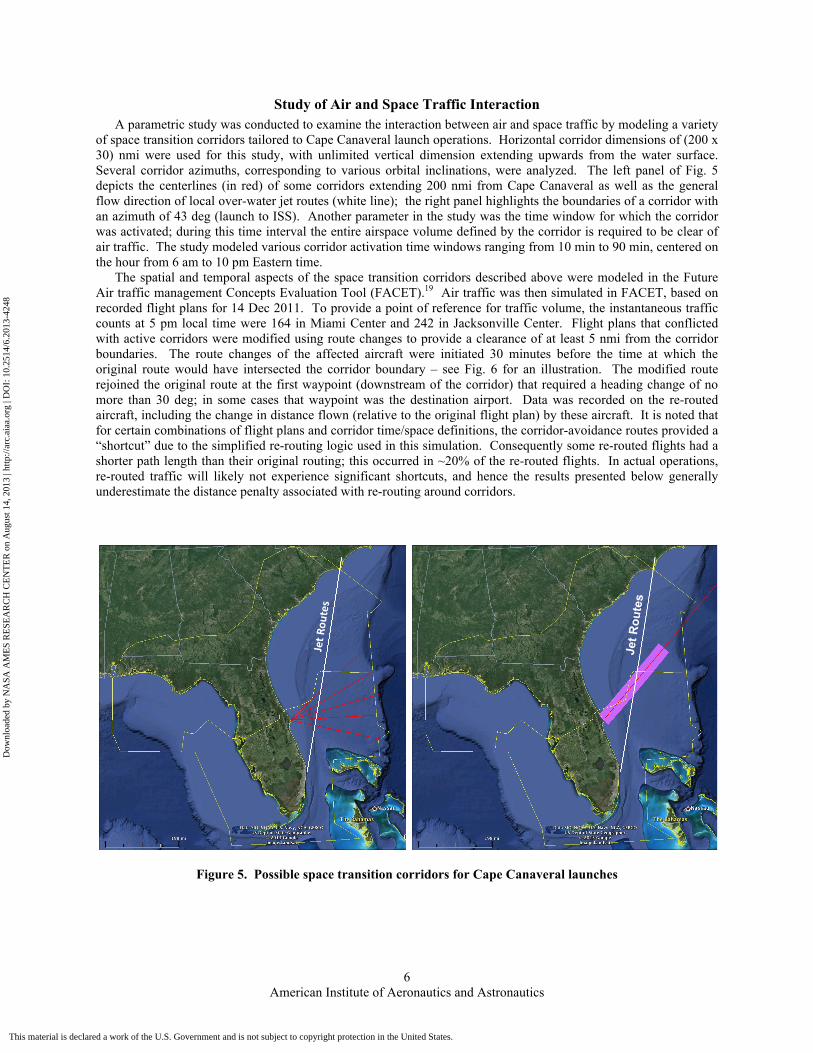
Study of Air and Space Traffic Interaction A parametric study was conducted to examine the interaction between air and space traffic by modeling a variety
of space transition corridors tailored to Cape Canaveral launch operations. Horizontal corridor dimensions of (200 x 30) nmi were used for this study, with unlimited vertical dimension extending upwards from the water surface. Several corridor azimuths, corresponding to various orbital inclinations, were analyzed. The left panel of Fig. 5 depicts the centerlines (in red) of some corridors extending 200 nmi from Cape Canaveral as well as the general flow direction of local over-water jet routes (white line); the right panel highlights the boundaries of a corridor with an azimuth of 43 deg (launch to ISS). Another parameter in the study was the time window for which the corridor was activated; during this time interval the entire airspace volume defined by the corridor is required to be clear of air traffic. The study modeled various corridor activation time windows ranging from 10 min to 90 min, centered on the hour from 6 am to 10 pm Eastern time.
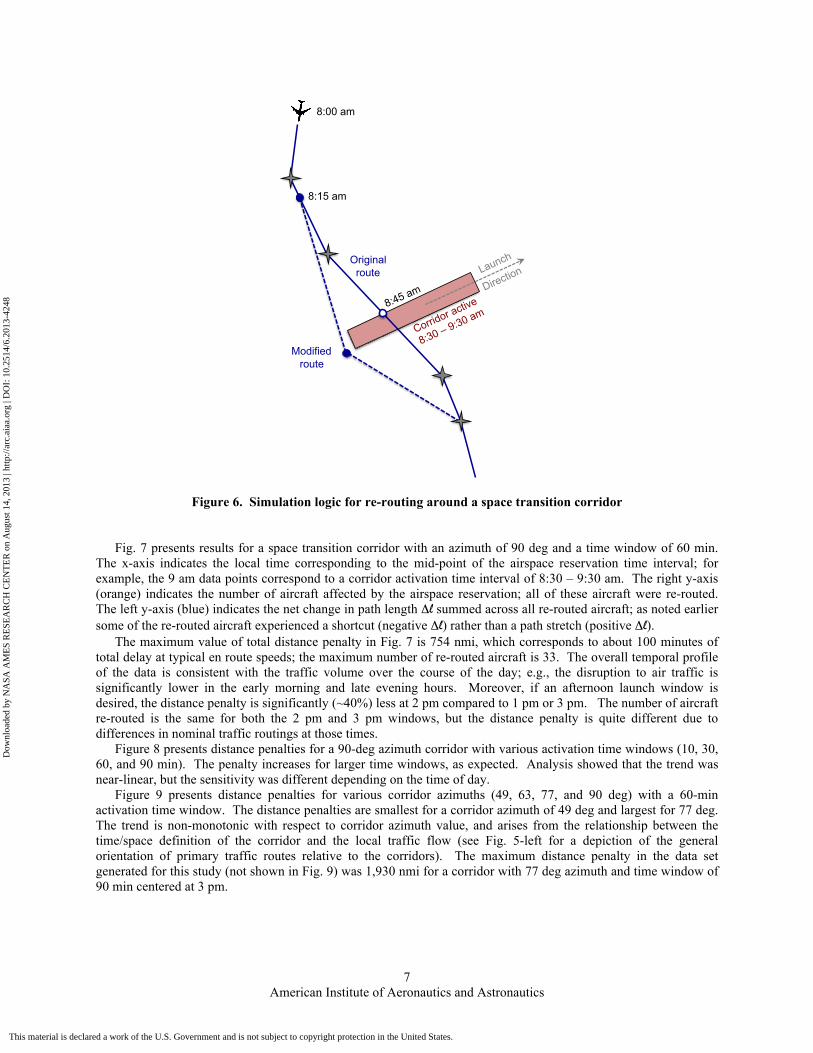
The spatial and temporal aspects of the space transition corridors described above were modeled in the Future Air traffic management Concepts Evaluation Tool (FACET).19 Air traffic was then simulated in FACET, based on recorded flight plans for 14 Dec 2011. To provide a point of reference for traffic volume, the instantaneous traffic counts at 5 pm local time were 164 in Miami Center and 242 in Jacksonville Center. Flight plans that conflicted with active corridors were modified using route changes to provide a clearance of at least 5 nmi from the corridor boundaries. The route changes of the affected aircraft were initiated 30 minutes before the time at which the original route would have intersected the corridor boundary – see Fig. 6 for an illustration. The modified route rejoined the original route at the first waypoint (downstream of the corridor) that required a heading change of no more than 30 deg; in some cases that waypoint was the destination airport. Data was recorded on the re-routed aircraft, including the change in distance flown (relative to the original flight plan) by these aircraft. It is noted that for certain combinations of flight plans and corridor time/space definitions, the corridor-avoidance routes provided a “shortcut” due to the simplified re-routing logic used in this simulation. Consequently some re-routed flights had a shorter path length than their original routing; this occurred in ~20% of the re-routed flights. In actual operations, re-routed traffic will likely not experience significant shortcuts, and hence the results presented below generally underestimate the distance penalty associated with re-routing around corridors.
Figure 5. Possible space transition corridors for Cape Canaveral launches
!"#$%
&'#"($
Jet R
oute
s
Dow
nloa
ded
by N
ASA
AM
ES
RE
SEA
RC
H C
EN
TE
R o
n A
ugus
t 14,
201
3 | h
ttp://
arc.
aiaa
.org
| D
OI:
10.
2514
/6.2
013-
4248
This material is declared a work of the U.S. Government and is not subject to copyright protection in the United States.
American Institute of Aeronautics and Astronautics
7
Figure 6. Simulation logic for re-routing around a space transition corridor
Fig. 7 presents results for a space transition corridor with an azimuth of 90 deg and a time window of 60 min. The x-axis indicates the local time corresponding to the mid-point of the airspace reservation time interval; for example, the 9 am data points correspond to a corridor activation time interval of 8:30 – 9:30 am. The right y-axis (orange) indicates the number of aircraft affected by the airspace reservation; all of these aircraft were re-routed. The left y-axis (blue) indicates the net change in path length Δl summed across all re-routed aircraft; as noted earlier some of the re-routed aircraft experienced a shortcut (negative Δl) rather than a path stretch (positive Δl).
The maximum value of total distance penalty in Fig. 7 is 754 nmi, which corresponds to about 100 minutes of total delay at typical en route speeds; the maximum number of re-routed aircraft is 33. The overall temporal profile of the data is consistent with the traffic volume over the course of the day; e.g., the disruption to air traffic is significantly lower in the early morning and late evening hours. Moreover, if an afternoon launch window is desired, the distance penalty is significantly (~40%) less at 2 pm compared to 1 pm or 3 pm. The number of aircraft re-routed is the same for both the 2 pm and 3 pm windows, but the distance penalty is quite different due to differences in nominal traffic routings at those times.
Figure 8 presents distance penalties for a 90-deg azimuth corridor with various activation time windows (10, 30, 60, and 90 min). The penalty increases for larger time windows, as expected. Analysis showed that the trend was near-linear, but the sensitivity was different depending on the time of day.
Figure 9 presents distance penalties for various corridor azimuths (49, 63, 77, and 90 deg) with a 60-min activation time window. The distance penalties are smallest for a corridor azimuth of 49 deg and largest for 77 deg. The trend is non-monotonic with respect to corridor azimuth value, and arises from the relationship between the time/space definition of the corridor and the local traffic flow (see Fig. 5-left for a depiction of the general orientation of primary traffic routes relative to the corridors). The maximum distance penalty in the data set generated for this study (not shown in Fig. 9) was 1,930 nmi for a corridor with 77 deg azimuth and time window of 90 min centered at 3 pm.
Corridor active
8:30 – 9:30 am 8:45 am
8:15 am
Original route
Modified route
8:00 am
Launch
Direction
Dow
nloa
ded
by N
ASA
AM
ES
RE
SEA
RC
H C
EN
TE
R o
n A
ugus
t 14,
201
3 | h
ttp://
arc.
aiaa
.org
| D
OI:
10.
2514
/6.2
013-
4248
This material is declared a work of the U.S. Government and is not subject to copyright protection in the United States.

American Institute of Aeronautics and Astronautics
8
Figure 7. Air traffic affected by a corridor with 90-deg azimuth and 60-min time window
Figure 8. Distance penalties for corridors with 90-deg azimuth and various time windows
0
100
200
300
400
500
600
700
800
0
5
10
15
20
25
30
35
40
06:00 09:00 12:00 15:00 18:00 21:00 00:00
Net
Add
ition
al D
ista
nce
Flow
n (n
mi)
Num
ber o
f Airc
raft
Rer
oute
d
Local Time of Window Midpoint
0
200
400
600
800
1000
1200
06:00 09:00 12:00 15:00 18:00 21:00 00:00
Net
Add
ition
al D
ista
nce
Flow
n (n
mi)
Local Time of Window Midpoint
10 min
30 min
60 min
90 minTime window
Dow
nloa
ded
by N
ASA
AM
ES
RE
SEA
RC
H C
EN
TE
R o
n A
ugus
t 14,
201
3 | h
ttp://
arc.
aiaa
.org
| D
OI:
10.
2514
/6.2
013-
4248
This material is declared a work of the U.S. Government and is not subject to copyright protection in the United States.

American Institute of Aeronautics and Astronautics
9
Figure 9. Distance penalties for corridors with 60-min time window and various azimuths
The key design parameters of a space transition corridor are: length, width, azimuth, time window duration, and window midpoint time. In this work, analyzing launch operations from Cape Canaveral, the corridor dimensions were chosen to be (200 x 30) nmi based on the local air traffic routing structure and representative cross-track debris dispersion from a rocket explosion. The choice of the other three parameters depends on the space mission characteristics and the maximum acceptable distance penalty on air traffic affected by the corridor airspace reservation.
Figure 10-left shows contours of constant distance penalty in the temporal design space (window duration, and window midpoint time) of a corridor with 90-deg azimuth. There are three contours corresponding to distance penalty values of 250, 500, and 750 nmi; the area under each curve defines a design space corresponding to its distance penalty. It can be seen that larger distance penalties provide a larger temporal design space, as expected. The value of the maximum allowable distance penalty would be set by the air traffic service provider (ATSP), with the goal of providing equitable/balanced NAS access to commercial operators of both aircraft and spacecraft.
Consider a hypothetical situation where the ATSP has decided that the total distance penalty on air traffic should not exceed 250 nmi, which corresponds to ~30 min total delay at typical en route speeds. For a window midpoint of 9 am, large window durations of up to 60 min are available, while for a window midpoint of 4 pm only small window durations of up to 15 min are available. For a window midpoint of 7 pm, even a 10-min window duration is not possible. If a rendezvous-type mission required a 15-min window centered at 7 pm, the ATSP would have to accept a distance penalty exceeding the target threshold (250 nmi in this example). On the other hand an orbital mission with a flexible launch time could be offered a slightly earlier/later window, which would allow them to accomplish their launch objectives without exceeding the 250 nmi target threshold.
Now consider a different situation where the ATSP has decided that the total distance penalty on air traffic should not exceed 500 nmi, which corresponds to ~60 min total delay at typical en route speeds. A suborbital mission requests a window duration of 90 min, and its launch time is flexible as is typically the case for suborbital flights. It can be seen from Fig. 10-left that, for a 500 nmi penalty, 90-min window durations are available only before 8 am and after 8 pm for a corridor with an azimuth of 90 deg. However, suborbital missions have flexibility in their trajectory azimuth. Figure 10-right shows contours for a distance penalty of 500 nmi for corridor azimuths of 90 and 49 deg. It can be seen that for a corridor azimuth of 49 deg, window durations of 90 min are available over a much larger range of window midpoint times (e.g., 11 am or 5 pm), providing more options for the spacecraft operator.
0
200
400
600
800
1000
1200
1400
06:00 09:00 12:00 15:00 18:00 21:00 00:00
Net
Add
ition
al D
ista
nce
Flow
n (n
mi)
Local Time of Window Midpoint
49 deg
63 deg
77 deg
90 degCorridor Azimuth
Dow
nloa
ded
by N
ASA
AM
ES
RE
SEA
RC
H C
EN
TE
R o
n A
ugus
t 14,
201
3 | h
ttp://
arc.
aiaa
.org
| D
OI:
10.
2514
/6.2
013-
4248
This material is declared a work of the U.S. Government and is not subject to copyright protection in the United States.

American Institute of Aeronautics and Astronautics
10
Figure 10. Distance penalty contours in corridor temporal design space
Distance penalty contours provide insight into the interactions between the trajectories of air and space traffic operating in a local region of the NAS. A tool utilizing these contours could be used by spacecraft mission planners to request corridor reservations and could also be used by the ATSP to evaluate and grant/modify the requested corridors. The goal of this interactive process between the spacecraft operator and the ATSP is to determine the spatial and temporal parameters of corridors that meet space mission requirements without exceeding appropriate thresholds for re-routing/delay costs for aircraft whose nominal flight plans intersect these corridors.
Conclusions A parametric study, using air traffic re-routing distance as a performance metric, was conducted to examine air
and space traffic interaction for launch operations from Cape Canaveral. Space transition corridors with various spatial and temporal parameters were modeled in this study, and air traffic was re-routed around these corridors in a simulation environment. The magnitude of the distance penalty generally tracked the volume of local air traffic over the course of the day; e.g., the disruption to air traffic was significantly lower in the early morning and late evening hours. As expected, the distance penalty increased for larger window durations according to a near-linear trend. For any given window duration, the distance penalty varied with the corridor azimuth according to the relationship between the time/space definition of the corridor and the local air traffic routing structure. It was found that distance penalty contours provide a basis for conducting tradeoffs within a corridor’s temporal design space (window duration vs. window midpoint time). A tool based on these contours could be useful for launch and reentry planning to attenuate re-routing/delay costs for aircraft flying in the vicinity of spaceports.
References 1. Concept of Operations for the Next Generation Air Transportation System version 3.1, Joint Planning and Development
Office, Washington, D.C., April 2010. 2. Murray, D.P. and VanSuetendael, R., “A Tool for Integrating Commercial Space Operations Into The National Airspace
System,” Paper No. 2006-6378, AIAA Atmospheric Flight Mechanics Conference, Aug 2006. 3. Murray, D.P. and Ellis, R.E., “Air Traffic Considerations for Future Spaceports,” International Association for the
Advancement of Space Safety (IAASS) Conference, 2007. 4. Murray, D.P., “Space and Air Traffic Management of Operational Space Vehicles,” Paper No. 2008-6890, AIAA
Atmospheric Flight Mechanics Conference, Aug 2008. 5. VanSuetendael, R., Hayes, A., and Birr, R., “A Common Communications, Navigation & Surveillance Infrastructure for
Accommodating Space Vehicles in the Next Generation Air Transportation System,” Paper No. 2008-6893, AIAA Atmospheric Flight Mechanics Conference, Aug 2008.
Corridor azimuth= 90 deg
10
20
30
40
50
60
70
80
90
06:00 09:00 12:00 15:00 18:00 21:00
Win
dow
Dur
atio
n (m
in)
Local Time of Window Midpoint
Corridor azimuth = 90 deg
250 nmi
500 nmi
750 nmi
10
20
30
40
50
60
70
80
90
06:00 09:00 12:00 15:00 18:00 21:00
Win
dow
Dur
atio
n (m
in)
Local Time of Window Midpoint
Corridor azimuth= 49 deg
Corridor azimuth= 90 deg
Total distance penalty = 500 nmi
Dow
nloa
ded
by N
ASA
AM
ES
RE
SEA
RC
H C
EN
TE
R o
n A
ugus
t 14,
201
3 | h
ttp://
arc.
aiaa
.org
| D
OI:
10.
2514
/6.2
013-
4248
This material is declared a work of the U.S. Government and is not subject to copyright protection in the United States.

American Institute of Aeronautics and Astronautics
11
6. Murray, D.P. and Livack, G.S., “Graphical Cockpit-Based Depictions of Space Vehicle Operations Based Upon Use of Aeronautical Information Data Link Services,” International Association for the Advancement of Space Safety (IAASS) Conference, 2008.
7. Murray, D.P. and Mitchell, M., “Lessons Learned in Operational Space and Air Traffic Management,” Paper No. 2010-1349, AIAA Aerospace Science Meeting, Jan 2010.
8. Tardy, J.M. and Kluever, C.A., “Estimation and Prediction of Orbital Debris Reentry Trajectories,” Journal of Spacecraft and Rockets, Vol. 39, No. 6, Nov–Dec 2002, pp. 845–851.
9. VanSuetendael, R. and Rekab, K., “Evaluating a Complex Debris Dispersion Model Using Experimental Techniques,” Journal of Aerospace Computing, Information, and Communication, Vol. 1, Feb 2004, pp. 100–107.
10. Carbon, S.L. and Larson, E.W.F., “Modeling of Risk to Aircraft from Space Vehicle Debris,” Paper No. 2005-6506, AIAA Atmospheric Flight Mechanics Conference, Aug 2005.
11. Gowan, J.W., “Ascent Trajectory Simulation for the Space Shuttle Launch Area Risk Assessment,” Paper No. 2005-6505, AIAA Atmospheric Flight Mechanics Conference, Aug 2005.
12. Beaty, J.R, Starr, B.R., Cross, R., Gowan, J.W., Lo, Y., and Thompson, B.G., “Development of Launch Area Risk Assessment Input Data for Ares I-X,” Paper No. 2008-7119, AIAA Atmospheric Flight Mechanics Conference, Aug 2008.
13. Larson, E.W.F., Carbon, S.L., and Murray, D., “Automated Calculation of Aircraft Hazard Areas from Space Vehicle Accidents: Application to Shuttle,” Paper No. 2008-6889, AIAA Atmospheric Flight Mechanics Conference, Aug 2008.
14. Millard, S., “Risk Considerations for the Launch of the SpaceX Falcon 1,” Paper No. 2008-7121, AIAA Atmospheric Flight Mechanics Conference, Aug 2008.
15. Gonzales, E.A.Z. and Murray, D.P., “FAA’s Approach to Ground and NAS Separation Distances for Commercial Rocket Launches,” Paper No. 2010-1540, AIAA Aerospace Science Meeting, Jan 2010.
16. Wilde, P.D. and Draper, C., “Aircraft Protection Standards and Implementation Guidelines for Range Safety,” Paper No. 2010-1542, AIAA Aerospace Science Meeting, Jan 2010.
17. Zapata, E. and Murray, D., “Separation Distances for Rocket Launch Operations,” Paper No. 2008-7124, AIAA Atmospheric Flight Mechanics Conference, Aug 2008.
18. Beaty, J.R, Starr, B.R., and Gowan, J.W., “Ares-I-X Vehicle Preliminary Range Safety Malfunction Turn Analysis,” Paper No. 2008-191, AIAA Aerospace Science Meeting, Jan 2008.
19. Bilimoria, K.D., Sridhar, B., Chatterji, G., Sheth, K.S., and Grabbe, S., “FACET: Future ATM Concepts Evaluation Tool,” Air Traffic Control Quarterly, Vol. 9, No. 1, 2001, pp. 1–20.
Dow
nloa
ded
by N
ASA
AM
ES
RE
SEA
RC
H C
EN
TE
R o
n A
ugus
t 14,
201
3 | h
ttp://
arc.
aiaa
.org
| D
OI:
10.
2514
/6.2
013-
4248
This material is declared a work of the U.S. Government and is not subject to copyright protection in the United States.