Äspö hard rock laboratory – bips and radar in ka3011a01
TRANSCRIPT

Svensk Kärnbränslehantering ABSwedish Nuclear Fueland Waste Management Co
Box 250, SE-101 24 Stockholm Phone +46 8 459 84 00
P-13-18
Äspö Hard Rock Laboratory
BIPS and radar in KA3011A01 and KA3065A01
Christer Gustafsson, Malå Geoscience AB
May 2013

Tänd ett lager: P, R eller TR.
Äspö Hard Rock Laboratory
BIPS and radar in KA3011A01 and KA3065A01
Christer Gustafsson, Malå Geoscience AB
May 2013
ISSN 1651-4416
SKB P-13-18
ID 1346445
Keywords: BIPS, RAMAC, Radar, TV.
This report concerns a study which was conducted for SKB. The conclusions and viewpoints presented in the report are those of the author. SKB may draw modified conclusions, based on additional literature sources and/or expert opinions.
Data in SKB’s database can be changed for different reasons. Minor changes in SKB’s database will not necessarily result in a revised report. Data revisions may also be presented as supplements, available at www.skb.se.
A pdf version of this document can be downloaded from www.skb.se.

SKB P-13-18 3
Abstract
This report includes the data gained in geophysical logging operations performed within the exten-sion of the Äspö HRL. The logging operations presented here includes BIPS and borehole radar in the core-drilled boreholes KA3011A01and KA3065A01.
All measure ments were conducted by Malå Geoscience AB in November and December 2011.
The objective of the radar surveys is to achieve information on the rock mass around the borehole. Borehole radar is used to investigate the nature and the structure of the rock mass enclosing the boreholes.
The objective of the BIPS logging is to achieve information of the borehole including occurrence of rock types as well as determination of fracture distribution and orien tation.
This report describes the equipment used as well as the measurement procedures and data gained. For the BIPS surveys, the results are presented as images. Radar data is presented in radargrams and the identified reflectors are listed.
The borehole radar data quality from KA3011A01 and KA3065A01 is relatively good. It is mainly the conductive formation water that makes the radar wave to attenuate, which decreases the penetra-tion and reduces the ability for the radar to identify structures.
The borehole radar measurements resulted in KA3011A01 in 7 identified radar reflectors. Corresponding figures for KA3065A01 are 5.
The basic conditions of the BIPS logging for geological mapping and orientation of structures are very good for the boreholes in this project.

4 SKB P-13-18
Sammanfattning
Denna rapport omfattar geofysiska loggningar inom Äspö Utbyggnadsprojekt. Mätningarna som presenteras här omfattar borrhålsradarmätningar (RAMAC) och BIPS-loggningar. Alla mätningar är utförda av Malå Geoscience AB under november och december 2011.
Syftet med radarmätningarna är att samla information om bergmassan runt borrhålet. Borrhålsradar används till att karakterisera bergets egenskaper och strukturer i bergmassan närmast borrhålet.
Syftet med BIPS-loggningen är att skaffa information om borrhålet inkluderande förekommande bergarter och bestämning av sprickors fördelning och deras orientering.
Rapporten beskriver utrustningen som använts liksom mätprocedurer och en beskrivning och tolk-ning av data som erhållits. För BIPS-loggningen presenteras data som plottar längs med borrhålet. Radardata presenteras i radargram och en lista över tolkade radarreflektorer ges.
Borrhålsradardata från KA3011A01 och KA3065A01 var relativt bra. Det är främst det konduktiva formationsvattnet som reducerar penetrationen och därmed minskar möjligheterna att identifiera strukturer. Totalt har 7 radarreflektorer identifierats i KA3011A01. Motsvarande siffror för KA3065A011 är 5.
BIPS-bilderna visar att förutsättningarna för geologisk kartering och sprickorientering är väldigt goda för de två borrhålen.
SKB P-13-18 5
Contents
1 Introduction 7
2 Objective and scope 9
3 Equipment 113.1 Radar measurements RAMAC 113.2 TV-Camera, BIPS 11
4 Execution 134.1 General 13
4.1.1 RAMAC Radar 134.1.2 BIPS 144.1.3 Length measurements 14
4.2 Analyses and Interpretation 154.2.1 Radar 154.2.2 BIPS 17
4.3 Nonconformities 17
5 Results 195.1 RAMAC logging 195.2 BIPS logging 22
References 23
Appendix 1 Radar logging in KA3011A01, 6.25 to 92.7 m, dipole antenna 20 MHz 25
Appendix 2 Radar logging in KA3065A01, 6.25 to 117.5 m, dipole antenna 20 MHz 27
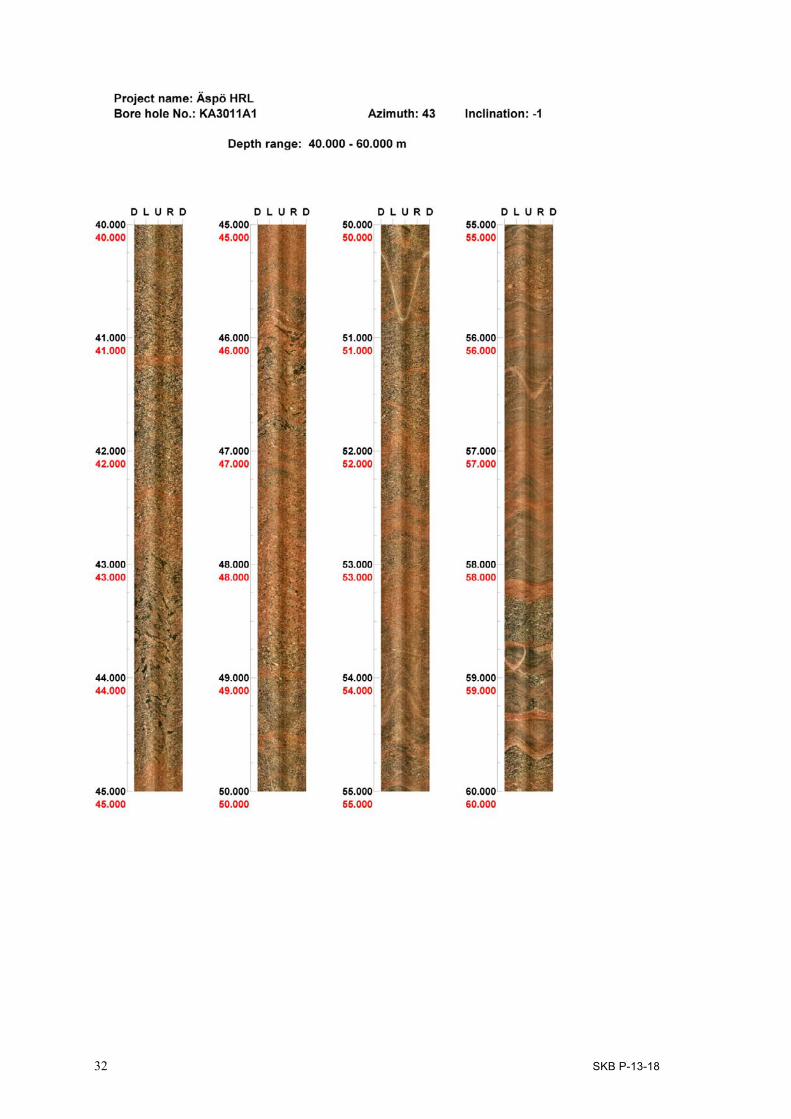
Appendix 3 BIPS logging in KA3011A01, 2.0 to 99.9 m 29
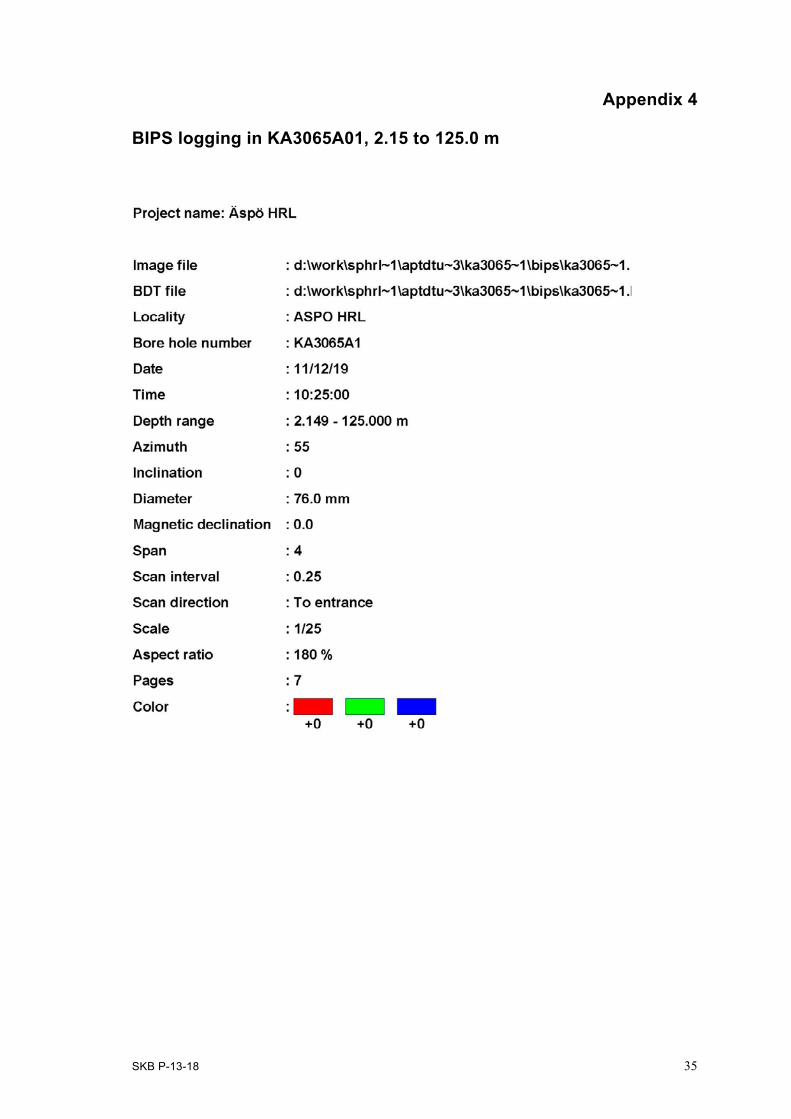
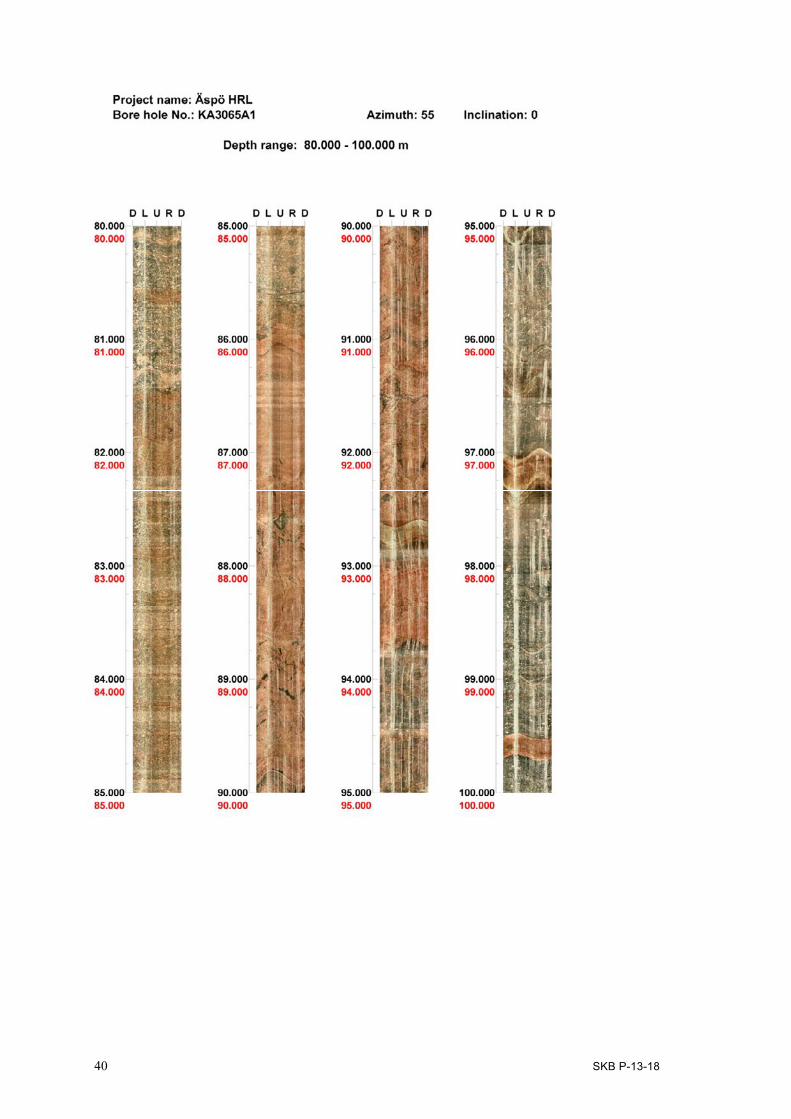
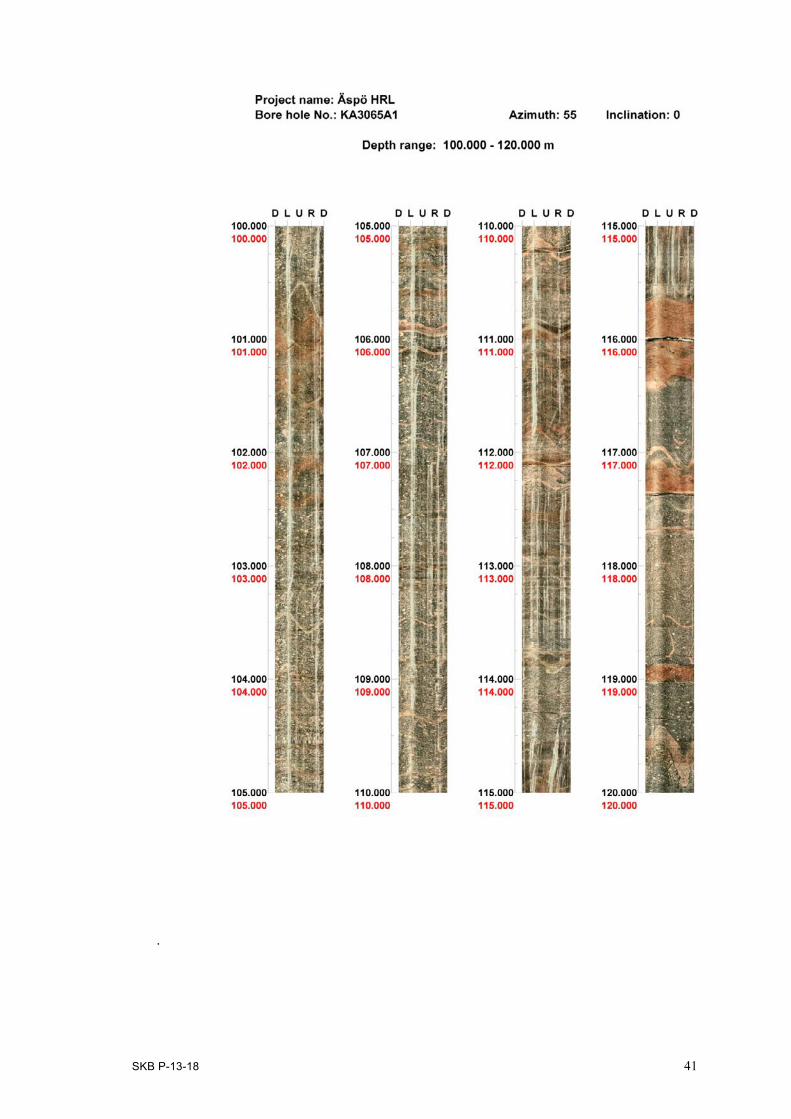
Appendix 4 BIPS logging in KA3065A01, 2.15 to 125.0 m 35

SKB P-13-18 7
1 Introduction
This report presents the data gained in geophysical logging operations, which is one of the activities performed within the extension of the Äspö HRL. The logging operations presented here includes borehole radar (RAMAC) and BIPS.
The work was carried out in accordance with activity plan AP TD TUDP002-11-082 for borehole KA3011A01 and activity plan AP TD TUDP002-11-094 for borehole KA3065A01. In Table 1-1 the controlling documents for performing this activity are listed. Both the activity plan and method descriptions are SKB’s internal controlling documents.
This report includes measurements in the boreholes listed in Table 1-2.
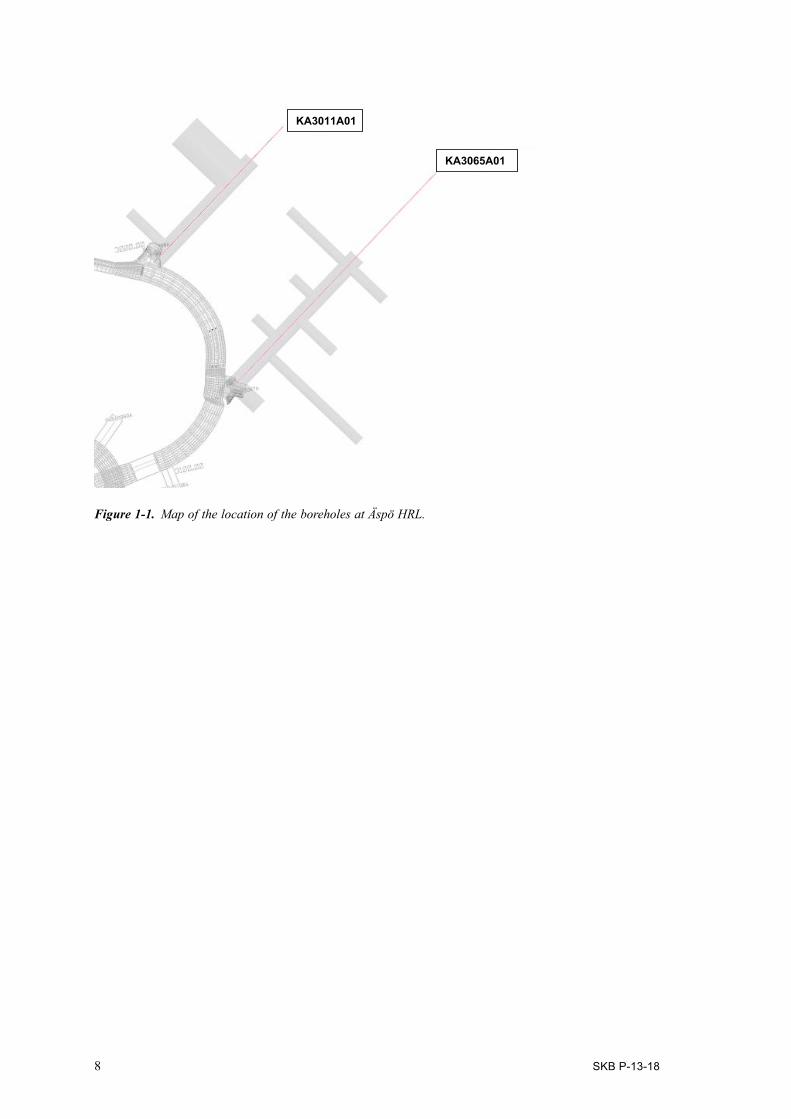
All measurements were conducted by Malå Geoscience AB in-between November 22 and December 20 2011. The investigation site and location of the boreholes are shown in Figure 1-1.
The used investigation techniques comprised:
• Boreholeradarmeasurements(MalåGeoscienceAB:sRAMACsystem)withdipoleanddirec-tional radar antennas.
• BoreholeTVloggingwiththeso-calledBIP-system(BoreholeImageProcessingSystem),whichis a high resolution, side viewing, colour borehole TV system.
The delivered raw and processed data have been inserted in the database of SKB (Sicada) and data are traceable by the activity plan number.
Table 1-1. Controlling documents for the performance of the activity (SKB’s internal controlling documents).
Activity plan Number Version
Äspö utbyggnad, DP1-Karakterisering BIPS och radar i KA3011A01 AP TD TUDP002-11-082 1.0Äspö utbyggnad, DP1-Karakterisering BIPS och radar i KA3065A01 AP TD TUDP002-11-094 1.0
Method descriptions Number VersionMetodbeskrivning för TV-loggning med BIPS SKB MD 222.006 2.0Metodbeskrivning för borrhålsradarMetodinstruktion för rengöring av borrhålsutrustning och viss markbaserad utrustning
SKB MD 252.020SKB MD 600.004
4.01.0
Table 1-2. Technical data for the boreholes and performed surveys.
Performed surveys KA3011A01 KA3065A01
BIPS X XRadar 20MHz dipol X XRadar directional X X
Borehole parameterInclination at TOC –1.18° –0.56°Bearing at TOC, RT90 2,5 gon V 43.0° 43.3°Bearing at TOC, Äspö 96 54.97° 55.35°Length (m) 100.15 125.25Casing (m) 2.17 2.29Borehole diameter (mm) 75.8 75.8
8 SKB P-13-18
Figure 1-1. Map of the location of the boreholes at Äspö HRL.
KA3065A01
KA3011A01
SKB P-13-18 9
2 Objective and scope
The objective of the radar and BIPS surveys is to achieve information on the borehole conditions (borehole wall) as well as on the rock mass around the borehole. Borehole radar is engaged to investigate the nature and the structure of the rock mass enclosing the boreholes, and borehole TV for geological surveying of the borehole including determination of rock types as well as fracture distribution and orientation.
This report describes the equipment used for the radar and BIPS surveys as well as the measurement procedures and data gained. For the BIPS survey, the result is presented as images. Radar data is presented in radargrams and the identified reflectors are listed.
SKB P-13-18 11
3 Equipment
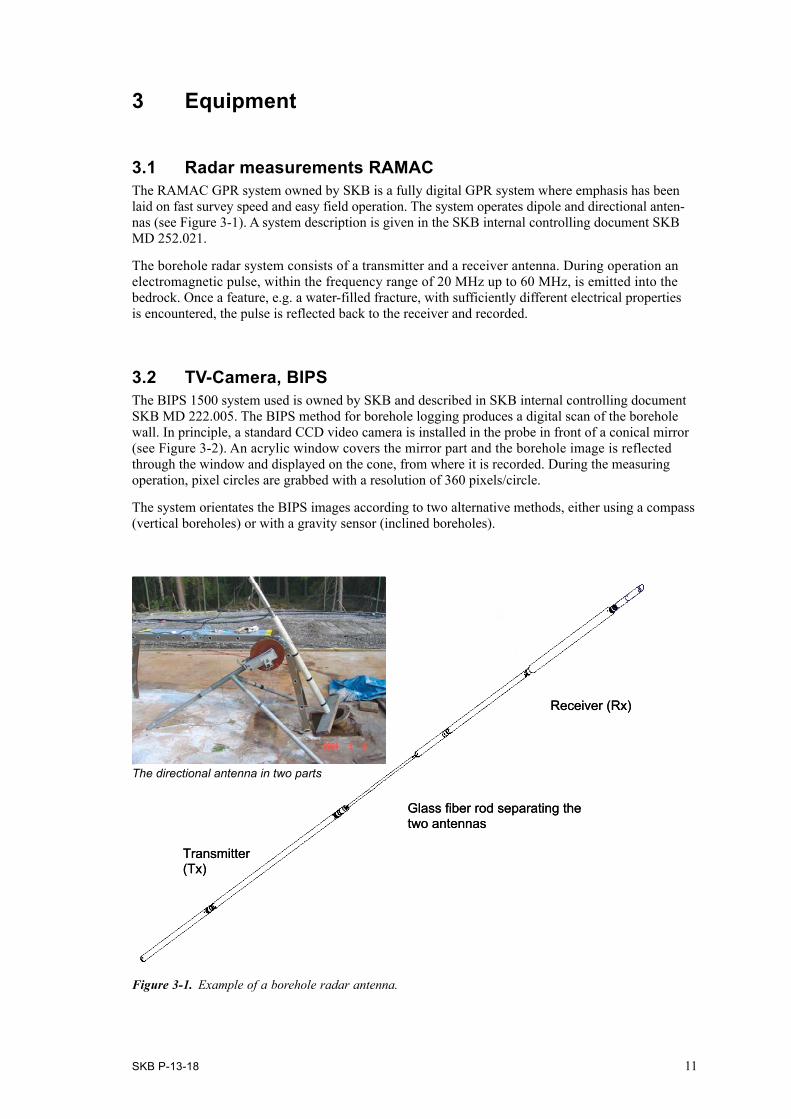
3.1 Radar measurements RAMACThe RAMAC GPR system owned by SKB is a fully digital GPR system where emphasis has been laid on fast survey speed and easy field operation. The system operates dipole and directional anten-nas (see Figure 3-1). A system description is given in the SKB internal controlling document SKB MD 252.021.
The borehole radar system consists of a transmitter and a receiver antenna. During operation an electromagnetic pulse, within the frequency range of 20 MHz up to 60 MHz, is emitted into the bedrock. Once a feature, e.g. a water-filled fracture, with sufficiently different electrical properties is encountered, the pulse is reflected back to the receiver and recorded.
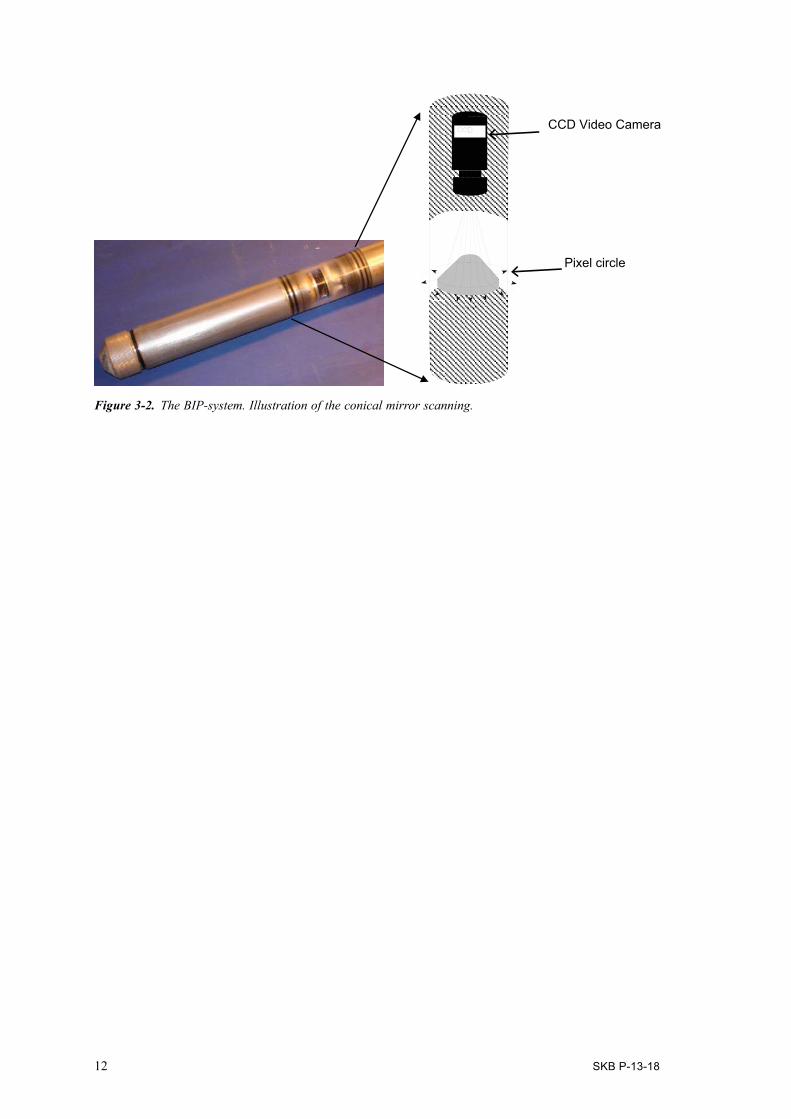
3.2 TV-Camera, BIPSThe BIPS 1500 system used is owned by SKB and described in SKB internal controlling document SKB MD 222.005. The BIPS method for borehole logging produces a digital scan of the borehole wall. In principle, a standard CCD video camera is installed in the probe in front of a conical mirror (see Figure 3-2). An acrylic window covers the mirror part and the borehole image is reflected through the window and displayed on the cone, from where it is recorded. During the measuring operation, pixel circles are grabbed with a resolution of 360 pixels/circle.
The system orientates the BIPS images according to two alternative methods, either using a compass (vertical boreholes) or with a gravity sensor (inclined boreholes).
Figure 3-1. Example of a borehole radar antenna.
Receiver (Rx)
Transmitter (Tx)
Glass fiber rod separating the two antennas
Receiver (Rx)
Transmitter (Tx)
Glass fiber rod separating the two antennas
The directional antenna in two parts
12 SKB P-13-18
Figure 3-2. The BIP-system. Illustration of the conical mirror scanning.
CCD Video Camera
Pixel circle
SKB P-13-18 13
4 Execution
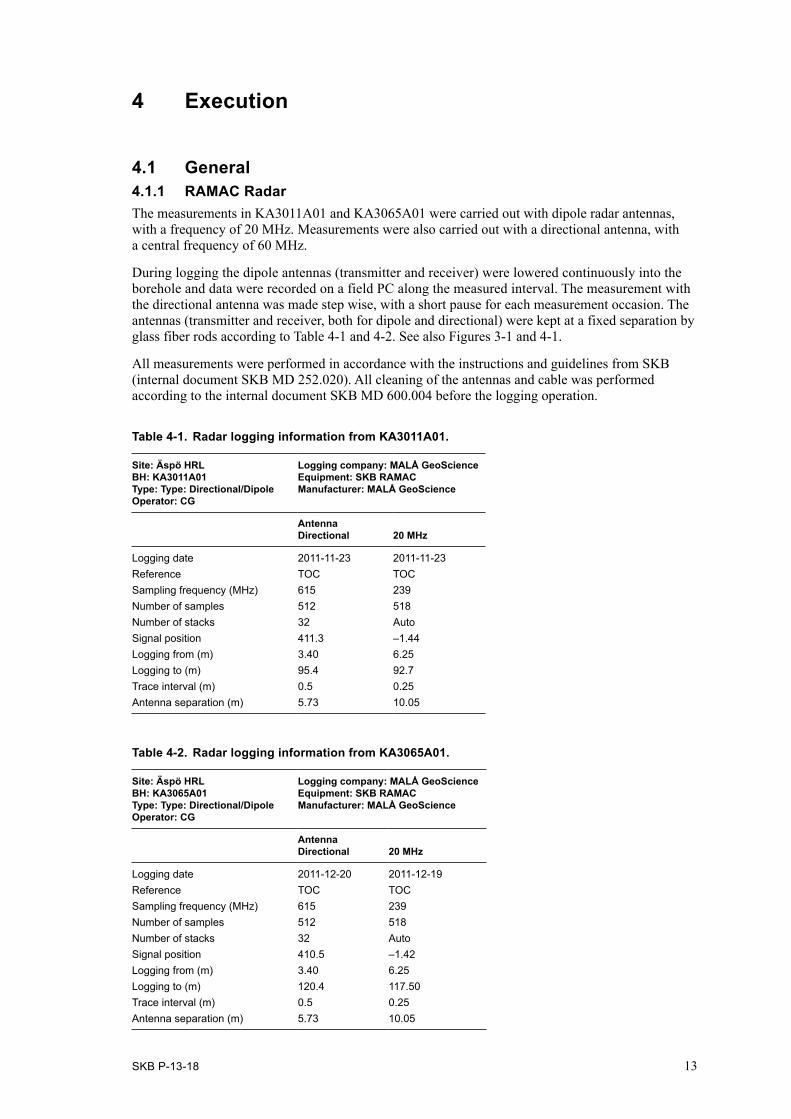
4.1 General4.1.1 RAMAC RadarThe measurements in KA3011A01 and KA3065A01 were carried out with dipole radar antennas, with a frequency of 20 MHz. Measurements were also carried out with a directional antenna, with a central frequency of 60 MHz.
During logging the dipole antennas (transmitter and receiver) were lowered continuously into the borehole and data were recorded on a field PC along the measured interval. The measurement with the directional antenna was made step wise, with a short pause for each measurement occasion. The antennas (transmitter and receiver, both for dipole and directional) were kept at a fixed separation by glass fiber rods according to Table 4-1 and 4-2. See also Figures 3-1 and 4-1.
All measurements were performed in accordance with the instructions and guidelines from SKB (internal document SKB MD 252.020). All cleaning of the antennas and cable was performed according to the internal document SKB MD 600.004 before the logging operation.
Table 4-1. Radar logging information from KA3011A01.
Site: Äspö HRLBH: KA3011A01Type: Type: Directional/DipoleOperator: CG
Logging company: MALÅ GeoScience Equipment: SKB RAMAC Manufacturer: MALÅ GeoScience
AntennaDirectional 20 MHz
Logging date 2011-11-23 2011-11-23Reference TOC TOCSampling frequency (MHz) 615 239Number of samples 512 518Number of stacks 32 AutoSignal position 411.3 –1.44Logging from (m) 3.40 6.25Logging to (m) 95.4 92.7Trace interval (m) 0.5 0.25Antenna separation (m) 5.73 10.05
Table 4-2. Radar logging information from KA3065A01.
Site: Äspö HRLBH: KA3065A01Type: Type: Directional/DipoleOperator: CG
Logging company: MALÅ GeoScience Equipment: SKB RAMAC Manufacturer: MALÅ GeoScience
AntennaDirectional 20 MHz
Logging date 2011-12-20 2011-12-19Reference TOC TOCSampling frequency (MHz) 615 239Number of samples 512 518Number of stacks 32 AutoSignal position 410.5 –1.42Logging from (m) 3.40 6.25Logging to (m) 120.4 117.50Trace interval (m) 0.5 0.25Antenna separation (m) 5.73 10.05

14 SKB P-13-18
The functionality of the directional antenna was tested before start of the survey in KA3011A01. This was performed by measurements in the air, where the receiver antenna and the transmitter antenna are placed apart. While transmitting and measuring the receiver antenna is turned around and by that giving the direction from the receiver antenna to the transmitter antenna. The difference in direction is measured by compass and the result difference achieved from the directional antenna was approximately 5 degrees. This can be considered to be good due to the disturbed environment, with metallic objects etc at the test site.
For more information on system settings used in for the surveyed boreholes see Table 4-1 to 4-3.
4.1.2 BIPSAll measurements were performed in accordance with the instructions and guidelines from SKB (internal document SKB MD 222.006). All cleaning of the probe and cable was performed according to the internal document SKB MD 600.004 before the logging operation.
During the measurement, a pixel circle with a resolution of 360 pixels/circle was used and the digital circles were stored at every 1 mm on a MO-disc in the surface unit. The maximum speed during data collection was 1.5 m/minute.
A gravity sensor based on an air bulb in an alcohol liquid was used to measure the orientation of the images in the logged boreholes.
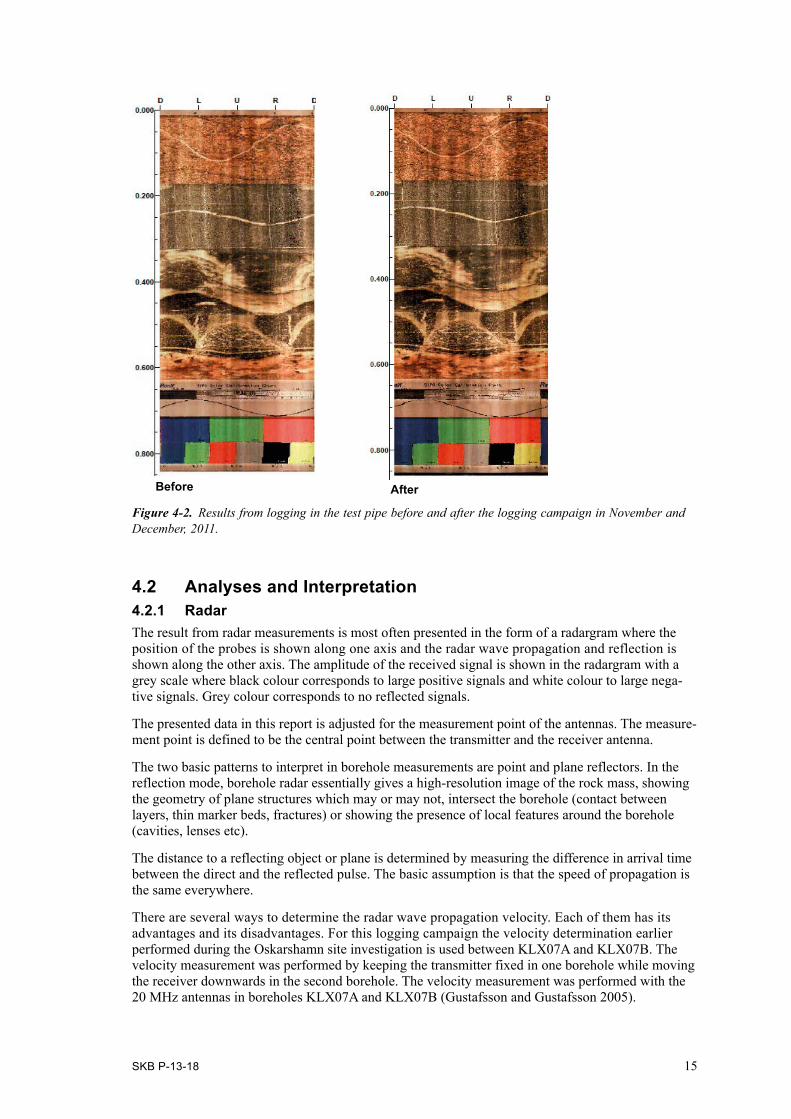
In order to control the quality of the system, calibration measurements were performed in a test pipe before logging and after logging. Figure 4-2 shows the results of the test logging performed before and after the logging campaign. The results showed no difference regarding the colours and focus of the images. Results of the test loggings were included in the delivery of the raw data.
The BIPS logging information is found in the header presented in Appendices 3–4 in this report.
4.1.3 Length measurements During logging of the RAMAC and BIPS systems the length measuring wheel on the push rig was used for length controlling of the survey. For an accurate depth control the length recording was adjusted regularly for every 50 metre by calculating the number of the 2 metre long aluminium rods.
Figure 4-1. The principle of radar borehole reflection survey and an example of result.
Time
Dep
th o
f bor
ehol
e
SKB P-13-18 15
4.2 Analyses and Interpretation4.2.1 RadarThe result from radar measurements is most often presented in the form of a radargram where the position of the probes is shown along one axis and the radar wave propagation and reflection is shown along the other axis. The amplitude of the received signal is shown in the radargram with a grey scale where black colour corresponds to large positive signals and white colour to large nega-tive signals. Grey colour corresponds to no reflected signals.
The presented data in this report is adjusted for the measurement point of the antennas. The measure-ment point is defined to be the central point between the transmitter and the receiver antenna.
The two basic patterns to interpret in borehole measurements are point and plane reflectors. In the reflection mode, borehole radar essentially gives a high-resolution image of the rock mass, showing the geometry of plane structures which may or may not, intersect the borehole (contact between layers, thin marker beds, fractures) or showing the presence of local features around the borehole (cavities, lenses etc).
The distance to a reflecting object or plane is determined by measuring the difference in arrival time between the direct and the reflected pulse. The basic assumption is that the speed of propagation is the same everywhere.
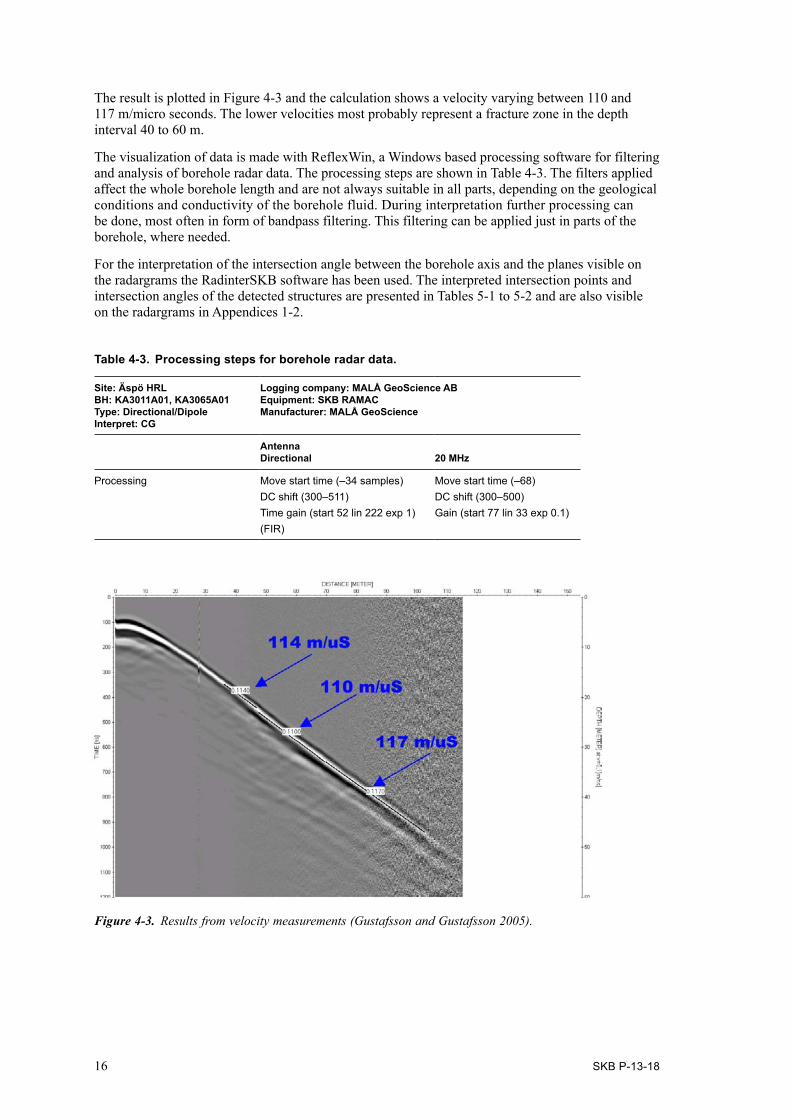
There are several ways to determine the radar wave propagation velocity. Each of them has its advantages and its disadvantages. For this logging campaign the velocity determination earlier performed during the Oskarshamn site investigation is used between KLX07A and KLX07B. The velocity measurement was performed by keeping the transmitter fixed in one borehole while moving the receiver downwards in the second borehole. The velocity measurement was performed with the 20 MHz antennas in boreholes KLX07A and KLX07B (Gustafsson and Gustafsson 2005).
Figure 4-2. Results from logging in the test pipe before and after the logging campaign in November and December, 2011.
Before
After
16 SKB P-13-18
The result is plotted in Figure 4-3 and the calculation shows a velocity varying between 110 and 117 m/micro seconds. The lower velocities most probably represent a fracture zone in the depth interval 40 to 60 m.
The visualization of data is made with ReflexWin, a Windows based processing software for filtering and analysis of borehole radar data. The processing steps are shown in Table 4-3. The filters applied affect the whole borehole length and are not always suitable in all parts, depending on the geological conditions and conductivity of the borehole fluid. During interpretation further processing can be done, most often in form of bandpass filtering. This filtering can be applied just in parts of the borehole, where needed.
For the interpretation of the intersection angle between the borehole axis and the planes visible on the radargrams the RadinterSKB software has been used. The interpreted intersection points and intersection angles of the detected structures are presented in Tables 5-1 to 5-2 and are also visible on the radargrams in Appendices 1-2.
Figure 4-3. Results from velocity measurements (Gustafsson and Gustafsson 2005).
Table 4-3. Processing steps for borehole radar data.
Site: Äspö HRL BH: KA3011A01, KA3065A01 Type: Directional/Dipole Interpret: CG
Logging company: MALÅ GeoScience AB Equipment: SKB RAMAC Manufacturer: MALÅ GeoScience
Antenna Directional 20 MHz
Processing Move start time (–34 samples) Move start time (–68) DC shift (300–511) DC shift (300–500) Time gain (start 52 lin 222 exp 1) Gain (start 77 lin 33 exp 0.1)
(FIR)
SKB P-13-18 17
4.2.2 BIPSThe visualization of data is made with BDPP, a Windows based processing software for filtering, presentation and analysis of BIPS data. As no fracture mapping of the BIPS image is performed, the raw data was delivered on a CD-ROM together with printable pictures in *.pdf format before the field crew left the investigation site.
The printed results were delivered with measured length, together with adjusted length according to the length marks visible in the BIPS image. For printing of the BIPS images the printing software BIPP from RaaX was used.
4.3 NonconformitiesNo nonconformities occurred during the logging in November and December 2011.

SKB P-13-18 19
5 Results
The results from the BIPS measurements were delivered as raw data (*.bip-files) on CD-ROM disks and MO-disks to SKB together with printable BIPS pictures in *.pdf format before the field crew left the investigation site. The information of the measurements was registered in Sicada, and the digital data on CD and MO disks stored by SKB.
The RAMAC radar data was delivered as raw data file format *.rd3 (dipole antennas) or *.rd5 (directional antenna) for with corresponding information files (file format *.rad) whereas the data processing steps and results are presented in this report. Relevant information, including the inter-pretation presented in this report, was inserted into the SKB database Sicada.
The delivered raw and processed data have been inserted in the database of SKB (Sicada) and data are traceable by the activity plan number.
5.1 RAMAC logging
The results of the interpretation of the radar measurements are presented in Tables 5-1 to 5-5. Radar data is also visualized in Appendices 1–2. It should be remembered that the images in Appendices 1–2 are only a composite picture of all events 360 degrees around the borehole, and do not reflect the orientation of the structures.
Only the larger clearly visible structures are interpreted in RadinterSKB. An overview of the bore holes is given in Figures 5-1 to 5-2 below. A number of minor structures also exist but are not interpreted as indicated in Appendices 1–2. Often a number of structures can be noticed, but most probably lying so close to each other that it is impossible to distinguish one from the other. It should also be pointed out that reflections interpreted will always get an intersection point with the borehole path, but being located further away. They may in some cases not reach the borehole.
The data quality from KA3011A01 and KA3065A01 (as seen in Appendix 1 and 2) is good. The borehole intersects with several structures but no big drop in the amplitude values for the first arrival occurs, which is an indication of a homogenous rock mass without zones carrying water. A conductive environment makes the radar wave to attenuate, which decreases the penetration. This conductive environment of course also reduces the possibility to distinguish and interpret possibly structures in the rock which otherwise could give a reflection.
Figure 5-1. Overview (20 MHz data) of the radar data for the borehole KA3011A01.
Figure 5-2. Overview (20 MHz data) of the radar data for the borehole KA3065A01.

20 SKB P-13-18
The effect of a conductive environment is also seen in the directional antenna which makes it more difficult to interpret the direction to the identified structures.
Table 5-1 to Table 5-2 summarises the interpretation of radar data from KA3011A01 and KA3065A01. In the tables the intersection length and intersection angle to the identified structures are listed.
The direction to the reflector (object) is also given for structures that were possible to determine. As seen some radar reflectors in Tables 5-1 and 5-2 are marked with ±, which indicates an uncertainty in the interpretation of direction. The direction can in these cases be ±180 degrees. The definition for direction to the reflector (object) is defined in Figure 5-3. As the borehole inclination is less than 85° the direction to object is calculated using gravity roll. The direction to object and the inter section angle are recalculated to strike and dip, also given in the tables. The plane strike is the angle between line of the plane’s cross-section with the surface and the Magnetic North direction. It counts clock-wise and can be between 0 and 359 degrees. A strike of 0 degrees implies a dip to the east while a strike of 180 degrees implies a dip to the west. The plane dip is the angle between the plane and the surface. It can vary between 0 and 90 degrees.
Table 5-1. Interpretation of radar reflectors from the dipole antenna 20 MHz and the directional antenna 60 MHz in borehole KA3011A01.
Radinter model information(Directional and dipole antennas)
Site: Äspö HRLBorehole name: KA3011A01 Nominal velocity (m/µs): 117.0
Name Intersection length
Intersection angle
RadInter direction to object (gravity roll)
Dip 1 Strike 1 Dip 2 Strike 2
1 16.25 61 105 82 1512 20.44 56 273 89 2733 62.34 66 42± 61 334 56 874 67.36 86 60± 69 345 72 925 80.25 62 87± 89 332 88 1006 87.89 56 84± 87 338 85 917 112.17 33 99± 82 185 83 243
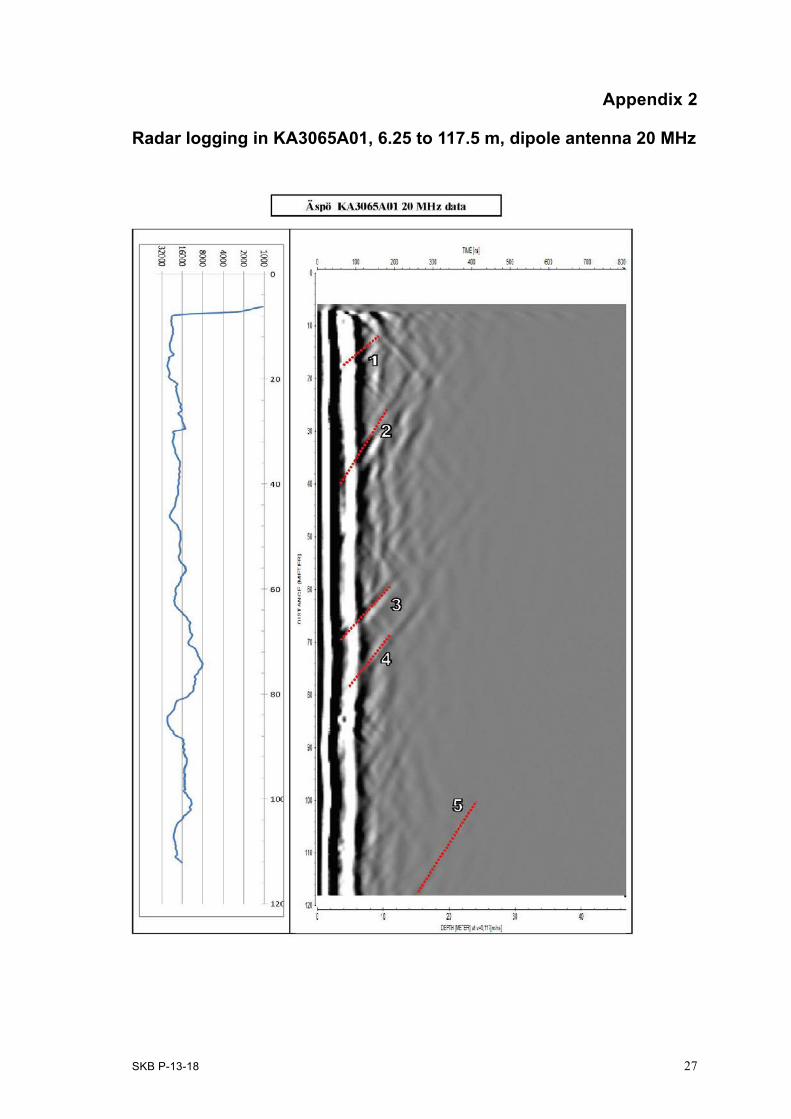
Table 5-2. Interpretation of radar reflectors from the dipole antenna 20 MHz and the directional antenna 60 MHz in borehole KA3065A01.
Radinter model information(Directional and dipole antennas)
Site: Äspö HRLBorehole name: KA3065A01 Nominal velocity (m/µs): 117.0
Name Intersection length
Intersection angle
RadInter direction to object (gravity roll)
Dip 1 Strike 1 Dip 2 Strike 2
1 25.31 75 21 77 3092 45.40 43 147 50 1573 73.64 58 228 59 834 87.54 40 231 69 965 146.02 35

SKB P-13-18 21
In Appendices 1–2, the amplitude of the first arrival is plotted against the depth, for the 20 MHz dipole antennas. The amplitude variation along the borehole indicates changes of the electrical con-ductivity of the volume of rock surrounding the borehole. A decrease in this amplitude may indicate fracture zones, clay or rock volumes with higher water content, i.e. increases in electric conductivity. Sections in the boreholes with a decrease in amplitude are shown in Table 5-3 to Table 5-4.
Table 5-3. Borehole length intervals in KA3011A01 with decreased amplitude for the 20 MHz antenna.
Length (m)
83–87
Table 5-4. Borehole length intervals in KA3065A01with decreased amplitude for the 20 MHz antenna.
Length (m)
72–76
Finally, the structures considered as the most important (clear in the radargram, identified with sev-eral antenna frequencies, stretching out far from the borehole wall etc) are listed in Table 5-5 below.
Table 5-5. Some important structures in the boreholes.
Borehole KA3011A01 KA3065A01
Structures 3 and 6 3
Figure 5-3. Definition of intersection angle, direction to object using gravity roll, dip and strike using the right hand rule as presented in Table 5-1 to 5-2.
22 SKB P-13-18
Observe that it can be very difficult to classify different structures in an objective manner, along a borehole. This is due to the fact that the water quality (the conductivity) amongst others varies along the borehole length and by that reason affects the results of the radar logging, by for instance attenuating the radar waves differently. Also the intersection angle of the identified structures affects the amplitude on the resulting radargram. Small intersection angles will most often give an increased amplitude compared to larger intersection angles, and by that a more clear structure. Another factor to consider is the long distance (10.05 m) in-between the 20 MHz transmitter (Tx) and receiver (Rx) antenna. Tiny structures intersecting the borehole with high attenuation result in a wide anomaly over a distance that is equal to the Tx and Rx distance.
5.2 BIPS loggingThe BIPS images from KA3011A01 and KA3065A01 are presented in Appendices 3–4.
In order to control the quality of the system, calibration measurements were performed in a test pipe before and after the logging. The resulting images displayed with no difference regarding the colours and focus of the images. Results of the test loggings were included in the delivery of the raw data.
To get the best possible length accuracy, the BIPS images are adjusted by using the push rods as reference.
The error in the length recording depends mainly on the tension of the cable and error of the length readings from the measuring wheel. The adjusted length is showed in red colour and the recording length have black colour in the printouts.
The BIPS images in the core drilled part of the borehole show very good quality along the borehole. Small amount of discolouring effect of the borehole walls make the geological mapping easy.
SKB P-13-18 23
References
SKB’s (Svensk Kärnbränslehantering AB) publications can be found at www.skb.se/publications.
Gustafsson J, Gustafsson C, 2005. Oskarshamn site investigation. RAMAC and BIPS logging in boreholes KLX07A, KLX07B, HLX34 and HLX35 and deviation logging in boreholes KLX07B, HLX34 and HLX35. SKB P-05-231, Svensk Kärnbränslehantering AB.

SKB P-13-18 25
Appendix 1
Radar logging in KA3011A01, 6.25 to 92.7 m, dipole antenna 20 MHz
SKB P-13-18 27
Appendix 2
Radar logging in KA3065A01, 6.25 to 117.5 m, dipole antenna 20 MHz

SKB P-13-18 29
Appendix 3
BIPS logging in KA3011A01, 2.0 to 99.9 m

30 SKB P-13-18

SKB P-13-18 31
32 SKB P-13-18

SKB P-13-18 33

34 SKB P-13-18
SKB P-13-18 35
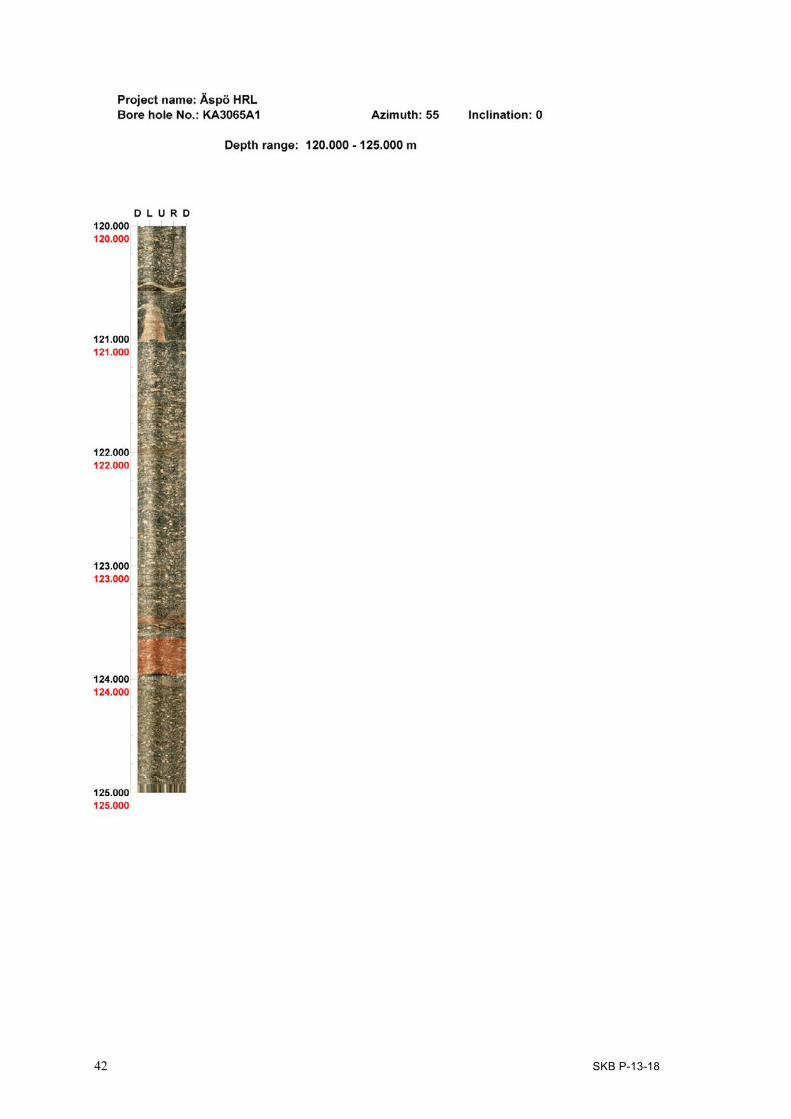
Appendix 4
BIPS logging in KA3065A01, 2.15 to 125.0 m

36 SKB P-13-18

SKB P-13-18 37

38 SKB P-13-18

SKB P-13-18 39
40 SKB P-13-18
SKB P-13-18 41
.
42 SKB P-13-18