soybean irrigation management - msu...
TRANSCRIPT
Lyndon Kelley MSU Extension/Purdue University Irrigation Management Educator [email protected] 269-467-5511 (office) or 269-535-0343 (cell) http://msue.anr.msu.edu/resources/irrigation http://www.egr.msu.edu/bae/water/
Soybean Irrigation Management
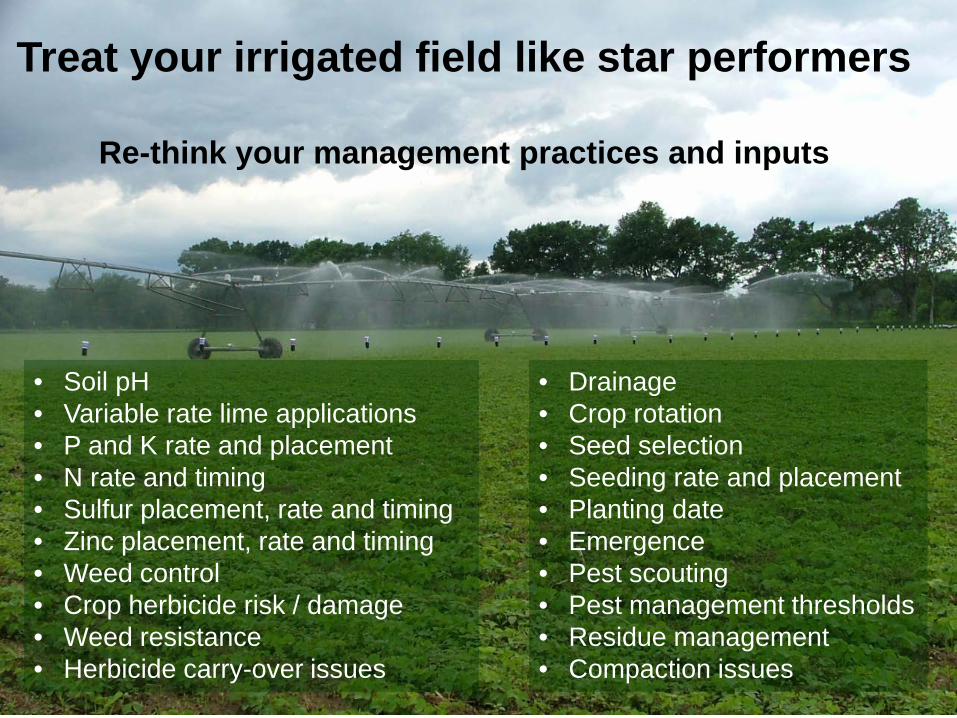
Treat your irrigated field like star performers
Re-think your management practices and inputs
• Soil pH • Variable rate lime applications • P and K rate and placement • N rate and timing • Sulfur placement, rate and timing • Zinc placement, rate and timing • Weed control • Crop herbicide risk / damage • Weed resistance • Herbicide carry-over issues
• Drainage • Crop rotation • Seed selection • Seeding rate and placement • Planting date • Emergence • Pest scouting • Pest management thresholds • Residue management • Compaction issues
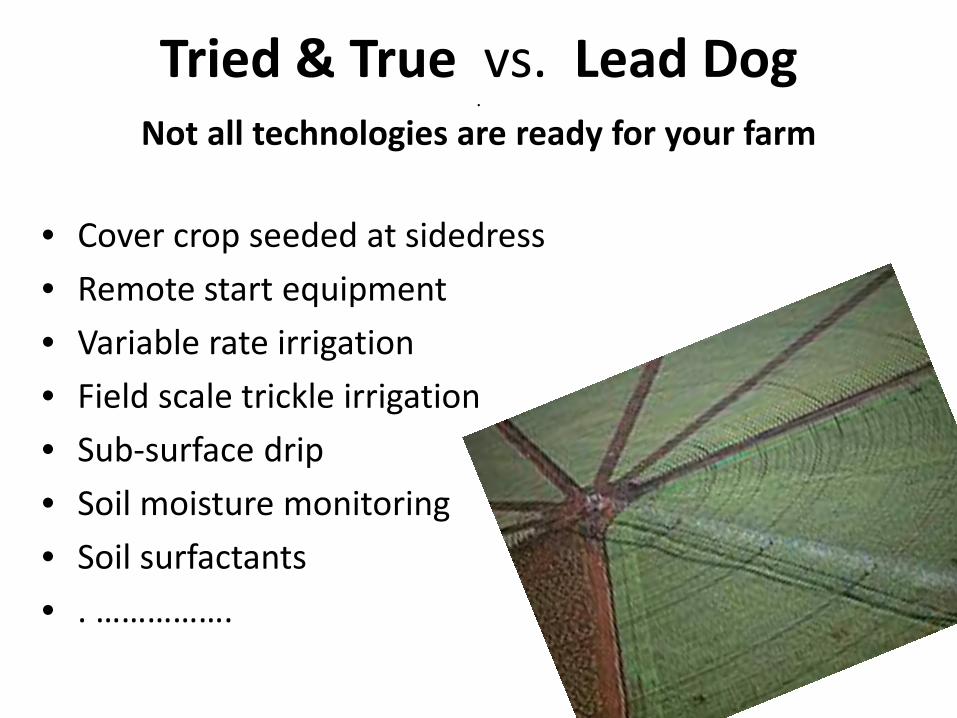
Tried & True vs. Lead Dog .
Not all technologies are ready for your farm
• Cover crop seeded at sidedress • Remote start equipment • Variable rate irrigation • Field scale trickle irrigation • Sub-surface drip • Soil moisture monitoring • Soil surfactants • . …………….
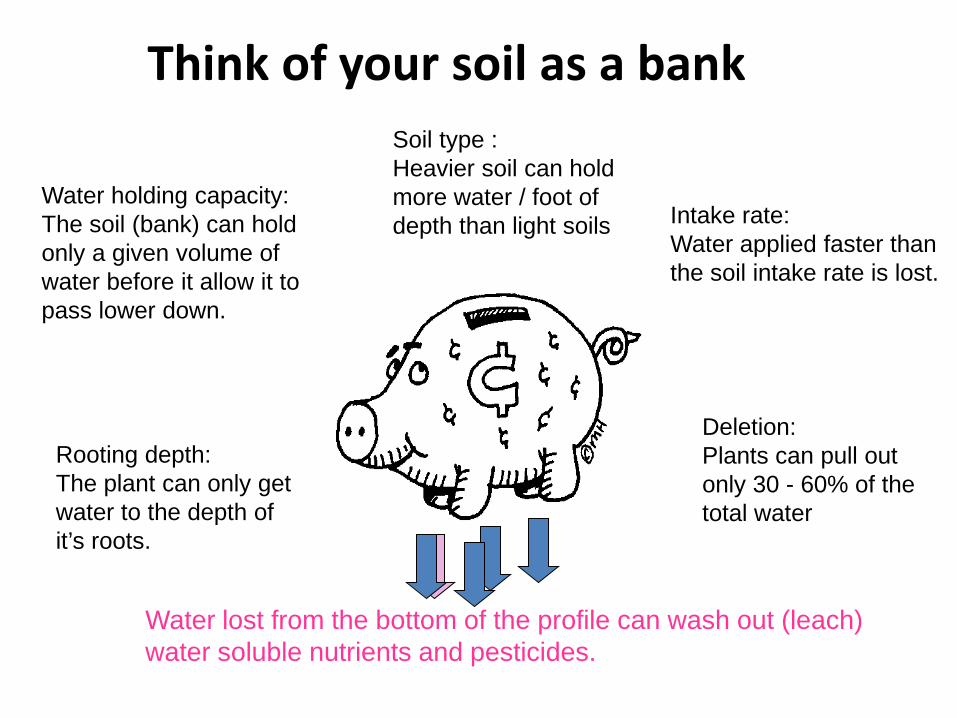
Think of your soil as a bank
Intake rate: Water applied faster than the soil intake rate is lost.
Deletion: Plants can pull out only 30 - 60% of the total water
Water holding capacity: The soil (bank) can hold only a given volume of water before it allow it to pass lower down.
Rooting depth: The plant can only get water to the depth of it’s roots.
Soil type : Heavier soil can hold more water / foot of depth than light soils
Water lost from the bottom of the profile can wash out (leach) water soluble nutrients and pesticides.
Summary of Irrigated Soybean Research in Michigan SMaRT Soybean Facts – 2/2011
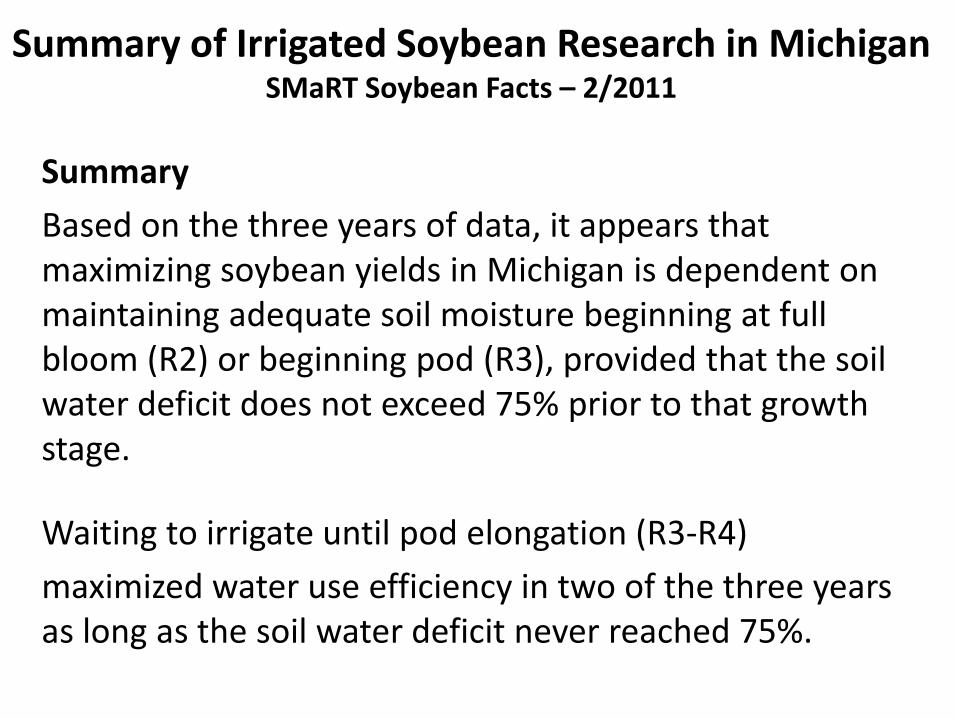
Summary Based on the three years of data, it appears that maximizing soybean yields in Michigan is dependent on maintaining adequate soil moisture beginning at full bloom (R2) or beginning pod (R3), provided that the soil water deficit does not exceed 75% prior to that growth stage.
Waiting to irrigate until pod elongation (R3-R4) maximized water use efficiency in two of the three years as long as the soil water deficit never reached 75%.
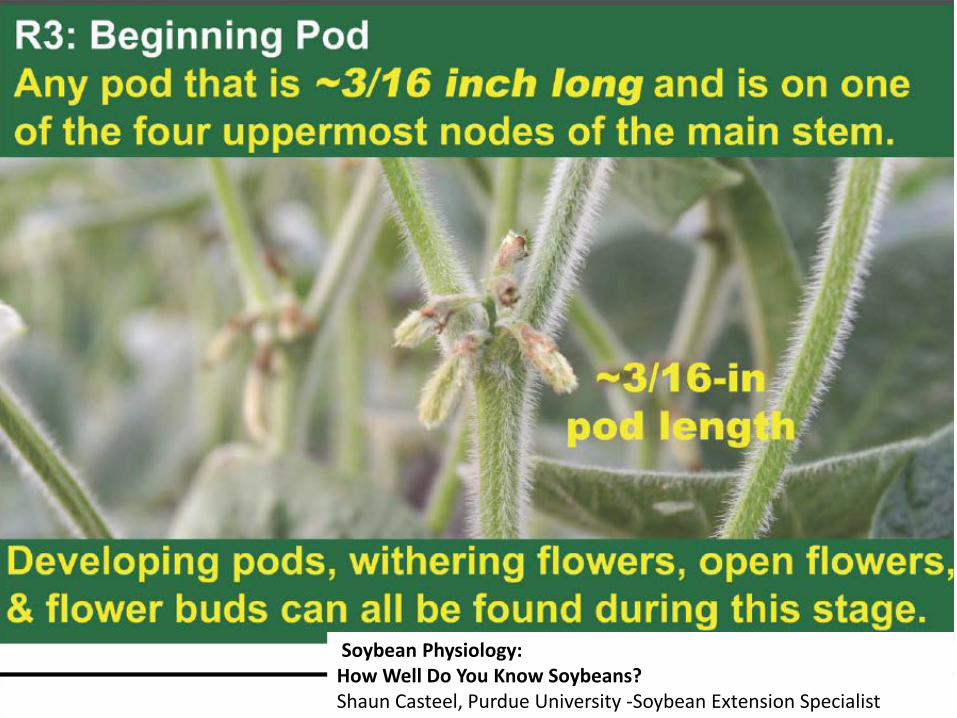
Soybean Physiology: How Well Do You Know Soybeans? Shaun Casteel, Purdue University -Soybean Extension Specialist
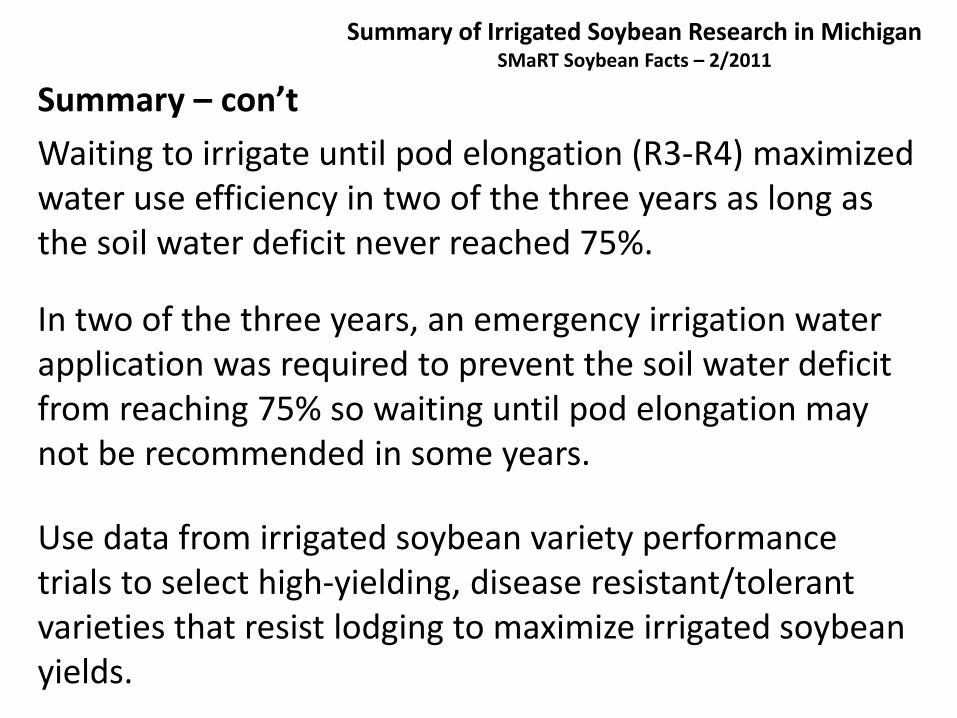
Summary – con’t Waiting to irrigate until pod elongation (R3-R4) maximized water use efficiency in two of the three years as long as the soil water deficit never reached 75%.
In two of the three years, an emergency irrigation water application was required to prevent the soil water deficit from reaching 75% so waiting until pod elongation may not be recommended in some years.
Use data from irrigated soybean variety performance trials to select high-yielding, disease resistant/tolerant varieties that resist lodging to maximize irrigated soybean yields.
Summary of Irrigated Soybean Research in Michigan SMaRT Soybean Facts – 2/2011
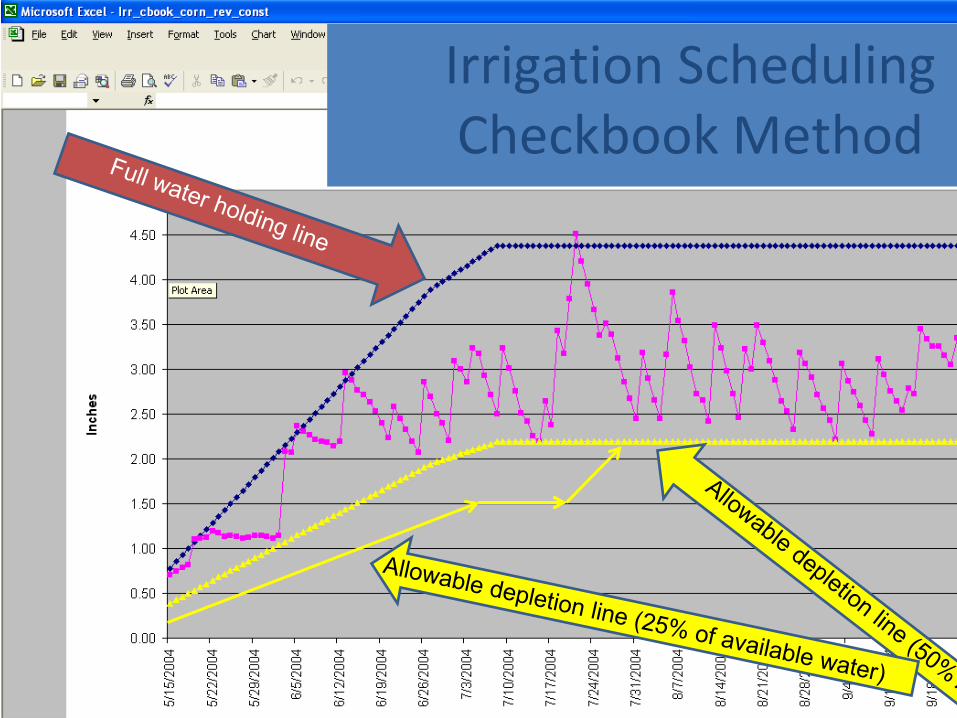
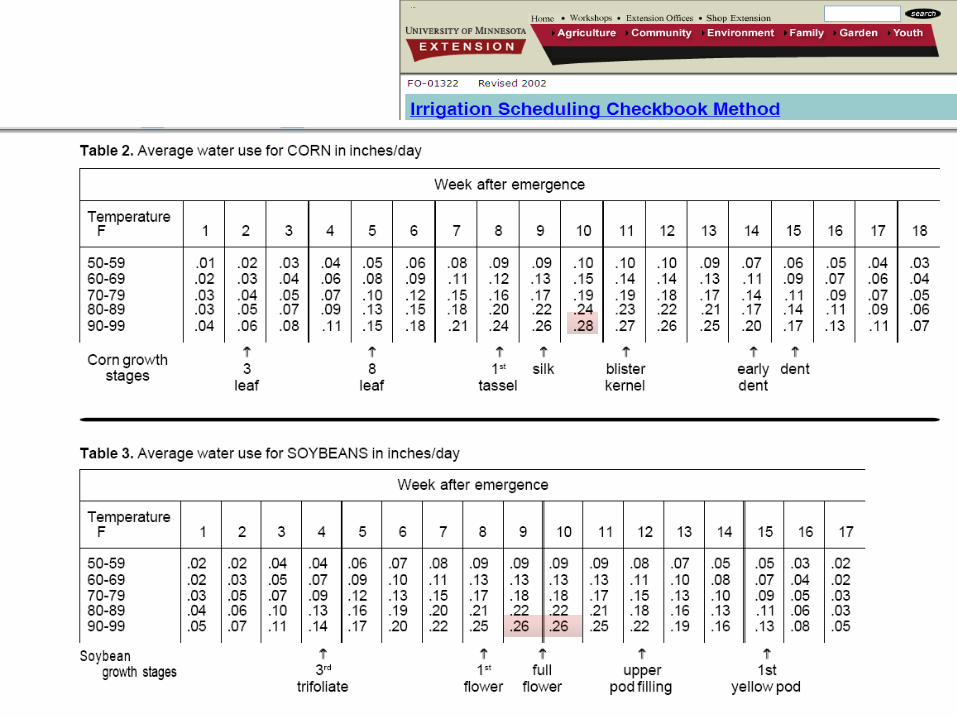
Irrigation Scheduling Checkbook Method
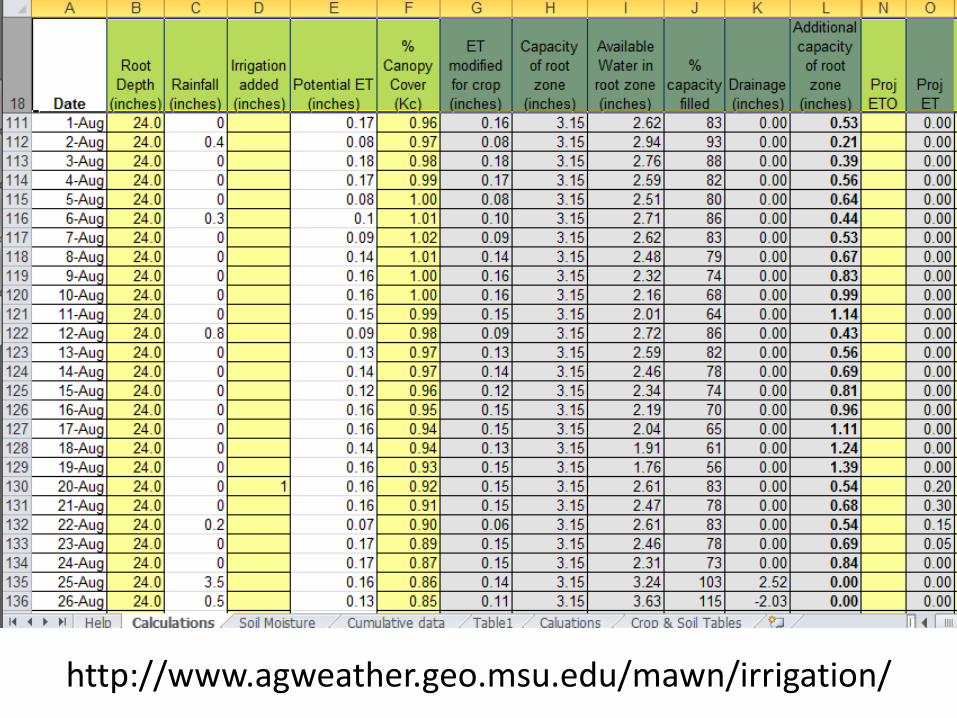
http://www.agweather.geo.msu.edu/mawn/irrigation/
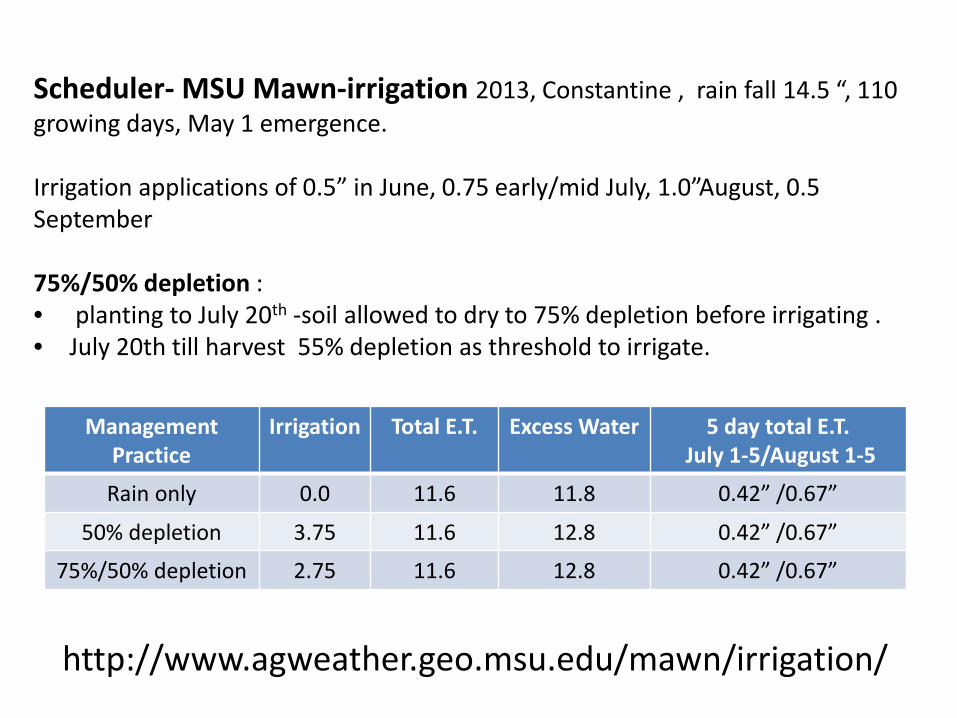
Management Practice
Irrigation Total E.T. Excess Water 5 day total E.T. July 1-5/August 1-5
Rain only 0.0 11.6 11.8 0.42” /0.67”
50% depletion 3.75 11.6 12.8 0.42” /0.67”
75%/50% depletion 2.75 11.6 12.8 0.42” /0.67”
Scheduler- MSU Mawn-irrigation 2013, Constantine , rain fall 14.5 “, 110 growing days, May 1 emergence. Irrigation applications of 0.5” in June, 0.75 early/mid July, 1.0”August, 0.5 September 75%/50% depletion : • planting to July 20th -soil allowed to dry to 75% depletion before irrigating . • July 20th till harvest 55% depletion as threshold to irrigate.
http://www.agweather.geo.msu.edu/mawn/irrigation/
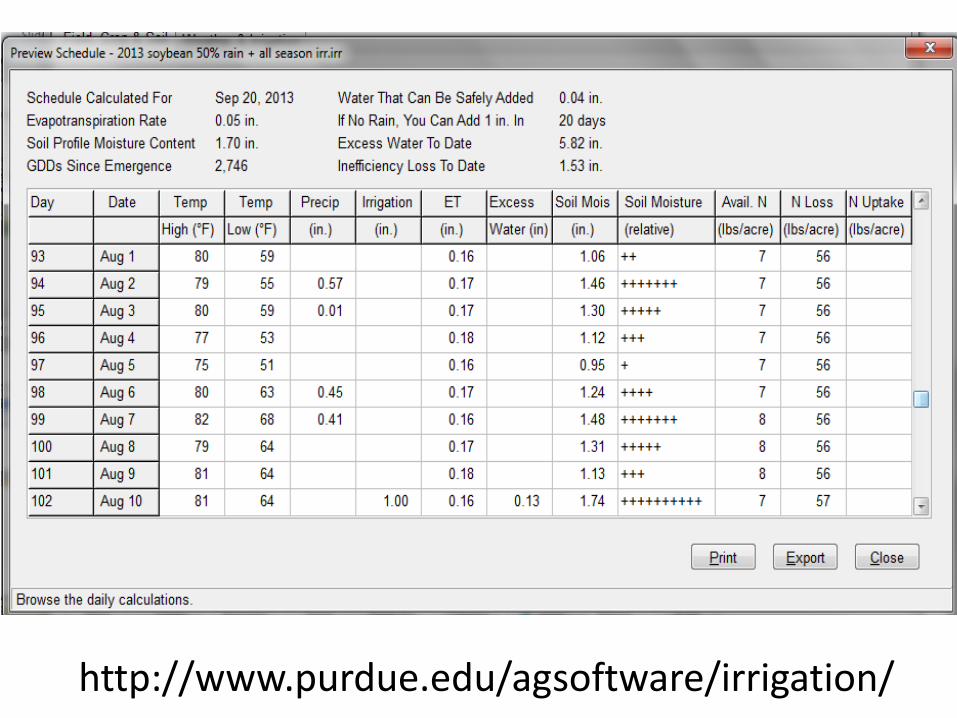
http://www.purdue.edu/agsoftware/irrigation/
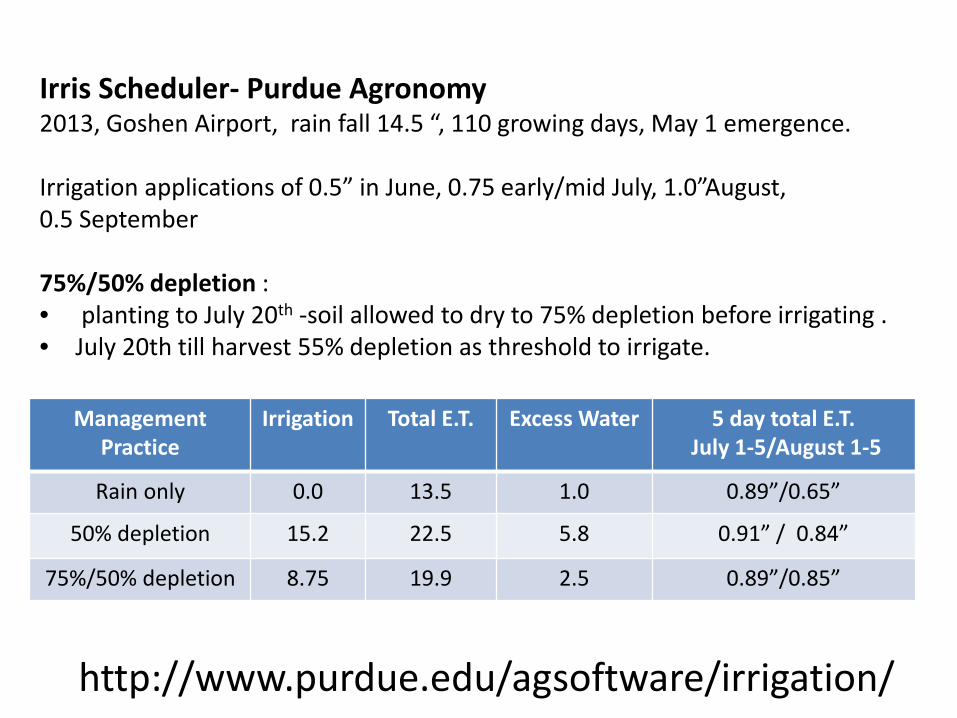
Management Practice
Irrigation Total E.T. Excess Water 5 day total E.T. July 1-5/August 1-5
Rain only 0.0 13.5 1.0 0.89”/0.65”
50% depletion 15.2 22.5 5.8 0.91” / 0.84”
75%/50% depletion 8.75 19.9 2.5 0.89”/0.85”
Irris Scheduler- Purdue Agronomy 2013, Goshen Airport, rain fall 14.5 “, 110 growing days, May 1 emergence. Irrigation applications of 0.5” in June, 0.75 early/mid July, 1.0”August, 0.5 September 75%/50% depletion : • planting to July 20th -soil allowed to dry to 75% depletion before irrigating . • July 20th till harvest 55% depletion as threshold to irrigate.
http://www.purdue.edu/agsoftware/irrigation/
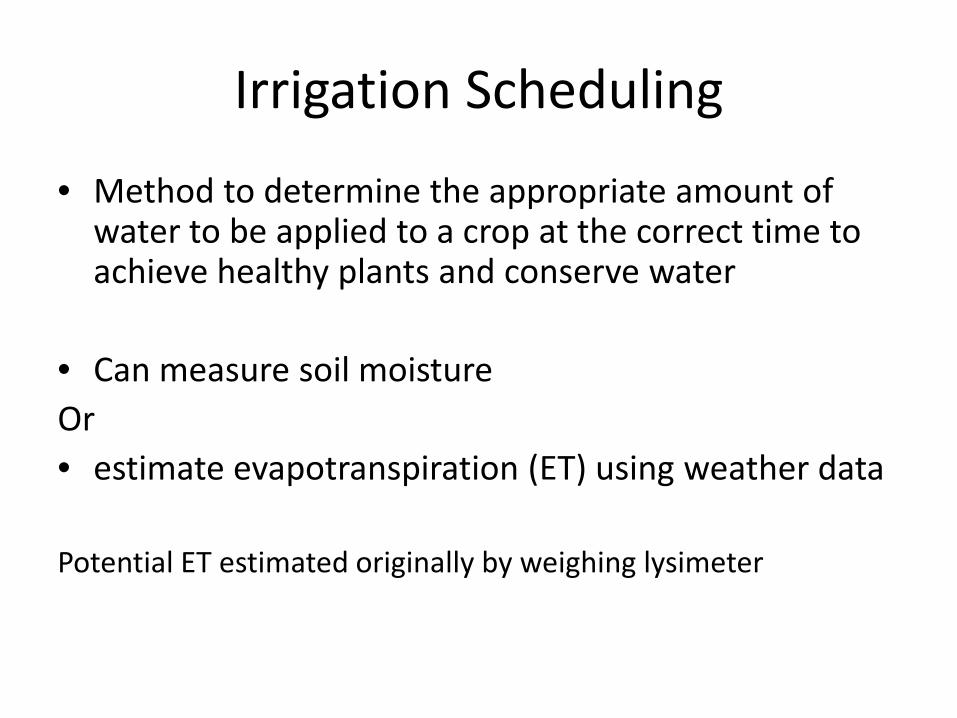
Irrigation Scheduling
• Method to determine the appropriate amount of water to be applied to a crop at the correct time to achieve healthy plants and conserve water
• Can measure soil moisture Or • estimate evapotranspiration (ET) using weather data Potential ET estimated originally by weighing lysimeter
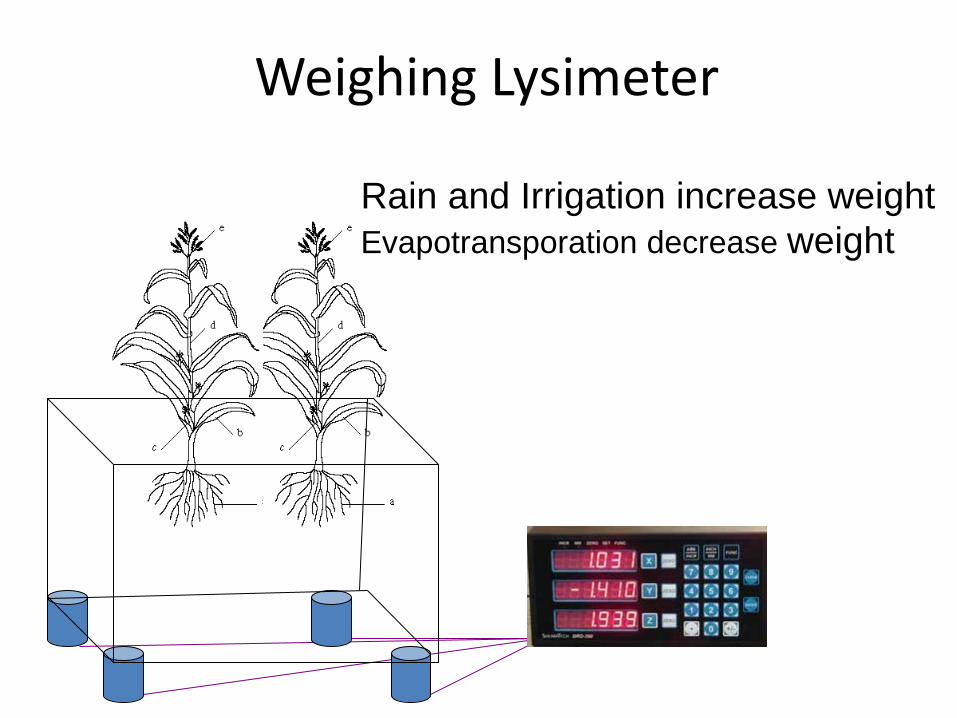
Weighing Lysimeter
Rain and Irrigation increase weight Evapotransporation decrease weight
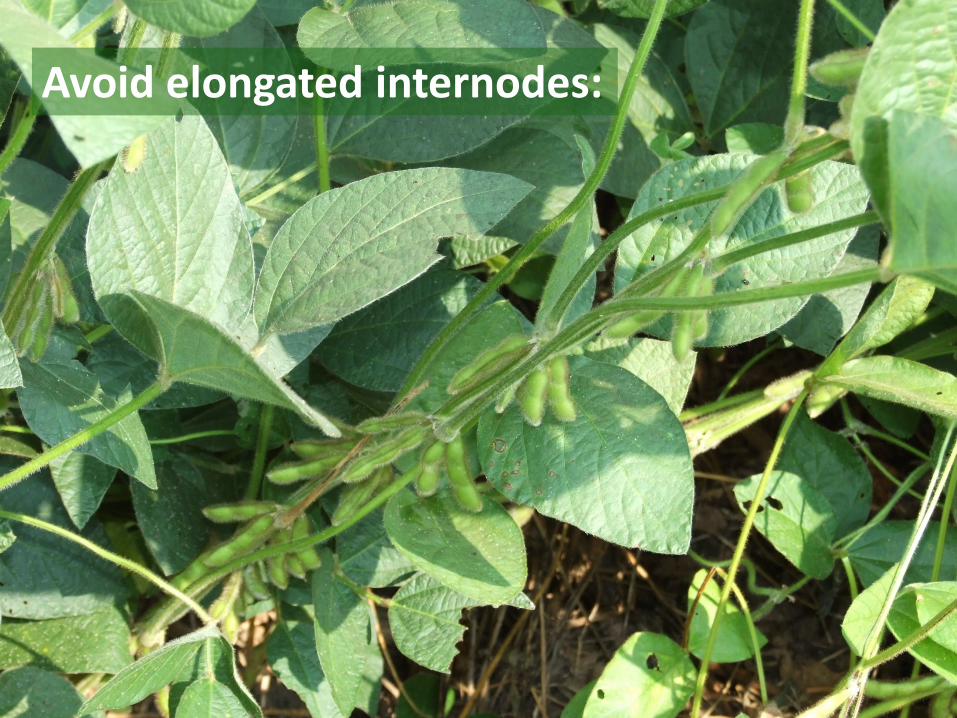
Avoid elongated internodes:
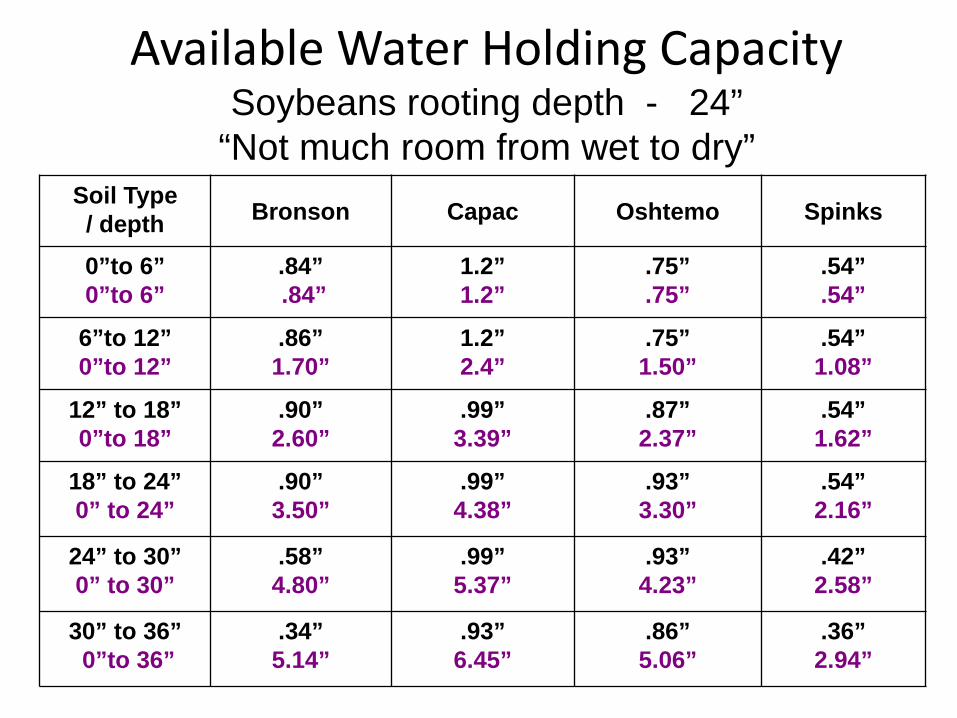
Available Water Holding Capacity Soybeans rooting depth - 24”
“Not much room from wet to dry” Soil Type
/ depth Bronson Capac Oshtemo Spinks
0”to 6” 0”to 6”
.84” .84”
1.2” 1.2”
.75”
.75” .54” .54”
6”to 12” 0”to 12”
.86” 1.70”
1.2” 2.4”
.75” 1.50”
.54” 1.08”
12” to 18” 0”to 18”
.90” 2.60”
.99” 3.39”
.87” 2.37”
.54” 1.62”
18” to 24” 0” to 24”
.90” 3.50”
.99” 4.38”
.93” 3.30”
.54” 2.16”
24” to 30” 0” to 30”
.58” 4.80”
.99” 5.37”
.93” 4.23”
.42” 2.58”
30” to 36” 0”to 36”
.34” 5.14”
.93” 6.45”
.86” 5.06”
.36” 2.94”
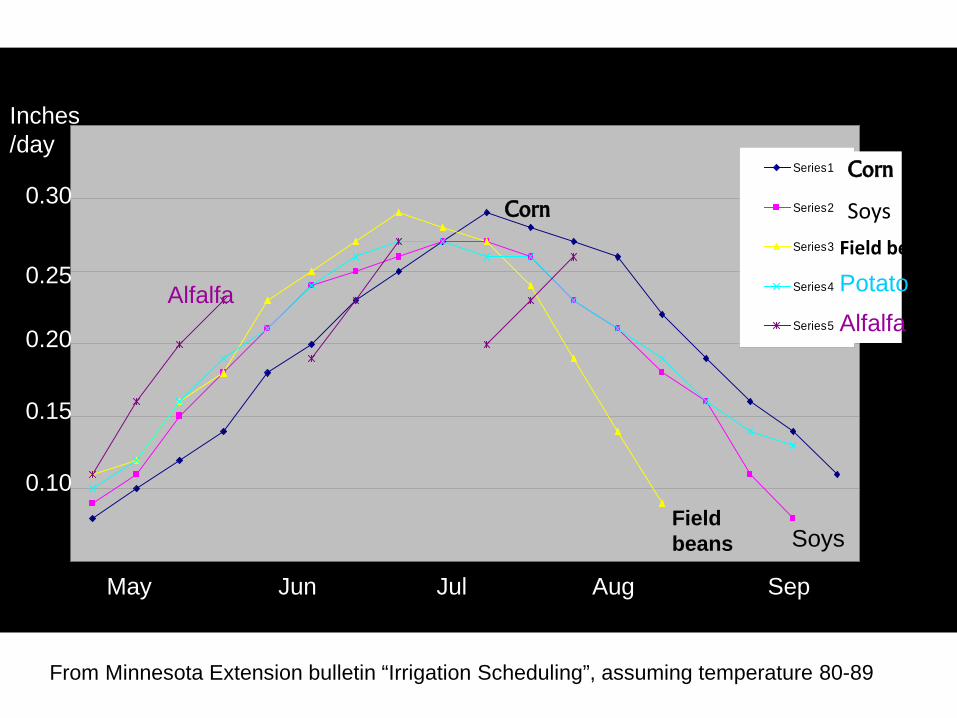
Crop Water use curve
0
0.05
0.1
0.15
0.2
0.25
0.3
1 2 3 4 5 6 7 8 9 10 11 12 13 14 15 16 17 18
Weeks after emergence
Wat
er u
se (i
nche
s)
Series1
Series2
Series3
Series4
Series5
Field beans Soys
Corn
Alfalfa
Field beans
Corn
Soys
Potato
Alfalfa
From Minnesota Extension bulletin “Irrigation Scheduling”, assuming temperature 80-89
0.30
0.25
0.20
0.10
0.15
Inches /day
May Jun Jul Aug Sep
Corn
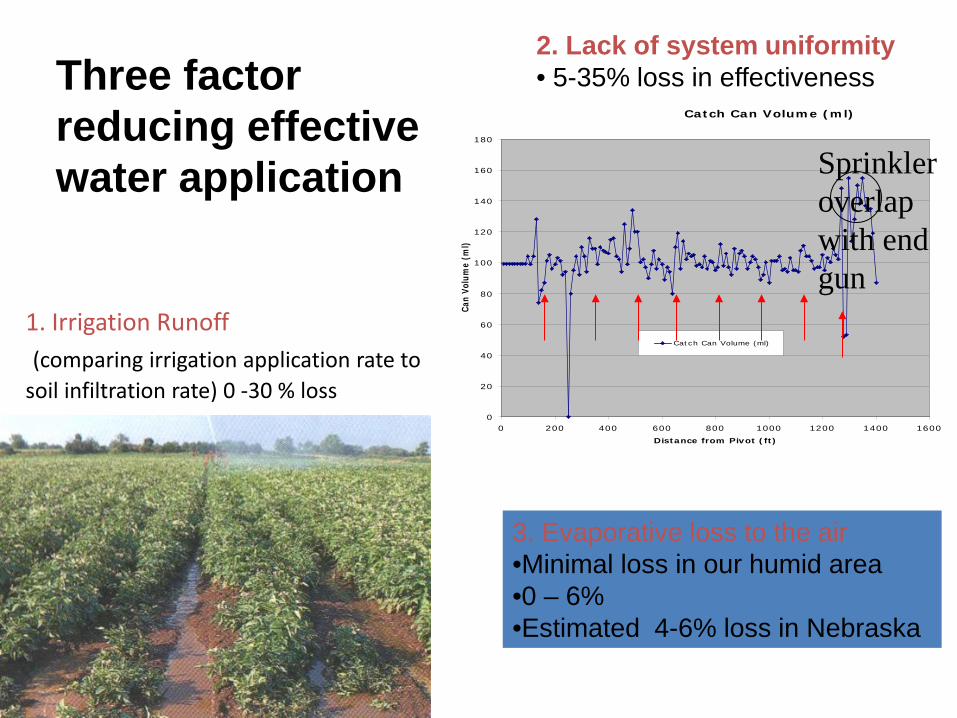
1. Irrigation Runoff (comparing irrigation application rate to soil infiltration rate) 0 -30 % loss
3. Evaporative loss to the air •Minimal loss in our humid area •0 – 6% •Estimated 4-6% loss in Nebraska
Catch Can Volume (ml)
0
20
40
60
80
100
120
140
160
180
0 200 400 600 800 1000 1200 1400 1600Distance from Pivot (ft)
Can
Volu
me
(ml)
Catch Can Volume (ml)
Sprinkler overlap with end gun
2. Lack of system uniformity • 5-35% loss in effectiveness Three factor
reducing effective water application
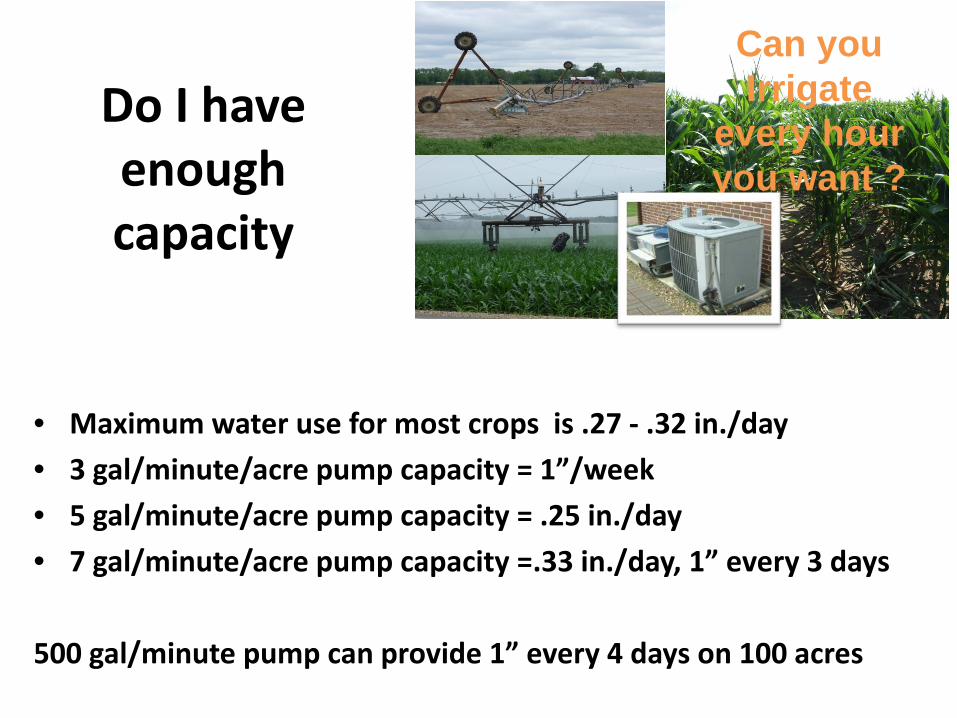
Do I have enough capacity
• Maximum water use for most crops is .27 - .32 in./day • 3 gal/minute/acre pump capacity = 1”/week • 5 gal/minute/acre pump capacity = .25 in./day • 7 gal/minute/acre pump capacity =.33 in./day, 1” every 3 days
500 gal/minute pump can provide 1” every 4 days on 100 acres
Can you Irrigate
every hour you want ?
Limited Water Supply Irrigation Management
Diversify the crops sharing the water supply between high and low water use. (? Potato and soybeans ?)
Diversify the crops sharing the water supply and peak water use times (? corn and soybeans ?)
• Start irrigating early to bank water ahead. (Soybeans lack rooting depth to make bank ahead work well) Nebraska limited water plan: • R3 • R6 • Sizing (soybean seed production concern)
Ideal Irrigation Application Volume • wet at least top half of root mass • allow room for a predictable rain fall – 1” • never wet below the root zone • large enough to minimize the number of times soil
surface and crop are wetted. (save water / reduce disease)
Typical applications: • May to mid July 0.3” to 0.5” • July 0.5” to 0.7” • August 0.7” to 1.0” • September 0.3” to 0.7”
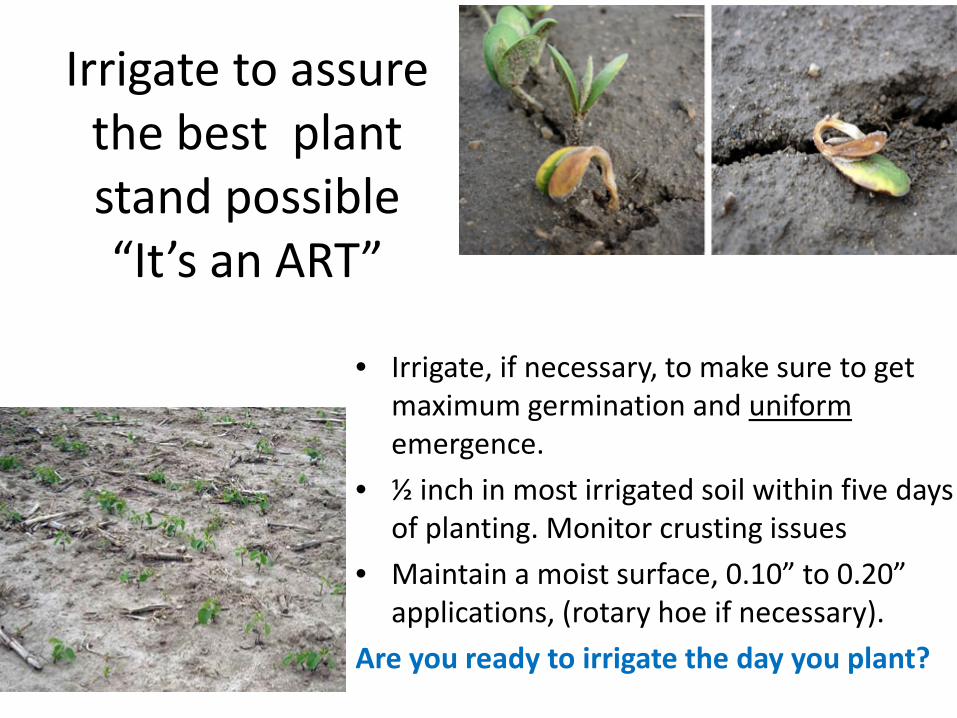
Irrigate to assure the best plant stand possible “It’s an ART”
• Irrigate, if necessary, to make sure to get maximum germination and uniform emergence.
• ½ inch in most irrigated soil within five days of planting. Monitor crusting issues
• Maintain a moist surface, 0.10” to 0.20” applications, (rotary hoe if necessary).
Are you ready to irrigate the day you plant?
Using irrigation to get the most from pesticides and nutrients
Timely application of irrigation water: • Improves incorporation of herbicides. • Improves activation of herbicides. • Humid irrigated environment slow some insects.
• Reduces nitrogen volatilization. • Maximizes yield to utilize the resources.
(Water stressed weed to get better glyphosate kill)
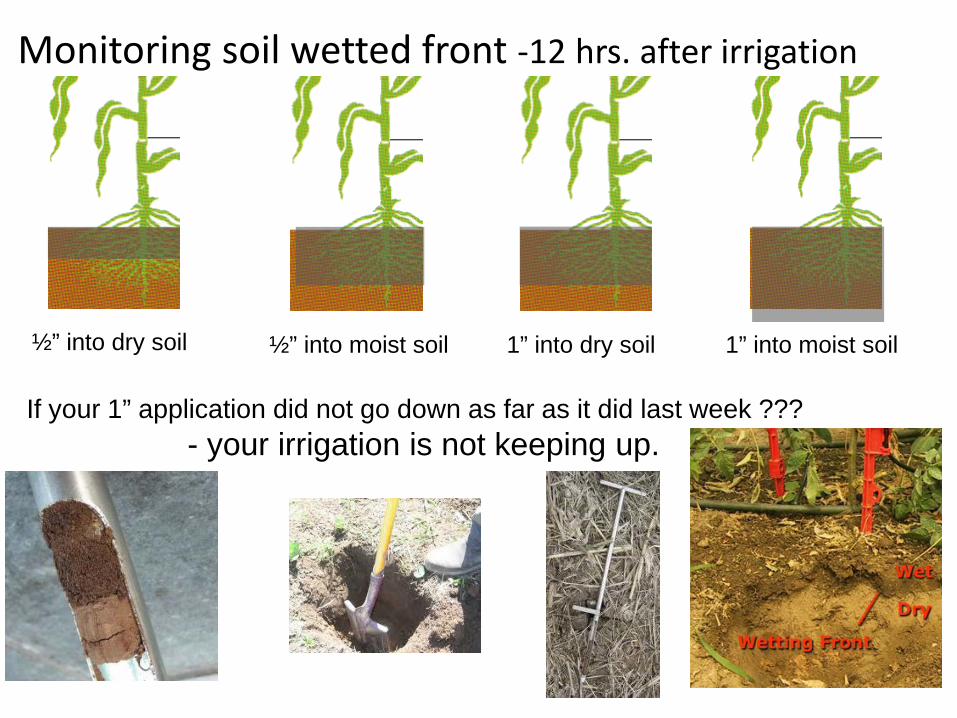
Monitoring soil wetted front -12 hrs. after irrigation
½” into dry soil ½” into moist soil 1” into dry soil 1” into moist soil
If your 1” application did not go down as far as it did last week ??? - your irrigation is not keeping up.
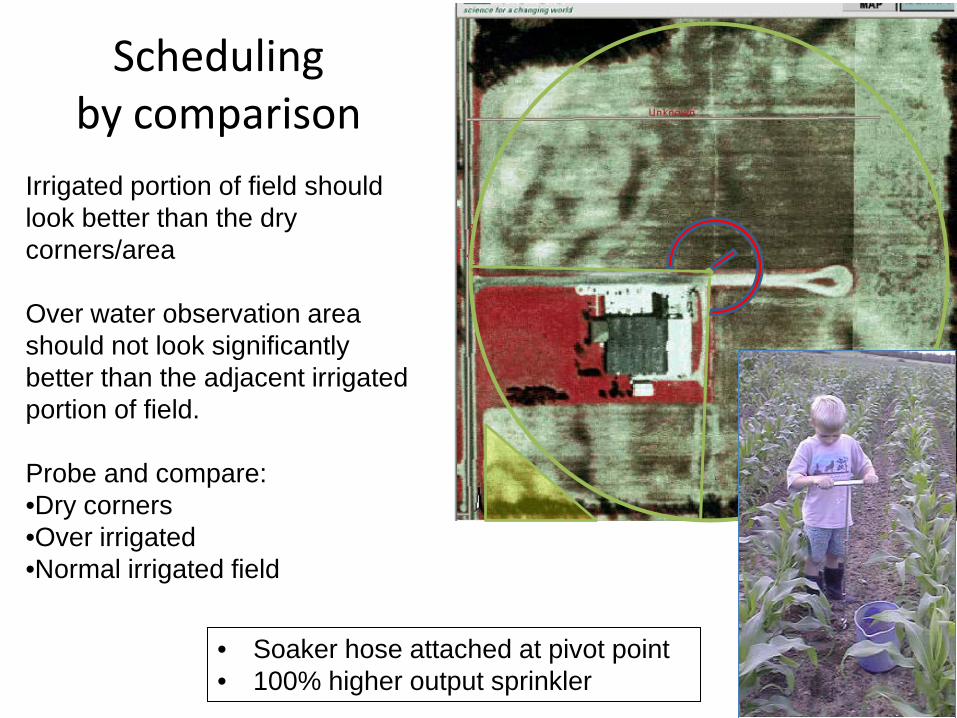
Scheduling by comparison
Irrigated portion of field should look better than the dry corners/area Over water observation area should not look significantly better than the adjacent irrigated portion of field. Probe and compare: •Dry corners •Over irrigated •Normal irrigated field
• Soaker hose attached at pivot point • 100% higher output sprinkler
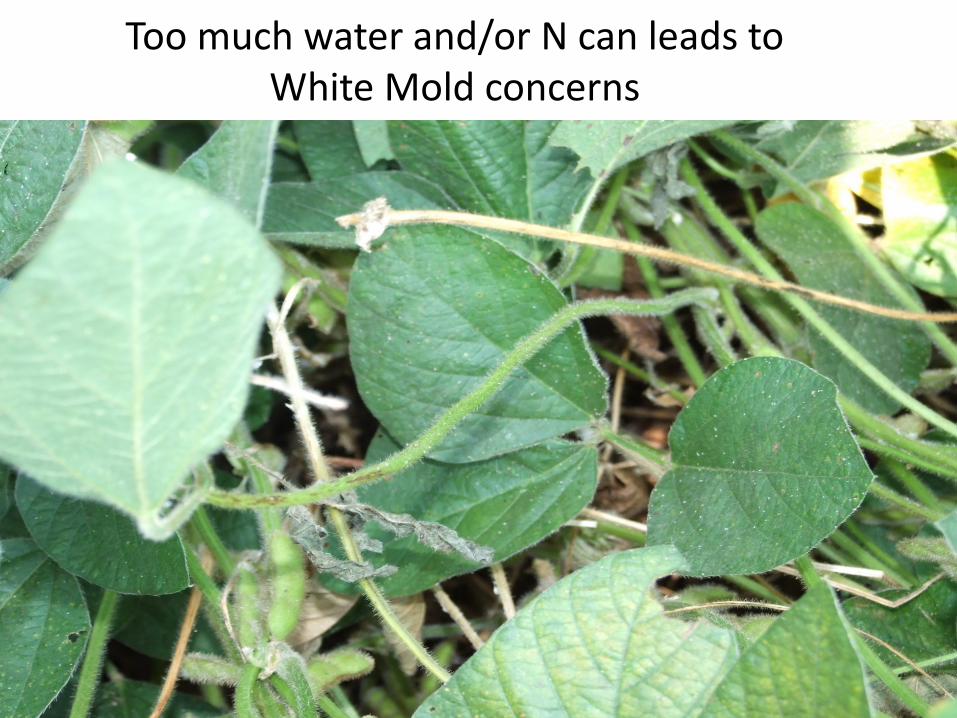
Too much water and/or N can leads to
White Mold concerns
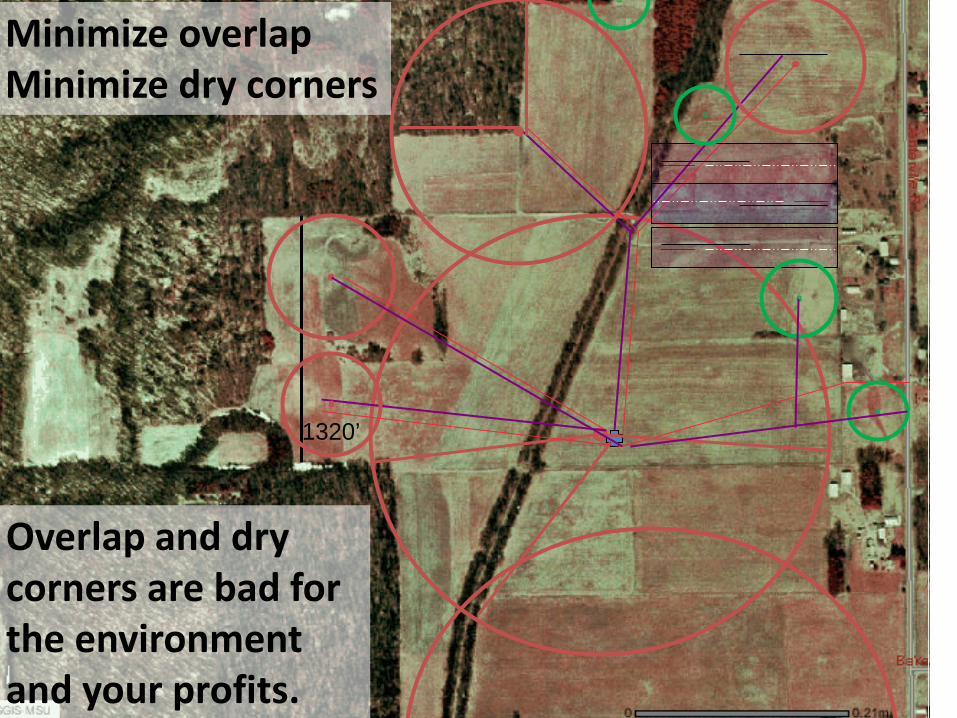
1320’
Minimize overlap Minimize dry corners
Overlap and dry corners are bad for the environment and your profits.
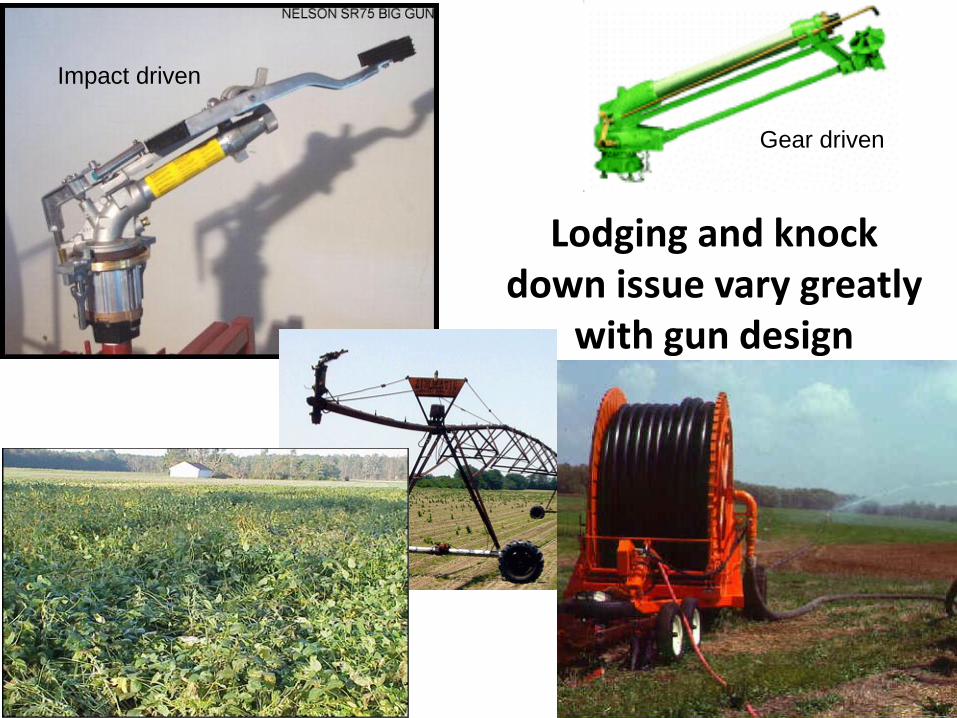
Lodging and knock down issue vary greatly
with gun design
Impact driven
Gear driven
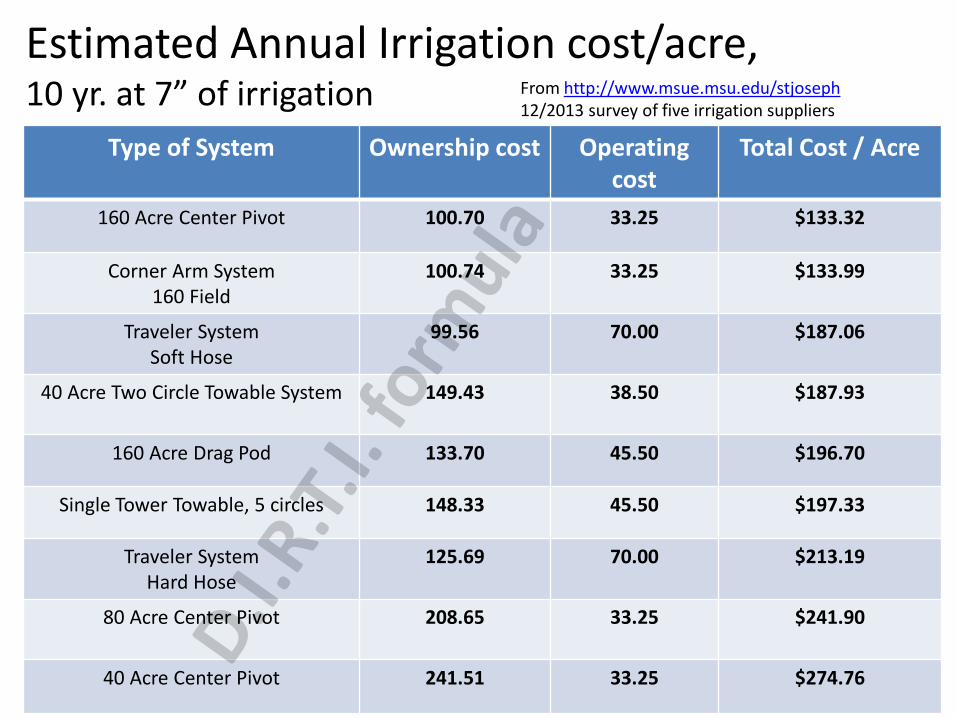
Estimated Annual Irrigation cost/acre, 10 yr. at 7” of irrigation From http://www.msue.msu.edu/stjoseph
12/2013 survey of five irrigation suppliers
Type of System Ownership cost Operating cost
Total Cost / Acre
160 Acre Center Pivot 100.70 33.25 $133.32
Corner Arm System 160 Field
100.74 33.25 $133.99
Traveler System Soft Hose
99.56 70.00 $187.06
40 Acre Two Circle Towable System 149.43 38.50 $187.93
160 Acre Drag Pod 133.70 45.50 $196.70
Single Tower Towable, 5 circles 148.33 45.50 $197.33
Traveler System Hard Hose
125.69 70.00 $213.19
80 Acre Center Pivot 208.65
33.25
$241.90
40 Acre Center Pivot 241.51 33.25 $274.76

What is your cost to Irrigate? Energy + Labor For many one bu. increase would pay for 2-3” of irrigation Indiana Average energy cost / acre” = $3.502007 Ag census
.
Extremely variable - ($1.67 to $14.70)Kelley
Cost per acre inch of irrigation water - Average fuel cost for pumping NE.
Energy source Pressure
Electric Diesel / propane
Low <35 psi $1.76 $2.56 / 2.30 Med. 35 to 95 psi $2.48 $3.76 / 3.27
High >100psi $ 3.56 $ 4.87 / 3.90 2007 census of Agriculture